Abstract
Butyrylcholinesterase (BChE) has been an important protein used for development of anti-cocaine medication. Through computational design, BChE mutants with ~2000-fold improved catalytic efficiency against cocaine have been discovered in our lab. To study drug-enzyme interaction it is important to build mathematical model to predict molecular inhibitory activity against BChE. This report presents a neural network (NN) QSAR study, compared with multi-linear regression (MLR) and molecular docking, on a set of 93 small molecules that act as inhibitors of BChE by use of the inhibitory activities (pIC50 values) of the molecules as target values. The statistical results for the linear model built from docking generated energy descriptors were: r2 = 0.67, rmsd = 0.87, q2 = 0.65 and loormsd = 0.90; The statistical results for the ligand-based MLR model were: r2 = 0.89, rmsd = 0.51, q2 = 0.85 and loormsd = 0.58; the statistical results for the ligand-based NN model were the best: r2 = 0.95, rmsd = 0.33, q2 = 0.90 and loormsd = 0.48, demonstrating that the NN is powerful in analysis of a set of complicated data. As BChE is also an established drug target to develop new treatment for Alzheimer’s disease (AD). The developped QSAR models provide tools for rationalizing identification of potential BChE inhibitors or selection of compounds for synthesis in the discovery of novel effective inhibitors of BChE in the future.
1. Introduction
Cholinesterases are classified as either acetylcholinesterase or butyrylcholinesterase (BChE) based on their substrate and inhibitor specificity. BChE appears in serum, liver, heart and CNS. Although its physiologic function is not yet completely revealed, butyrylcholinesterase plays a role in the body's ability to metabolize cocaine.1–4 Wild-type BChE has a low catalytic efficiency against naturally occurring (-)-cocaine. In our laboratory, by use of a novel, systematic computational design approach based on transition-state simulations and activation free energy calculations, BChE mutants with an ~2000-fold improved catalytic efficiency were designed and discovered, which were shown to be sufficient for use as an exogenous enzyme in rodents and primates to prevent (-)-cocaine reaching central nervous system (CNS).5−15 Studies in rats have shown that these mutants prevented rodents from convulsions and death when administered cocaine overdoses.7,12–13 One of these mutants is currently in clinical trials by Teva Pharmaceutical industries LTD for the treatment of cocaine abuse.14–15
The effect of BChE and its mutants on cocaine metabolism could possibly be reversed by some BChE inhibitor. Therefore, it is interesting to know the inhibitory activity of various small molecules that are either naturally existing in human or exogenously administered, against BChE. For the purpose, theoretical models were generated in this study using molecular docking, multi-linear regression, and neural network approaches to reduce experimental workload and financial expenditure in the future. The artificial neural network technique simulating brain function has been demonstrated to be an effective tool for data mining and used in many QSAR studies.16–25 The impressive feature of the system includes its ability to model a wide set of functions, including linear and non-linear functions, without knowing the analytic forms in advance. Therefore, neural network approach is able to outperform linear modeling approach where non-linear feature is not negligible or dominant in a dataset. Compared to the models built from the other two approaches based on the inhibitory activities of ninety-three molecules as butyrylcholinesterase (BChE) inhibitors, the developed neural network model in the study is the most predictive, showing that the dataset of inhibition values of diverse small molecules is one of these examples and the superior ability of neural network in analysis of complicated data. The generated model is expected to be used for identifying potential inhibitors of BChE that exist in vitro or in vivo in our future study. As BChE is also an important drug target to develop a new medication for Alzheimer’s disease.26–27 The developed models could also be valuable for rational design of novel BChE inhibitors in the treatment of Alzheimer's disease.
2. Results and Discussion
2.1 Selection of descriptors for building the ligand-based MLR and NN models
The experimental pIC50 values, vary from 3.30 to 8.85, for ninety-three molecules are provided in Table 1. A set of 1500 descriptors, including structural, topological, octanol-water partition coefficient, molar refractivity, and 3D whim descriptors etc., were calculated for these molecules. Pre-filtering for constant and pair-wise correlation (R>0.80) descriptors was performed and followed by a stepwise regression procedure to select variables from the remaining 238 descriptors.
Table 1.
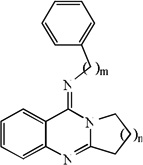
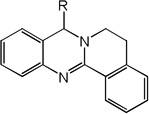
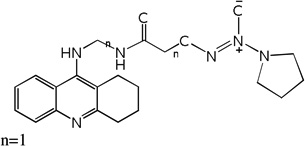
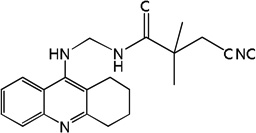
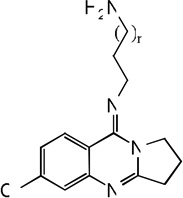
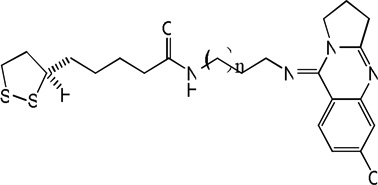
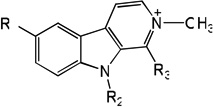
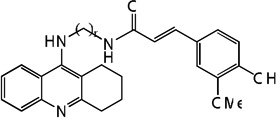
Structures, experimentally determined pIC50 values (in M) for 93 molecules, and the pIC50 values (in M) calculated by the MLR model and the NN11-2-1 model and the linear model from molecular docking, as well as their leave-one-out validation results for 93 molecules
| No. | Compound |
pIC50, M (Expt.) |
pIC50 M (Calc.) | pIC50, M (LOO) | ||||
|---|---|---|---|---|---|---|---|---|
| MLR | NN | Dock | ML | NN | Dock | |||
 |
||||||||
| 1 | n=1, m=0 | 4.71 | 5.33 | 5.04 | 5.34 | 5.37 | 5.30 | 5.36 |
| 2 | n=2, m=0 | 4.65 | 5.36 | 5.25 | 5.32 | 5.40 | 5.41 | 5.34 |
| 3 | n=3, m=0 | 5.39 | 5.41 | 5.47 | 5.31 | 5.41 | 5.50 | 5.31 |
| 4 | n=4, m=0 | 5.64 | 5.32 | 5.35 | 5.32 | 5.30 | 5.10 | 5.31 |
| 5 | n=1, m=1 | 5.73 | 5.55 | 5.60 | 5.42 | 5.54 | 5.59 | 5.41 |
| 6 | n=2, m=1 | 5.85 | 5.29 | 5.58 | 5.40 | 5.26 | 5.45 | 5.39 |
| 7 | n=3, m=1 | 5.82 | 5.73 | 6.28 | 5.33 | 5.73 | 6.42 | 5.31 |
| 8 | n=4, m=1 | 5.96 | 5.68 | 5.56 | 5.23 | 5.66 | 5.27 | 5.19 |
| 9 | n=1, m=2 | 6.21 | 6.02 | 6.23 | 5.65 | 6.01 | 6.23 | 5.64 |
| 10 | n=2, m=2 | 6.84 | 5.60 | 6.14 | 5.39 | 5.53 | 5.62 | 5.28 |
| 11 | n=3, m=2 | 5.66 | 5.66 | 6.23 | 5.59 | 5.66 | 6.43 | 5.59 |
| 12 | n=4, m=2 | 6.21 | 5.93 | 6.09 | 5.59 | 5.90 | 6.03 | 5.57 |
 |
||||||||
| 13 | R=CH3 | 5.54 | 4.93 | 5.33 | 4.96 | 4.87 | 5.15 | 4.94 |
| 14 | R=H | 5.36 | 5.06 | 5.25 | 4.93 | 5.04 | 5.20 | 4.92 |
 |
||||||||
| 15 | n=1 | 4.60 | 4.03 | 4.22 | 5.08 | 3.85 | 3.74 | 5.10 |
| 16 | n=2 | 3.30 | 4.27 | 3.82 | 5.15 | 4.46 | 4.05 | 5.21 |
| 17 | n=3 | 3.30 | 3.86 | 3.41 | 5.12 | 3.97 | 3.84 | 5.18 |
| 18 | n=4 | 3.30 | 3.76 | 3.40 | 5.12 | 3.84 | 3.44 | 5.17 |
| 19 | 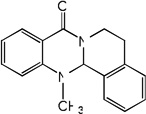 |
3.30 | 3.17 | 3.37 | 4.94 | 3.13 | 3.41 | 4.98 |
| 20 |  |
4.92 | 4.63 | 4.24 | 4.79 | 4.57 | 3.82 | 4.79 |
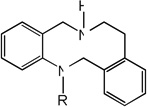 |
||||||||
| 21 | R=CH3 | 3.30 | 3.78 | 3.43 | 4.96 | 3.85 | 3.46 | 5.00 |
| 22 | R=H | 4.81 | 5.12 | 4.78 | 5.10 | 5.19 | 4.77 | 5.11 |
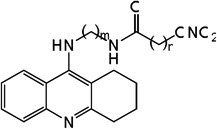 |
||||||||
| 23 | m=3, n=1 | 7.87 | 7.45 | 7.90 | 6.91 | 7.37 | 7.90 | 6.89 |
| 24 | m=3, n=2 | 7.55 | 7.89 | 7.89 | 7.45 | 7.94 | 7.92 | 7.45 |
| 25 | m=4, n=1 | 7.92 | 7.74 | 7.97 | 7.10 | 7.71 | 7.98 | 7.09 |
| 26 | m=4, n=2 | 7.82 | 7.85 | 7.95 | 7.65 | 7.86 | 7.95 | 7.64 |
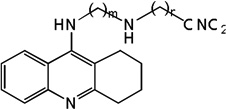 |
||||||||
| 27 | m=3, n=2 | 8.28 | 8.18 | 7.93 | 7.21 | 8.18 | 7.90 | 7.19 |
| 28 | m=3, n=3 | 8.26 | 7.68 | 7.98 | 7.75 | 7.65 | 7.96 | 7.72 |
| 29 | m=3, n=6 | 7.66 | 8.30 | 8.07 | 8.22 | 8.36 | 8.09 | 8.24 |
| 30 | m=4, n=2 | 7.86 | 7.76 | 8.02 | 7.68 | 7.75 | 8.02 | 7.67 |
| 31 | m=4, n=3 | 8.00 | 7.97 | 8.04 | 7.80 | 7.97 | 8.05 | 7.79 |
| 32 | m=4, n=6 | 7.97 | 8.32 | 8.08 | 8.77 | 8.34 | 8.09 | 8.82 |
 |
||||||||
| 33 | m=3, n=1 | 7.82 | 7.59 | 7.69 | 7.53 | 7.57 | 7.68 | 7.52 |
| 34 | m=4, n=1 | 7.39 | 7.94 | 7.92 | 7.70 | 7.97 | 7.95 | 7.71 |
 |
||||||||
| 35 | m=3 | 8.26 | 8.23 | 8.05 | 7.49 | 8.23 | 8.04 | 7.43 |
| 36 | m=4 | 8.14 | 8.14 | 8.06 | 7.72 | 8.14 | 8.06 | 7.70 |
| 37 | 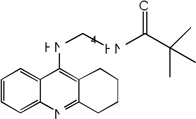 |
7.44 | 7.92 | 8.05 | 7.23 | 7.94 | 8.08 | 7.22 |
| 38 |  |
8.29 | 7.48 | 7.76 | 5.49 | 7.28 | 7.43 | 5.40 |
| 39 | 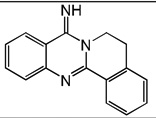 |
5.70 | 5.08 | 5.69 | 5.37 | 5.04 | 5.70 | 5.35 |
| 41 |  |
5.52 | 4.99 | 5.47 | 5.24 | 4.95 | 5.39 | 5.23 |
 |
||||||||
| 40 | R1=H, R2=H | 5.14 | 5.31 | 5.02 | 5.45 | 5.33 | 5.18 | 5.48 |
| 42 | R1=H, R2=COCH3 | 3.69 | 3.93 | 3.69 | 5.31 | 3.99 | 3.75 | 5.40 |
| 43 | R1=Cl, R2=C4H9 | 5.64 | 5.85 | 5.20 | 6.02 | 5.88 | 5.07 | 6.03 |
| 44 | R1=H, R2=C4H9 | 5.26 | 5.72 | 5.53 | 6.05 | 5.76 | 5.73 | 6.07 |
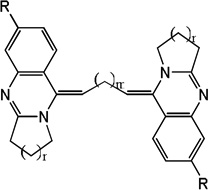 |
||||||||
| 45 | R=Cl, n=1, m=7 | 7.22 | 6.93 | 7.15 | 7.38 | 6.87 | 7.03 | 7.38 |
| 46 | R=H, n=1, m=7 | 7.06 | 7.27 | 7.80 | 7.20 | 7.31 | 7.85 | 7.21 |
| 47 | R=H, n=2, m=7 | 8.07 | 7.63 | 7.77 | 7.34 | 7.58 | 7.75 | 7.33 |
| 48 | R=H, n=3, m=7 | 7.62 | 7.60 | 7.64 | 7.24 | 7.60 | 7.65 | 7.23 |
| 49 | R=H, n=4, m=7 | 7.57 | 8.43 | 8.07 | 7.09 | 8.68 | 8.06 | 7.07 |
| 50 | R=Cl, n=1, m=8 | 7.34 | 7.59 | 7.35 | 7.58 | 7.63 | 7.33 | 7.58 |
| 51 | R=H, n=1, m=8 | 8.32 | 7.76 | 7.91 | 7.38 | 7.66 | 7.88 | 7.34 |
| 52 | R=H, n=2, m=8 | 8.12 | 7.76 | 7.84 | 7.27 | 7.71 | 7.79 | 7.23 |
| 53 | R=H, n=3, m=8 | 7.89 | 7.65 | 7.66 | 7.50 | 7.62 | 7.56 | 7.49 |
| 54 | R=H, n=4, m=8 | 7.12 | 8.03 | 7.70 | 7.34 | 8.14 | 7.80 | 7.35 |
| 55 | 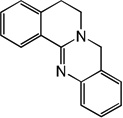 |
5.36 | 5.23 | 5.50 | 4.85 | 5.22 | 5.57 | 4.83 |
| 56 | 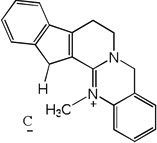 |
6.30 | 5.83 | 6.17 | 5.03 | 5.78 | 6.12 | 5.00 |
| 57 | 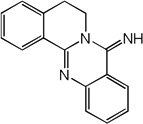 |
5.70 | 5.11 | 5.77 | 5.37 | 5.07 | 5.80 | 5.35 |
| 58 | 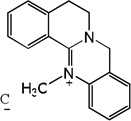 |
3.80 | 4.78 | 4.52 | 4.69 | 5.00 | 5.52 | 4.74 |
| 59 | 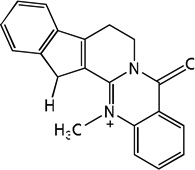 |
5.08 | 4.78 | 5.18 | 4.75 | 4.74 | 5.33 | 4.73 |
| 60 | 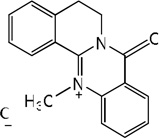 |
3.30 | 4.55 | 3.64 | 4.71 | 4.84 | 3.75 | 4.78 |
| 61 |
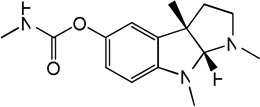 Physostigmine Physostigmine |
5.93 | 5.23 | 5.84 | 5.83 | 5.05 | 5.39 | 5.83 |
 |
||||||||
| 62 | n=1 | 4.99 | 6.71 | 5.53 | 6.15 | 6.89 | 5.72 | 6.17 |
| 63 | n=2 | 6.14 | 6.66 | 5.89 | 6.42 | 6.70 | 5.84 | 6.42 |
| 64 | n=3 | 6.72 | 6.59 | 6.25 | 6.69 | 6.58 | 6.13 | 6.69 |
| 65 | n=4 | 6.42 | 6.70 | 6.59 | 6.70 | 6.72 | 6.63 | 6.70 |
| 66 | n=5 | 6.15 | 6.75 | 6.96 | 7.20 | 6.80 | 7.18 | 7.22 |
| 67 | n=6 | 7.92 | 6.91 | 7.30 | 7.34 | 6.82 | 7.06 | 7.32 |
| 68 | 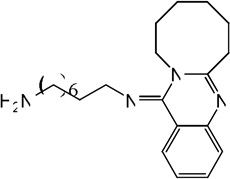 |
7.34 | 6.94 | 7.50 | 7.72 | 6.84 | 7.64 | 7.73 |
 |
||||||||
| 69 | n=1 | 5.59 | 5.92 | 5.61 | 7.51 | 6.06 | 5.82 | 7.56 |
| 70 | n=2 | 6.77 | 7.19 | 7.01 | 7.73 | 7.27 | 7.35 | 7.76 |
| 71 | n=3 | 7.28 | 7.26 | 7.21 | 8.19 | 7.26 | 7.18 | 8.22 |
| 72 | n=4 | 7.59 | 7.26 | 7.59 | 8.40 | 7.21 | 7.66 | 8.44 |
| 73 | n=5 | 7.85 | 7.48 | 7.80 | 8.57 | 7.43 | 7.79 | 8.61 |
| 74 | n=6 | 8.24 | 7.97 | 7.83 | 8.99 | 7.93 | 7.78 | 9.04 |
| 75 | 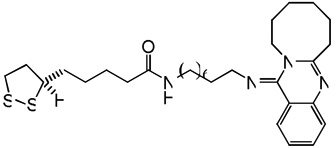 |
7.64 | 7.62 | 7.94 | 8.94 | 7.61 | 7.97 | 9.03 |
| 76 | 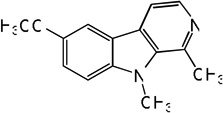 |
4.76 | 5.01 | 4.79 | 5.15 | 5.10 | 5.57 | 5.16 |
 |
||||||||
| 77 | R1=OCH3, R2=H, R3=H | 4.76 | 4.46 | 4.70 | 5.15 | 4.39 | 4.72 | 5.16 |
| 78 | R1=OCH3, R2=CH3, R3=H | 4.68 | 4.28 | 4.56 | 5.02 | 4.18 | 4.48 | 5.04 |
| 79 | R1=OCH3, R2=H, R3=CH3 | 5.92 | 5.56 | 5.31 | 5.13 | 5.49 | 5.13 | 5.11 |
| 80 | R1=OH, R2=H, R3=H | 5.06 | 5.38 | 5.08 | 5.17 | 5.49 | 5.10 | 5.17 |
| 81 | R1=OH, R2=CH3, R3=H | 4.49 | 4.69 | 4.85 | 5.10 | 4.72 | 4.94 | 5.12 |
| 82 | R1=OH, R2=H, R3=CH3 | 5.80 | 6.14 | 5.90 | 5.06 | 6.21 | 6.08 | 5.03 |
| 83 | R1=OH, R2=CH3, R3=CH3 | 5.57 | 5.58 | 5.60 | 5.16 | 5.58 | 5.50 | 5.15 |
 |
||||||||
| 84 | n=2 | 7.91 | 7.86 | 8.03 | 6.26 | 7.85 | 8.04 | 6.23 |
| 85 | n=3 | 8.26 | 7.15 | 7.84 | 6.44 | 6.96 | 7.77 | 6.42 |
| 86 | n=4 | 8.15 | 8.37 | 8.07 | 6.89 | 8.39 | 8.06 | 6.87 |
| 87 | n=5 | 8.30 | 8.50 | 8.07 | 7.10 | 8.52 | 8.06 | 7.08 |
| 88 | n=8 | 8.85 | 8.66 | 8.07 | 7.91 | 8.65 | 8.02 | 7.88 |
 |
||||||||
| 89 | n=2 | 7.47 | 7.69 | 7.86 | 7.30 | 7.72 | 7.90 | 7.30 |
| 90 | n=3 | 7.57 | 8.04 | 7.50 | 7.71 | 8.15 | 7.45 | 7.71 |
| 91 | n=4 | 8.23 | 7.90 | 8.05 | 7.73 | 7.87 | 8.04 | 7.71 |
| 92 | n=5 | 8.17 | 7.63 | 7.94 | 8.25 | 7.54 | 7.92 | 8.26 |
| 93 | n=8 | 7.90 | 8.35 | 8.00 | 8.36 | 8.40 | 8.04 | 8.38 |
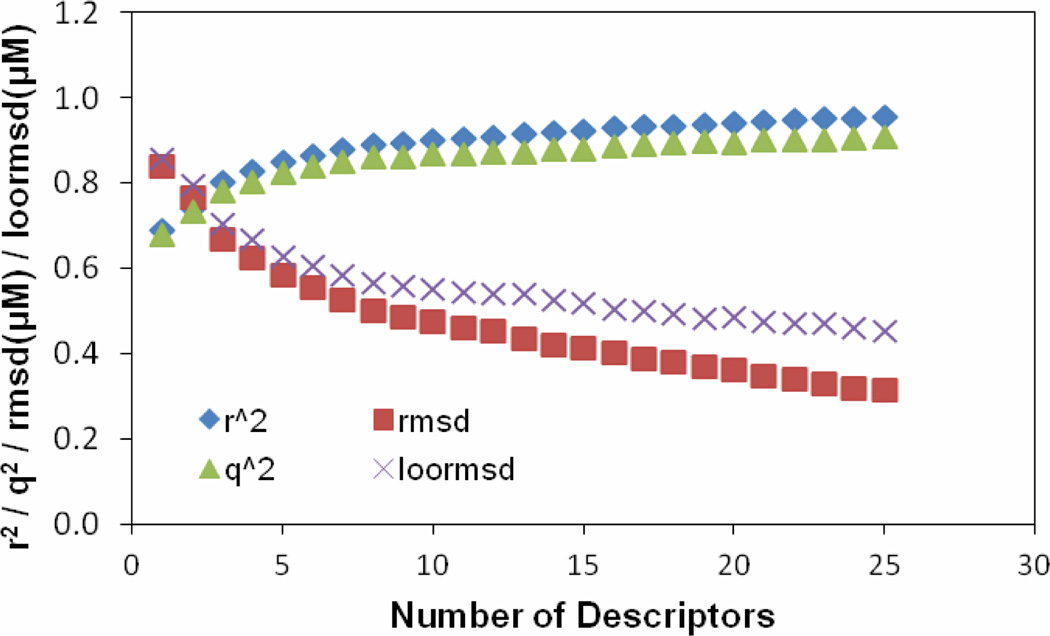
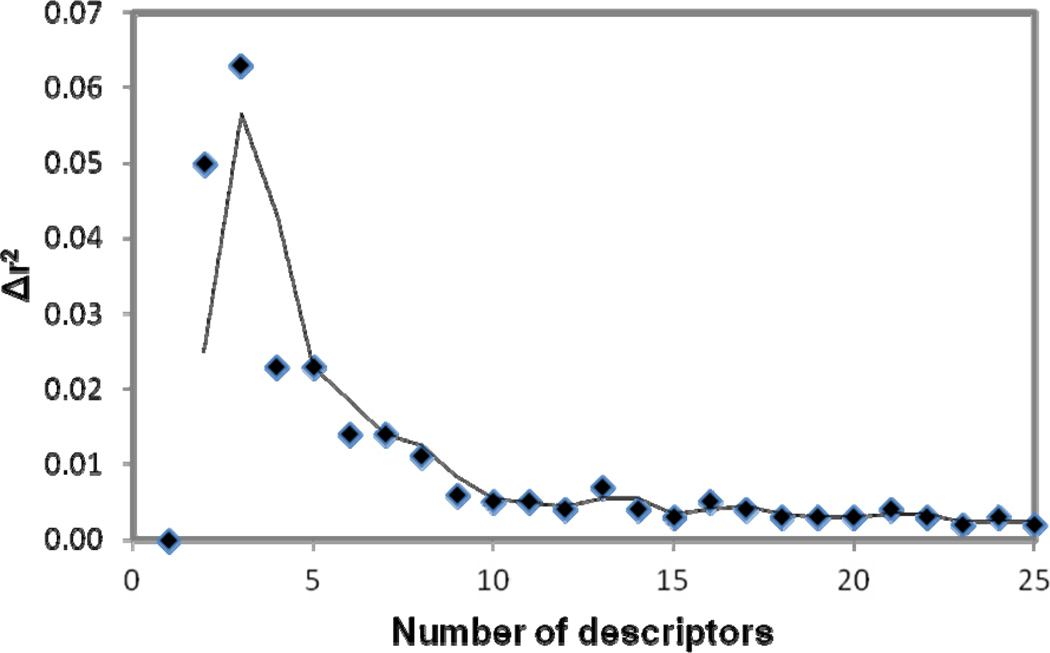
To select a set of most related descriptors, the forward-selection and backward-elimination stepwise regression procedure was used to select descriptors from the reduced set of 238 descriptors. Our tests revealed that although the linear models can be generated by utilizing initially different descriptors, the number of descriptors used to build the same quality MLR models does not change significantly. Thus for the model described, the descriptor selection was first initiated from a descriptor which is most correlated to the target values to start a MLR model. More descriptors are selected to get better training r2 and validation q2. Single descriptors were gradually added to build a MLR model by monitoring the relationship of the number of descriptors involved in a generated model vs the value of the correlation coefficient r2 corresponding to the model. Twenty-five descriptors were chosen to be used to further build neural network model. Figure 1 shows the plots of training r2, training root mean square derivation rmsd, predictive q2 and leave-one-out root mean square derivation loormsd vs the number of descriptors used in a MLR model. As seen from Figure 1, while r2 and q2 gradually increase, the variations of the other two quantities gradually decrease as increasing the number of descriptors in the MLR model. Figure 2 shows the relationship of the number of descriptors involved in a generated model versus the difference (Δr2) between the values of the correlation coefficients r2 corresponding to the two consecutive models in Figure 1. Clearly, the value of Δr2 is small and does not change much after the number of the descriptors in the generated model is more than ten. A MLR model with more than ten descriptors in this case most likely was over-trained. The statistical results for the MLR model built from the 1st 10 of the 25 descriptors were: r2 = 0.90, rmsd = 0.51, q2 = 0.86 and loormsd = 0.58.
Figure 1.
The training r2, training root mean square derivation rmsd, predictive q2 and leave-one-out root mean square derivation loormsd vs. the number of descriptors selected through building MLR model.
Figure 2.
Relationship of the difference (Δr2) between the values of the correlation coefficients r2 corresponding to the two consecutive models in Figure 1 vs. the number of descriptors involved in a generated model versus .
2.2 Neural network analysis
The artificial neural network technique is a complex and sophisticated tool for data mining, which has been used for extracting potentially useful information or knowledge from various data sets in experimental sciences. The extracted knowledge is exhibited in a readable form and then can be used to solve diagnosis, classification or forecasting problems. In cheminformatics, it has been used in QSAR studies, to predict the activities of compounds from their structures and properties.16–25 As an advanced data mining tool, neural network approach is particularly suitable for the cases where other techniques may not produce satisfactory predictive models.
To the best of our knowledge for the previously published literatures about QSAR model development using BChE inhibitory activities as target values, the largest dataset of BChE inhibition values employed for QSAR model generation includes only sixty-one molecules.45–51 This is because BChE has a large active site gorge (~200 Å3) and its inhibitors possess diversity of size/structures, which results in the difficulty to build a reasonable QSAR model with satisfied quality. With the previous twenty-five descriptors selected by the stepwise regression procedure for building the MLR model, in this study the back propagation neural network model with architecture NN10-h-1 (h=1 to 3) was trained and leave-one/n-out validated, in which 10 is the number of input neurons corresponding to the ten descriptors, and h represents the number of hidden neurons. The neural network models have one output neuron corresponding to the pIC50 value. During the training process, the neural network architecture was first fixed to a configuration (e.g. NN10-2-1). The first ten descriptors in Figure 1 were fed into the network. Then each of the ten descriptors was removed from the model to identify the one having the least importance. The identified descriptor was replaced by the eleventh to twenty-fifth descriptor in Figure 1 one by one. The descriptor that led to the least training rmsd and loormsd to the NN10-h-1 was kept. The procedure was recursive until the training rmsd could not be improved anymore.
The final ten descriptors selected from the twenty-five descriptors are listed in Table 2. Brief definitions of the descriptors used in the neural network model are provided in Table 2, where RDF010m is among the RDF descriptors, C-028 is among the atom-centred fragments; Mor30u and Mor15u are among the 3D MoRSE descriptors; HATS5m and R4v+ are among the GETAWAY descriptors; GATS6e and MATS1p are among the 2D autocorrelations descriptors; E2s is topological descriptors. More detailed explanation about these descriptors can be found in Refs. 28–30. The Pearson correlation coefficient R between the ten descriptors is listed in Table 3. All the non-diagonal elements were less than 0.70, indicating that the co-linear situation between different descriptors and redundant information included in the set of descriptors are low.
Table 2.
Brief definitions of the ten descriptors selected for neural network modeling
| No. | Descriptor | Definition |
|---|---|---|
| 1 | RDF010m | Radial Distribution Function-1.0 / weighted by atomic masses. |
| 2 | C-028 | R—CR—X. |
| 3 | Mor30u | 3D–MoRSE-signal 30 / unweighted. |
| 4 | HATS5m | Leverage-weighted autocorrelation of lag 5 / weighted by atomic masses. |
| 5 | GATS6e | Geary autocorrelation – lag 6 / weighted by atomic Sanderson electronegativities. |
| 6 | MATS1p | Moran autocorrelation – lag 1 / weighted by atomic polarizabilities. |
| 7 | E2s | 2nd component accessibility directional WHIM index / weighted by atomic electrotopological states. |
| 8 | Mor15u | 3D–MoRSE – signal 15 / unweighted. |
| 9 | R4v+ | R maximal autocorrelation of lag 4 / weighted by atomic van der Waals volumes. |
| 10 | IC1 | Information content index (neighborhood symmetry of 1-order). |
Table 3.
Pearson correlation coefficient R between the descriptors used in the NN model
| No. | 1 | 2 | 3 | 4 | 5 | 6 | 7 | 8 | 9 | 10 |
|---|---|---|---|---|---|---|---|---|---|---|
| 1 | 1.00 | 0.67 | 0.65 | −0.24 | −0.01 | 0.43 | 0.11 | −0.62 | −0.60 | 0.13 |
| 2 | 1.00 | 0.51 | 0.03 | −0.25 | 0.30 | 0.07 | −0.42 | −0.42 | 0.18 | |
| 3 | 1.00 | −0.22 | −0.15 | 0.15 | 0.17 | −0.23 | −0.62 | 0.25 | ||
| 4 | 1.00 | −0.14 | 0.02 | 0.16 | 0.16 | 0.51 | 0.21 | |||
| 5 | 1.00 | −0.18 | 0.12 | −0.27 | −0.03 | −0.34 | ||||
| 6 | 1.00 | 0.12 | −0.19 | −0.25 | 0.42 | |||||
| 7 | 1.00 | −0.26 | −0.17 | 0.12 | ||||||
| 8 | 1.00 | 0.32 | 0.37 | |||||||
| 9 | 1.00 | −0.18 | ||||||||
| 10 | 1.00 |
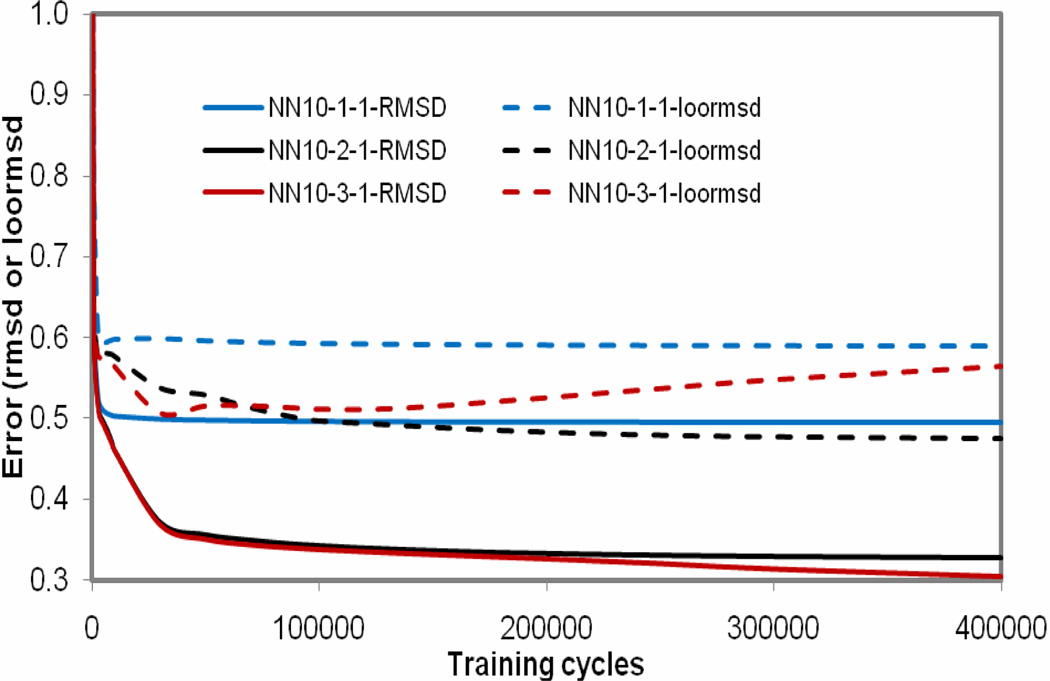
The selected 10 descriptors were used as inputs to train NN10-h-1 models. Figure 3 shows the training and leave-one-out errors (rmsd and loormsd) as functions of the number of training cycles for the NN10-1-1, NN10-2-1 and NN10-3-1 models. As shown in Figure 3, The training errors and loormsd are lower for the neural network configuration with more hidden nodes such as NN10-3-1 and NN10-2-1 compared with the results from NN10-1-1. For model NN10-2-1, the training and validation errors almost kept to be a constant after the training cycles were over 150000, while the training errors decreased and validation errors increased after the training cycles over 30000 for model NN10-3-1. To avoid overtraining the model, the model NN10-2-1 was regarded as the best.
Figure 3.
The training and leave-one-out errors (rmsd and loormsd) as functions of the number of training cycles of the NN10-1-1, NN10-2-1 and NN10-3-1 models
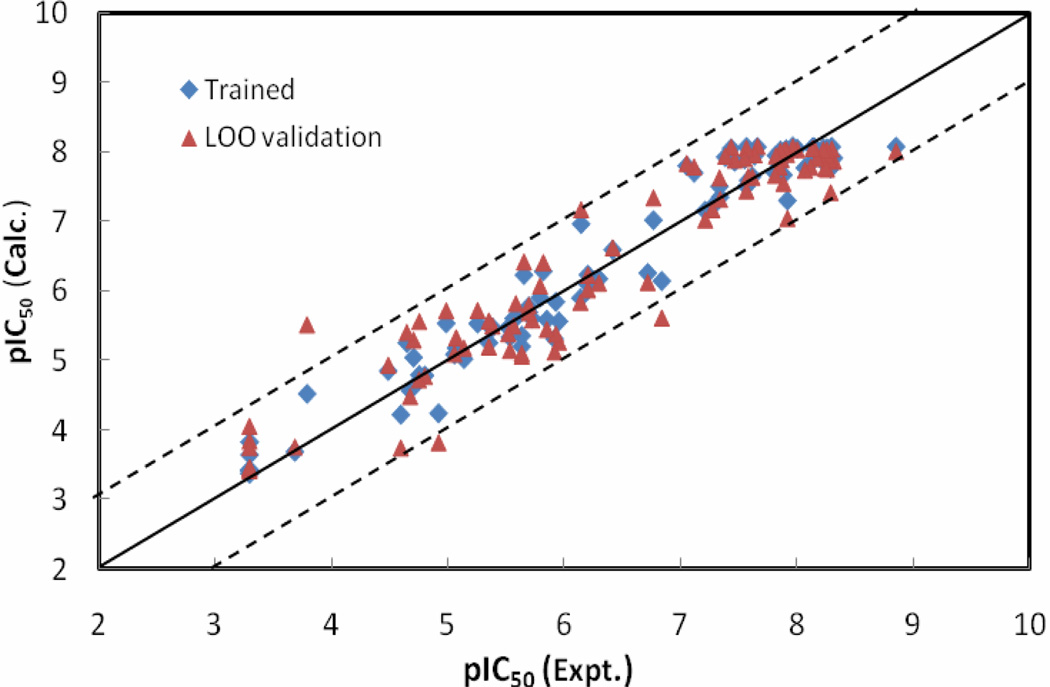
The statistical results for the NN10-2-1 model with errors converged versus training cycles are as follows: r2 = 0.95, rmsd = 0.33, q2 = 0.90 and loormsd = 0.48. pIC50 values calculated by the NN10-2-1 model, as well as its leave-one-out validation results for the ninety-among the WHIM descriptors; IC1 is among the three BChE inhibitors, are listed in Table 1. Figure 4 shows the relationships of the trained and LOO-predicted pIC50 values versus the experimental pIC50 values for the NN10-2-1 model.
Figure 4.
The calculated versus experimental activity data for the trained (shown in diamonds), leave-one-out cross-validation (shown in triangles) for the best NN10-2-1 QSAR model. The solid line represents a perfect correlation.
2.3 Evaluation of the generated neural network model by leave-n-out validation
Leave-n-out cross-validation was also performed for the NN10-2-1 model to test its ability of prediction on external compound set. For the ninety-three BChE inhibitors studied, the 93 observed pIC50 values were ranked in ascending order. Three subsets were constructed by collecting the 1st, 4th, 7th, etc., data points into the first subset; the 2nd, 5th, 8th, etc., data points into the second subset; and the 3rd, 6th, 9th, etc., data points into the third subset. Three training sets were prepared as combinations of any two subsets. The remaining subset was used as a test set. Thus, every time 62 molecules (67%) out of the 93 data set of molecules were used to train the model, a subset of 31 molecules (33%) out of the 93 molecules was used to test the model. For each training set, a neural network with architecture NN10-2-1 was trained with the same ten descriptors listed in Table 2. Three neural networks (10-2-1 architecture) with ten descriptors (listed in Table 2) as inputs were trained based on each of the three newly generated training sets, and the prediction was made for their corresponding test set. The quality of the QSAR models was demonstrated by the statistical results listed in Table 4. The same approach was applied to the model validation by leaving-18/19-out of the 93 data set. In the case, five subsets were constructed accordingly. Five training sets were prepared as combinations of any four subsets. The remaining subset was used as a test set. Thus, every time 74 or 75 molecules (~80%) out of the 93 data set of molecules were used to train the model, a subset of 18/19 molecules (~20%) out of the 93 molecules was used to test the model. The statistical results for the leave-18/19-out validation were listed in Table 4. The average results from the two times of leave-n-out validation (i.e. correlation coefficients of the training r2 and root-mean square derivation rmsd, leave-n-out predictive r2test and root-mean square derivation testrmsd) are 0.95, 0.33, 0.89 and 0.50, respectively, which is very close to the statistical results (0.95, 0.33, 0.90, and 0.48, respectively) obtained from training and LOO validation of the NN10-2-1 model. These results indicate that the predictive power of the neural network model is stable within the experimental data set.
Table 4.
Leave-n-out cross-validation of the NN10-2-1 model with training cycles 150000
| Set | r2 | Rmsd | r2test | testrmsd |
|---|---|---|---|---|
| 1(62,31) | 0.950 | 0.342 | 0.909 | 0.460 |
| 2(62,31) | 0.954 | 0.324 | 0.926 | 0.423 |
| 3(62,31) | 0.955 | 0.323 | 0.817 | 0.662 |
| Average | 0.953 | 0.330 | 0.883 | 0.515 |
| 1(74,19) | 0.956 | 0.317 | 0.900 | 0.500 |
| 2(74,19) | 0.950 | 0.337 | 0.945 | 0.370 |
| 3(74,19) | 0.944 | 0.355 | 0.953 | 0.344 |
| 4(75,18) | 0.961 | 0.301 | 0.793 | 0.679 |
| 5(75,18) | 0.955 | 0.325 | 0.901 | 0.511 |
| Average | 0.953 | 0.327 | 0.898 | 0.481 |
| Total Avg. | 0.953 | 0.329 | 0.891 | 0.498 |
As noted in Table 4, entry 3 in leave-31-out and entry 4 in leave-18/19-out validation have better training r2 (0.96/0.96) with a smaller root-mean square derivation (0.32/0.30) but worse r2test (0.82/0.79) with a larger root-mean square derivation (0.66/0.68) comparing to the others. Concerning the reason, data analysis reveals that some molecules with exceptional large training and LOO validation errors in Figure 4 (the points out of the dash line boundaries) are allocated to the test set of entry 3 or 4. The similar phenomenon was also observed for the leave-n-out validation of the MLR model by use of the same ten descriptors as shown in Table 6.
Table 6.
Leave-n-out cross-validation of the MLR model built from the 10 descriptors used in NN10-2-1 model
| Set | r2 | rmsd | r2test | testrmsd |
|---|---|---|---|---|
| 1(62,31) | 0.894 | 0.496 | 0.848 | 0.595 |
| 2(62,31) | 0.911 | 0.454 | 0.800 | 0.681 |
| 3(62,31) | 0.891 | 0.500 | 0.868 | 0.583 |
| Average | 0.898 | 0.483 | 0.839 | 0.620 |
| 1(74,19) | 0.902 | 0.472 | 0.826 | 0.678 |
| 2(74,19) | 0.888 | 0.506 | 0.893 | 0.547 |
| 3(74,19) | 0.897 | 0.483 | 0.847 | 0.630 |
| 4(75,18) | 0.901 | 0.484 | 0.829 | 0.647 |
| 5(75,18) | 0.878 | 0.537 | 0.928 | 0.392 |
| Average | 0.893 | 0.496 | 0.865 | 0.579 |
| Total Avg. | 0.896 | 0.490 | 0.852 | 0.599 |
2.4 Comparison of NN10-2-1 model with MLR model generated from the same ten descriptors
The MLR model using the ten descriptors listed in Table 2 was built using the multiple linear regression analysis. The generated MLR model is described by Equation 1:
| (1) |
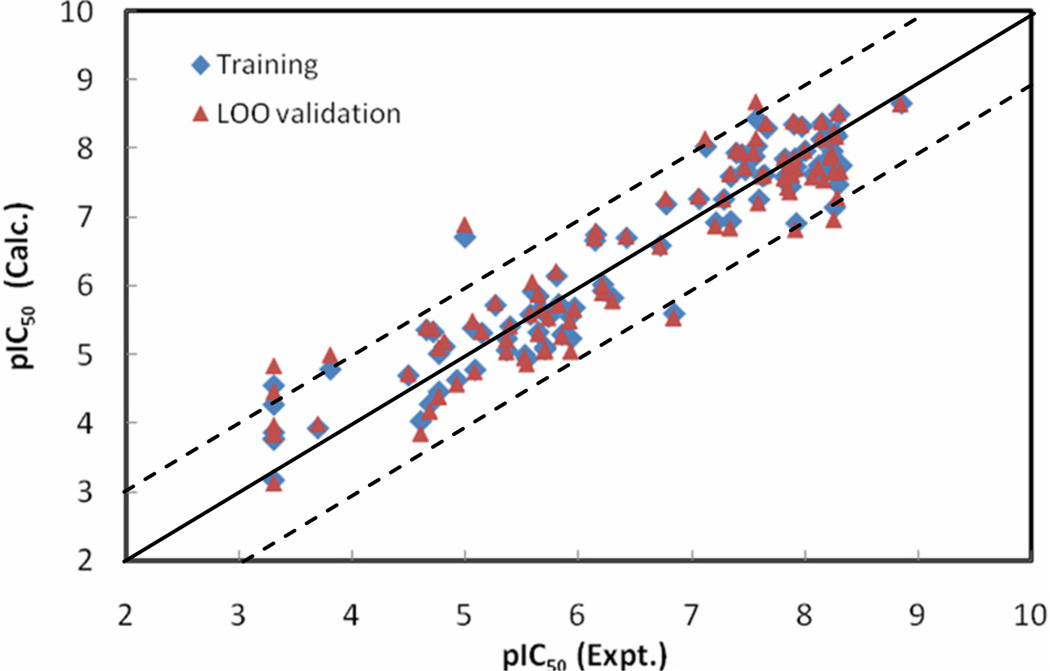
The statistical analysis for the MLR model indicated that the correlation coefficient r2 and rmsd between the observed and the fitted pIC50 values was 0.89 and 0.51, respectively (Table 5); the leave-one-out validation q2 was 0.85, and the loormsd was 0.58 (Table 5); the Fischer statistic F was 65.59. Figure 5 shows the relationships of the trained and LOO-predicted pIC50 values versus the experimental pIC50 values for the MLR model. The calculated pIC50 values for the ninety-three molecules from the MLR model (Equation 1), as well as the LOO validation results, are provided in Table 1. Comparing the statistical results (r2, rmsd, q2 and loormsd are 0.89, 0.51, 0.85 and 0.58, respectively) for the MLR model with those (0.95, 0.33, 0.90, and 0.48, respectively) obtained for the NN10-2-1, the non-linear neural network is much better than the MLR model produced with the same descriptors (Table 5).
Table 5.
Statistical results for MLR and NN10-2-1 models generated with the same descriptors and validated by leave-one–out validation
| Set | r2 | Rmsd | q2test | loormsd |
|---|---|---|---|---|
| MLR | 0.89 | 0.51 | 0.85 | 0.58 |
| NN10-2-1 | 0.95 | 0.33 | 0.90 | 0.48 |
Figure 5.
The calculated versus the experimentally determined pIC50 values listed in Table 1 for the trained (shown in blue diamonds) and leave-one-out cross-validation (shown in red triangles) for the MLR QSAR model. The solid line represents a perfect correlation.
Leave-n-out cross-validation was also performed for the MLR model to test its ability to predict an external compound set. Three/five subsets were constructed from the dataset of ninety-three BChE inhibitors in the same way as these created for the leave-n-out validation of the NN10-2-1 model. Similarly, three/five training sets were generated as combinations of any two/four subsets. The remaining one was used as a test set. Three/five MLR model with ten descriptors (listed in Table 2) as variables were generated based on each of the three/five newly generated training sets, and the prediction was made for their corresponding test set. The results are listed in Table 6. As seen from Table 6, the average of the statistical results, i.e. the training r2, rmsd, leave-n-out predictive r2test and test root-mean square derivation (testrmsd), from the two times of leave-n-out cross-validation are 0.89, 0.51, 0.87 and 0.58 respectively, which is similar to the statistical average obtained from leave-one-out validation of the MLR model (0.89, 0.51, 0.85 and 0.58, respectively), but worse than the statistical results (0.95, 0.33, 0.90, and 0.48, respectively) obtained from the training and LOO validation of the NN10-2-1 model with the 93 molecules as well as the result, 0.95, 0.33, 0.89 and 0.50, from the NN10-2-1 neural network leave-n-out test. These results indicate that the NN10-2-1 model is better and has a higher predictive power for the set of ninety-three compounds.
With MLR approach, it has been difficult to build a model having statistical results close to these of NN10-2-1 without overtraining. As seen in Figures 1 and 2, for the chosen set of 25 descriptors, 15 out of 25 have trivial contribution for improving model quality and will be the major reason to cause model instability. Moreover, artificial neural network, as an information processing paradigm inspired from biological nervous system, demonstrate to have remarkable ability to derive meaning from complicated data.
2.5 Descriptor contribution analysis
The ten descriptors used in the generated the neural network model NN10-2-1 and the MLR model (Equation 1) can be classified as follows: (i) 1D descriptor: C-028. (ii) 2D descriptors: GATS6e, MATS1p, and IC1. (iii) 3D descriptors: RDF010m, Mor30u, HATS5m, E2s, Mor15u, R4v+. Based on a previously described procedure,17 the relative contributions of each descriptor in the MLR model (Equation 1) and the NN10-2-1 model were calculated, and are listed in Table 7. The significance of the descriptors involved in the MLR model decreases in the following order: C-028 > MATS1p > HATS5m > E2s > RDF010m > GATS6e > Mor15u > Mor30u > R4v+ > IC1. The significance of the descriptors involved in the NN10-2-1 model decreases in the order: IC1 > GATS6e > C-028 > Mor15u > MATS1p > R4v+ > E2s > HATS5m > RDF010m > Mor30u. The order of significant descriptors in the MLR model and NN10-2-1 model are not identical. Although the order of the relative contribution from the ten descriptors is different from each other in the two models, the individual contribution from all of these descriptors is very close (i.e. from 9.45 to 10.89 for the MLR model and from 9.06 to 12.14 for the NN10-2-1 model). Thus, the contribution from these descriptors to both models can be regarded as similar.
Table 7.
Relative contributions of the ten descriptors to the structure -activity relationship in the MLR model and the NN11-1-1 model
| Descriptor | RDF010m | C-028 | Mor30u | HATS5m |
|---|---|---|---|---|
| R | 0.832 | 0.248 | 0.640 | −0.330 |
| MLR Ci(%) | 10.18 | 10.89 | 9.61 | 10.23 |
| NN Ci (%) | 9.41 | 10.58 | 9.06 | 9.51 |
| Descriptor | GATS6e | MATS1p | E2s | Mor15u |
| R | −0.229 | 0.543 | −0.059 | −0.430 |
| MLR Ci(%) | 9.74 | 10.56 | 10.22 | 9.62 |
| NN Ci (%) | 10.85 | 9.62 | 9.52 | 9.73 |
| Descriptor | R4v+ | IC1 | ||
| R | −0.642 | 0.276 | ||
| MLR Ci(%) | 9.49 | 9.45 | ||
| NN Ci (%) | 9.58 | 12.14 | ||
Among the ten descriptors, three descriptors (RDF010m, Mor30u, and MATS1p) correlated relatively high with the target experimental pIC50 values by themselves (Pearson correlation R=0.83, 0.64, and 0.54, respectively). RDF010m is among RDF descriptors obtained by radial basis functions centered on different interatomic distances (from 0.5 Å to 15.5 Å). Mor30u is the Morse signal 30 from the 3D-MoRSE-selected descriptors. The descriptor represents a restricted 3D space which captures relevant molecular information, regarding molecular size and shape, which is related to the modeled BChE inhibition activity.29 MATS1p is the Moran autocorrelation of topological structure with path length (lag) 2 in the graph weighted by atomic polarizabilities, i.e. lag 1/weighted by atomic polarizabilities.30 The positive Pearson correlation coefficients for them indicate that the compounds with larger values for these descriptors would have larger pIC50 values, and the negative Pearson correlation coefficients indicate that the compounds with smaller values would have larger pIC50 values. Thus, the three descriptors, particularly RDF010m, could be an indicator for compounds that have a large pIC50 value.
As shown in Table 7, the difference in descriptor contribution between any two descriptors used in the models is not significant, indicating that all descriptors are indispensable in generating the predictive models. The neural network model NN10-2-1 generated with the ten descriptors well reflected the linear and nonlinear features in the pattern from the dataset of 93 molecules.
2.6 Comparison of NN10-2-1 model with the energy-based linear model from molecular docking
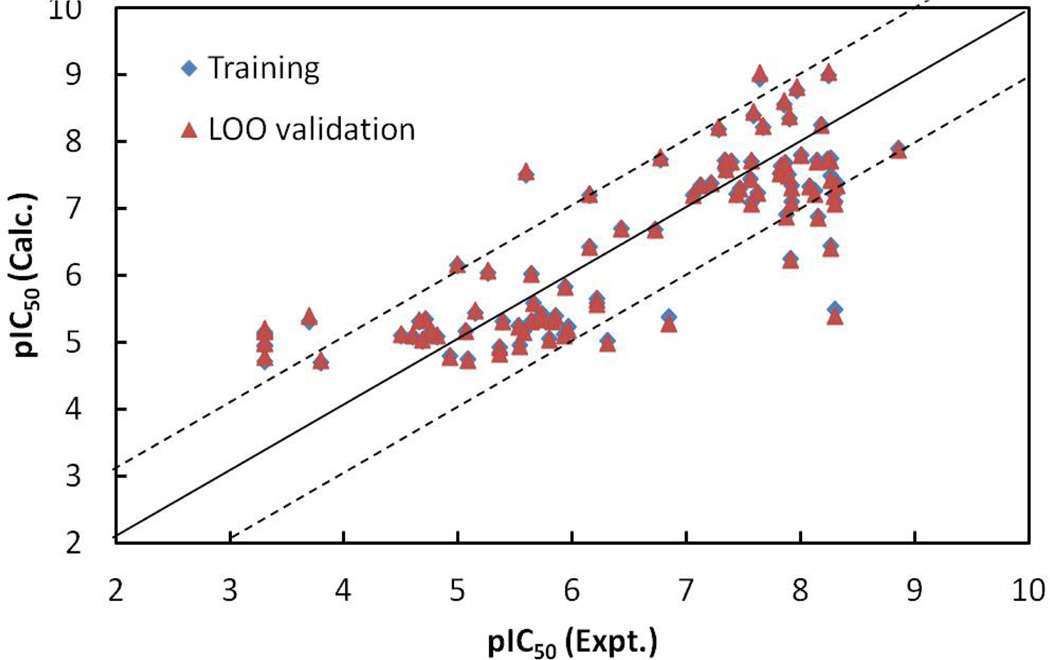
Ninety-three molecules in Table 1 were docked into the active site of BChE using AutoDock software, which led to six independent energy-based variables: i) Estimated free energy of binding (EFreeBind); ii) Final Intermolecular Energy (EInterMol) iii) Van der Waals+Hydrogen Bond+Desolvation Energy (EVHD); iv) Electrostatic Energy (EElec); v) Final Total Internal Energy (EFTot); vi) Torsional Free Energy (ETor). These energy variables reflect the protein-ligand interactions, whereas descriptors used in the aforementioned correlation analyses reflect the characteristics of the ligands themselves. It is interesting to compare their performances. The six energy variables were used for a linear model generation with experimental pIC50 values of the ninety-three molecules as the target values. By use of the same approach described previously for the generation of the ligand-based MLR QSAR model, the best model generated from the six energy variables is:
| (2) |
The values of Pearson correlation coefficient R for the correlation of the experimental pIC50 values with EFreeBind and ETor are 0.68 and 0.81, respectively, for the ninety-three molecules. R = 0.73 for the inter-correlation between EFreeBind and EInterMol. The statistical analysis for the linear model indicates that the energy-based linear model is also predictive: the correlation coefficient r2 and rmsd between the observed and the fitted pIC50 values were 0.67 and 0.87, respectively; the leave-one-out validation q2 was 0.65 and the loormsd was 0.90; the Fischer statistic F was 92.57. The calculated pIC50 values for the ninety-three molecules from the linear model (Equation 2), as well as the LOO validation results, are listed in Table 1. The relationships of the trained and LOO-predicted pIC50 values versus the experimental pIC50 values for the NN10-2-1 model are shown in Figure 6. Comparing with the statistical results (r2, rmsd, q2 and loormsd are 0.67, 0.87, 0.65, and 0.90, respectively) for the energy-based linear model (Equation 2) and the statistical results (0.89, 0.51, 0.85, and 0.58, respectively) for the ligand-based MLR model (Equation 1), the non-linear neural network model (NN10-2-1) with a statistical results (0.95, 0.33, 0.90, and 0.48, respectively), is the best and most predictive.
Figure 6.
The calculated versus experimental activity data for the trained (shown in diamonds), leave-one-out cross-validation (shown in triangles) for the linear model generated from energy-based descriptors obtained by molecular docking. The solid line represents a perfect correlation.
3. Conclusion
In the current study, molecular docking, multi-linear regression and artificial neural network approaches have been used to build QSAR models to predict pIC50 values of ninety-three BChE inhibitors which could be a factor mediating BChE activity of hydrolysis of cocaine. The statistical results for the linear model built from molecular docking-generated descriptors are: r2 = 0.67, rmsd = 0.87, q2 = 0.65 and loormsd = 0.90; the statistical results for the developed ligand-based MLR model are: r2 = 0.89, rmsd = 0.51, q2 = 0.85 and loormsd = 0.58; the statistical results for the trained neural network model are: r2 = 0.95, rmsd = 0.33, q2 = 0.90 and loormsd = 0.48. While the experimental pIC50 values correlated well with the predicted values generated by all of the three models, the neural network model is clearly the best, demonstrating its remarkable ability to derive patterns from complicated data. These models developed in the present study will be used as tools in future rational design and discovery of new, more potent inhibitors of BChE for treatment of Alzheimer’s disease. These models could also be used in identifying potential inhibitors of our high-activity BChE mutants for cocaine hydrolysis, as the high-activity BChE mutants were designed to stabilize the transition-state structures (and thus decrease the energy barriers) without significantly affecting the affinities of BChE binding with the substrates and potential inhibitors.
4. Methods
4.1 Generation of the molecular database
Ninety-three molecules listed in Table 1 constituted a database for the structure-activity correlation analysis.31–37 Molecular modeling was carried out with the aid of the Sybyl discovery software package.38a This software was used to construct the initial molecular structures used in the geometry optimization (energy minimization) for all molecules involved in this study. In construction of the initial molecular structures, a formal charge of +1 was assigned to each positively charged nitrogen atom in the structures of these compounds. The geometry optimization was first performed using the molecular mechanics (MM) method with the Tripos force field and the default convergence criterion, which was then followed by a semi-empirical molecular orbital (MO) energy calculation at the PM3 level. The optimized geometries were used to perform single-point ab initio calculations at the HF/6–31G* level in order to determine the electrostatic potential (ESP)-fitted atomic charges, i.e. the ESP charges, that fit to the electrostatic potential at points selected according to the Merz-Singh-Kollman scheme.38b In addition, the single-point energy calculations were also carried out by using the surface and volume polarization for electrostatics (SVPE)39–43 calculations at the HF/6–31G* level, which accounts for solvent effects on such molecular descriptors as the dipole moment and HOMO/LUMO energies.
4.2 Generation of molecular descriptors
The optimized three-dimensional conformations were used for generation of molecular descriptors. A total number of 1500 descriptors consisting of zero-dimensional (constitutional), one-dimensional (functional groups, atom-centred fragments, empirical descriptors, properties), two-dimensional (topological descriptors, molecular walk counts, BCUT descriptors, Galvez topological charge indices, and 2D autocorrelations), as well as three-dimensional descriptors (charge descriptors, aromaticity indices, Randic molecular profiles, geometrical descriptors, RDF descriptors, 3D-MoRSE descriptors, WHIM descriptors, and GETAWAY descriptors) were created by the DRAGON program and the aforementioned electronic structure calculations for each compound.28–30 Most of the descriptors from the Dragon program have been reviewed in the textbook by Todeschini and Conson.30 A reduced set of 238 descriptors were obtained after the constant/near constant descriptors and the highly inter-correlated descriptors (Pearson correlation coefficient R > 0.80) were discarded.
4.3 Stepwise descriptor selection by multiple linear regressions
The descriptor selection and the MLR analyses were performed using the Sybyl discovery software package38a and an in-house Fortran 77 program.17–20 Starting from the entire set of descriptors, variable selection by a forward and reverse stepwise regression procedure was performed, in which forward selection was followed by backward elimination of variables, resulting in an equation in which only variables that significantly increased the predictability of the dependent variable were included.
4.4 Neural network QSAR modeling
Feed-forward, back-propagation-of-error networks were developed using a in-house neural network C program17–20,23,25 Network weights (Wji(s)) for a neuron “j” receiving output from neuron “i” in the layer “s” were initially assigned random values between −0.5 and +0.5. The sigmoidal function was chosen as the transfer function that generates the output of a neuron from the weighted sum of inputs from the preceding layer of units. Consecutive layers were fully interconnected; there were no connections within a layer or between the input and the output. A bias unit with a constant activation of unity was connected to each unit in the hidden and output layers.
The input vector was the set of descriptors for each molecule in the series, as generated by the previous steps. All descriptors and targets were normalized to the [0,1] interval utilizing Equation 3:
| (3) |
where Xij and Xij’ represents the original value and the normalized value of the j-th (j=1,…k) descriptor for compound i (i=1,…n), and Xmin and Xmax represent the minimum and maximum values for the j-th descriptor. The network was configured with one or more hidden layers. During the neural network learning process, each compound in the training set was iteratively presented to the network. That is, the input vector of the chosen descriptors in normalized form for each compound was fed to the input units, and the network’s output was compared with the experimental “target” value. During one “epoch”, all compounds in the training set were presented, and weights in the network were then adjusted on the basis of the discrepancy between network outputs and observed pIC50 values by back-propagation using the generalized delta rule.
4.5 QSAR modeling with energy-based descriptors from molecular docking study
AutoDock (v.4.2) with AutoDockTools (ADT) 1.5.4 graphical interface was used to calculate the energy-based descriptors.44 Before molecular docking, ligand and protein preparation was followed by grid map calculations. For the protein, our previously modeled BChE structure in Ref 6–9, which started from the X-ray crystal structure deposited in the Protein Data Bank (pdb code: 1P0P), was used. For the ligands, ligand files from mol2 were converted to pdbqt files via AutoDockTools. Previously calculated ESP charges were applied to ligands. Root and rotatable torsion bonds that define the bond flexibility were set. During grid construction, atom types of the ligand in the calculation of grid maps were identified. In all cases of the grids calculation, the following parameters had been used: number of points in x, y and z-dimensions = 120; spacing = 0.375 Å, i.e. the grids were computed in a cube with volume 45 × 45 × 45 Å3 centered on the active site of BChE. The docking calculations using the Lamarckian genetic algorithm with default parameters were performed for conformational searches.
Six types of energy variables corresponding to the lowest binding energy for each inhibitor were collected from the docking study. Based on the six variables, an energy based-linear model with the experimental pIC50 values as target values was generated using stepwise descriptor selection procedure described in section 4.3.
4.6 Target properties
All BChE inhibitors examined in the present study were synthesized, measured, and reported by Decker et al.31–37 The pIC 50 values (corresponding to IC50 in M) were used as the target property to derive the QSARs.
4.7 Model validation
Models were cross-validated using the “leave-one-out (LOO)” and “leave-n-out (n=18/19,31)” approaches.
4.8 Evaluation of the QSAR models
The overall quality of the models is indicated by the Pearson correlation coefficient r2, the root-mean squared deviation (rmsd), the Fischer statistic (F), predictive q2 or r2test, and the leave-one out/leave n-out root-mean squared deviation loormsd/testrmsd. The predictive q2 or r2test are defined in Equation 2 below:
| (4) |
where SD is the sum of squared deviations of all measured pIC50 value from their mean, and PRESS is the predictive sum of squared differences between the actual and predicted values.
Acknowledgment
This work was supported by NIH grants DA013930, R01DA032910, R01DA035552, and NSF grant CHE-1111761. M.Z. is grateful to the National Institute on Drug Abuse (NIDA) of the NIH for a scholarship award from the 2013 Summer Research with NIDA Program and to the Kentucky Young Research Program (KYRP) for a research grant. M.Z. worked at the University of Kentucky as a student from the Math, Science and Technology Center (MSTC) program at Paul L. Dunbar High School, Lexington, KY. The authors also acknowledge the Computer Center at the University of Kentucky for supercomputing time on a Dell X-series Cluster with 384 nodes or 4,768 processors.
Footnotes
Publisher's Disclaimer: This is a PDF file of an unedited manuscript that has been accepted for publication. As a service to our customers we are providing this early version of the manuscript. The manuscript will undergo copyediting, typesetting, and review of the resulting proof before it is published in its final citable form. Please note that during the production process errors may be discovered which could affect the content, and all legal disclaimers that apply to the journal pertain.
References and Notes
- 1.Gorelick DA. Enhancing cocaine metabolism with butyrylcholinesterase as a treatment strategy. Drug and Alcohol Dependence. 1997;48:159–165. doi: 10.1016/s0376-8716(97)00119-1. [DOI] [PubMed] [Google Scholar]
- 2.Zheng F, Zhan C-G. Structure-and-mechanism-based design and discovery of therapeutics for cocaine overdose and addiction. Organic & biomolecular chemistry. 2008;6:836–843. doi: 10.1039/b716268e. [DOI] [PMC free article] [PubMed] [Google Scholar]
- 3.Zheng F, Zhan CG. Recent progress in protein drug design and discovery with a focus on novel approaches to the development of anticocaine medications. Future medicinal chemistry. 2009;1:515–528. doi: 10.4155/fmc.09.20. [DOI] [PMC free article] [PubMed] [Google Scholar]
- 4.Zheng F, Zhan CG. Rational design of an enzyme mutant for anti-cocaine therapeutics. J. Comput. Aided. Mol. Des. 2008;22:661–671. doi: 10.1007/s10822-007-9144-9. [DOI] [PMC free article] [PubMed] [Google Scholar]
- 5.Zhan CG, Zheng F, Landry DW. Fundamental reaction mechanism for cocaine hydrolysis in human butyrylcholinesterase. J. Am. Chem. Soc. 2003;125:2462–2474. doi: 10.1021/ja020850+. [DOI] [PMC free article] [PubMed] [Google Scholar]
- 6.Pan Y, Gao D, Yang W, Cho H, Yang G, Tai H-H, Zhan C-G. Computational redesign of human butyrylcholinesterase for anticocaine medication. Proceedings of the National Academy of Sciences of the United States of America. 2005;102:16656–16661. doi: 10.1073/pnas.0507332102. [DOI] [PMC free article] [PubMed] [Google Scholar]
- 7.Zheng F, Yang W, Ko M-C, Liu J, Cho H, Gao D, Tong M, Tai H-H, Woods JH, Zhan C-G. Most efficient cocaine hydrolase designed by virtual screening of transition states. J. Am. Chem. Soc. 2008;30:12148–12155. doi: 10.1021/ja803646t. [DOI] [PMC free article] [PubMed] [Google Scholar]
- 8.Yang W, Pan Y, Zheng F, Cho H, Tai H-H, Zhan C-G. Biophysical Journal. 2009;96:1931–1938. doi: 10.1016/j.bpj.2008.11.051. [DOI] [PMC free article] [PubMed] [Google Scholar]
- 9.Zheng F, Yang W, Xue L, Hou S, Liu J, Zhan CG. Design of high-activity mutants of human butyrylcholinesterase against (–)-cocaine: structural and energetic factors affecting the catalytic efficiency. Biochemistry. 2010;49:9113–9119. doi: 10.1021/bi1011628. [DOI] [PMC free article] [PubMed] [Google Scholar]
- 10.Schindler CW, Justinova Z, Lafleur D, Woods D, Roschke V, Hallak H, Sklair-Tavron L, Redhi GH, Yasar S, Bergman J, Goldberg SR. Modification of pharmacokinetic and abuse-related effects of cocaine by human-derived cocaine hydrolase in monkeys. Addict. Biol. 2013;18:30–39. doi: 10.1111/j.1369-1600.2011.00424.x. [DOI] [PMC free article] [PubMed] [Google Scholar]
- 11.Zheng F, Zhan C-G. Modeling of pharmacokinetics of cocaine in human reveals the feasibility for development of enzyme therapies for drugs of abuse. PLoS Comput. Biol. 2012;8(7):e1002610. doi: 10.1371/journal.pcbi.1002610. [DOI] [PMC free article] [PubMed] [Google Scholar]
- 12.Xue L, Ko MC, Tong M, Yang W, Hou S, Fang L, Liu J, Zheng F, Woods JH, Tai H-H, Zhan C-G. Design, Preparation, and characterization of high-activity mutants of human butyrylcholinesterase specific for detoxification of cocaine. Mol. Pharmacol. 2011;79:290–297. doi: 10.1124/mol.110.068494. [DOI] [PMC free article] [PubMed] [Google Scholar]
- 13.Brimijoin S, Gao Y, Anker JJ, Gliddon LA, Lafleur D, Shah R, Zhao Q, Singh M, Carroll ME. A cocaine hydrolase engineered from human butyrylcholinesterase selectively blocks cocaine toxicity and reinstatement of drug seeking in rats. Neuropsychopharmacology. 2008;33:2715–2725. doi: 10.1038/sj.npp.1301666. [DOI] [PMC free article] [PubMed] [Google Scholar]
- 14.Teva Pharmaceutical Industries Ltd. PCT WO/2011/071926. [Google Scholar]
- 15.Zheng F, Zhan C-G. Are pharmacokinetic approaches feasible for treatment of cocaine addiction and overdose? Future Med. Chem. 2012;4:125–128. doi: 10.4155/fmc.11.171. [DOI] [PMC free article] [PubMed] [Google Scholar]
- 16.Bryjak J, Ciesielski K, Zbiciński I. Modelling of glucoamylase thermal inactivation in the presence of starch by artificial neural network. J. Biotechnol. 2004;114:177–185. doi: 10.1016/j.jbiotec.2004.07.003. [DOI] [PubMed] [Google Scholar]
- 17.Zheng F, Bayram E, Sumithran SP, Ayers JT, Zhan C-G, Schmitt JD, Dwoskin LP, Crooks PA. QSAR modeling of mono- and bis-quaternary ammonium salts that act as antagonists at neuronal nicotinic acetylcholine receptors mediating dopamine release. Bioorg. Med. Chem. 2006;14:3017–3037. doi: 10.1016/j.bmc.2005.12.036. [DOI] [PubMed] [Google Scholar]
- 18.Zheng F, Zheng G, Deaciuc AG, Zhan C-G, Dwoskin LP, Crooks PA. Computational neural network analysis of the affinity of lobeline and tetrabenazine analogs for the vesicular monoamine transporter-2. Bioorg. Med. Chem. 2007;15:2975–2992. doi: 10.1016/j.bmc.2007.02.013. [DOI] [PMC free article] [PubMed] [Google Scholar]
- 19.Zheng F, McConnell MJ, Zhan CG, Dwoskin LP, Crooks PA. QSAR study on maximal inhibition (Imax) of quaternary ammonium antagonists for S-(-)-nicotine-evoked dopamine release from dopaminergic nerve terminals in rat striatum. Bioorg. Med. Chem. 2009;17:4477–4485. doi: 10.1016/j.bmc.2009.05.010. [DOI] [PMC free article] [PubMed] [Google Scholar]
- 20.Zheng F, Zheng GR, Deaciuc AG, Zhan C-G, Dwoskin LP, Crooks PA. Computational neural network analysis of the affinity of N-n-alkylnicotinium salts for the α4β2* nicotinic acetylcholine receptor. J. Enzym. Inhib. Med. Chem. 2009;24:157–168. doi: 10.1080/14756360801945648. [DOI] [PMC free article] [PubMed] [Google Scholar]
- 21.Fabry-Asztalos L, Andonie R, Collar CJ, Abdul-Wahid S, Salim N. A genetic algorithm optimized fuzzy neural network analysis of the affinity of inhibitors for HIV-1 protease. Bioorg. Med. Chem. 2008;16:2903. doi: 10.1016/j.bmc.2007.12.055. [DOI] [PubMed] [Google Scholar]
- 22.Goodarzi M, Freitas MP, Jensen J. Feature selection and linear/nonlinear regression methods for the accurate prediction of glycogen synthase kinase-3 inhibitory activities. J. Chem. Inf. Model. 2009;49:824–832. doi: 10.1021/ci9000103. [DOI] [PubMed] [Google Scholar]
- 23.Crooks PA, Zheng G;, Vartak AP, Culver JP, Zheng F, Horton DB, Dwoskin LP. Design, synthesis and interaction at the vesicular monoamine transporter-2 of lobeline analogs: potential pharmacotherapies for the treatment of psychostimulant abuse. Curr. Top. Med. Chem. 2011;11:1103–1127. doi: 10.2174/156802611795371332. [DOI] [PMC free article] [PubMed] [Google Scholar]
- 24.Patra JC, Chua BH. Artificial neural network-based drug design for diabetes mellitus using flavonoids. J. Comput. Chem. 2011;32:555–567. doi: 10.1002/jcc.21641. [DOI] [PubMed] [Google Scholar]
- 25.Ring JR, Zheng F, Haubner AJ, Littleton JM, Crooks PA. Improving the inhibitory activity of arylidenaminoguanidine compounds at the N-methyl-d-aspartate receptor complex from a recursive computational-experimental structure-activity relationship study. Bioorg. Med. Chem. 2013;21:1764–1774. doi: 10.1016/j.bmc.2013.01.051. [DOI] [PubMed] [Google Scholar]
- 26.Schliebs R, Arendt T. The significance of the cholinergic system in the brain during aging and in Alzheimer’s disease. J Neural Transm. 2006;113:1625–1644. doi: 10.1007/s00702-006-0579-2. [DOI] [PubMed] [Google Scholar]
- 27.Orhan IE. Current concepts on selected plant secondary metabolites with promising inhibitory effects against enzymes linked to Alzheimer’s disease. Current Medicinal Chemistry. 2012;19:2252–2261. doi: 10.2174/092986712800229032. [DOI] [PubMed] [Google Scholar]
- 28.DRAGON software version 3.0Odeveloped by Milano Chemometrics and QSAR Research Group. ( http://www.disat.nimib.it/chm/Dragon.htm)
- 29.Schuur J, Gasteiger J. Software Development in Chemistry - Vol. 10. In: Gasteiger J, editor. Fachgruppe Chemie-lnformation-Computer (CIC), Frankfurt am Main. 1996. [Google Scholar]
- 30.Todeschini R, Consonni V. Handbook of Molecular Descriptors. Weinheim (Germany): Wiley-VCH; 2002. [Google Scholar]
- 31.Decker M. Novel inhibitors of acetyl- and butyrylcholinesterase derived from the alkaloids dehydroevodiamine and rutaecarpine. European Journal of Medicinal Chemistry. 2005;40:305–313. doi: 10.1016/j.ejmech.2004.12.003. [DOI] [PubMed] [Google Scholar]
- 32.Decker M, Krauth F, Lehmann J. Novel tricyclic quinazolinimines and related tetracyclic nitrogen bridgehead compounds as cholinesterase inhibitors with selectivity towards butyrylcholinesterase. Bioorganic & Medicinal Chemistry. 2006;14:1966–1977. doi: 10.1016/j.bmc.2005.10.044. [DOI] [PubMed] [Google Scholar]
- 33.Schott Y, Decker M, Rommelspacherb H, Lehmann J. 6-Hydroxy- and 6-methoxy-b-carbolines as acetyl- and butyrylcholinesterase inhibitors. Bioorganic & Medicinal Chemistry Letters. 2006;16:5840–5843. doi: 10.1016/j.bmcl.2006.08.067. [DOI] [PubMed] [Google Scholar]
- 34.Decker M. Homobivalent quinazolinimines as novel nanomolar inhibitors of cholinesterases with dirigible selectivity toward butyrylcholinesterase. Journal of Medicinal Chemistry. 2006;49:5411–5413. doi: 10.1021/jm060682m. [DOI] [PubMed] [Google Scholar]
- 35.Fang L, Appenroth D, Decker M, Kiehntopf M, Roegler C, Deufel T, Fleck S, Peng S, Zhang Y, Lehmann J. Synthesis and biological evaluation of NO-donor-tacrine hybrids as hepatoprotective anti-Alzheimer drug candidates. Journal of Medicinal Chemistry. 2008;51:713–716. doi: 10.1021/jm701491k. [DOI] [PubMed] [Google Scholar]
- 36.Decker M, Krausb B, Heilmann J. Design, synthesis and pharmacological evaluation of hybrid molecules out of quinazolinimines and lipoic acid lead to highly potent and selective butyrylcholinesterase inhibitors with antioxidant properties. Bioorganic & Medicinal Chemistry. 2008;16:4252–4261. doi: 10.1016/j.bmc.2008.02.083. [DOI] [PubMed] [Google Scholar]
- 37.Fang L, Kraus B, Lehmann J, Heilmann J, Zhang Y, Decker M. Design and synthesis of tacrine-ferulic acid hybrids as multi-potent anti-Alzheimer drug candidates. Bioorganic & Medicinal Chemistry Letters. 2008;18:2905–2909. doi: 10.1016/j.bmcl.2008.03.073. [DOI] [PubMed] [Google Scholar]
- 38.(a) Tripos discovery software package with SYBYL 7.3.2. 1699 South Hanley Rd., St. Louis, Missouri, 63144, USA: Tripos Inc; [Google Scholar]; (b) Frisch MJ, Trucks GW, Schlegel HB, Scuseria GE, Robb MA, Cheeseman JR, Scalmani G, Barone V, Mennucci B, Petersson GA, Nakatsuji H, Caricato M, Li X, Hratchian HP, Izmaylov AF, Bloino J, Zheng G, Sonnenberg JL, Hada M, Ehara M, Toyota K, Fukuda R, Hasegawa J, Ishida M, Nakajima T, Honda Y, Kitao O, Nakai H, Vreven T, Montgomery JA, Jr, Peralta JE, Ogliaro F, Bearpark M, Heyd JJ, Brothers E, Kudin KN, Staroverov VN, Kobayashi R, Normand J, Raghavachari K, Rendell A, Burant JC, Iyengar SS, Tomasi J, Cossi M, Rega N, Millam JM, Klene M, Knox JE, Cross JB, Bakken V, Adamo C, Jaramillo J, Gomperts R, Stratmann RE, Yazyev O, Austin AJ, Cammi R, Pomelli C, Ochterski JW, Martin RL, Morokuma K, Zakrzewski VG, Voth GA, Salvador P, Dannenberg JJ, Dapprich S, Daniels AD, Farkas Ö, Foresman JB, Ortiz JV, Cioslowski J, Fox DJ. Gaussian 09. Revision A.1. Wallingford CT: Gaussian, Inc; 2009. [Google Scholar]
- 39.Zhan C-G, Bentley J, Chipman DM. “Volume polarization in reaction field theory”. J. Chem. Phys. 1998;108:177–192. [Google Scholar]
- 40.Zhan C-G, Chipman DM. “Cavity size in reaction field theory”. J. Chem. Phys. 1998;109:10543–10558. [Google Scholar]
- 41.Zhan C-G, Chipman DM. “Reaction field effects on nitrogen shielding”. J. Chem. Phys. 1999;110:1611–1622. [Google Scholar]
- 42.Vilkas MJ, Zhan C-G. “An efficient implementation for determining volume polarization in self-consistent reaction field theory”. J. Chem. Phys. 2008;129:194109. doi: 10.1063/1.3020767. [DOI] [PMC free article] [PubMed] [Google Scholar]
- 43.Zheng F, Zhan C-G. “Computational modeling of solvent effects on protein-ligand interactions using fully polarizable continuum model and rational drug design”. Commun. Comput. Phys. 2013;13:31–60. [Google Scholar]
- 44.Morris GM, Huey R, Lindstrom W, Scanner MF, Belew RK, Goodsell DS, Olson AJ. AutoDock4 and AutoDockTools4: automated docking with selective receptor flexibility. J. Comput. Chem. 2009;30:2785–2791. doi: 10.1002/jcc.21256. [DOI] [PMC free article] [PubMed] [Google Scholar]
- 45.Makhaeva GF, Radchenko EV, Palyulin BVA, Rudakova EV, Aksinenko AYu, Sokolov VB, Zefirov NS, Richardson RJ. Organophosphorus compound esterase profiles as predictors of therapeutic and toxic effects. Chemico-Biological Interactions. 2013;203:231–237. doi: 10.1016/j.cbi.2012.10.012. [DOI] [PubMed] [Google Scholar]
- 46.Decembrino de Souza S, Teles de Souza AM, Correa de Sousa AC, Sodero ACR, Cabral LM, Albuquerque MG, Castro HC, Rodrigues CR. Hologram QSAR models of 4-[(diethylamino)methyl]-phenol inhibitors of acetyl/butyrylcholinesterase enzymes as potential anti-Alzheimer agents. Molecules. 2012;17:9529–9539. doi: 10.3390/molecules17089529. [DOI] [PMC free article] [PubMed] [Google Scholar]
- 47.Karlsson D, Fallarero A, Brunhofer G, Mayer C, Prakash O, Mohan CG, Vuorela P, Erker T. The exploration of thienothiazines as selective butyrylcholinesterase inhibitors. Journal of Pharmaceutical Sciences. 2012;47(1):190–205. doi: 10.1016/j.ejps.2012.05.014. [DOI] [PubMed] [Google Scholar]
- 48.Sakkiah S, Lee KW. Pharmacophore-based virtual screening and density functional theory approach to identifying novel butyrylcholinesterase inhibitors. Acta Pharmacologica Sinica. 2012;33(7):964–978. doi: 10.1038/aps.2012.21. [DOI] [PMC free article] [PubMed] [Google Scholar]
- 49.Makhaeva GF, Radchenko EV, Baskin II, Palyulin VA, Richardson RJ, Zefirov NS. Combined QSAR studies of inhibitor properties of O-phosphorylated oximes toward serine esterases involved in neurotoxicity, drug metabolism and Alzheimer's disease. SAR and QSAR in Environmental Research. 2012;23(7-8):627–647. doi: 10.1080/1062936X.2012.679690. [DOI] [PubMed] [Google Scholar]
- 50.Abbasi SW, Kulsoom S, Riaz N. In silico pharmacophore model generation for the identification of novel butyrylcholinesterase inhibitors against Alzheimer's disease. Medicinal Chemistry Research. 2012;21(9):2716–2722. [Google Scholar]
- 51.Abdul Hameed MDM, Liu J, Pan Y, Fang L, Silva-Rivera C, Zhan C-G. Microscopic binding of butyrylcholinesterase with quinazolinimine derivatives and the structure-activity correlation. Theoretical Chemistry Accounts. 2011;130(1):69–82. [Google Scholar]
- 52.Solomon KA, Sundararajan S, Abirami V. QSAR studies on N-aryl derivative activity towards Alzheimer's disease. Molecules. 2009;14(4):1448–1455. doi: 10.3390/molecules14041448. [DOI] [PMC free article] [PubMed] [Google Scholar]


