

Abstract
Rho kinase (ROCK) isoforms regulate insulin signaling and glucose metabolism negatively or positively in cultured cell lines and skeletal muscle. However, the in vivo function of the ROCK1 isoform in adipose tissue has not been addressed. To determine the specific role of the adipose ROCK1 isoform in the development of insulin resistance and obesity, mice lacking ROCK1 in adipose tissue globally or selectively were studied. Here, we show that insulin's ability to activate IRS-1/PI3K/Akt signaling was greatly enhanced in adipose tissue of ROCK1−/− mice compared with wild-type mice. These effects resulted from the inhibitory effect of ROCK1 on insulin receptor action, as evidenced by the fact that IR tyrosine phosphorylation was abolished in ROCK1−/− MEF cells when ROCK1 was reexpressed. Consistently, adipose-specific disruption of ROCK1 increased IR tyrosine phosphorylation in adipose tissue and modestly improved sensitivity to insulin in obese mice induced by high-fat feeding. This effect is independent of any changes in adiposity, number or size of adipocytes, and metabolic parameters, including glucose, insulin, leptin, and triglyceride levels, demonstrating a minimal effect of adipose ROCK1 on whole body metabolism. Enzymatic activity of ROCK1 in adipose tissue remained ∼50%, which likely originated from the fraction of stromal vascular cells, suggesting involvement of these cells for adipose metabolic regulation. Moreover, ROCK isoform activities were increased in adipose tissue of diet-induced or genetically obese mice. These data suggest that adipose ROCK1 isoform plays an inhibtory role for the regulation of insulin sensitivity in diet-induced obesity in vivo.
Keywords: adipocyte, insulin sensitivity, insulin signaling, Rho kinase, ROCK1
the incidence of obesity has been increasing at an alarming rate and has become a major public health concern, affecting over 11% of the worldwide adult population (1, 11). Obesity is a significant causal factor for developing type 2 diabetes (9, 49). Type 2 diabetes is a multifactorial metabolic disorder characterized by peripheral insulin resistance in insulin target tissues such as skeletal muscle, adipose, and liver, all of which are key organs involved in the regulation of glucose disposal and production (9, 30). When these tissues fail to respond adequately to circulating insulin, insulin resistance occurs, resulting from an elevation of blood glucose levels (23). However, knowledge of the molecular mechanisms underlying the pathogenesis of insulin resistance is incomplete.
Rho kinase (ROCK) is a serine/threonine protein kinase identified as a GTP-Rho-binding protein (35). The two isoforms, ROCK1 (also known as ROKβ) and ROCK2 (also known as ROKα), are ubiquitously expressed in metabolically active organs (21, 33, 37). It is now clear that ROCK isoforms have a dual role either to enhance or to diminish insulin signaling in vivo and in vitro (2, 7, 12, 31, 32, 44, 45). Our previous work demonstrated that activation of ROCK1 is required for insulin-mediated glucose metabolism and insulin signaling in skeletal muscle, as indicated by the finding that global ROCK1-deficient mice show whole body insulin resistance by impairing skeletal muscle insulin signaling (31). Supporting this, in vitro studies with muscle cells also revealed that the ability of insulin to increase glucose transport was decreased when endogenous ROCK1 expression was inhibited (7). Furthermore, insulin stimulation of ROCK1 activity in skeletal muscle was significantly reduced in human subjects with obesity and type 2 diabetes, suggesting that impaired ROCK1 activation could contribute to the pathogenesis of insulin resistance in humans (8). However, experimental evidence from vasculature-related cell lines, including vascular smooth muscle cells, endothelial cells, and mammary epithelial cells, indicates that suppression of ROCK isoform activity with ROCK inhibitors fasudil or Y-27632 enhances insulin signaling by affecting IRS-1 tyrosine phosphorylation or PTEN (2, 32, 44, 45). Collectively, these data suggest that ROCK regulation of glucose metabolism and insulin signaling is conditional and complex in the context of its tissue- or cell-specific nature.
While relatively less information is available regarding ROCK function in insulin signaling in adipocytes, published data are conflicting. Dominant-negative ROCK suppresses insulin-stimulated IRS-1 phosphorylation and PI3K activity in 3T3-L1 adipocytes, and a chemical ROCK inhibitor blocks insulin-induced GLUT4 translocation in 3T3-L1 adipocytes, indicating a positive role for ROCK in insulin signaling (7, 12). In contrast, treatment of 3T3-L1 adipocytes with ROCK inhibitors Y-27632 and H89 enhances the PI3K/Akt and the MAPK signaling pathways (25). These divergent regulations of ROCK in adipocytes remain to be clarified and deserve further study in vivo (18). Indeed, the physiological role of ROCK1 in regulating insulin signaling and whole body glucose metabolism has not been explored. Genetic approaches with selective deletion of ROCK1 in adipose tissue will address this important question.
In the present study, we investigated the in vivo role of adipose ROCK1 in glucose metabolism by studying mice lacking ROCK1 in whole body and in adipose tissues, with particular emphasis on insulin signaling and insulin sensitivity. We also sought to determine the regulation of ROCK1 and ROCK2 expression and activation in adipose tissue of diet-induced or genetically obese mice. Here, we show that adipose-specific ablation of ROCK1 has a significant effect on insulin receptor (IR) signaling but a modest effect on systemic insulin sensitivity, suggesting an inhibitory role for the adipose ROCK1 isoform in regulating insulin action, with minimal effects on whole body glucose homeostasis.
MATERIALS AND METHODS
Experimental animals.
C57BL6/J, leptin-deficient ob/ob, and leptin receptor-deficient db/db mice were purchased from Jackson Laboratory (Bar Harbor, ME) and were fed standard chow (16% kcal from fat and 56% from carbohydrates; Purina Lab Diet 5008, St. Louis, MO) or a high-fat/sugar diet (58% kcal from fat and 25% from sugars, D12331; Research Diets, New Brunswick, NJ) for 12 wk. Global ROCK1 knockout (ROCK1−/−) mice used for experiments were generated on a C57BL/6–129/SvJ mixed background and then back-crossed at least 10 generations onto an FVB background (51). Generation of a loxP-flanked ROCK1 (ROCK1loxP/+) was described previously (17). Adipose-specific ROCK1-deficient mice (Adiponectin-Cre:ROCK1loxP/loxP) were generated by mating ROCK1loxP/loxP mice with Adiponectin-Cre transgenic mice (10). All animals were housed at 22−24°C with a 12:12-h light-dark cycle and ad libitum access to standard pelleted chow or high-fat diet (HFD) and water. All aspects of animal care and experimentation were conducted in accordance with the National Institutes of Health “Guide for the Care and Use of Laboratory Animals” (NIH Publication No. 85-23, revised 1996) and approved by the Institutional Animal Care and Use Committees of Beth Israel Deaconess Medical Center.
Insulin signaling and immunoblotting analysis.
Female wild-type (WT) and ROCK−/− mice, and male ROCK1loxP/loxP and Adiponectin-Cre:ROCK1loxP/loxP mice were fasted overnight. Mice were injected intraperitoneally with human insulin (10 U/kg body wt Humulin R; Lilly, Indianapolis, IN) or saline and euthanized 10 min later. Adipose tissue was rapidly removed, snap-frozen in liquid nitrogen, and stored at −80°C until analysis. Adipose tissue was homogenized in a lysis buffer as described (12). PI3K activities associated with IRS-1 or IRS-2 were measured as described (27). Adipose tissue lysates (20−50 μg protein) were resolved by SDS-PAGE and transferred to nitrocellulose membranes. The membranes were incubated with polyclonal antibodies against phospho-Y972 IR (Invitrogen, Carlsbad, CA); phospho-Y1162 IR (Invitrogen); phospho-Y612 IRS-1 (Invitrogen); phospho-Ser632/635 IRS-1 (Cell Signaling Technology, Danvers, MA); phospho-Ser473 Akt (Cell Signaling Technology); phospho-Thr308 Akt (Cell Signaling Technology); phospho-Thr389 S6 kinase (Cell Signaling Technology); phospho-Ser240/244 S6 ribosomal protein (Cell Signaling Technology); phospho-Thr642 AS160 (Invitrogen); phospho-Ser21/9 GSK3 (Cell Signaling); phospho-Ser1177 eNOS (Cell Signaling Technology); phospho (pTEpY) MAPK antibody (Promega, Madison, WI); ROCK1 (Santa Cruz Biotechnology, Dallas, TX); ROCK2 (Santa Cruz Biotechnology) IR (Santa Cruz Biotechnology); Akt (Santa Cruz Biotechnology); S6 ribosomal protein (Cell Signaling Technology); GLUT4 (EMD Millipore, Billerica, MA); protein tyrosine phosphatase-1B (PTP1B; R&D systems, Minneapolis, MN); actin (Santa Cruz Biotechnology); and GAPDH (Santa Cruz Biotechnology) or monoclonal antibodies specific for RhoA (Santa Cruz Biotechnology) or RhoE (EMD Millipore). The bands were visualized with enhanced chemiluminescence and quantified by densitometry (27). All phosphorylation data were normalized by the total protein levels. The levels of ROCK1 protein were normalized by actin or GAPDH protein levels.
Isolation of adipocytes.
To confirm the selective deletion of ROCK1 in adipocytes, adipocytes and stromal vascular cells from epididymal fat pads were isolated as described (15). Briefly, epididymal fat pads were digested with collagenase (1 mg/ml) in Krebs-Ringer-HEPES (20 mM) buffer (pH 7.4) with 2.5% BSA and 200 nM adenosine at 37°C with constant shaking. After 30 min of digestion, cells were passed through a mesh and washed.
ROCK isoform activities.
Lysates from the epididymal fat (350 μg protein) were subjected to immunoprecipitation overnight with 1 μg of polyclonal ROCK1 (sc6055, Santa Cruz Biotechnology) or ROCK2 (sc1851, Santa Cruz Biotechnology) antibodies, coupled to protein G-Sepharose beads (GE healthcare, Piscataway, NJ). ROCK isoforms activities were measured as described (19).
Blood parameters, food intake, and insulin tolerance test.
Blood was collected from random-fed or overnight-fasted mice, as indicated. Blood glucose was measured using an OneTouch Ultra glucometer (LifeScan, Milpitas, CA). Serum insulin and leptin levels were measured by an enzyme-linked immunosorbent assay (Crystal Chem, Chicago, IL). Serum total cholesterol and triglyceride levels were determined by an enzymatic method (Stanbio Laboratory, Boerne, TX). For measurement of daily food intake, ROCK1loxP/loxP and Adiponectin-Cre:ROCK1loxP/loxP mice were individually housed for 1 wk prior to measurement of food intake. Food intake was then measured over a 7-day period. For the insulin tolerance test (ITT), food was removed for 5 h and the blood glucose was measured immediately before and 15, 30, 60, 90, and 120 min after intraperitoneal injection of human insulin (0.75 U/kg body wt Humulin R, Lilly). Area above the curve was calculated using the trapezoidal method (31).
Quantitative real-time RT-PCR.
Total RNA was extracted using TRIzol reagent (Invitrogen). One microgram of total RNA was subjected to reverse transcription using oligo(dT) primers and MMLV reverse transcriptase (Clontech Laboratories, Mountain View, CA). qRT-PCR was performed with an Applied Biosystems 7900HT Fast System using SYBR Green PCR Mastermix reagent (Applied Biosystems, Foster City, CA). Relative mRNA expression levels were calculated using the 2−ΔΔCT method normalized to 36B4. Primer sequences are listed in Table 1.
Table 1.
Primer sequences used in qRT-PCR
| Gene | Primer | Sequences |
|---|---|---|
| 36B4 | Forward | AGATGCAGCAGATCCGCAT |
| Reverse | GTTCTTGCCCATCAGCACC | |
| Adipoq | Forward | CCGGAACCCCTGGCAG |
| Reverse | CTGAACGCTGAGCGATACACA | |
| Cd11b | Forward | ATGGACGCTGATGGCAATACC |
| Reverse | TCCCCATTCACGTCTCCCA | |
| CEBPα | Forward | CAAGAACAGCAACGAGTACCG |
| Reverse | GTCACTCGTCAACTCCAGCAC | |
| Cidea | Forward | ATCACAACTGGCCTGGTTACG |
| Reverse | TACTACCCGGTGTCCATTTCT | |
| Dio2 | Forward | CAGTGTGGTGCACGTCTCCAATC |
| Reverse | TGAACCAAAGTTGACCACCAG | |
| Elovl3 | Forward | TCCGCGTTCTCATGTAGGTCT |
| Reverse | GGACCTGATGCAACCCTATGA | |
| F4/80 | Forward | CTTTGGCTATGGGCTTCCAGTC |
| Reverse | GCAAGGAGGACAGAGTTTATCGTG | |
| FABP4 | Forward | CACCGCAGACGACAGGAAG |
| Reverse | GCACCTGCACCAGGGC | |
| IL-6 | Forward | CTCTGGGAAATCGTGGAAAT |
| Reverse | CCAGTTTGGTAGCATCCATC | |
| MCP-1 | Forward | TAGGCTGGAGAGCTACAAGAGGAT |
| Reverse | AGACCTCTCTCTTGAGCTTGGTGA | |
| PGC1α | Forward | GTCAACAGCAAAAGCCACAA |
| Reverse | TCTGGGGTCAGAGGAAGAGA | |
| PPARγ | Forward | GCATGGTGCCTTCGCTGA |
| Reverse | TGGCATCTCTGTGTCAACCATG | |
| PRDM16 | Forward | CAGCACGGTGAAGCCATTC |
| Reverse | GCGTGCATCCGCTTGTG | |
| Tfam | Forward | GTCCATAGGCACCGTATTGC |
| Reverse | CCCATGCTGGAAAAACACTT | |
| TNFα | Forward | AGGTTCTCTTCAAGGGACAAG |
| Reverse | GCAGAGAGGAGGTTGACTTTC | |
| UCP1 | Forward | ACTGCCACACCTCCAGTCATT |
| Reverse | CTTTGCCTCACTCAGGATTGG |
Histology.
For hematoxylin-eosin (H&E) staining, adipose tissues were fixed with 4% paraformaldehyde in PBS and embedded in paraffin. H&E staining was performed as described (14).
Mouse embryo-derived fibroblasts.
Mouse embryo-derived fibroblast (MEF) cells from WT and ROCK1−/− mice were prepared from E13.5 embryos using standard procedures. Briefly, E13.5 embryos were obtained from WT and ROCK1−/− mice. Genomic DNA was extracted from brain tissues for genotyping. The embryonic tissues were minced in PBS containing trypsin after removal of liver and intestinal tissues, followed by pipetting to further dissociate cells from tissues. MEF cells were obtained as described (43).
Cold exposure study.
Male ROCK1loxP/loxP and adiponectin-Cre:ROCK1loxP/loxP mice were housed individually with free access to pellet food and water. They were kept at 4°C for 6 or 24 h. Rectal temperature was measured using a YSI 4600 thermometer (YSI Temperature, Dayton, OH). At the end of the study, mice were euthanized, and brown adipose tissue (BAT) was rapidly removed and stored at −80°C until analysis.
TNF-α treatment.
Leptin receptor-deficient db/db mice at 10 wk of age were treated with vehicle or rosiglitazone (10 mg/kg body wt) by oral gavage for 2 wk. For TNF-α injection experiments, female FVB mice at 9 wk of age were injected intravenously with saline or 2.5 μg of murine TNF-α (Sigma, St. Louis, MO). Six or 18 h after the injection, adipose tissues were rapidly harvested and stored at −80°C until analysis.
Statistical analyses.
Data are presented as means ± SE. Statistical analyses were performed using the StatView program (Abacus Concepts, Berkeley, CA). Statistical significance among the groups was tested with an unpaired Student's t-test and analysis of variance (ANOVA) when appropriate.
RESULTS
Global ROCK1 deficiency enhances insulin signaling in adipose tissue.
We previously demonstrated that deficiency of global ROCK1 results in insulin resistance by impairing the IRS-1/PI3K/Akt signaling pathway in skeletal muscle (31). To further determine the effects of ROCK1 deficiency in adipose tissue, we measured the ability of insulin to activate PI3K and multiple distal pathways in ROCK1−/− mice. Immunoblotting analysis showed that ROCK1 protein was not detected in adipose tissue of ROCK1−/− mice, whereas ROCK2 protein expression was preserved (Fig. 1A). The protein levels of RhoA and RhoE in adipose tissue, both of which interact with ROCK1 (42, 47), were unaltered by deletion of ROCK1 (Fig. 1A), indicating no compensatory mechanism of an upstream mediator. In adipose tissue, insulin increased IRS-1-associated PI3K activity ∼6-fold and IRS-2-associated PI3K activity ∼3.6-fold over basal value in WT mice. Insulin-stimulated IRS-1-associated PI3K activity was markedly increased ∼115% in adipose tissue of ROCK1−/− mice compared with WT littermates (Fig. 1B). Basal IRS-1-associated PI3K activity was unchanged between WT and ROCK1−/− mice (Fig. 1B). Normal basal and insulin-mediated PI3K associated with IRS-2 activities were seen in ROCK−/− mice (Fig. 1B). In addition, loss of ROCK1 resulted in a dramatic increase in IRS-1 Tyr612 phosphorylation, the binding site for the p85 subunit of PI3K, in adipose tissue of ROCK1−/− mice compared with WT mice (Fig. 1, C and D). Similarly, insulin-mediated IRS-1 Ser632/635 phosphorylation was also enhanced in these mice. In parallel, phosphorylation of Akt at Thr308, but not Ser473, was increased and phosphorylation of GSK3 was increased in response to insulin in ROCK1−/− mice. These downstream signaling effects are most likely due to increased upstream IR signaling, evidenced by insulin stimulation of IR Tyr1162 and Tyr972 phosphorylation, which significantly increased in adipose tissue of ROCK1−/− mice (Fig. 1, C and D). However, ROCK1 deficiency did not affect insulin-induced MAPK, S6K, and S6 phosphorylation in adipose tissue. Protein expression of insulin-signaling molecules, including IR, IRS-1, Akt, S6, and PTP1B was not altered by ROCK1 deficiency (Fig. 1, C and D). These findings contrast with our previous findings that insulin signaling was impaired in muscle of ROCK1−/− mice (31) and support the notion that ROCK1 could play a negative role in regulating insulin action in adipose tissue in vivo.
Fig. 1.

Molecular analysis of insulin signaling in adipose tissue of Rho kinase-1 (ROCK1)−/− mice. A: immunoblot analysis of ROCK1 in adipose tissue of WT and ROCK1−/− (KO) mice. Adipose tissue lysates were subjected to SDS-PAGE and immunoblot with antibodies for ROCK1, ROCK2, RhoA, and RhoE. B: PI3K activity in adipose tissue of WT and ROCK1−/− mice. After an overnight fast, 4-mo-old female mice were injected ip with saline (open bars) or 10 U/kg insulin (filled bars). After 10 min, adipose tissue was removed. Adipose tissue lysates were subjected to immunoprecipitation with IRS-1 or an IRS-2 antibody. PI3K activity was measured and quantitated using a phosphorimager. C: insulin signaling in adipose tissue of WT and ROCK1−/− mice. Adipose tissue lysates were subjected to SDS-PAGE and immunoblot with antibodies as indicated. Bands were quantitated using densitometry and normalized by total protein levels. Note: blots for pIR (Y1163 and Y972), IR, pIRS-1(Y612), pAkt (Thr308 and Ser473), Akt, pGSK3, pS6K, and pS6 are rearranged in the same blots, and lines in blots indicate rearrangement of the blots. D: quantitation of insulin-signaling molecules in adipose tissue of WT and ROCK1−/− mice. Immunoblots shown are representative of 3 blots per antibody. For each genotype, n = 4 for saline and n = 6–7 for insulin. Data are means ± SE. **P < 0.01 vs. WT mice.
Generation of adipose-specific ROCK1-deficient mice.
To explore the physiological function of ROCK1 in adipocytes, we generated mice lacking ROCK1 in adipocytes by mating ROCK1 floxed mice with adiponectin-Cre recombinase transgenic mice (Fig. 2A). Immunoblotting analysis from multiple tissues revealed that ROCK1 expression was decreased in BAT and was normal in other tissues including white adipose tissue (Fig. 2B). Because adipose tissue is composed of adipocytes and stromal vascular cells, we measured the amount of ROCK1 in isolated adipocytes and stromal vascular cells. As expected, the expression of ROCK1 was absent in adipocytes but was similar in stromal vascular cells between control and adipose-specific ROCK1-deficient mice (Fig. 2C). The amount of Glut4, an adipocyte marker (34), was relatively higher in adipocytes than in stromal vascular cells, verifying the high purity of adipocytes (Fig. 2C). When we measured the enzyme activity of ROCK1 in lysates from adipose tissue, we found that ROCK1 activity was decreased by ∼50% in adipose-specific ROCK1-deficient mice, whereas ROCK2 activity was normal (Fig. 2C). Because the amount of ROCK1 protein in stromal vascular cell was intact (Fig. 2C), these data suggest that ∼50% of ROCK1 activity in adipose lysates reflects stromal vascular cells-derived activity (Fig. 2D).
Fig. 2.

Generation of adipose-specific ROCK1-deficient mice. A: Sschematic representation of targeted allele, Flp-deleted allele, and Cre-deleted allele. B: ROCK isoform expression in peripheral tissues of ROCK1loxP/loxP (control) and adiponectin-Cre:ROCK1loxP/loxP (KO) mice. Tissue lysates were separated by SDS-PAGE and immunoblots with an antibody for ROCK1, ROCK2, and actin. Pan, pancreas; Hypo, hypothalamus; BAT, brown adipose tissue; Epi, epididymal fat; Sub, subcutaneous fat. C: ROCK1 expression in adipocytes and stromal vascular fraction from ROCK1loxP/loxP (control) or adiponectin-Cre:ROCK1loxP/loxP (KO) mice. Tissue lysates were separated by SDS/PAGE and immunoblots with an antibody for ROCK1, Glut4, and actin. D: ROCK1 and ROCK2 activities in adipose tissue from ROCK1loxP/loxP (control) or adiponectin-Cre:ROCK1loxP/loxP (KO) mice. ROCK1 and ROCK2 activities were measured by immune complex assay; n = 4–5 per group. *P < 0.05 vs. control mice.
Chow-fed adipose-specific ROCK1-deficient mice have no body weight changes and do not display differences in insulin sensitivity.
Body weights were measured in WT, Adiponectin-Cre, ROCK1loxP/loxP, and Adiponectin-Cre:ROCK1loxP/loxP mice for up to 29 wk of age on a normal chow diet. Body weights were indistinguishable among the four groups in both male (Fig. 3A) and female mice (data not shown). We performed further studies with ROCK1loxP/loxP mice as a representative of control mice. There were no differences in daily food intake (Fig. 3B) or blood glucose levels (Fig. 3C) between the two genotypes. The weights of various fat depots and organs also exhibited no differences after adjusting for body weight (Fig. 3, D and E). The ITT showed that adiponectin-Cre:ROCK1loxP/loxP mice displayed normal insulin sensitivity compared with control mice (Fig. 3F). Together, these data suggest that ROCK1 in adipose tissue plays an insignificant role in regulating glucose metabolism and insulin sensitivity under a chow diet.
Fig. 3.
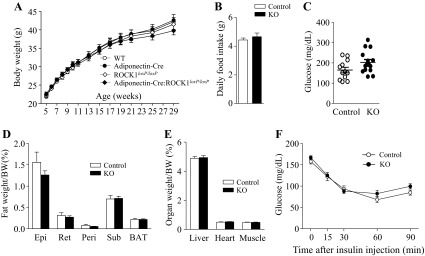
ROCK1 loss in adipose tissue does not affect body weight, adiposity, food intake, and glucose homeostasis in mice on a chow diet. A: body weight (male, n = 13–20); B: daily food intake (9-wk-old male mice, n = 6 per group); C: glucose (n = 12–15); D: fat depots weight (n = 12–15); E: organ weight (n = 12–15); F: insulin tolerance test (ITT, n = 8–10) of adiponectin-Cre:ROCK1loxP/loxP (KO) and control mice at 29 wk of age are shown. ITT was performed 5 h after food removal. Mice were injected with insulin at 0.75 U/kg body wt ip. Blood glucose was measured from tail bleeds at indicated times.
HFD-fed adipose-specific ROCK1-deficient mice do not show differences in body weight, body composition, or biochemical metabolic parameters.
To determine whether selective deletion of ROCK1 in adipose tissue can affect the development of adiposity, adiponectin-Cre:ROCK1loxP/loxP and ROCK1loxP/loxP mice were placed on HFD from 10 wk of age. When body weights were measured weekly up to 26 wk of age, no differences were found between the two groups (Fig. 4A). Another cohort with an earlier initiation of HFD at 6 wk of age showed similar results (data not shown). Daily food intakes were comparable (Fig. 4B). Neither the weights of organs nor those of various fat depots exhibited differences between two groups after adjusting for body weight (Fig. 4, C and D). Fasting glucose levels (Fig. 4E), serum cholesterol, and triglyceride levels (Fig. 4, F and G) were also comparable between adiponectin-Cre:ROCK1loxP/loxP and ROCK1loxP/loxP mice. Serum insulin or leptin levels were well correlated with visceral fat mass, without any significant differences between the two groups (Fig. 4, H and I). To determine whether loss of adipose ROCK1 can alter the number or size of adipocytes, H&E staining from various fat depots was performed. Deficiency of ROCK1 in adipose tissue had no effect on adipocyte size or numbers in epididymal, mesenteric, perirenal, subcutaneous, and brown fat cells (Fig. 4J). These data shows that adipose ROCK1 activation is not required for the development of obesity under a HFD.
Fig. 4.

ROCK1 absence in adipose tissue does not affect body weight, adiposity, food intake, and glucose homeostasis in mice on high-fat diet (HFD). A: body weight (n = 12–15); B: daily food intake (14-wk-old male mice, n = 6 per group); C: organ weight (n = 8–13); D: fat depots weight (n = 8–13); E: glucose (n = 8–13); F: serum cholesterol (n = 11–15); G: serum triglyceride (n = 11–15); H: serum insulin and relationship between serum insulin and visceral-fat amount (n = 8–13); I: serum leptin and relationship between serum leptin and visceral fat amount (n = 8–13); and J: adipose tissue H&E staining of ROCK1loxP/loxP (control) and adiponectin-Cre:ROCK1loxP/loxP (KO) mice at 26 wk of age are shown.
HFD-fed adipose-specific ROCK1-deficient mice display improved insulin sensitivity and enhanced insulin signaling.
To determine the possibility that loss of ROCK1 in adipose tissue can improve insulin sensitivity and signaling, ITT and insulin signaling were measured in adipose-specific ROCK1-deficient mice. ITT showed that adiponectin-Cre:ROCK1loxP/loxP mice were hypersensitive to insulin, as indicated by the fact that blood-glucose levels after insulin injection were significantly decreased compared with control mice. Area above the glucose curve was increased ∼35% in adiponectin-Cre:ROCK1loxP/loxP mice compared with control mice (Fig. 5, A and B). To further determine the mechanism by which deletion of ROCK1 in adipocytes enhances systemic insulin sensitivity, we measured the ability of insulin to activate molecules in the insulin-signaling pathway. Absence of ROCK1 in adipose tissue caused a significant increase in insulin-stimulated IR phosphorylation in adipose tissues. In parallel, insulin-induced Akt Thr308 and Ser473 phosphorylation were increased in adipose tissue of adiponectin-Cre:ROCK1loxP/loxP mice. However, adipose-specific deletion of ROCK1 had no effect on AS160, MAPK, and S6 phosphorylation (Fig. 5, C and D). These data suggest that deletion of ROCK1 in adipocytes ameliorated insulin resistance in obese mice induced by high-fat feeding. These effects are most likely due to improved insulin action at the level of IR.
Fig. 5.

Adipose-specific deletion of ROCK1 improves insulin sensitivity and insulin signaling in mice on HFD. A: ITT in ROCK1loxP/loxP (control) and adiponectin-Cre:ROCK1loxP/loxP (KO) mice. ITT was performed 5 h after food removal. Mice were injected with insulin at 0.75 U/kg body wt ip. Blood glucose was measured from tail bleeds at indicated times; n = 12–15 per group. *P < 0.05 vs. control mice. B: Area above the glucose curve was calculated during the ITT. *P < 0.05 vs. control mice. C: insulin signaling in adipose of ROCK1loxP/loxP (control) and adiponectin-Cre:ROCK1loxP/loxP (KO) mice. After overnight fast, 20-wk-old male mice were injected ip with saline or 10 U/kg insulin. After 10 min, adipose tissue was removed. Adipose tissue lysates were subjected to SDS-PAGE and immunoblot with antibodies, as indicated.; n = 6 per group. D: bars show densitometric quantitation of insulin-stimulated phosphorylation of indicated molecules from ROCK1loxP/loxP (control) and adiponectin-Cre:ROCK1loxP/loxP (KO) mice. Bands were quantitated using densitometry and normalized by total protein levels. *P < 0.05 vs. control mice. E: insulin receptor (IR) tyrosine phosphorylation in mouse embryo-derived fibroblast (MEF) from WT and ROCK1−/− mice. Cells were stimulated with insulin (0, 10, and 100 nM) for 15 min. Cell lysates were subjected to SDS-PAGE and immunoblot with antibodies, as indicated. F: IR tyrosine phosphorylation in MEF from ROCK1−/− mice. MEF lacking ROCK1 was transfected with ROCK1 cDNA. Cells were stimulated with insulin (0, 10, and 100 nM) for 15 min. Cell lysates were subjected to SDS-PAGE and immunoblot with antibodies as indicated.
Insulin signaling in ROCK1-deficient MEF cells.
To further determine the role of ROCK1 in IR signaling, we studied MEF cells that were generated from WT and ROCK1−/− mice. Insulin induced IR tyrosine phosphorylation in a dose-response manner in MEF cells derived from WT mice (Fig. 5E). However, insulin stimulation of IR tyrosine phosphorylation was further increased in ROCK1−/− MEF cells compared with control cells (Fig. 5E). These data are consistent with the results of adipose tissue examined in vivo. Of note, insulin-dependent tyrosine phosphorylation of IR was completely abolished when ROCK1 was reexpressed in ROCK1−/− MEF cells (Fig. 5F), indicating the inhibitory effect of ROCK1 on IR action.
HFD-fed adipose-specific ROCK1-deficient mice show no differences in gene expression involved in adipogenesis, inflammation, and thermogenesis.
To determine whether loss of ROCK1 in adipose tissue can alter gene expression involved in adipogenesis, inflammation, and thermogenesis, mRNA levels of a number of genes were measured. Gene expression of CEBPα, a marker of adipogenesis, was increased in adipose tissue of adipose-specific ROCK1-deficient mice compared with control mice (Fig. 6A). However, mice lacking ROCK1 in adipose tissue did not show any differential expression in adiponectin, PPARγ, FABP4, and PGC1α (Fig. 6A). Deficiency of ROCK1 in adipose tissue had no effect on gene expression involved in inflammation, including MCP1, TNFa, IL-6, Cd11b, and F4/80 (Fig. 6B). The mRNA levels of UCP1, Cidea, Dio2, PRDM16, Elovl3, and Tfam were not altered by deletion of ROCK1 in adipose tissue (Fig. 6C).
Fig. 6.

Effects of ROCK1 deletion on gene expression involved in adipogenesis, inflammation, and thermogenesis in adipose tissue of mice on HFD. Gene expression of (A) adipogenesis-, (B) inflammation-, and (C) thermogenesis-related molecules in adipose tissue of 16-wk HFD-fed ROCK1loxP/loxP (control) and adiponectin-Cre:ROCK1loxP/loxP (KO) mice are shown. mRNA expressions of indicated molecules were measured by real-time RT-PCR; n = 6 per group. *P < 0.05 vs. control mice.
Cold-induced thermogenesis is normal in adipose-specific ROCK1-deficient mice.
Nonshivering thermogenesis by activation of BAT or browning of white adipose tissue could contribute to the regulation of whole body metabolism (4). Because the RhoA-ROCK signaling pathway has been suggested as an important mediator of brown adipocyte differentiation and mitochondrial biogenesis (13), we further determined the effects of adipose ROCK1 deletion on cold-induced thermogenesis. When control and adipose-specific ROCK1-deficient mice were exposed at 4°C, core body temperature rapidly fell ∼6°C within 1 h and then maintained ∼30°C until 24 h in both groups of mice (Fig. 7A). The expression of critical genes involved in thermogenesis, including UCP1, PGC1α, Dio2, and Elovl3, increased significantly in BAT during the course of cold exposure in both control and adipose-specific ROCK1-deficient mice (Fig. 7B). Neither PRDM16 nor Cidea mRNA levels were altered by ROCK1 deletion (Fig. 7B). These data suggest that deficiency of ROCK1 in adipocytes may not contribute to the physiological response of brown fat during cold exposure.
Fig. 7.

Cold-induced thermogenesis is unaltered in the absence of ROCK1 in adipose tissue of mice on HFD. A: changes in core temperature after cold exposure (4°C) in ROCK1loxP/loxP (control) and adiponectin-Cre:ROCK1loxP/loxP (KO) mice; n = 4 per group. B: gene expression of thermogenesis-related molecules in BAT of ROCK1loxP/loxP (control) and adiponectin-Cre:ROCK1loxP/loxP (KO) mice are shown. mRNA expressions of indicated molecules were measured by real time RT-PCR; n = 4 per group. *P < 0.05 vs. 0 h in each group.
ROCK activities are increased in adipose tissue of diet-induced or genetically obese mice.
To investigate the possibility that increased activation of ROCK is involved in insulin resistance in vivo, the expression and kinase activities of ROCK1 and ROCK2 isoforms in adipose tissue of diet-induced or genetically obese mice were measured. Whereas there is no significant change in the amount of ROCK1 or ROCK2 protein in adipose tissue of mice fed HFD compared with mice fed a normal chow diet, the activity of ROCK1 or ROCK2 was greatly increased more than twofold. (Fig. 8, A–C). These data are in line with a previous study showing increased MYPT phosphorylation, as an indicator of ROCK activity, in HFD-fed mice (14). Expression of ROCK1, but not ROCK2, was increased in adipose tissue of db/db or ob/ob mice compared with control mice (Fig. 8, D and E), and both ROCK1 and ROCK2 isoform activity was greatly increased in these mice (Fig. 8F). The magnitude of ROCK activity in db/db mice was much greater than that in ob/ob mice. Furthermore, we found that intravenous injection of TNFα increased ROCK1, but not ROCK2, expression in adipose tissue (Fig. 8). However, adipose ROCK1 was insensitive to insulin sensitizer, as evidenced by the findings that treatment of db/db mice with insulin sensitizer rosiglitazone had no effects on ROCK1 expression and activity in adipose tissue (not shown). Collectively, these data suggest that hyperactivation of ROCK isoforms in adipose tissue is associated with insulin resistance and may play a contributing role in the pathogenesis of obesity and type 2 diabetes.
Fig. 8.

ROCK isoforms activity in adipose tissue is increased in HFD-induced mice, db/db (long-form leptin receptor deficient) and ob/ob (leptin-deficient) mice. A: ROCK isoform expression in adipose tissue from mice on chow (CHO) or HFD group at 18 wk of age. Adipose tissue lysates (25 μg) were separated by SDS/-PAGE and immunoblots with an antibody for ROCK1, ROCK2, and actin; n = 5 per group. B: Bars show densitometric quantitation of ROCK1 or ROCK2 protein levels from mice on CHO or HFD group. Bands were quantitated using densitometry and normalized by actin protein levels. C: ROCK1 and ROCK2 activity in adipose tissue from mice on CHO or HFD at 18 wk of age. ROCK1 and ROCK2 activities in adipose tissue were measured by immune complex assay; n = 5 per group. *P < 0.05 vs. normal CHO. D: ROCK isoform expression in adipose tissue from lean, db/db, and ob/ob mice at 12 wk of age; n = 4 per group. E: bars show densitometric quantitation of ROCK1 or ROCK2 protein levels from lean, db/db, and ob/ob mice. Bands were quantitated using densitometry and normalized by actin protein levels. *P < 0.05 vs. lean mice. F: ROCK1 and ROCK2 activity in adipose tissue from lean, db/db, and ob/ob mice. ROCK1 and ROCK1 activities in adipose tissue were measured by immune complex assay; n = 4 per group. *P < 0.05 vs. lean; #P < 0.05 vs. db/db. G: ROCK isoform expression in adipose tissue from mice treated with TNFα. Adipose tissue lysates (25 μg) were separated by SDS-PAGE and immunoblots with an antibody for ROCK1, ROCK2 and GAPDH; n = 5 per group. H: bars show densitometric quantitation of ROCK1 protein levels from mice treated with TNFα. Bands were quantitated using densitometry and normalized by GAPDH protein levels. **P < 0.01 vs. 0 time point.
DISCUSSION
The present study investigated the physiological role of the ROCK1 isoform in the regulation of insulin sensitivity and the development of obesity in mice, with particular focus on metabolic action of ROCK1 in adipocytes. Our previous study with global ROCK1 knockout mice showed that ROCK1 disruption resulted in insulin resistance by impairing insulin's ability to increase insulin signaling in skeletal muscle in vivo (31). These data are further supported by the in vitro findings that inhibition of ROCK1 by siRNA decreased insulin-induced glucose transport and insulin signaling in muscle cells and adipocytes (7). On the basis of these findings, it was expected that the loss of ROCK1 from adipose tissue would lead to insulin resistance, due to impaired insulin signaling, and high-fat feeding would exacerbate such effects further. Unexpectedly, we found that global deletion of ROCK1 led to a significant increase in proximal insulin signaling in adipose tissue despite the fact that ROCK1−/− mice are insulin resistant. Consistently, adipose-selective deletion of ROCK1 ameliorated insulin sensitivity and insulin signaling in mice fed a HFD. These data suggest that ROCK1 in adipose tissue plays an inhibitory role in controlling insulin sensitivity and insulin signaling and further implicate that regulation of ROCK1 in glucose homeostasis is conditional and complex in the context of the in vivo metabolic milieu.
The current findings that the IR signaling pathway was greatly increased in adipose tissue in the absence of ROCK1 contrast with our previous in vitro results in which ROCK1 played a positive role in regulating insulin action in cultured 3T3-L1 adipocytes (7). A possible explanation could be involvement of cross-talk between adipocytes and stromal vascular cells, which are excluded in the cultured cell system. Stromal vascular cells in adipose tissue are constituted with immune cells, macrophages, vascular cells, fibroblasts, and precursor cells (6, 38). The importance of stromal vascular cells for the metabolic actions of insulin includes the findings that accumulation and polarization of macrophages in adipose tissue are linked to systemic inflammation and insulin resistance (5, 40). In adipose-specific ROCK1-deficient mice, ROCK1 activity measured from adipose tissue lysates was reduced by only ∼50% despite the lack of ROCK1 protein in adipocytes (Fig. 2, C and D). This suggests that the ∼50% of ROCK1 activity is thought to originate from the fraction of stromal vascular cells, as revealed by normal levels of ROCK1 protein. Possibly, remaining ROCK1 activity may be sufficient to enhance insulin signaling in adipose tissue locally and contribute to the metabolic phenotype of these mice. Full investigation of whether ROCK1 action in vascular-related cells or macrophages may play a pivotal role in regulating insulin signaling in vivo will be an important future study. Nevertheless, our results are consistent with the hypothesis that ROCK1 plays an inhibitory role in the regulation of insulin signaling in endothelial or vascular-related cells (2, 32, 44, 45). In conjunction with this notion, it has been suggested that increased ROCK expression or activation is involved in the pathogenesis of cardiovascular-related diseases, including hypertension, arteriosclerosis, and diabetes (26, 29, 36, 48). Indeed, we also found that activity of ROCK isoforms in adipose tissue was significantly increased in insulin-resistant mice with obesity or type 2 diabetes.
It has been reported that inhibition of ROCK isoforms would be beneficial for metabolic disorders such as obesity and insulin resistance (14, 16, 24, 29). For example, reduced ROCK activity (presumably ROCK1 and ROCK2) by overexpression of the dominant-negative form of RhoA, a major upstream effector of ROCK in adipose tissue, resulted in improved whole glucose metabolism and resistance to diet-induced obesity (14). Furthermore, studies with ROCK chemical inhibitors targeting both ROCK1 and ROCK2 isoforms have demonstrated that inactivation of these isoforms enhanced glucose tolerance in insulin-resistant obese rats (24). Here, we have demonstrated that adipose-specific deletion of ROCK1 in mice modestly ameliorates insulin sensitivity and insulin signaling under a HFD. These effects are independent of adiposity, glucose homeostasis, adipose inflammation, and thermogenesis. From the view of these observations, we suggest that adipose ROCK1 isoform could have a minimal effect on the regulation of whole body glucose metabolism and adiposity in vivo. Given that the metabolic impacts on glucose homeostasis were greater when the two ROCK isoforms were inactivated than when only ROCK1 isoform was inhibited (14, 24), it is also conceivable that the ROCK2 isoform in adipose tissue may play a dominant role in controlling insulin sensitivity and adiposity. Support for this comes from experimental evidence revealing that ROCK2, but not ROCK1, regulates the development of adipogenesis by increasing adipogenic transcription factors in adipocytes (39). Further investigation is warranted to determine the specific role of the ROCK2 isoform in regulating insulin sensitivity and adiposity in vivo. We cannot rule out the possibility that adipose-specific ROCK1-deficient mice with a long term of HFD feeding or aging would have a significant impact on the metabolic action of insulin. For instance, mice lacking IRs in adipose tissue revealed improved glucose tolerance and enhanced insulin sensitivity at the age of 10 mo, whereas no differences were seen at the age of 2 mo (3).
In this study, a significant elevation in insulin's ability to stimulate proximal signaling in adipose tissue was seen in the absence of ROCK1. This was likely due to increased IR tyrosine phosphorylation, an initial trigger of insulin signaling, which in turn promoted downstream signaling pathways of insulin, including IRS-1 and Akt signaling. Considering tyrosine phosphorylation of IR is regulated by PTP1B during insulin stimulation, it is possible that deletion of ROCK1 reduces PTP1B activity directly or indirectly, which could prevent dephosphorylation of IR tyrosine residues that cause an argument in IR tyrosine phosphorylation leading to an increased downstream cascade (28, 50). In this regard, functional proteomics studies demonstrated the involvement of PTP1B in the regulation of RhoA signaling (22). Although we do not know how ROCK1 regulates IR tyrosine phosphorylation in response to insulin, the indirect mechanism can be excluded because ROCK1 does not bind to IR directly (data not shown). Further studies are necessary to define the molecular mechanism for this.
Of note, in ROCK1−/− mice, adipose tissue and vascular-related tissues such as aorta and heart remain sensitive to insulin (data not shown), whereas skeletal muscle is resistant to insulin (31). Similar observations were also seen in other models of insulin resistance, including in monosodium glutamate-induced insulin-resistant rats (46), low-salt diet-induced insulin-resistant rats (41), and fructose-fed rats (20). Together, these data suggest that both local and systemic factors regulating insulin action may contribute to this phenotype of insulin resistance and further support the classical notion that defective skeletal muscle insulin action, rather than other tissues, primarily contribute to decreased whole body insulin sensitivity in ROCK1−/− mice in vivo.
To our knowledge, this is the first demons tration of the specific role of the ROCK1 isoform in adipocytes in vivo. Our data provide direct evidence that deletion of the adipose ROCK1 isoform protects from diet-induced insulin resistance in part by enhancing IR signaling. Increased action of insulin in adipose tissue could not improve whole body glucose metabolism, adiposity, and inflammation, suggesting that the adipose ROCK1 isoform plays a minor role in controlling insulin sensitivity and glucose homeostasis in mice. However, the current data are largely consistent with an inhibitory role for ROCK in insulin signaling in vascular-related cells. Thus, understanding the molecular basis for the site specificity of ROCK1 in glucose metabolism could lead to new therapeutic targets for obesity and type 2 diabetes as well as vascular-related diseases.
DISCLOSURES
No conflicts of interest, financial or otherwise, are declared by the author(s).
AUTHOR CONTRIBUTIONS
Author contributions: S.-H.L., H.H., K.C., D.H.L., J.S., T.L., K.-H.C., J.A.S., I.S.L., J.M.Z., and L.W. performed experiments; S.-H.L., H.H., K.C., D.H.L., and Y.-B.K. analyzed data; S.-H.L. prepared figures; S.-H.L. drafted manuscript; H.H. and Y.-B.K. interpreted results of experiments; J.M.Z. and Y.-B.K. edited and revised manuscript; Y.-B.K. conception and design of research; Y.-B.K. approved final version of manuscript.
ACKNOWLEDGMENTS
This work was supported by grants from the National Institutes of Health (1R01 DK-08357 to Y.-B. Kim, HL-085098 to L. Wei, R21 DK-073530 and P30 DK-057521 to J. M. Zabolotny), the American Heart Association (12GRNT12040170 to Y.-B. Kim), Showalter Trust (89829 to J. Shi), Hankyong National University for academic exchange program (in 2009 to K. Choi), and the Catholic Medical Center Research Foundation (in 2013 to S.-H. Lee). I. S. Lima is a recipient of FCT fellowship from Portugal (SFRH/BD/71021/2010).
REFERENCES
- 1.Ahima RS. Digging deeper into obesity. J Clin Invest 121: 2076–2079, 2011 [DOI] [PMC free article] [PubMed] [Google Scholar]
- 2.Begum N, Sandu OA, Ito M, Lohmann SM, Smolenski A. Active Rho kinase (ROK-alpha) associates with insulin receptor substrate-1 and inhibits insulin signaling in vascular smooth muscle cells. J Biol Chem 277: 6214–6222, 2002 [DOI] [PubMed] [Google Scholar]
- 3.Bluher M, Michael MD, Peroni OD, Ueki K, Carter N, Kahn BB, Kahn CR. Adipose tissue selective insulin receptor knockout protects against obesity and obesity-related glucose intolerance. Dev Cell 3: 25–38, 2002 [DOI] [PubMed] [Google Scholar]
- 4.Cannon B, Nedergaard J. Brown adipose tissue: function and physiological significance. Physiol Rev 84: 277–359, 2004 [DOI] [PubMed] [Google Scholar]
- 5.Chawla A, Nguyen KD, Goh YP. Macrophage-mediated inflammation in metabolic disease. Nat Rev Immunol 11: 738–749, 2011 [DOI] [PMC free article] [PubMed] [Google Scholar]
- 6.Chazenbalk G, Bertolotto C, Heneidi S, Jumabay M, Trivax B, Aronowitz J, Yoshimura K, Simmons CF, Dumesic DA, Azziz R. Novel pathway of adipogenesis through cross-talk between adipose tissue macrophages, adipose stem cells and adipocytes: evidence of cell plasticity. PLoS One 6: e17834, 2011 [DOI] [PMC free article] [PubMed] [Google Scholar]
- 7.Chun KH, Araki K, Jee Y, Lee DH, Oh BC, Huang H, Park KS, Lee SW, Zabolotny JM, Kim YB. Regulation of glucose transport by ROCK1 differs from that of ROCK2 and is controlled by actin polymerization. Endocrinology 153: 1649–1662, 2012 [DOI] [PMC free article] [PubMed] [Google Scholar]
- 8.Chun KH, Choi KD, Lee DH, Jung Y, Henry RR, Ciaraldi TP, Kim YB. In vivo activation of ROCK1 by insulin is impaired in skeletal muscle of humans with type 2 diabetes. Am J Physiol Endocrinol Metab 300: E536–E542, 2011 [DOI] [PMC free article] [PubMed] [Google Scholar]
- 9.DeFronzo RA. Pathogenesis of type 2 diabetes : metabolic and molecular implications for identifying diabetes. Diabetes Rev 5: 177–269, 1997 [Google Scholar]
- 10.Eguchi J, Wang X, Yu S, Kershaw EE, Chiu PC, Dushay J, Estall JL, Klein U, Maratos-Flier E, Rosen ED. Transcriptional control of adipose lipid handling by IRF4. Cell Metab 13: 249–259, 2011 [DOI] [PMC free article] [PubMed] [Google Scholar]
- 11.Flegal KM, Carroll MD, Kit BK, Ogden CL. Prevalence of obesity and trends in the distribution of body mass index among US adults, 1999–2010. JAMA 307: 491–497, 2012 [DOI] [PubMed] [Google Scholar]
- 12.Furukawa N, Ongusaha P, Jahng WJ, Araki K, Choi CS, Kim HJ, Lee YH, Kaibuchi K, Kahn BB, Masuzaki H, Kim JK, Lee SW, Kim YB. Role of Rho-kinase in regulation of insulin action and glucose homeostasis. Cell Metab 2: 119–129, 2005 [DOI] [PubMed] [Google Scholar]
- 13.Haas B, Mayer P, Jennissen K, Scholz D, Berriel Diaz M, Bloch W, Herzig S, Fassler R, Pfeifer A. Protein kinase G controls brown fat cell differentiation and mitochondrial biogenesis. Sci Signal 2: ra78, 2009 [DOI] [PubMed] [Google Scholar]
- 14.Hara Y, Wakino S, Tanabe Y, Saito M, Tokuyama H, Washida N, Tatematsu S, Yoshioka K, Homma K, Hasegawa K, Minakuchi H, Fujimura K, Hosoya K, Hayashi K, Nakayama K, Itoh H. Rho and Rho-kinase activity in adipocytes contributes to a vicious cycle in obesity that may involve mechanical stretch. Sci Signal 4: ra3, 2011 [DOI] [PubMed] [Google Scholar]
- 15.Herman MA, Peroni OD, Villoria J, Schon MR, Abumrad NA, Bluher M, Klein S, Kahn BB. A novel ChREBP isoform in adipose tissue regulates systemic glucose metabolism. Nature 484: 333–338, 2012 [DOI] [PMC free article] [PubMed] [Google Scholar]
- 16.Hu E, Lee D. Rho kinase as potential therapeutic target for cardiovascular diseases: opportunities and challenges. Expert Opin Ther Targets 9: 715–736, 2005 [DOI] [PubMed] [Google Scholar]
- 17.Huang H, Kong D, Byun K, Ye C, Koda S, Lee D, Oh B, Lee S, Lee B, Zabolotny J, Kim M, Bjorbaek C, Lowell B, Kim Y. Rho-kinase regulates energy balance by targeting hypothalamic leptin receptor signaling. Nat Neurosci 15: 1391–1398, 2012 [DOI] [PMC free article] [PubMed] [Google Scholar]
- 18.Huang H, Lee DH, Zabolotny JM, Kim YB. Metabolic actions of Rho-kinase in periphery and brain. Trends Endocrinol Metab 24: 506–514, 2013 [DOI] [PMC free article] [PubMed] [Google Scholar]
- 19.Huang H, Lee SH, Ye C, Lima IS, Oh BC, Lowell BB, Zabolotny JM, Kim YB. ROCK1 in AgRP neurons regulates energy expenditure and locomotor activity in male mice. Endocrinology 154: 3660–3670, 2013 [DOI] [PMC free article] [PubMed] [Google Scholar]
- 20.Hyakukoku M, Higashiura K, Ura N, Murakami H, Yamaguchi K, Wang L, Furuhashi M, Togashi N, Shimamoto K. Tissue-specific impairment of insulin signaling in vasculature and skeletal muscle of fructose-fed rats. Hypertens Res 26: 169–176, 2003 [DOI] [PubMed] [Google Scholar]
- 21.Ishizaki T, Maekawa M, Fujisawa K, Okawa K, Iwamatsu A, Fujita A, Watanabe N, Saito Y, Kakizuka A, Morii N, Narumiya S. The small GTP-binding protein Rho binds to and activates a 160 kDa Ser/Thr protein kinase homologous to myotonic dystrophy kinase. EMBO J 15: 1885–1893, 1996 [PMC free article] [PubMed] [Google Scholar]
- 22.Kabuyama Y, Langer SJ, Polvinen K, Homma Y, Resing KA, Ahn NG. Functional proteomics identifies protein-tyrosine phosphatase 1B as a target of RhoA signaling. Mol Cell Proteomics 5: 1359–1367, 2006 [DOI] [PubMed] [Google Scholar]
- 23.Kahn BB. Type 2 diabetes: when insulin secretion fails to compensate for insulin resistance. Cell 92: 593–596, 1998 [DOI] [PubMed] [Google Scholar]
- 24.Kanda T, Wakino S, Homma K, Yoshioka K, Tatematsu S, Hasegawa K, Takamatsu I, Sugano N, Hayashi K, Saruta T. Rho-kinase as a molecular target for insulin resistance and hypertension. FASEB J 20: 169–171, 2006 [DOI] [PubMed] [Google Scholar]
- 25.Kato Y, Ozaki N, Yamada T, Miura Y, Oiso Y. H-89 potentiates adipogenesis in 3T3–L1 cells by activating insulin signaling independently of protein kinase A. Life Sci 80: 476–483, 2007 [DOI] [PubMed] [Google Scholar]
- 26.Kikuchi Y, Yamada M, Imakiire T, Kushiyama T, Higashi K, Hyodo N, Yamamoto K, Oda T, Suzuki S, Miura S. A Rho-kinase inhibitor, fasudil, prevents development of diabetes and nephropathy in insulin-resistant diabetic rats. J Endocrinol 192: 595–603, 2007 [DOI] [PubMed] [Google Scholar]
- 27.Kim YB, Shulman GI, Kahn BB. Fatty acid infusion selectively impairs insulin action on Akt1 and protein kinase C lambda/zeta but not on glycogen synthase kinase-3. J Biol Chem 277: 32915–32922, 2002 [DOI] [PubMed] [Google Scholar]
- 28.Klaman LD, Boss O, Peroni OD, Kim JK, Martino JL, Zabolotny JM, Moghal N, Lubkin M, Kim YB, Sharpe AH, Stricker-Krongrad A, Shulman GI, Neel BG, Kahn BB. Increased energy expenditure, decreased adiposity, and tissue-specific insulin sensitivity in protein-tyrosine phosphatase 1B-deficient mice. Mol Cell Biol 20: 5479–5489, 2000 [DOI] [PMC free article] [PubMed] [Google Scholar]
- 29.Kolavennu V, Zeng L, Peng H, Wang Y, Danesh FR. Targeting of RhoA/ROCK signaling ameliorates progression of diabetic nephropathy independent of glucose control. Diabetes 57: 714–723, 2008 [DOI] [PubMed] [Google Scholar]
- 30.Lara-Castro C, Garvey WT. Intracellular lipid accumulation in liver and muscle and the insulin resistance syndrome. Endocrinol Metab Clin North Am 37: 841–856, 2008 [DOI] [PMC free article] [PubMed] [Google Scholar]
- 31.Lee DH, Shi J, Jeoung NH, Kim MS, Zabolotny JM, Lee SW, White MF, Wei L, Kim YB. Targeted disruption of ROCK1 causes insulin resistance in vivo. J Biol Chem 284: 11776–11780, 2009 [DOI] [PMC free article] [PubMed] [Google Scholar]
- 32.Lee YJ, Hsu TC, Du JY, Valentijn AJ, Wu TY, Cheng CF, Yang Z, Streuli CH. Extracellular matrix controls insulin signaling in mammary epithelial cells through the RhoA/Rok pathway. J Cell Physiol 220: 476–484, 2009 [DOI] [PubMed] [Google Scholar]
- 33.Leung T, Manser E, Tan L, Lim L. A novel serine/threonine kinase binding the Ras-related RhoA GTPase which translocates the kinase to peripheral membranes. J Biol Chem 270: 29051–29054, 1995 [DOI] [PubMed] [Google Scholar]
- 34.MacDougald OA, Lane MD. Transcriptional regulation of gene expression during adipocyte differentiation. Annu Rev Biochem 64: 345–373, 1995 [DOI] [PubMed] [Google Scholar]
- 35.Matsui T, Amano M, Yamamoto T, Chihara K, Nakafuku M, Ito M, Nakano T, Okawa K, Iwamatsu A, Kaibuchi K. Rho-associated kinase, a novel serine/threonine kinase, as a putative target for small GTP binding protein Rho. EMBO J 15: 2208–2216, 1996 [PMC free article] [PubMed] [Google Scholar]
- 36.Mishra RK, Alokam R, Sriram D, Yogeeswari P. Potential role of Rho kinase inhibitors in combating diabetes-related complications including diabetic neuropathy—a review. Curr Diabetes Rev 29: 601–608, 2013 [DOI] [PubMed] [Google Scholar]
- 37.Nakagawa O, Fujisawa K, Ishizaki T, Saito Y, Nakao K, Narumiya S. ROCK-I and ROCK-II, two isoforms of Rho-associated coiled-coil forming protein serine/threonine kinase in mice. FEBS Lett 392: 189–193, 1996 [DOI] [PubMed] [Google Scholar]
- 38.Nishimura S, Manabe I, Nagasaki M, Hosoya Y, Yamashita H, Fujita H, Ohsugi M, Tobe K, Kadowaki T, Nagai R, Sugiura S. Adipogenesis in obesity requires close interplay between differentiating adipocytes, stromal cells, and blood vessels. Diabetes 56: 1517–1526, 2007 [DOI] [PubMed] [Google Scholar]
- 39.Noguchi M, Hosoda K, Fujikura J, Fujimoto M, Iwakura H, Tomita T, Ishii T, Arai N, Hirata M, Ebihara K, Masuzaki H, Itoh H, Narumiya S, Nakao K. Genetic and pharmacological inhibition of Rho-associated kinase II enhances adipogenesis. J Biol Chem 282: 29574–29583, 2007 [DOI] [PubMed] [Google Scholar]
- 40.Ouchi N, Parker JL, Lugus JJ, Walsh K. Adipokines in inflammation and metabolic disease. Nat Rev Immunol 11: 85–97, 2011 [DOI] [PMC free article] [PubMed] [Google Scholar]
- 41.Prada PO, Coelho MS, Zecchin HG, Dolnikoff MS, Gasparetti AL, Furukawa LN, Saad MJ, Heimann JC. Low salt intake modulates insulin signaling, JNK activity and IRS-1ser307 phosphorylation in rat tissues. J Endocrinol 185: 429–437, 2005 [DOI] [PubMed] [Google Scholar]
- 42.Riento K, Guasch RM, Garg R, Jin B, Ridley AJ. RhoE binds to ROCK I and inhibits downstream signaling. Mol Cell Biol 23: 4219–4229, 2003 [DOI] [PMC free article] [PubMed] [Google Scholar]
- 43.Shi J, Wu X, Surma M, Vemula S, Zhang L, Yang Y, Kapur R, Wei L. Distinct roles for ROCK1 and ROCK2 in the regulation of cell detachment. Cell Death Dis 4: e483, 2013 [DOI] [PMC free article] [PubMed] [Google Scholar]
- 44.Song P, Zhang M, Wang S, Xu J, Choi HC, Zou MH. Thromboxane A2 receptor activates a Rho-associated kinase/LKB1/PTEN pathway to attenuate endothelium insulin signaling. J Biol Chem 284: 17120–17128, 2009 [DOI] [PMC free article] [PubMed] [Google Scholar] [Retracted]
- 45.Sordella R, Classon M, Hu KQ, Matheson SF, Brouns MR, Fine B, Zhang L, Takami H, Yamada Y, Settleman J. Modulation of CREB activity by the Rho GTPase regulates cell and organism size during mouse embryonic development. Dev Cell 2: 553–565, 2002 [DOI] [PubMed] [Google Scholar]
- 46.Thirone AC, Carvalheira JB, Hirata AE, Velloso LA, Saad MJ. Regulation of Cbl-associated protein/Cbl pathway in muscle and adipose tissues of two animal models of insulin resistance. Endocrinology 145: 281–293, 2004 [DOI] [PubMed] [Google Scholar]
- 47.Wheeler AP, Ridley AJ. Why three Rho proteins? RhoA, RhoB, RhoC, and cell motility. Exp Cell Res 301: 43–49, 2004 [DOI] [PubMed] [Google Scholar]
- 48.Wingard C, Fulton D, Husain S. Altered penile vascular reactivity and erection in the Zucker obese-diabetic rat. J Sex Med 4: 348–362; discussion 362–373, 2007 [DOI] [PubMed] [Google Scholar]
- 49.Ye J. Mechanisms of insulin resistance in obesity. Front Med 7: 14–24, 2013 [DOI] [PMC free article] [PubMed] [Google Scholar]
- 50.Zabolotny JM, Haj FG, Kim YB, Kim HJ, Shulman GI, Kim JK, Neel BG, Kahn BB. Transgenic overexpression of protein-tyrosine phosphatase 1B in muscle causes insulin resistance, but overexpression with leukocyte antigen-related phosphatase does not additively impair insulin action. J Biol Chem 279: 24844–24851, 2004 [DOI] [PubMed] [Google Scholar]
- 51.Zhang YM, Bo J, Taffet GE, Chang J, Shi J, Reddy AK, Michael LH, Schneider MD, Entman ML, Schwartz RJ, Wei L. Targeted deletion of ROCK1 protects the heart against pressure overload by inhibiting reactive fibrosis. FASEB J 20: 916–925, 2006 [DOI] [PubMed] [Google Scholar]