Abstract
Mapping the dynamics of neural source processes critically involved in initiating and propagating seizure activity is important for effective epilepsy diagnosis, intervention, and treatment. Tracking time-varying shifts in the oscillation modes of an evolving seizure may be useful for both seizure onset detection as well as for improved non-surgical interventions such as microstimulation. In this report we apply a multivariate eigendecomposition method to analyze the time-varying principal oscillation patterns (POPs, or eigenmodes) of maximally-independent (ICA) sources of intracranial EEG data recorded from subdural electrodes implanted in a human patient for evaluation of surgery for epilepsy. Our analysis of a subset of the most dynamically important eigenmodes reveals distinct shifts in characteristic frequency and damping time before, throughout, and following seizures providing insight into the dynamical structure of the system throughout seizure evolution.
I. Introduction
Nearly 5% of patients with epilepsy are potential candidates for surgical treatment. Surgery for epilepsy can have a good chance of success if the brain region(s) generating seizures can be accurately localized. For this purpose, in selected cases recordings are acquired using intracranial (subdural and/or depth electrode) recording for pre-surgical evaluation. In previous work [1], we examined the spatial and time-frequency dynamics of seizure generation and propagation in an intracranial EEG recording by Dr. Worrell at the Mayo Clinic (Rochester MN) using adaptive vector autoregressive (VAR) models fit to source activations obtained from Independent Component Analysis. We reported multiple seizure stages corresponding to distinct shifts in the spatial distribution of sources and inter-source connectivity as well as spectral frequency of interaction. To better understand the oscillatory structure of these seizure stages, in this paper we extend our previous analysis and perform an eigendecomposition of the VAR model into a system of decoupled oscillators and relaxators (eigenmodes) with characteristic damping times and frequencies. Our anaysis of a low-dimensional subset of the most dynamically important eigenmodes reveals distinct shifts in principal oscillation patterns before, during, and after the seizure with progressive frequency slowing from beta through alpha, theta, and finally post-ictal delta. These shifts are temporally consistent with previously reported changes in spatial source distributions and effective connectivity in this patient [1], [2]. We suggest that examination of dynamically important eigenmodes may be useful for identification of ictal onset while also providing valuable insight into the principal resonance frequencies and dynamical structure of the system during distinct stages of the seizure. To our knowledge, this is the first such application of multivariate eigendecomposition to intracranial source data.
II. Theory
A. Vector autoregressive modeling
Assuming that X = [x1 … xT] is an M-dimensional zero-mean weakly-stationary stochastic process of length T, we can describe the linear dynamics of the state vector as a vector autoregressive (VAR[p]) process of order p:
| (1) |
where is a zero-mean white noise process with covariance matrix .
The coefficient matrices, Al, can be estimated using a number of approaches, including multivariate ordinary and stepwise least-squares approaches, lattice algorithms (e.g. Vieira-Morf) or state-space models (Kalman filtering) [3]. Neumaier and Schneider [4] provide an efficient stepwise least-squares algorithm which we use here. To handle non-stationary data, we model the time-varying cortical dynamics using a simple segmentation approach in which we fit separate VAR[p] models to a sequence of highly-overlapping locally-stationary windows [6].
B. Decomposition of a dynamical system into eigenmodes
Using the eigendecomposition method of Neumaier and Schneider [7], it can be shown that a stable M-dimensional VAR[p] model can be decomposed into Mp, M-dimensional decoupled eigenmodes, which can each be characterized as an oscillator or relaxator with a characteristic frequency and damping time. The dynamics of the eigenmodes can be described by a system of Mp univariate VAR[1] models coupled only by the covariance of the noise terms. Analysis of the eigenmodes can provide insight into the linear dynamics of the system under observation.
In brief, we begin by noting that the VAR[p] process described in equation 1 is equivalent to the VAR[1] process.
| 2 |
with augmented noise vector and augmented state vector and with coefficient matrix
and singular noise covariance matrix
Note that represents a delay embedding of the original state vectors xt. If is nonsingular then where the columns of Q are the eigenvectors (eigenmodes) of and Λ = diag(λk) for k = {1;…;Mp} is the associated diagonal matrix of eigenvalues. The original state and noise vectors can then be represented as , with eigenmode coefficient vector and noise vector . Note that is a linear transformation of the delay-embedded state vectors into the coordinate system of the eigenvector basis. Substituting these expansions into Eq. 2 for the VAR[1] model, and using the diagonality of Λ, we can represent the coefficient vectors, as a system of univariate VAR[1] models which are coupled only via the transformed, augmented covariance matrix of the noise coefficients: .
In the complex plane, the expected values of the eigenmode coefficients describe a spiral with damping time and characteristic frequency . Here Fs denotes the sampling rate of the time series. The damping time (also known as the e-folding time [8]) denotes the time required (here in units of seconds) for an initial amplitude to decay to . As Von Storch notes in his review on POP analysis [8], an eigenmode analysis using the linear, stationary model (Eq. 2) preferentially “sees” an oscillation in its mature state when noise is relatively small and damping is due to nonlinear and other, unobserved, processes. The damping time (which is positive and bounded for a stable VAR model) provides a statistical measure of how long, on average, the signal is seen before stochastic noise, as well as unobserved or nonlinear dynamical processes become more and more important.
An eigenmode with eigenvalue λ can be characterized as a stochastically forced oscillator if λ is either complex or negative and real. Conversely, if λ is real and positive, the eigenmode is characterized as a relaxator with characteristic frequency fλ = 0. In contrast to a damped oscillator, which oscillates about its mean while decaying from an initial value towards zero, a relaxator simply decays exponentially towards zero.
The variance of the amplitudes of the kth eigenmode coefficients (excitations) can be interpreted as the dynamical importance of the kth eigenmode Q:k. Analysis of the most dynamically important eigenmodes can help elucidate the global dynamical structure of the system.
III. Data Collection and Modeling
Intracranial EEG was collected from a patient undergoing presurgical evaluation at The Mayo Clinic (Rochester, MN). The patient presented with seizures due to a porencephalic cyst in the fronto-parietal brain. Seventy-eight channel iEEG data was collected at a sampling rate of 500 Hz during drowsy resting. We selected for analysis a 16-minute epoch of data containing two seizure bursts, each lasting about 2 minutes. The data were decomposed by extended Infomax ICA [9] into 78 maximally-independent processes. By visual inspection, 16 ICs were identified as exhibiting clear epileptiform activity; remaining ICs were ignored for present purposes. For additional details see [10], [11], [1].
The time courses of the ictal ICs were downsampled to 256 Hz after application of a zero-phase FIR antialiasing filter. Each IC activation sequence was then independently z-normalized. A 16-dimensional VAR[7] model was fit to the normalized IC activations using ARFIT stepwise least-squares [4]. An adaptive model was realized using a 15-sec sliding window with 1-s step size. The model order (p=7) was selected based on inspection of the distribution, over all windows, of model orders that minimized the Hannan-Quinn information criterion [5].
IV. Results
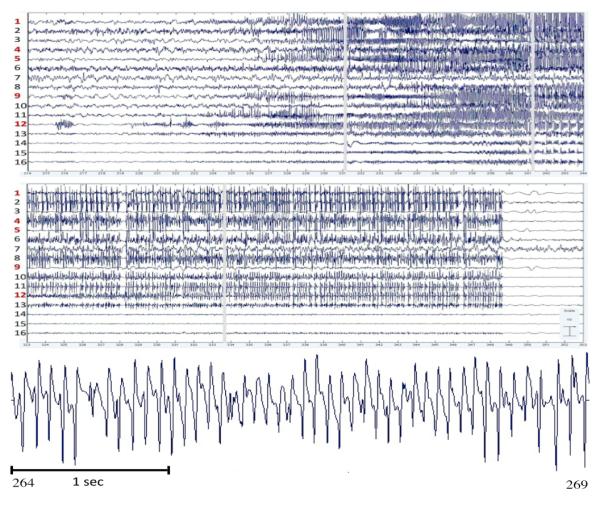
Figure 1 shows the time course of activations of the selected ICs during onset (top left) and offset (top right) of the first seizure. The seizure terminates abruptly at 349.5 seconds. The lower panel shows 6 seconds of mid-seizure activity from a representative IC. Note the prominent damped alpha and beta oscillations.
Fig. 1.

Time course of activations of selected ICs during first seizure onset (top) and offset (middle). Time units are in seconds. Bottom panel shows 6 seconds of mid-seizure activity from IC11.
A. Stability analysis
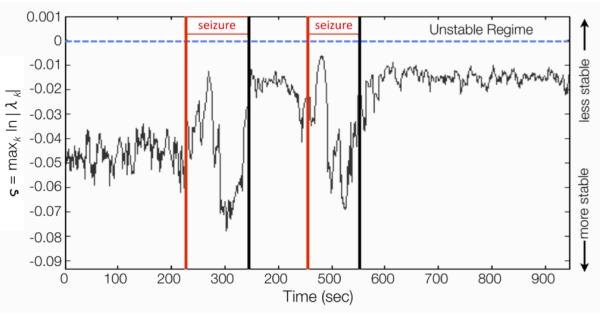
A VAR[p] model is stable (and by implication stationary) if the roots of its reverse characteristic polynomial lie outside the unit circle. This is equivalent to all eigenvalues of having modulus less than 1 [3]. Figure 2 plots the stability index ς = maxk ln∣λk∣ of the fitted model for each window. Note that the process is stable for all time, but starts to lose stability in the first part of the seizure, becomes highly stable in the mid-end of the seizure, and plateaus at near-instability during the inter-ictal and post-ictal periods.
Fig. 2.

Results of stability analysis. Vertical lines indicate seizure periods.
B. Eigenmode analysis
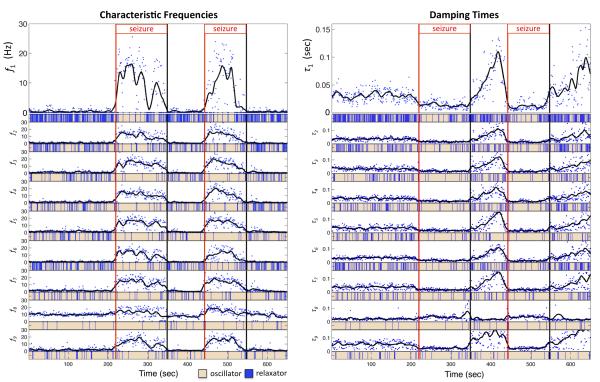
For each time window, the VAR[7] model was subjected to an eigendecomposition producing 112 eigenmodes sorted in descending order by variance. Figure 3 shows the time-varying characteristic frequencies (left) and damping times (right) of the nine (8%) most dynamically important eigenmodes (plotted as blue dots). These quantities were also smoothed with a LOWESS (Locally Weighted Scatterplot Smoothing) regression [14] using a span of 20 points (black curve). Beneath each panel is indicated whether the eigenmode in the corresponding time window is characterized as a relaxator (blue) or oscillator (peach).
Fig. 3.
Characteristic frequencies and damping times for the 8% most dynamically important eigenmodes, in descending order of importance. Red (black) vertical lines denote onset (offset) of seizure. Solid black curves represent lowess smoothing of individual characteristic frequencies and damping times (blue dots). Beneath each panel is indicated, for each time window, whether the respective eigenmode is a relaxator (blue) or oscillator (peach).
Examining first the characteristic frequencies (Fig. 3-left), we see that, in the pre-ictal period, the majority of the leading eigenmodes are either characterized predominantly as relaxators or low-frequency oscillators (0.5-3 Hz). This is reasonable since the spectrum of drowsy resting EEG follows a power law (1/fN) with N ≥ 2 and infraslow fluctuations dominate. However, another characteristic of resting EEG is alpha rhythms (7-13 Hz). Interestingly, one of the dominant eigenmodes (row 8) appears to be an 8-12 Hz oscillator. At ictal onset we see most of the leading eigenmodes dramatically shift to beta-band (12-25 Hz) oscillators. In a previous report we examined the time-varying power spectrum and frequency-domain Granger causality of this VAR model and found that, in the early part of the seizure, the power and causal interactions were predominantly concetrated in the beta band [1]. Several leading eigenmodes show a brief mid-seizure (t ≈ 270 sec, seizure 1) collapse in characteristic frequency to an alpha or delta-theta mode followed by a return to a slightly slower beta oscillation. This period corresponds to a sharp reversal in the direction of information flow within a frontal ictogenic network [1]. Towards the end of the seizure (t ≈ 300 sec), for several eigenmodes, we see a second sharp decrease in characteristic frequency, a return to a slower 8-15 Hz oscillatory mode, followed by a smooth decline back to a low-frequency oscillator/relaxator mode at ictal offset. This third ictal stage corresponds to the time period when the information flow dynamics switch from more local interaction to more global interaction. The inter-ictal period following the first seizure is again dominated by infraslow (< 1 Hz) oscillatory or relaxatory dynamics, which is consistent with the surpressed neuronal state commonly observed following periods of intense ictal activity. The second seizure is similar to the first, exibiting a consistent slowing from beta to delta as the seizure progresses.
The damping time of dominant eigenmodes is significantly decreased during the seizure followed by a dramatic post-seizure increase in damping time. The short damping time during seizure may reflect compensatory inhibitory mechanisms as the system strives to maintain stability. As seen for IC11 in Figure 1, ictal beta and alpha oscillations appear to be highly damped, exhibiting significant amplitude modulation with bursts lasting 1-2 seconds. In contrast, during the inter- and post-ictal periods, the data is dominated by infra-slow oscillations which may take a long time to decay to a small fraction of their original amplitude. It is worth noting that another brief report which applied univariate eigendecomposition independently to two channels of scalp EEG data, reported similarly reduced damping time during seizure [12].
The alpha eigenmode (row 8) stands out amongst the other modes. Although it exhibits a slight shift to the beta band during the seizure, it returns to an alpha rhythm during the inter-ictal and post-ictal periods. Furthermore, the damping time appears only weakly perturbed by the seizure. This is significant as this eigenmode may reflect the natural background alpha rhythm seen in healthy cortical tissue and thus could be separated from eigenmodes which are more clearly seizure-related. In general, identifying and analyzing only dominant eigenmodes which exhibit dramatic shifts in characteristic frequency or damping time may prove useful in separating pathological from non-pathological activity, improving detection of seizure onset and identification of ictal resonance frequencies for stimulation-based interventions.
V. Conclusions and Future Work
In this paper we analyzed neuronal dynamics during epileptic seizures using adaptive multivariate autoregressive models applied to maximally-independent (ICA) sources of intracranial EEG data recorded from subdural electrodes implanted in a human patient for presurgery monitoring. Analysis of the time-varying characteristics of the most dynamically important eigenmodes of the system revealed a prominent shift in the principal oscillation patterns from relaxatory and/or low-frequency oscillatory dynamics with a moderate damping time to beta oscillatory dynamics with low damping time at seizure onset followed by multiple stages of progressive slowing of principal oscillation frequencies throughout the seizure. While this analysis is novel in the context of intracranial seizure data analysis, this paper represents a preliminary investigation into the topic and these results must be verified in additional patients. The temporal resolution and suitability of the VAR model may be improved through the use of dual extended or cubature Kalman filtering or sparse VAR modeling. It will also be fruitful to examine the contributions of eigenmodes to each IC source to allow spatial identification of sources exhibiting pathological shifts in frequency and damping time characteristics. Finally, we plan to combine the results of this paper and previously published work to examine the relationships between the observed resonant frequency modes and local and long-range feedforward and feedback influences in seizure propagation.
Acknowledgments
Thanks to Zeynep Akalin Acar for data preprocessing and ICA decomposition. This paper used modified routines from the ARFIT [4] software package as well as the first author’s SIFT software package [13].
This work is supported by San Diego and Gluskho Fellowships and by a gift from The Swartz Foundation (Old Field, NY)
Contributor Information
Tim Mullen, Department of Cognitive Science and Swartz Center for Computational Neuroscience (SCCN), Institute for Neural Computation (INC), UCSD tim@sccn.ucsd.edu.
Gregory Worrell, Faculty Department of Neurology, The Mayo Clinics, Rochester MN, USA Gregory.Worrell@mayo.edu.
Scott Makeig, SCCN, INC, UCSD scott@sccn.ucsd.edu.
References
- [1].Mullen T, Acar ZA, Worrell G, Makeig S. Modeling Cortical Source Dynamics and Interactions During Seizure. IEEE EMBC. 2011:1411–14. doi: 10.1109/IEMBS.2011.6090332. [DOI] [PMC free article] [PubMed] [Google Scholar]
- [2].Acar ZA, Palmer J, Worrell G, Makeig S. Electrocortical source imaging of intracranial EEG data in epilepsy. EMBC. 2011:3909–12. doi: 10.1109/IEMBS.2011.6090971. [DOI] [PMC free article] [PubMed] [Google Scholar]
- [3].Lütkepohl H. New Introduction to Multiple Time Series Analysis. Springer; Berlin, Germany: 2006. [Google Scholar]
- [4].Schneider T, Neumaier A. Algorithm 808: ARfit–a matlab package for the estimation of parameters and eigenmodes of multivariate autoregressive models. ACM TOMS. 2001;27(1):58–65. [Google Scholar]
- [5].Hannan EJ, Quinn BG. The Determination of the Order of an Autoregression. Journal of the Royal Statistical Society B. 1979;41:190–195. [Google Scholar]
- [6].Jansen BH, Bourne JR, Ward JW. Autoregressive estimation of short segment spectra for computerized EEG analysis. IEEE Trans. on Biomedical Engineering. 1981;28(9):630–8. doi: 10.1109/TBME.1981.324753. [DOI] [PubMed] [Google Scholar]
- [7].Neumaier A, Schneider T. Estimation of parameters and eigenmodes of multivariate autoregressive models. ACM Trans. On Mathematical Software (TOMS) 2001;27(1):27–57. [Google Scholar]
- [8].von Storch H, Burger G, Schnur R, von Storch J. Principal Oscillation Patterns: A Review. Journal of Climate. 1995;8(3):377–400. [Google Scholar]
- [9].Lee TW, Girolami M, Sejnowski TJ. Independent component analysis using an extended infomax algorithm for mixed subgaussian and supergaussian sources. Neural computation. 1999;11(2):417–41. doi: 10.1162/089976699300016719. [DOI] [PubMed] [Google Scholar]
- [10].Acar ZA, Makeig S, Worrell G. Head modeling and cortical source localization in epilepsy. IEEE EMBC. 2008:3763–6. doi: 10.1109/IEMBS.2008.4650027. [DOI] [PubMed] [Google Scholar]
- [11].Acar ZA, Worrell G, Makeig S. Patch-based cortical source imaging in epilepsy. IEEE EMBC. 2009:293033. doi: 10.1109/IEMBS.2009.5333992. [DOI] [PMC free article] [PubMed] [Google Scholar]
- [12].Li X, Guan X, Du R. Using Damping Time for Epileptic Seizures Detection in EEG. 5th IFAC Symposium on Modeling and Control in Biomedical Systems.2003. pp. 255–8. [Google Scholar]
- [13].Delorme A, Mullen T, Kothe C, Acar ZA, Shamlo NB, Vankov A, Makeig S. EEGLAB, SIFT, NFT, BCILAB, and ERICA: New tools for advanced EEG/MEG processing. Computational Intelligence and Neuroscience. vol. 2011:12. doi: 10.1155/2011/130714. Article ID 130714. pages. [DOI] [PMC free article] [PubMed] [Google Scholar]
- [14].Cleveland WS. LOWESS: A program for smoothing scatterplots by robust locally weighted regression. The American Statistician. 1981;35(54) [Google Scholar]


