

Abstract
Our behavior is powerfully driven by environmental cues that signal the availability of rewarding stimuli. We frequently encounter stimuli—a bowl of candy or an alert from our smartphone—that trigger actions to obtain those rewards, even though there may be positive outcomes associated with not acting. The inability to restrain one's action in the presence of reward-associated cues is one type of impulsive behavior and a component of such maladaptive behaviors as overeating, gambling, and substance abuse. The nucleus accumbens (NAc) is ideally situated to integrate multiple cognitive and affective inputs to bias action via outputs through the basal ganglia. NAc neurons have been shown to respond to cues that predict reward availability, goal-directed behaviors aimed at obtaining them, and delivery of the reward itself. As these processes are typically associated, it is difficult to discern whether signals in the NAc are more closely related to processing reward-predictive aspects of goal-directed behavior or selection of behavioral response. To dissociate these possibilities, we recorded the activity of NAc neurons while rats performed a task in which two different cues both informed rats of reward availability but required them to either press a lever (Go) or withhold pressing (NoGo) to obtain the reward. Individual cue-responsive neurons showed either increases or decreases in activity at cue onset. Increases in activity were larger, and decreases smaller, when rats withheld lever pressing, whether correctly for NoGo trials or in error on Go trials. Thus NAc cue responses correlated with action, regardless of cue type or accuracy.
Keywords: nucleus accumbens, rodent, executive control, reward
animals should adaptively navigate their environment by approaching beneficial, and avoiding harmful, stimuli. However, even when restraint may be a more beneficial course of action, we often have difficulty in suppressing our approach for immediately rewarding stimuli. This impulsivity is a multidimensional construct that likely has several underlying processes governed by distributed neural systems (de Wit 2009). One aspect of impulsivity is the incapacity to restrain a behavioral response to a potent cue, which is manifested in patients with attention deficit hyperactivity disorder, drug addiction, and obesity (Volkow et al. 2012) as well as in “healthy” populations (Hamidovic et al. 2009).
Fronto-striatal systems are thought to play multiple, critical roles in approach behavior, with prefrontal cortical regions computing the value of goals (Padoa-Schioppa and Cai 2011; Schoenbaum et al. 2011) and actions (Roitman and Roitman 2010) and the striatum biasing motor sequences (Jin and Costa 2010; Kravitz et al. 2010; Pavuluri et al. 2012). The nucleus accumbens (NAc) is a striatal subterritory long associated with goal-directed behavior and approach. Disruption of NAc function impairs both Pavlovian approach and operant behavior (Ambroggi et al. 2011; Blaiss and Janak 2009; Cardinal et al. 2002). Pharmacological studies point to NAc in the control of appropriate versus inappropriate responding, suggesting a likely role in impulsive behavior (Ambroggi et al. 2011; Basar et al. 2010; Wiskerke et al. 2011). Moreover, individual neurons within the NAc respond to the receipt of rewards, the cues that predict them, and operant approach behaviors to obtain them (Carelli 2004; Day et al. 2006; Nicola et al. 2004). NAc neurons respond to such salient events with phasic changes in activity, which appear to play different roles in reward-directed behaviors (Ambroggi et al. 2011; Krause et al. 2010; Roitman et al. 2005; Taha and Fields 2006).
The degree to which NAc neurons signal contingencies between predictive environmental stimuli and expectations about outcome, goal-directed actions, and the outcomes themselves remains unclear. Go/NoGo paradigms have been widely used to study the mechanisms of behavioral inhibition, but these tasks often confound the reward-predictive nature of cues with the appropriate behavioral response. In all Go/NoGo tasks, the Go cue instructs approach behavior for reward, so that neural responses to Go cues may be related to the reward-predictive nature of the cue, the planned approach behavior, or both. In contrast, NoGo cues typically promote an omission of approach behavior either to avoid an aversive outcome (Mirenowicz and Schultz 1996; Setlow et al. 2003) or because the behavior is unrewarded (Bouret and Sara 2004; Brown et al. 2011; Nicola et al. 2004). In these cases, the reward outcomes associated with Go and NoGo behavioral responses differ. Alternatives to Go/NoGo tasks that require subjects to discriminate between two spatially distinct approach options represent a different potential confound whereby neural responses can depend on the direction of the behavior. This potential directional bias is more likely to be observed in more dorsal subregions of the striatum (Stalnaker et al. 2012).
Here we measured the responses of NAc neurons while rats performed a novel task designed to dissociate the confound between approach behavior to achieve reward and inhibition of behavior to avoid a neutral/aversive outcome. In this symmetrical Go/NoGo paradigm, both Go and NoGo cues predict reward but command different behavioral responses. Rats were trained to press a lever after a Go cue and withhold presses of the same lever after a different NoGo cue. All successful behavioral responses were rewarded, while all failures to approach or withhold appropriately led to a time-out. We recorded the activity of individual NAc neurons during task performance and hypothesized that cue-related activity would not differ between Go and NoGo trials if they encoded reward prediction, as both cues predict reward availability, but would differ if they contributed to the determination of behavioral response. Comparisons of correct and error trials following both Go and NoGo cues lend particular insight as to whether NAc activity is more strongly associated with reward prediction or behavioral response selection.
MATERIALS AND METHODS
Subjects.
Eleven male Sprague-Dawley rats (300–350 g) were individually housed with access to a minimum of 16 g of chow per day and ad libitum water with a 12:12-h light-dark cycle (lights on at 7:00 AM). All experiments were conducted in the light phase between 10:00 AM and 5:00 PM. Animals were treated in accordance with the guidelines put forth by the National Institutes of Health and under the approval of the Animal Care Committee of the University of Illinois at Chicago.
Go/NoGo task.
All testing was conducted in operant chambers housed within a sound-attenuating cubicle, equipped with a house light, white noise generator, tone generator, pellet dispenser, and food receptacle cup, with two retractable operant levers situated to the left and right of the food receptacle and two white cue lights, each located above one lever (Med Associates, St. Albans, VT). Because of the difficulty of the task, training for the Go/NoGo task was conducted in several phases detailed below to shape task performance.
Magazine training.
Rats underwent magazine training during which they received sucrose pellets (45 mg; Bioserv, Frenchtown, NJ) on an imposed variable-interval schedule between 60 and 120 s and were trained under a fixed ratio 1 schedule with one lever (alternating right or left) extended into the operant chamber on each day. When rats reached a criterion of 100 lever presses in <30 min on two consecutive days, they began training for the Go/NoGo task. For each rat, one lever (right or left) was assigned as the Go lever, which was maintained throughout testing and was counterbalanced across rats.
Phase 1: Go+/NoGo− two-lever task.
The goal of this phase of training was to train rats to complete a test session comprised of trials with two behavioral options, to press or to not press. Two operant levers were used, on either side of the central sucrose pellet receptacle, with one designated as “Go” and the other as “NoGo.” Sessions were composed of 100 trials, with 75% Go and 25% NoGo trials selected randomly. Presses of the Go lever were reinforced (+) with the delivery of a sucrose pellet, and presses of the NoGo lever were not reinforced (−). At the start of each daily session, a house light was illuminated in the operant chamber, which was enclosed in a dark, sound-attenuating cubicle. After an intertrial interval (ITI) of 5–13 s, one lever was extended. On Go trials, the Go lever was extended with a cue light illuminated above it and a Go press (correct) was immediately followed by the simultaneous presentation of a brief (0.2 s) tone and the delivery of one 45-mg sucrose pellet. If the rat failed to press (Go-error) within the assigned interval (described below), the lever retracted, the cue light was extinguished, and no reward was delivered, followed by a 40-s time-out period in which the house light was off. On NoGo trials, the second lever in the chamber was extended with no other environmental cues presented. If the rat did not press the NoGo lever (correct) within the assigned interval (described below), the lever retracted and no reward was delivered. If pressed (NoGo-error), the lever retracted, followed by a 40-s time-out period in which the house light was off. At the end of each trial, a new ITI began. On correct trials, the house light remained illuminated through the ITI; on error trials, the beginning of the new trial ITI was signaled by illumination of the house light.
Over the course of 4–5 days, the durations of Go and NoGo lever availability, Dg and Dn, respectively, were adjusted with the goal of setting them at 4 s and 4.5 s, respectively. On the first day Dg was set at 15 s, and as the rat learned to press more quickly it was gradually reduced to 4 s without disrupting performance (as evaluated by Go-errors). Dn was initially set at 1 s and was gradually increased to 4.5 s as the rat learned to withhold pressing of the lever. Thus, at the conclusion of phase 1, rats had a 4-s time window to press the Go lever and a 4.5-s interval in which they had to withhold pressing the NoGo lever. This ensured that the rat could not adopt a strategy of delaying the Go press until the NoGo interval had expired. This phase of training was similar to that of a discriminative stimulus paradigm, in which the Go cue/response was rewarded (DS+) and the NoGo response was not (DS−). Although this paradigm accomplished the goal of training rats to press on Go+ trials but not NoGo− trials, the lack of lever pressing on NoGo− trials occurred because these presses were not associated with reward. Ultimately, our goal was to train rats to withhold pressing in order to obtain a reward.
Phase 2: Go+/NoGo+ two-lever task.
The goal of this phase of training was to train rats to associate NoGo cues with reward (+). In this phase, the following modifications were made to Go and NoGo trials to transition to the final symmetrical Go/NoGo task; otherwise the task sessions were the same. First, a cue light was illuminated above the NoGo lever when it was extended. Second, a 0.5-s white noise cue was assigned as either a Go or a NoGo cue for each rat and was presented simultaneously with presentation of the lever and cue light to which it had been assigned. The auditory cue was added to make the difference between Go and NoGo cues more salient. Third, correct NoGo trials were rewarded with a sucrose pellet. Thus the addition of the white noise, visual NoGo cue, and NoGo reward were used to facilitate association between these cues and their outcomes. Fourth, the timing between cue onset and reward delivery was roughly equated for correct Go and NoGo trials. On correct Go trials reinforcement (tone + pellet) was delivered 4 s after lever press, and on correct NoGo trials reinforcement (tone + pellet) was delivered immediately after lever retraction at 4.5 s. In this manner, the Go cue did not signal an immediately available reward, and rewards were similarly delayed from cue onset for all correct trials.
Symmetrical Go/NoGo task: Go+/NoGo+ single lever.
During testing with the symmetrical Go/NoGo task, all trials began with presentation of the lever that had been assigned as “Go” during training (Fig. 1). Rats were given an instructional cue to press the lever on 75% of trials (Go) by illumination of the cue light above the lever simultaneous with its presentation. The remaining 25% of trials were NoGo, in which the same lever was presented simultaneously with the illumination of the cue light on the opposite side of the central pellet receptacle. This spatially distinct cue light was associated with the NoGo reward in the previous phase of training. For each rat, the 0.5-s white noise stimulus was maintained as a Go or NoGo cue (according to how it was assigned in the previous phase of training) and was presented simultaneously at the onset of that cue.
Fig. 1.
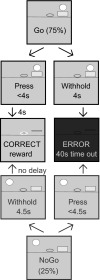
The symmetrical Go/NoGo task dissociates relationship between cue, behavioral response, and outcome. On all trials, the same lever is presented to initiate a trial concurrently with a cue that instructs the rat to either press the lever or withhold pressing to obtain a sucrose pellet reward. On 75% of trials, a Go cue (light above lever) signals the rat to press the lever. If the rat presses the lever within 4 s, it receives a sucrose pellet after a 4-s delay; otherwise, the lever retracts and a 40-s time-out begins during which the house light is extinguished and no trials will be initiated. On the remaining 25% of trials, a NoGo cue (light on opposite side of pellet receptacle from lever) signals the rat to withhold pressing the lever. If the rat successfully withholds pressing for 4.5 s, the lever retracts and the rat immediately receives a sucrose pellet. If the rat presses the lever before the 4.5 s expires, the lever retracts, the house light is extinguished, and a 40-s time-out is initiated. For each rat, an audio cue (0.5 s white noise) is paired with the onset of either the Go cue or the NoGo cue. With this task, trained rats associate both cues with the opportunity to obtain reward but have to control whether to approach and press the lever or withhold this behavioral response.
To summarize, for each rat, one lever was presented on every trial, with a cue light illuminated above it for Go trials and on the opposite side of the pellet tray for NoGo trials, and white noise was presented on either Go or NoGo trials. On Go trials, lever presses within 4 s were followed by sucrose pellet reinforcement after a 4-s delay. Failure to press on Go trials was followed by lever retraction and a 40-s time-out. On NoGo trials, withholding a lever press for 4.5 s was reinforced immediately upon lever retraction, while presses were followed by a 40-s time-out. After a correct trial, the next trial began with cue onset/lever extension after a 5- to 13-s ITI. During the time-out, the house light was extinguished and no trials were initiated. At the conclusion of error trials, the house light was illuminated and a 5- to 13-s ITI preceded the onset of the next trial. A session consisted of 150 correct trials.
Surgery.
Once rats were trained to successfully perform the Go/NoGo task with 80% accuracy on Go trials and >50% accuracy on NoGo trials, they were implanted with either electrode arrays for electrophysiological recordings or guide cannulas for infusions of pharmacological agents in the NAc under ketamine hydrochloride (100 mg/kg) and xylazine hydrochloride (10 mg/kg ip) anesthesia. Custom-designed (Micro Probe, Gaithersburg, MD) electrode arrays, organized into two columns of four microwires (50-μm diameter; tip separation 0.25 mm spanning 1 mm) were stereotaxically guided into NAc. Bilateral arrays were centered at AP +1.7, ML ± 1.1 relative to bregma and −6.5 relative to brain surface (Paxinos and Watson 2007). Ground wires for each array were inserted into the brain at a location remote from the electrode arrays. Connectors for the microwire arrays were anchored to the skull via stainless steel screws and dental acrylic.
Electrophysiological recording.
Recordings were made typically beginning 2 wk after electrode implantation. Methods for electrophysiological recording have been described elsewhere (Loriaux et al. 2011; Roitman and Roitman 2010). Briefly, rats were connected to a flexible recording cable (Plexon, Dallas, TX) attached to a commutator (Crist Instrument, Hagerstown, MD) before the start of the recording session to allow free movement within the chamber. Signals were amplified and recorded via the MAP System (Plexon). Another computer controlled behavioral events of the experiment (Med Associates) and sent digital outputs corresponding to each event to the MAP System to be time stamped along with the neural data. During the recording session, waveforms that matched templates generated by principal component analysis (PCA) were collected as the same neuron. Cell recognition and sorting was finalized after the experiment with Offline Sorter (Plexon), which assessed neuronal data based on PCA of the waveforms, cell firing characteristics, and interspike intervals. Data were exported to MATLAB (MathWorks, Natick, MA) and STATISTICA (StatSoft, Tulsa, OK) for statistical analyses.
Analysis of neural data.
For each neuron, the timing of action potentials was calculated from −4 s to 8 s relative to trial onset (cue presentation). Baseline activity was measured as the average firing rate (sp/s) in the 4 s preceding cue presentation. We first tested whether activity in the 8 s following trial onset, calculated in 0.5-s bins across the population of neurons recorded, differed from baseline by two-sided paired t-test with Bonferroni correction for multiple comparisons. Next, for correct and incorrect trials separately, we compared whether activity following Go and NoGo cues differed by comparing average firing rate in 0.5-s bins with two-sided paired t-tests with Bonferroni correction.
To identify individual neurons with phasic responses to cue onset, which coincided with lever presentation, we calculated average firing rate during the 1-s epoch following the cue onset/lever presentation for all Go trials in the session. We chose this as our selection criterion because the majority of trials began with a Go cue, and we did not assume responses would be homogeneous to the two cues. We used two-sided paired t-tests to compare responses during this epoch with baseline activity on the same trials. Once neurons with significant increases or decreases were identified, we analyzed the time course of response for populations of increasing and decreasing neurons separately as above to determine the epochs (0.5 s) that differed from baseline. We also performed weighted means ANOVA on the response in the 1 s following cue onset for increasing and decreasing neurons separately to detect differences in response due to cue type (Go/NoGo), accuracy (correct/error), and action (press/withhold) and to determine interactions between these factors. Main effects were tested with unequal N honestly significant difference (HSD) post hoc tests.
We used regression models to test for differences between the time courses of neural activity for different sets of trials. First, we were interested in whether the time course of the neural response on correct Go trials depended on the latency to lever press. For each rat, we divided Go correct trials into “short”- and “long”-response time (RT) trials based on the median RT for that test session. We modeled NAc activity for these groups of trials by fitting
| (1) |
where Y is the firing rate in 100-ms bins, T is the time from cue onset from 0.1 to 0.5 s, IRT is an index for short- or long-RT trial, and T*IRT is an interaction term to indicate a change in the time course of the response between RT groups. The null hypothesis, that the slope of the response does not depend on RT, is tested by setting b4 = 0.
Next, we tested whether the time course of the response immediately following cue onset differed between trials in which the animal pressed the lever (Go correct/NoGo error) and those in which pressing was withheld (Go error/NoGo correct). We estimated the time course of the neural response using
| (2) |
where Y is the firing rate in 100-ms bins, T equals time from cue onset from 0.1 to 0.5 s, Ip is an index for press or no press, and T*Ip is an interaction term to indicate a change in the time course of the response between groups. The null hypothesis, that the slope of the response does not depend on the animal's behavioral response, is tested by setting b4 = 0.
Histology.
At the conclusion of testing, rats were injected with a sublethal dose of pentobarbital sodium (100 mg/kg). Current (100 μA) was passed for 4 s through each electrode with a lesion-making device (Ugo Basile, Comerio, Varese, Italy) to mark recording sites. Rats were then transcardially perfused with physiological saline followed by 10% paraformaldehyde mixed with 3% potassium ferrocyanide. Brains were extracted and stored in paraformaldehyde-potassium ferrocyanide for at least 24 h. Potassium ferrocyanide reacts with iron deposited after lesions and causes a Prussian blue reaction product, which was used to help visualize electrode placements. After perfusion and storage, brains were sectioned at 50 mm in a cryostat (−20°C). Tissue was mounted on gelatin-subbed slides and viewed under a light microscope to verify electrode or cannula placement according to visual landmarks (Paxinos and Watson 2007).
RESULTS
Rats performed the Go/NoGo task with a high level of accuracy. Each trial began with the presentation of either a Go or a NoGo cue (75% or 25% of trials, respectively) simultaneous with the extension of the test lever into the chamber (Fig. 1). All correct trials—lever presses for Go, inhibition of pressing for NoGo—led to delivery of a sucrose pellet reward, while all errors—withheld response for Go, lever press for NoGo—resulted in a time-out. Average performance was 89.6 ± 1.4% correct on Go trials and 76.5 ± 6.4% correct on NoGo trials (Fig. 2A). Accuracy on Go trials tended to be higher than accuracy on NoGo trials [2-sided paired t-test on accuracy, t(10) = 1.81, P = 0.10, confidence interval (CI) = −3% to 29.2%]. The average number of completed trials in each session was 154.5 ± 4.5, with 101.6 ± 3.4 correct Go trials, 31.4 ± 3.1 correct NoGo trials, 11.8 ± 1.7 Go errors, and 9.6 ± 2.7 NoGo errors. Thus, on most trials, a Go cue was followed by the correct response of a lever press. The majority of NoGo cues resulted in an inhibition of pressing, although there were approximately equal numbers of trials in which rats failed to press when they should have or pressed when instructed to withhold.
Fig. 2.
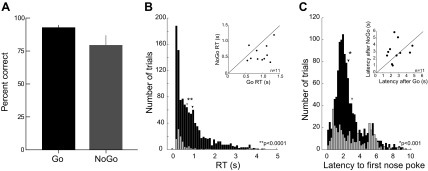
Rats performed the Go/NoGo task accurately and did not delay execution of responses. A: the proportion of correct trials was high for both Go (89.6 ± 1.4% of 1,248) and NoGo (76.5 ± 6.4% of 451) trials. B: response times (RTs) are shorter for lever presses in error on NoGo trials than correct presses on Go trials. Distributions of RT are shown for correct Go trials (black, n = 1,118) and error NoGo trials (gray, n = 106). Average RT for presses following the NoGo cue (677 ± 77 ms, gray arrowhead) was shorter than that for the Go cue (955 ± 24 ms, black arrowhead). Inset: mean RT for lever presses on NoGo trials plotted as a function of mean RT for Go presses for each rat. For 10/11 subjects, RT was faster for incorrect NoGo presses than correct Go presses, suggesting that rats' failure to inhibit presses occurred in the immediate response to the cue. C: latency to nose poke at the central port is shorter after Go cues (2.61 ± 0.05 s) than NoGo cues (3.06 ± 0.12 s). Inset: mean latency to nose poke after cue onset on NoGo trials plotted as a function of mean latency to nose poke after Go cue for each rat. Although the latency is shorter on Go trials, there is not a consistent pattern of behavior between subjects.
When rats did press the lever, they responded quickly after the onset of the cue. The distribution of RTs for lever presses following Go (correct) and NoGo (error) trials is shown in Fig. 2B. Average RT on correct Go trials was 955 ± 24 ms, while presses following the NoGo cue were faster (677 ± 77 ms) (Fig. 2B). The pattern of faster latencies to press the lever on NoGo errors, compared with correct Go trials, was evident in 10 of the 11 rats tested (Fig. 2B, inset). Rats also engaged in making nose pokes at the central port where reward would be delivered during trials. Figure 2C shows the distribution of latencies to the first nose pokes at the central port following cue onset. The average latency to nose poke following Go cues was 2.61 ± 0.05 s, and that following NoGo cues was 3.06 ± 0.12 s (Fig. 2C). Across all rats, there was greater variability in the pattern of latency to nose poke following Go and NoGo cues (Fig. 2C, inset). The pattern of central nose pokes during trials provides evidence that rats attended to the central port on all trials—Go and NoGo—during the interval between cue and reward. The behavioral performance provides evidence that rats performed the task accurately and quickly, pressing the lever without delay in response to the more likely Go cue. To correctly withhold a press following NoGo cue presentation required rats to inhibit this prepotent tendency to press.
While rats performed the symmetrical Go/NoGo task, we recorded the responses of 127 NAc neurons. Ninety-two (72.4%) of these neurons were histologically verified to be localized within the core region of the NAc, while the remaining 35 neurons (27.6%) were localized within the NAc shell. Figure 3 shows the locations of the electrode tips from which the neurons were recorded. The categorization of neurons according to their individual response properties is discussed below. Our main focus was on the pattern of responses to the cue onset that initiated each trial. Core and shell neurons did not show significantly different patterns of activity in response to Go or NoGo cue onset [region × cue type: F1,19734 = 0.11, P = 0.75; main effect of region: F1,19734 = 0.87, P = 0.35; main effect of cue type: F1,19734 = 13.47, P < 0.001]. Therefore, analyses were based on all 127 neurons verified to be located within the NAc. At the onset of each trial, signaled by the simultaneous occurrence of cue presentation and lever extension, the average firing rate across 127 neurons showed a transient increase in activity (Fig. 4A). The green curve in Fig. 4A shows the average firing rate (+1 SE in sp/s) for all Go trials, both correct and error combined, and the red curve shows the average response for all NoGo trials. The horizontal green and red lines beneath the firing rate traces in Fig. 4A indicate epochs (in 0.5-s time bins relative to cue onset) in which firing rate differed from baseline level. During the first 0.5 s following cue onset, firing rate transiently increased from baseline activity on both Go and NoGo trials, although activity was higher after the NoGo cue (2.49 ± 0.06 sp/s) compared with the Go cue [2.28 ± 0.03 sp/s, t(19,736) = 3.40, P < 0.001]. The response on Go trials then dropped below baseline during the delay period when rats were waiting for either reward delivery (which occurred at 4.99 ± 0.02 s) or lever retraction (at 4 s). After trial termination by reward delivery or lever retraction, average activity on Go trials fell below baseline again briefly, during the time of reward consumption. On NoGo trials, activity returned to baseline within 1 s and did not differ from baseline until a transient increase in activity when the lever retracted and a reward was delivered on correct trials (4.5 s after cue), which was followed by a brief reduction in activity.
Fig. 3.

Placement of electrodes in nucleus accumbens (NAc). Each circle marks the location of an electrode tip from which neural activity from an individual neuron was recorded. The fill color of each circle indicates whether the neuron located at that position showed an increase (white), a decrease (black), or no (gray) significant change in response relative to baseline activity at the time of Go cue onset. Locations are based on histological markers in Paxinos and Watson (2007). NAcc, NAc core; ac, anterior commissure; NAcsh, NAc shell. Inset: donut plot shows the proportion of neurons with increasing (white, n = 43), decreasing (black, n = 22), or nonphasic (gray, n = 62) responses.
Fig. 4.

NAc neurons are differentially modulated by task events in the Go/NoGo task. A: perievent histogram (PEH) of average firing rate (sp/s, +1 SE) recorded from 127 NAc neurons is shown for all Go (green, n = 14,457) and NoGo (red, n = 5,281) trials, aligned to the onset of the cue at the beginning of each trial. Horizontal lines below the PEH indicate 0.5-s intervals during which firing rate for Go (green) and NoGo (red) trials significantly differs from the level of activity during the 4-s baseline period preceding the beginning of each trial. B: for each neuron, the change in firing rate (ΔFR) from baseline level during the first second of cue presentation was calculated separately for Go and NoGo trials. Each circle indicates a single neuron's cue response on NoGo trials as a function of its response on Go trials. Circles outlined in gray mark the neurons that did not show a significant difference in firing rate in response to the Go cue. Circles outlined in black mark neurons that did show a significant response to Go cues, whether an increase in firing rate (>0) or a decrease (<0). Neurons that had a significantly higher firing rate in response to the NoGo cue compared with the Go cue are filled in red, and neurons that had a higher firing rate in response to the Go cue compared with the NoGo cue are filled in green. The average difference across all 127 neurons was 0.21 sp/s (confidence interval = 0.09–0.33, P < 0.0001), which is consistent with A, in which there is a higher firing rate in the first second for NoGo trials compared with Go trials. The yellow arrow marks the average cue response across all neurons to the Go and NoGo cues, with the difference indicated as a deflection above the line of unity. C: average firing rate for all correct Go (green, n = 12,911) and NoGo (red, n = 4,270) trials. Horizontal red line below PEH indicates 0.5-s epochs during which the response was significantly higher on NoGo compared with Go trials. The green arrowhead indicates average RT for lever presses on correct Go trials (957 ± 14 ms), and the green plus sign indicates the average time of reward receipt for those trials (4.99 ± 0.02 s). For correct NoGo trials, in which rats did not press the lever, it retracted and reward was delivered 4.5 s after trial onset (red arrowhead and plus sign). D: average firing rate for all error Go (light green, n = 1,546) and NoGo (orange, n = 1,011) trials. Horizontal green line below PEH indicates 0.5-s epoch during which the response was significantly higher on Go trials than NoGo trials. The orange arrowhead indicates average RT for NoGo error presses (957 ± 14 ms), and the green arrowhead marks the time of lever retraction for Go trials on which rats failed to press. For both correct and error trials, the average response to cue onset was more elevated for trials in which rats withheld lever pressing compared with trials in which they pressed the lever.
The bias in firing rate to higher levels on NoGo trials following cue onset reflects the trend in the activity of the population of individual neurons recorded. For each neuron, we computed the difference in firing rate between the baseline level of activity and the response during the first second of the Go and NoGo cues separately. Figure 4B shows a scatterplot for the 127 neurons studied, with the change in firing rate in response to the NoGo cue plotted as a function of the change in firing rate in response to the Go cue. The diagonal line of unity marks equal responding to both cues. As such, points that fall above the line had a larger-magnitude response to NoGo cues and points below the line showed a larger response to Go cues. Neurons that had a significant change in firing rate at cue onset are outlined in black in Fig. 4B, while those that did not respond with a significant difference are outlined in gray; points filled with red had a significantly higher response to the NoGo cue compared with Go, while those filled with green had a significantly higher response to the Go cue. The yellow arrow in Fig. 4B marks the average change in firing rate from baseline in response to Go (x-component) and NoGo (y-component) cues, such that the response to NoGo cues was 0.21 sp/s higher than the response to Go cues (CI = 0.09–0.33). This small magnitude of firing rate difference persists despite the averaging together of trials in which the cue differed (Go vs. NoGo), the behavioral responses differed (press vs. withhold), and neurons exhibited different response profiles (increase, decrease, or no change in firing rate). We examine the contribution of each of these factors to the modulation of NAc responses below.
Because rats' performance included errors on both Go and NoGo trials, it is difficult to ascertain whether the differences between Go and NoGo responses in Fig. 4A are related to the cues themselves or the behavior that followed. Figure 4, C and D, show correct and error trials separately, so that only trials with the same cue and behavioral response contribute to each average. All correct Go and NoGo trials for all neurons recorded are shown in Fig. 4C. These responses bear strong resemblance to those in Fig. 4A, as the majority of trials were completed with the correct response. Here responses to cues were higher for NoGo trials in the first 1.5 s of the trial (Fig. 4C; horizontal red line indicates NoGo > Go). There was a brief increase in activity on correct NoGo trials when the lever retracted and reward was delivered at the end of the delay period. Unlike NoGo trials, a large, transient response at the time of reward delivery at ∼5 s after Go cue onset was absent. Neural responses on error trials (Fig. 4D) showed a different pattern of activity. Responses to cue onset were higher for Go trials in the first 0.5 s of the trial (horizontal green line indicates Go > NoGo). Error trials concluded and the time-out period commenced upon lever retraction for Go trials and lever press for NoGo trials. For all errors, there is a brief increase in activity when the time-out begins, which is signaled by extinguishing the house light in the operant chambers. For both correct and error trials, greater levels of neural activity at the time of cue onset were associated with withholding of the behavioral response; thus the overall difference across all trials (Fig. 4A) may be attributable to a greater proportion of withheld responses for NoGo than for Go trials. These results suggest that elevated neural responses were associated with withholding the behavioral act of lever pressing rather than the NoGo cue itself, but, again, the magnitude of the difference is small, potentially because of the averaging together of neurons with different response profiles.
The overall modulation of activity shown in Fig. 4 was driven by individual neurons that responded to cue onset with transient changes in firing rate. Because differences between Go and NoGo cue responses were evident in the first 1.5 s of correct trials and the first 0.5 s of errors, we identified which neurons exhibited a change in firing rate relative to their baseline activity during the first second of Go trials. We found that the activity of 43 neurons responded at the onset of the trial with a significant increase in firing rate (INC; 32 core, 11 shell), while 22 neurons responded with a significant decrease in firing rate (DEC; 18 core, 4 shell). The distribution of INC and DEC neurons along the anterior-posterior axis did show a significant interaction between the subregion (core, shell) in which the neuron was located and the type of response [region (core, shell) × response type (INC, DEC, nonphasic); F2,121 = 3.45, P < 0.05]. While there was no systematic relationship between the location of neurons and response type in the core, DEC neurons were located at more posterior locations in the shell than INC neurons (Tukey HSD, P < 0.01). An example of an increasing neuron is shown in Fig. 5A. Go and NoGo trials are shown separately, aligned to the time of cue onset. In this example, the neuron's firing rate increased from a baseline of 2.05 ± 0.14 sp/s to 5.79 ± 0.43 sp/s in response to the Go cue and to 10.97 ± 1.20 sp/s in response to the NoGo cue. A second group of neurons exhibited decreased firing rate at the onset of the cue, as shown in Fig. 5B. This neuron had a baseline firing rate of 2.43 ± 0.09 sp/s, which decreased to 1.65 ± 0.17 sp/s at the onset of the Go cue but remained at 2.28 ± 0.30 sp/s on NoGo trials. Although the population (Fig. 4A) and individual neuron (Fig. 5) data suggest differences in the neural responses to cues, these differences may also be related to whether they executed a correct behavioral response, as suggested by Fig. 4, C and D. Therefore, we examined the subgroups of neurons that showed increase or decrease in firing rate separately to determine whether their cue responses were modulated by whether their subsequent behavior was correct or not.
Fig. 5.

Examples of single neurons with significant modulations of activity at the onset of the Go cue and lever presentation. A: NAc neuron with significantly higher activity during the 1-s epoch following Go trial onset. Top: raster plots in which each row show the time of action potentials relative to cue onset (time = 0 s) for 1 trial. All Go trials (left), both correct and error combined, are shown separately from all NoGo trials (right). Bottom: PEHs show the firing rate averaged in 100-ms bins. In this example, the NoGo cue elicited a significantly higher level of activity than the Go cue during the first second of the trial. B: NAc neuron with a significant reduction in activity in the 1-s epoch following Go trial onset. Same conventions as A. This neuron showed a significant decrease in activity in response to the cue on Go trials but was not modulated on NoGo trials.
For INC neurons, larger elevations in firing rate were associated with withheld lever presses following both Go (error) and NoGo (correct) trials. In Fig. 6A, onset of the Go cue evoked larger elevations in activity on trials in which the rats failed to press the Go lever than on correct trials in which they did press. NAc activity to the Go cue increased in the first second for both correct and error trials and then decreased below baseline level from 1.5 to 7 s after trial onset for correct trials. At the time of reward delivery (at ∼5 s after cue), firing rate remained below baseline level until after reward consumption, when activity returned to baseline. For error trials, activity returned to baseline after the transient cue response and then increased again at 4 s, when the lever retracted and reward was not delivered. After the onset of the Go cue, firing rate rose from a baseline of 1.75 ± 0.03 sp/s to a maximum level of 3.57 ± 0.11 sp/s for correct trials and 4.60 ± 0.43 sp/s for errors. The average magnitude of the neural response during the first second of the cue epoch was lower for Go cues followed by lever presses (2.61 ± 0.05 sp/s) compared with Go cues followed in error by withheld responses (3.23 ± 0.20 sp/s, P < 0.05; Fig. 6A, inset).
Fig. 6.

Transient changes in NAc activity in the 1 s following cue onset were modulated by action selection. For each panel, the colored portion of the donut plot indicates the proportion of total neurons recorded represented in each subpopulation. A: 43 NAc neurons responded with a transient increase in activity when the Go cue and lever were presented to initiate each trial. Average firing rate (sp/s, +1 SE) is plotted separately for correct (dark green, n = 4,347) and error (light green, n = 509) trials. Shaded region marks the 1-s epoch used to identify neurons as increasing, and the average firing rate for this epoch is shown in inset for correct and incorrect trials. In this initial epoch, the neural response was higher for Go error trials, in which lever pressing was withheld, than for correct trials (*P < 0.05). Horizontal lines below PEHs mark 0.5-s epochs in which the response on correct trials (dark green) and errors (light green) differed from baseline level of activity. B: response of same 43 increasing neurons for NoGo correct (red) and error (orange) trials. Firing rate in the 1 s following cue onset (shaded) was higher for correct NoGo trials, in which lever pressing was withheld, than errors (inset, *P < 0.001). Horizontal lines below PEHs identify the 0.5-s epochs in which the response on correct (red, n = 1,473) and error (orange, n = 341) trials differed from baseline level of activity. C: 22 NAc neurons responded with a transient decrease in activity at the time of cue onset. Same conventions as A. Firing rate in the 1-s epoch following trial onset was reduced to significantly lower levels for correct Go trials (n = 2,257) compared with NoGo trials (n = 304) in which rats pressed the lever (*P < 0.001). D: response of same 22 decreasing neurons on correct (red, n = 745) and error (orange, n = 159) NoGo trials. Same conventions as B. Firing rate in the 1-s epoch following trial onset was reduced to significantly lower levels for correct Go trials, in which rats pressed the lever (*P < 0.01).
The population of INC neurons showed a similar pattern of activity in response to NoGo cues (Fig. 6B). On correct NoGo trials, neural activity increased above baseline both at the time of cue onset (0–1.5 s) and at lever retraction/reward delivery (4.5–6 s). On NoGo trials in which rats pressed the lever in error, there was also an increase in firing rate in the first second of the trial, followed by a return to baseline. Again, the response of increasing NAc neurons to the same NoGo cue differed depending on whether the animal selected the correct behavioral response. After the onset of the NoGo cue, firing rate rose to a maximum level of 4.51 ± 0.25 sp/s for correct trials and 2.73 ± 0.39 sp/s for errors. The activity during the first second of the cue period did not reach as high a level for error trials, in which the lever was pressed (2.25 ± 0.19 sp/s), compared with correct trials, in which rats withheld pressing the lever (3.36 ± 0.12 sp/s, P < 0.001; Fig. 6B, inset). On NoGo trials, this pattern of activity is due to both the lower baseline firing rate on error trials compared with correct trials (1.17 ± 0.09 vs. 1.91 ± 0.06 sp/s, P < 0.0001) and a smaller increase in firing rate over baseline during the first second of the trial on errors (1.08 ± 0.16 vs. 1.45 ± 0.10 sp/s, F = 6.31, P < 0.05). Overall, for increasing neurons, there was a significant interaction between cue type (Go/NoGo) and accuracy (correct/error) for the cue response (F1,6666 = 36.94, P < 0.00001) but no main effect of cue type (F1,6666 = 0.59, P = 0.44) or whether the response was correct (F1,6666 = 2.88, P = 0.09). This interaction can be explained by the overall larger increase in activity on trials in which lever pressing was withheld. This pattern of activity did not depend on which NAc subregion neurons were recorded from (region × cue type × accuracy: F1,6662 =1.82, P = 0.18). Thus, regardless of cue type, higher elevations in activity were associated with suppression of the behavioral response, whether appropriate (NoGo cue) or in error (Go cue).
In the group of neurons that showed reductions in firing rate following cue onset, greater decreases in activity level were associated with the execution of lever pressing. Figure 6C shows the average response of 22 decreasing neurons on Go trials. The onset of the cue resulted in a transient decrease in activity from baseline (2.28 ± 0.05 sp/s) for correct trials to a minimum of 1.09 ± 0.08 sp/s on correct trials, remaining significantly below baseline for the first 3 s of trials on correct trials. During the first second after cue onset, the average firing rate was 1.40 ± 0.04 sp/s (Fig. 6C, inset). In contrast, on Go error trials, firing rate transiently decreased to a minimum of 1.41 ± 0.22 sp/s and averaged 2.17 ± 0.18 sp/s during the first second following cue onset (Fig. 6C, inset). This brief and smaller-magnitude decrease in activity over the first second differed from correct trials (P < 0.001) but not baseline. On NoGo trials (Fig. 6D), this same group of neurons showed a small reduction in firing rate for correctly withheld lever presses (1.76 ± 0.09 sp/s) and larger decreases in activity when rats pressed the lever in error (1.18 ± 0.15 sp/s, P < 0.01; Fig. 6D, inset). For both NoGo correct and error trials, decreases in firing rate below baseline were transient and modulations from baseline were not observed for the remainder of the trial period. Overall, the cue response of NAc decreasing neurons was modulated by an interaction between cue type (Go/NoGo) and accuracy (correct/error) (F1,3461 = 30.72, P < 0.00001). There was no main effect of accuracy on neural response (F1,3461 = 0.64, P = 0.43), but there was a main effect of behavioral response (press/withhold: F1,3461 = 6.84, P < 0.0001). This pattern of activity did not depend on which NAc subregion neurons were recorded from (region × cue type × accuracy: F1,3457 = 1.00, P = 0.32).
The pattern of results reveals a higher level of activity in NAc neurons for trials in which the rats did not execute the behavioral response of pressing the available lever—for both correct NoGo and incorrect Go trials. This elevation in response is driven by larger increases and smaller reductions in activity at the time of cue presentation on trials in which the rats ultimately withhold lever presses. We considered the possibility that these higher levels of activity might persist longer on trials in which no press occurred because the act of pressing could have engaged circuitry that suppressed the NAc response, and thus the differences observed here may be a consequence of action commission rather than a differential response to cues that biased action selection. To address this question, we examined the NAc population response separately for Go trials with different response latencies. For each rat, we assigned all correct Go trials into a short- or long-RT group based on the median RT so that every neuron was equally represented in both groups. The mean RTs for the short-RT and long-RT trials were 510 ms and 1,442 ms, respectively. Figure 7 shows the average firing rate across all neurons, grouped by RT for Go correct trials and plotted to the median RT for each group. Responses during this time frame are also shown for trials in which lever pressing was withheld following Go (error) and NoGo (correct) cues. We predicted that the transient increase in population firing rate would be suppressed more quickly on short-RT trials compared with long-RT trials if the act of pressing the lever was responsible for inhibiting the NAc response. We found that the time course of the initial decline in firing rate did not differ between short- and long-RT Go correct trials (Eq. 1, H0: b4 = 0, P = 0.10). However, we did verify that the rate of decline in activity was more rapid for trials in which the rats pressed the lever compared with those in which they did not press (Eq. 2, H0: b4 = 0, P < 0.001; fits shown in black in Fig. 7). Thus it appears that the weaker response and rapid decline following cue onset precede the commission of the lever press and are similar regardless of press RT.
Fig. 7.

The lower level of average response on Go correct trials for the 127 neurons recorded is not related to RT to lever press. For each rat, correct Go trials were divided at the median RT into short- and long-RT groups. Light and dark gray traces show the average neural response for short- and long-RT correct Go trials, respectively (sp/s, +1 SE; n = 6,446 and 6,464 trials). Arrowheads below mark average RT for the 2 groups of trials (short = 510 ms, long = 1,442 ms). In the first 0.5 s of trials, there was no difference in the change in firing rate between short- and long-RT Go correct trials (Eq. 1, H0: b4 = 0, P = 0.10). However, the decline in response was steeper for correct Go trials (short and long RT combined) than for trials in which rats did not press the lever (Go error and NoGo correct combined: Eq. 2, H0: b4 = 0, P < 0.001). Linear fits from this estimation are shown in black.
DISCUSSION
The NAc plays a role in establishing cue-outcome relationships as well as cue-evoked goal-directed behavior (Smith-Roe and Kelley 2000; van der Meer and Redish 2011; Yawata et al. 2012). NAc neurons transiently respond to reward-predictive cues as well as during goal-directed behaviors (Carelli 2002; Day et al. 2006), which are strongly correlated in most studies of operant responding. Here we measured the activity of individual NAc neurons while rats performed a Go/NoGo task with symmetrical outcomes. In this task, correct responses for all trials—Go and NoGo—were rewarded and all errors were followed by a time-out period from the task. Thus both cues predicted the availability of reward but signaled that different behavioral responses were required to obtain them. Rats performed this task with a high level of accuracy on both Go and NoGo trials, with short response latencies on both Go correct responses and NoGo errors, indicating that rats were biased to press the lever when it was presented. However, on the majority of NoGo trials they succeeded in inhibiting this behavioral response according to the instructional cue. Since both cues here are reward predictive, we would hypothesize that both cues would elicit equivalent responses if reward expectation drove the neural response. Although there was not a significant difference in accuracy between Go and NoGo trials, there was a trend for Go trials to be more accurate, and therefore more frequently rewarded (89% vs. 76%). Previous work has shown that dopamine neurons show increasingly strong responses to cues as their certainty in predicting reward increases from 0 to 100% (Fiorillo et al. 2003). If the NAc exhibited similar responding, we would predict slightly stronger responses to the Go cue compared with the NoGo cue. Alternatively, it has been suggested that NAc biases motor systems toward appropriate behavioral responses, such as to approach or withdraw (Ambroggi et al. 2011; Carlezon and Thomas 2009; Krause et al. 2010), which predicts that NAc responses would differentiate motor plan, rather than reward expectation. The symmetrical Go/NoGo task allowed us to dissociate whether NAc responses are equivalent because of similar reward-association, stronger for Go cues because they may be slightly more reward predictive, or associated with the subsequent act—to engage in or withhold lever pressing.
We found that the response of NAc neurons across the entire population recorded to instructive reward-predictive cues was more closely associated with the subsequent behavioral response rather than reward expectation. That is, transient responses to the Go or NoGo cue elicited higher levels of activity on trials in which rats withheld the production of a lever press, even when, in the case of Go errors, such restraint led to reward omission (Fig. 4). In the population, the transient cue response was weaker on both correct Go and incorrect NoGo trials, in which rats subsequently pressed the lever. The pattern of activity, with stronger cue responses on correct NoGo trials relative to Go, was reversed for error trials, for which Go cues elicited a stronger response than NoGo cues. Thus the overall elevated NAc response correlated with the behavior produced rather than specific cue identity or whether the trial was rewarded or not. This pattern of population activity was driven by subpopulations of neurons that showed transient changes in activity at the time that the cue and lever were presented to trigger a behavioral response (Figs. 5 and 6). We found that both subpopulations responded to both Go and NoGo cues, but the differences in neural activity did not correlate specifically with whether the behavioral response was correct or an error but rather with whether the lever press would be performed or withheld. Two-thirds of the neurons that responded to cue onset/lever presentation showed a brief increase in activity. Regardless of whether the cue instructed a Go or NoGo response, these increases had a larger magnitude on trials in which lever pressing was withheld, whether correctly (NoGo) or in error (Go). The remaining third of neurons that responded to cue onset/lever presentation showed a reduction of activity. Larger decreases in activity preceded approach and lever pressing, whether correct (Go) or in error (NoGo). Thus the data suggest that shifts in the levels of excitation and inhibition in the NAc participate in a more subtle, moment-to-moment, control of behavior. The overall shift toward elevated activity preceding behavioral inhibition suggests that excitation in the NAc may support the encoding of a salient stimulus, holding behavior in check. This is beneficial when withholding a response is appropriate but perhaps disruptive of a prepotent, prepared response.
Previous findings offer a model for how this balance of decreases and increases in NAc activity may bias the animal toward action or restraint. In the dorsal striatum, optogenetic activation of dopamine D1 receptor-expressing medium spiny output neurons (MSNs) projecting to the substantia nigra (“direct” pathway) promotes locomotor behavior, while activation of dopamine D2 receptor-expressing MSNs projecting to the globus pallidus inhibits locomotion (Kravitz et al. 2010). While there is considerable debate over the translation of output flow from the dorsal striatum to the NAc (Cui et al. 2013; Humphries and Prescott 2010), our results are suggestive of parallel and opposing streams governing goal-directed behavior. While we observe two different subpopulations of neurons (increasing and decreasing), we do not see a division in which one subset of neurons is modulated only for a particular type of trial (Go/NoGo) or behavioral output (approach/restrain). Instead we see both subpopulations active on all trials, consistent with observations of both direct and indirect pathway activity during behavior (Cui et al. 2013). Our observations of simultaneous larger decreases and smaller increases preceding approach and larger increases combined with smaller decreases preceding restraint are in accordance with our own and others' studies. Subsets of NAc neurons show decreases in activity that correlate with the experience of rewarding stimuli, while increasing activity of neurons is elicited by aversive stimuli (Loriaux et al. 2011; Roitman et al. 2005, 2010). Decreases in activity may act in a permissive role for behavior (Krause et al. 2010; Taha and Fields 2005), while increases may promote avoidance (Carlezon and Thomas 2009; German and Fields 2007; Loriaux et al. 2011; Roitman et al. 2005, 2010). With the current recording techniques, we were not able to identify either the neurochemical identity or the projection target for each neuron. Future studies will look to employ techniques to allow identification of recorded neurons to shed light on how they might contribute to different functional pathways.
The pattern of activity observed here suggests that higher levels of activity, due to both larger increases in increasing neurons and smaller reductions in decreasing at cue onset, precede inhibition of behavior while approach behavior is permitted by reduced activity, due to both smaller increases by increasing neurons and larger reductions by decreasing neurons. We considered the possibility that the onset of the motor response itself terminates the transient NAc neural response, such that short-latency lever presses would lead to a more rapid reduction in the transient cue response compared with long-latency presses. However, there were no differences in cue responses between short- and long-RT Go trials (Fig. 7). Decisions to initiate action have often been modeled (most mechanistically in the control of eye movements) as the accumulation of information from a go signal, which drives the initiation of action once its value reaches a threshold level (Hanes and Schall 1996; Reddi and Carpenter 2000; Roitman and Shadlen 2002). The process to restrain the initiation of action has been modeled as an interactive race between go and stop signals (Boucher et al. 2007), in which the neural correlate of movement cancellation is a failure to reach the threshold level (Brown et al. 2008; Schall and Godlove 2012). Here we observe a complementary pattern of results, with higher levels of activity associated with restraint and reduced activity with action. This supports the intriguing possibility that cortico-striatal circuits may be crucial in providing an excitatory stop signal to exert inhibitory control over behavior.
We speculate that excitatory inputs to the NAc influence control over behavior in this task. Pharmacological manipulations of the NAc have been shown to bias animals toward approach or inhibition of action. μ-Opioid agonists, which exert an inhibitory effect on NAc neurons, elicit feeding in sated rats (Smith and Berridge 2005). Pharmacological inhibition of the NAc shell in particular appears to disinhibit behavioral responding (Ambroggi et al. 2011). Our finding that reduced NAc activity was correlated with approach and behavioral responding is consistent with these pharmacological effects. Our results also suggested that elevations in activity were associated with behavioral restraint. One source of glutamatergic inputs into the NAc that may serve to inhibit goal-directed behavior is the prefrontal cortex (PFC). Regions of the PFC have been shown to be necessary for successful inhibition of behavior in stop-signal reaction time tasks (Bari et al. 2011). Inactivation of NAc-projecting subterritories of the PFC can lead to an increase in inappropriate responding (Ghazizadeh et al. 2012) and behavioral disinhibition (LaLumiere et al. 2012). Top-down control over striatal regions in general appears critical in tests of response inhibition in human subjects (Jahfari et al. 2011). Consistent with the idea that excitatory input is necessary for restraint, we observed that responding in error on NoGo trials was preceded by lower baseline firing rates in increasing neurons (Fig. 6B). This lower level of activity may have resulted in a bias for behavioral approach, in that a larger excitatory drive would be needed to sufficiently halt the initiation of the behavioral response.
Using a symmetrical Go/NoGo task, we have found that transient responses of NAc neurons to reward-predictive cues that instruct behavior show a stronger correlation with initiation of action than accuracy. The modulations of firing rate are evident in populations of neurons that increase and decrease activity concurrently in response to cue presentation for all trials, with the strength of response predicting whether rats will engage in behavior or restrain it. Behavioral restraint was associated with larger elevations from increasing neurons and smaller reductions from decreasing neurons. These findings suggest that active engagement of circuitry in the NAc contributes to the ability to restrain behavior, a critical component of impulsivity.
GRANTS
This work was supported by National Institute on Drug Abuse Grant DA-027127 (J. D. Roitman) and the University of Illinois at Chicago Chancellor's Supplemental Graduate Research Fellowship (A. L. Loriaux).
DISCLOSURES
No conflicts of interest, financial or otherwise, are declared by the author(s).
AUTHOR CONTRIBUTIONS
Author contributions: J.D.R. conception and design of research; J.D.R. and A.L.L. performed experiments; J.D.R. and A.L.L. analyzed data; J.D.R. interpreted results of experiments; J.D.R. prepared figures; J.D.R. drafted manuscript; J.D.R. and A.L.L. edited and revised manuscript; J.D.R. and A.L.L. approved final version of manuscript.
REFERENCES
- Ambroggi F, Ghazizadeh A, Nicola SM, Fields HL. Roles of nucleus accumbens core and shell in incentive-cue responding and behavioral inhibition. J Neurosci 31: 6820–6830, 2011 [DOI] [PMC free article] [PubMed] [Google Scholar]
- Bari A, Mar AC, Theobald DE, Elands SA, Oganya KC, Eagle DM, Robbins TW. Prefrontal and monoaminergic contributions to stop-signal task performance in rats. J Neurosci 31: 9254–9263, 2011 [DOI] [PMC free article] [PubMed] [Google Scholar]
- Basar K, Sesia T, Groenewegen H, Steinbusch HW, Visser-Vandewalle V, Temel Y. Nucleus accumbens and impulsivity. Prog Neurobiol 92: 533–557, 2010 [DOI] [PubMed] [Google Scholar]
- Blaiss CA, Janak PH. The nucleus accumbens core and shell are critical for the expression, but not the consolidation, of Pavlovian conditioned approach. Behav Brain Res 200: 22–32, 2009 [DOI] [PMC free article] [PubMed] [Google Scholar]
- Boucher L, Palmeri TJ, Logan GD, Schall JD. Inhibitory control in mind and brain: an interactive race model of countermanding saccades. Psychol Rev 114: 376–397, 2007 [DOI] [PubMed] [Google Scholar]
- Bouret S, Sara SJ. Reward expectation, orientation of attention and locus coeruleus-medial frontal cortex interplay during learning. Eur J Neurosci 20: 791–802, 2004 [DOI] [PubMed] [Google Scholar]
- Brown HD, McCutcheon JE, Cone JJ, Ragozzino ME, Roitman MF. Primary food reward and reward-predictive stimuli evoke different patterns of phasic dopamine signaling throughout the striatum. Eur J Neurosci 34: 1997–2006, 2011 [DOI] [PMC free article] [PubMed] [Google Scholar]
- Brown JW, Hanes DP, Schall JD, Stuphorn V. Relation of frontal eye field activity to saccade initiation during a countermanding task. Exp Brain Res 190: 135–151, 2008 [DOI] [PMC free article] [PubMed] [Google Scholar]
- Cardinal RN, Parkinson JA, Lachenal G, Halkerston KM, Rudarakanchana N, Hall J, Morrison CH, Howes SR, Robbins TW, Everitt BJ. Effects of selective excitotoxic lesions of the nucleus accumbens core, anterior cingulate cortex, and central nucleus of the amygdala on autoshaping performance in rats. Behav Neurosci 116: 553–567, 2002 [DOI] [PubMed] [Google Scholar]
- Carelli RM. Nucleus accumbens cell firing during goal-directed behaviors for cocaine vs. “natural” reinforcement. Physiol Behav 76: 379–387, 2002 [DOI] [PubMed] [Google Scholar]
- Carelli RM. Nucleus accumbens cell firing and rapid dopamine signaling during goal-directed behaviors in rats. Neuropharmacology 47, Suppl 1: 180–189, 2004 [DOI] [PubMed] [Google Scholar]
- Carlezon WA, Jr, Thomas MJ. Biological substrates of reward and aversion: a nucleus accumbens activity hypothesis. Neuropharmacology 56, Suppl 1: 122–132, 2009 [DOI] [PMC free article] [PubMed] [Google Scholar]
- Cui G, Jun SB, Jin X, Pham MD, Vogel SS, Lovinger DM, Costa RM. Concurrent activation of striatal direct and indirect pathways during action initiation. Nature 494: 238–242, 2013 [DOI] [PMC free article] [PubMed] [Google Scholar]
- Day JJ, Wheeler RA, Roitman MF, Carelli RM. Nucleus accumbens neurons encode Pavlovian approach behaviors: evidence from an autoshaping paradigm. Eur J Neurosci 23: 1341–1351, 2006 [DOI] [PubMed] [Google Scholar]
- de Wit H. Impulsivity as a determinant and consequence of drug use: a review of underlying processes. Addict Biol 14: 22–31, 2009 [DOI] [PMC free article] [PubMed] [Google Scholar]
- Fiorillo CD, Tobler PN, Schultz W. Discrete coding of reward probability and uncertainty by dopamine neurons. Science 299: 1898–1902, 2003 [DOI] [PubMed] [Google Scholar]
- German PW, Fields HL. Rat nucleus accumbens neurons persistently encode locations associated with morphine reward. J Neurophysiol 97: 2094–2106, 2007 [DOI] [PubMed] [Google Scholar]
- Ghazizadeh A, Ambroggi F, Odean N, Fields HL. Prefrontal cortex mediates extinction of responding by two distinct neural mechanisms in accumbens shell. J Neurosci 32: 726–737, 2012 [DOI] [PMC free article] [PubMed] [Google Scholar]
- Hamidovic A, Dlugos A, Skol A, Palmer AA, de Wit H. Evaluation of genetic variability in the dopamine receptor D2 in relation to behavioral inhibition and impulsivity/sensation seeking: an exploratory study with d-amphetamine in healthy participants. Exp Clin Psychopharmacol 17: 374–383, 2009 [DOI] [PMC free article] [PubMed] [Google Scholar]
- Hanes DP, Schall JD. Neural control of voluntary movement initiation. Science 274: 427–430, 1996 [DOI] [PubMed] [Google Scholar]
- Humphries MD, Prescott TJ. The ventral basal ganglia, a selection mechanism at the crossroads of space, strategy, and reward. Prog Neurobiol 90: 385–417, 2010 [DOI] [PubMed] [Google Scholar]
- Jahfari S, Waldorp L, van den Wildenberg WP, Scholte HS, Ridderinkhof KR, Forstmann BU. Effective connectivity reveals important roles for both the hyperdirect (fronto-subthalamic) and the indirect (fronto-striatal-pallidal) fronto-basal ganglia pathways during response inhibition. J Neurosci 31: 6891–6899, 2011 [DOI] [PMC free article] [PubMed] [Google Scholar]
- Jin X, Costa RM. Start/stop signals emerge in nigrostriatal circuits during sequence learning. Nature 466: 457–462, 2010 [DOI] [PMC free article] [PubMed] [Google Scholar]
- Krause M, German PW, Taha SA, Fields HL. A pause in nucleus accumbens neuron firing is required to initiate and maintain feeding. J Neurosci 30: 4746–4756, 2010 [DOI] [PMC free article] [PubMed] [Google Scholar]
- Kravitz AV, Freeze BS, Parker PR, Kay K, Thwin MT, Deisseroth K, Kreitzer AC. Regulation of parkinsonian motor behaviours by optogenetic control of basal ganglia circuitry. Nature 466: 622–626, 2010 [DOI] [PMC free article] [PubMed] [Google Scholar]
- LaLumiere RT, Smith KC, Kalivas PW. Neural circuit competition in cocaine-seeking: roles of the infralimbic cortex and nucleus accumbens shell. Eur J Neurosci 35: 614–622, 2012 [DOI] [PMC free article] [PubMed] [Google Scholar]
- Loriaux AL, Roitman JD, Roitman MF. Nucleus accumbens shell, but not core, tracks motivational value of salt. J Neurophysiol 106: 1537–1544, 2011 [DOI] [PMC free article] [PubMed] [Google Scholar]
- Mirenowicz J, Schultz W. Preferential activation of midbrain dopamine neurons by appetitive rather than aversive stimuli. Nature 379: 449–451, 1996 [DOI] [PubMed] [Google Scholar]
- Nicola SM, Yun IA, Wakabayashi KT, Fields HL. Cue-evoked firing of nucleus accumbens neurons encodes motivational significance during a discriminative stimulus task. J Neurophysiol 91: 1840–1865, 2004 [DOI] [PubMed] [Google Scholar]
- Padoa-Schioppa C, Cai X. The orbitofrontal cortex and the computation of subjective value: consolidated concepts and new perspectives. Ann NY Acad Sci 1239: 130–137, 2011 [DOI] [PMC free article] [PubMed] [Google Scholar]
- Pavuluri MN, Ellis JA, Wegbreit E, Passarotti AM, Stevens MC. Pharmacotherapy impacts functional connectivity among affective circuits during response inhibition in pediatric mania. Behav Brain Res 226: 493–503, 2012 [DOI] [PMC free article] [PubMed] [Google Scholar]
- Paxinos G, Watson C. The Rat Brain in Stereotaxic Coordinates. San Diego, CA: Academic, 2007 [Google Scholar]
- Reddi BA, Carpenter RH. The influence of urgency on decision time. Nat Neurosci 3: 827–830, 2000 [DOI] [PubMed] [Google Scholar]
- Roitman JD, Roitman MF. Risk-preference differentiates orbitofrontal cortex responses to freely chosen reward outcomes. Eur J Neurosci 31: 1492–1500, 2010 [DOI] [PMC free article] [PubMed] [Google Scholar]
- Roitman JD, Shadlen MN. Response of neurons in the lateral intraparietal area during a combined visual discrimination reaction time task. J Neurosci 22: 9475–9489, 2002 [DOI] [PMC free article] [PubMed] [Google Scholar]
- Roitman MF, Wheeler RA, Carelli RM. Nucleus accumbens neurons are innately tuned for rewarding and aversive taste stimuli, encode their predictors, and are linked to motor output. Neuron 45: 587–597, 2005 [DOI] [PubMed] [Google Scholar]
- Roitman MF, Wheeler RA, Tiesinga PH, Roitman JD, Carelli RM. Hedonic and nucleus accumbens neural responses to a natural reward are regulated by aversive conditioning. Learn Mem 17: 539–546, 2010 [DOI] [PMC free article] [PubMed] [Google Scholar]
- Schall JD, Godlove DC. Current advances and pressing problems in studies of stopping. Curr Opin Neurobiol 22: 1012–1021, 2012 [DOI] [PMC free article] [PubMed] [Google Scholar]
- Schoenbaum G, Roesch MR, Stalnaker TA, Takahashi YK. Orbitofrontal cortex and outcome expectancies: optimizing behavior and sensory perception. In: The Neurobiology of Sensation and Reward, edited by Gottfried JA. Boca Raton, FL: CRC, 2011 [PubMed] [Google Scholar]
- Setlow B, Schoenbaum G, Gallagher M. Neural encoding in ventral striatum during olfactory discrimination learning. Neuron 38: 625–636, 2003 [DOI] [PubMed] [Google Scholar]
- Smith KS, Berridge KC. The ventral pallidum and hedonic reward: neurochemical maps of sucrose “liking” and food intake. J Neurosci 25: 8637–8649, 2005 [DOI] [PMC free article] [PubMed] [Google Scholar]
- Smith-Roe SL, Kelley AE. Coincident activation of NMDA and dopamine D1 receptors within the nucleus accumbens core is required for appetitive instrumental learning. J Neurosci 20: 7737–7742, 2000 [DOI] [PMC free article] [PubMed] [Google Scholar]
- Stalnaker TA, Calhoon GG, Ogawa M, Roesch MR, Schoenbaum G. Reward prediction error signaling in posterior dorsomedial striatum is action specific. J Neurosci 32: 10296–10305, 2012 [DOI] [PMC free article] [PubMed] [Google Scholar]
- Taha SA, Fields HL. Encoding of palatability and appetitive behaviors by distinct neuronal populations in the nucleus accumbens. J Neurosci 25: 1193–1202, 2005 [DOI] [PMC free article] [PubMed] [Google Scholar]
- Taha SA, Fields HL. Inhibitions of nucleus accumbens neurons encode a gating signal for reward-directed behavior. J Neurosci 26: 217–222, 2006 [DOI] [PMC free article] [PubMed] [Google Scholar]
- van der Meer MA, Redish AD. Ventral striatum: a critical look at models of learning and evaluation. Curr Opin Neurobiol 21: 387–392, 2011 [DOI] [PMC free article] [PubMed] [Google Scholar]
- Volkow ND, Wang GJ, Fowler JS, Tomasi D, Baler R. Food and drug reward: overlapping circuits in human obesity and addiction. Curr Top Behav Neurosci 11: 1–24, 2012 [DOI] [PubMed] [Google Scholar]
- Wiskerke J, Schetters D, van Es IE, van Mourik Y, den Hollander BR, Schoffelmeer AN, Pattij T. mu-Opioid receptors in the nucleus accumbens shell region mediate the effects of amphetamine on inhibitory control but not impulsive choice. J Neurosci 31: 262–272, 2011 [DOI] [PMC free article] [PubMed] [Google Scholar]
- Yawata S, Yamaguchi T, Danjo T, Hikida T, Nakanishi S. Pathway-specific control of reward learning and its flexibility via selective dopamine receptors in the nucleus accumbens. Proc Natl Acad Sci USA 109: 12764–12769, 2012 [DOI] [PMC free article] [PubMed] [Google Scholar]