Abstract
We examine the self-assembly of a peptide A6H comprising a hexa-alanine sequence A6 with a histidine (H) “head group”, which chelates Zn2+ cations. We study the self-assembly of A6H and binding of Zn2+ ions in ZnCl2 solutions, under acidic and neutral conditions. A6H self-assembles into nanotapes held together by a β-sheet structure in acidic aqueous solutions. By dissolving A6H in acidic ZnCl2 solutions, the carbonyl oxygen atoms in A6H chelate the Zn2+ ions and allow for β-sheet formation at lower concentrations, consequently reducing the onset concentration for nanotape formation. A6H mixed with water or ZnCl2 solutions under neutral conditions produces short sheets or pseudocrystalline tapes, respectively. The imidazole ring of A6H chelates Zn2+ ions in neutral solutions. The internal structure of nanosheets and pseudocrystalline sheets in neutral solutions is similar to the internal structure of A6H nanotapes in acidic solutions. Our results show that it is possible to induce dramatic changes in the self-assembly and chelation sites of A6H by changing the pH of the solution. However, it is likely that the amphiphilic nature of A6H determines the internal structure of the self-assembled aggregates independent from changes in chelation.
Introduction
The group of peptides classified as surfactant-like peptides (SLPs)1−3 can be designed to mimic the properties of a surfactant molecule. SLPs comprise a short sequence of charged amino acids as the headgroup, attached to a tail consisting of neutral amino acids. The advantage of SLPs over traditional surfactants is that they incorporate in their structure a biologically active sequence. The particular combination of biofunctionality and amphiphilicity inherent to SLPs confers on them a rich spectra of applications in the field of biomaterials.4,5
Early studies of SLPs, led by Zhang and co-workers, include structures with tailgroups consisting of a A6 (A: alanine) sequence.6−9 In particular, SLPs with a cationic lysine headgroup, such as A6K (K: lysine), have been studied by several groups.10−17 We reported on the self-assembly of A6R (R: arginine) with a cationic and antimicrobial R headgroup.18 We showed that A6R forms ultrathin free-floating nanosheets in dilute aqueous solution and helically wrapped ribbons coexisting with nanotubes at high concentrations. In a previous work we also studied the SLP A6RGD (G: glycine, D: aspartic acid) containing the cell adhesion epitope RGD.19 The self-assembly motif and the biological activity of A6RGD in water changed with the peptide concentration. Vesicle and fibril formation were observed for the first time for an alanine-containing peptide. Films dried from low concentration A6RGD solutions allowed human cornea stromal fibroblasts (hCSFs) to attach and significantly enhaced cell proliferation, while films dried from concentrated A6RGD solutions were toxic to hCSFs.
Here, we functionalize for the first time the A6 sequence by attaching the H (H: histidine) residue, which has the ability to bind to transition metal ions, in particular, Zn2+ cations.20−23 The H-containing peptide amyloid β-peptide (Aβ) can form Alzheimer’s disease (AD) senile plaques in the human brain.24 Aggregation of Aβ, a key pathological event in AD, has been shown to be profoundly promoted by Zn2+ cations binding to the H-residues in the Aβ sequence.25−29 In particular, binding of Zn2+ has been observed in the core of senile plaques from AD brain.24 Treatment of the senile plaques with Zn2+ chelators can potentially reverse Zn2+ binding to H-residues leading to a disruption of senile plaques.
Zn2+ chelation technology, such as Zn2+ coordinated conjugation of polysaccharides (dextran and pullulan),30,31 has also been applied in gene delivery to specific tissues. In particular, Zn2+-coordinated conjugation of a dextran derivative with spermine (Sm) successfully enhanced the gene expression of plasmid DNA in tumors.30 It has also been shown that Zn2+-coordinated pullulan allows plasmid DNA to target the liver for gene expression and prolongs the duration of gene expression.31
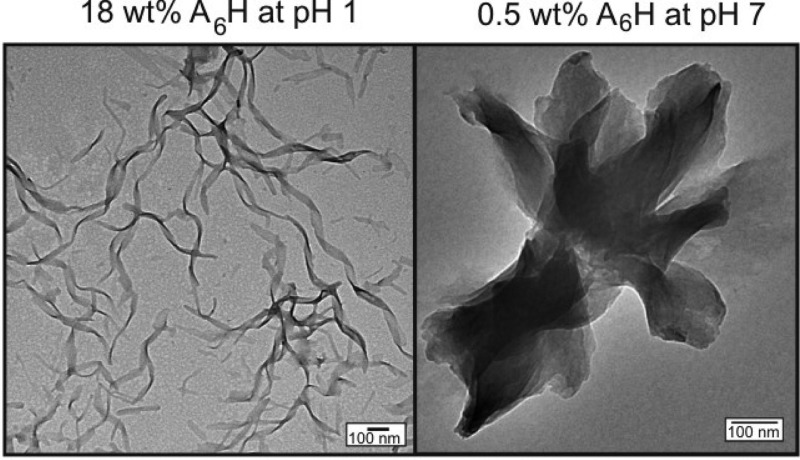
In this work we study the self-assembly of A6H in aqueous solutions and in ZnCl2 solutions. We prove that A6H chelates Zn2+ ions in neutral and acidic solutions. The binding sites within A6H for Zn2+ ions change according to the pH of the solution and that is related to changes in the self-assembly motif of the SLP.
Experimental Section
Materials
Peptide amphiphile A6H was purchased from Peptide Synthetics (U.K.) as the TFA salt and the purity was >95% by HPLC with Mw,found = 582.4 Da (Mw,expected = 581.6 Da) determined by electrospray-mass spectrometry. NaOH and ZnCl2 were purchased from Sigma-Aldrich (U.K.) and used as received. In this work we studied samples of A6H dissolved in water or in ZnCl2 solutions. As detailed in the Results, both A6H and A6H/ZnCl2 solutions have a pH below 7 throughout the range of concentrations studied in this work. Therefore, a second set of experiments was undertaken on A6H and A6H/ZnCl2 aqueous solutions with pH 7. Neutral pH was obtained, for experiments other than NMR, by titration of 2 wt % NaOH. For NMR experiments, A6H was suspended in buffered H2O (phosphate buffer, pH 6.9). In the following, we will use the notation (1:[ZnCl2]/[A6H]) ([ ]: molar concentration) to indicate the molar ratio of ZnCl2 to A6H. All the solutions studied in this work were mixed at room temperature. Experiments were made at least one day after sample preparation.
NMR
Experiments were performed using an instrument operating at 500 MHz for protons equipped with a 5 mm PFG probe. Experiments were carried out in 90:10 H2O/D2O mixtures. Solvent signals were suppressed using PRESAT. Chemical shift assignments were obtained from 2D 1H–1H COSY and TOCSY experiments.
Circular Dichroism (CD)
Spectra were recorded using a Chirascan spectropolarimeter (Applied Photophysics, U.K.). The sample was placed in a coverslip cuvette (0.01 mm thick). Spectra are presented with absorbance A < 2 at any measured point with a 0.5 nm step, 1 nm bandwidth, and 1 s collection time per step at 20 °C. The background subtracted data was corrected with the smoothing tool of the Chirascan software, using residual plots with a noise randomly distributed about zero.
Fourier Transform Infrared (FTIR) Spectroscopy
Spectra were recorded using a Nexus-FTIR spectrometer equipped with a DTGS detector and a multiple reflection attenuated total reflectance (ATR) system. A solution of A6H was sandwiched in ring spacers between two CaF2 plate windows (spacers 0.006 or 0.025 mm thick). All spectra were scanned 128 times over the range of 4000–950 cm–1.
Small-Angle X-ray Scattering (SAXS)
Experiments were performed on beamlines ID02 and BM29 at the ESRF (Grenoble, France). On beamline ID02, samples were placed in a glass capillary mounted in a brass block for temperature control. Micropumping was used to minimize beam damage by displacing a drop of the sample by 0.01–0.1 mm for each exposure. The sample-to-detector distance was 1 m, and the X-ray energy was 12.46 keV. The q = 4π sin θ/λ range was calibrated using silver behenate. Data processing (background subtraction, radial averaging) was performed using the software SAXSUtilities. On beamline BM29, a few microlitres of samples were injected via an automated sample exchanger at a slow and very reproducible flux into a quartz capillary (1.8 nm internal diameter), which was then placed in front of the X-ray beam. The quartz capillary was enclosed in a vacuum chamber, in order to avoid parasitic scattering. After the sample was injected in the capillary and reached the X-ray beam, the flow was stopped during the SAXS data acquisition. The q range was set to 0.004–0.4 Å–1, with λ = 1.03 Å (12 keV). The images were captured using a PILATUS 1 M detector. Data processing (background subtraction, radial averaging) was performed using dedicated beamline software ISPYB.
SAXS Theory
The SAXS intensity from a system of disordered particles is dominated by the particle form factor. In our model, the form factor was fitted to a model of Gaussian bilayers using the software SASfit.32 The details of the bilayer model are given elsewhere.33,34 The model assumes an electron density profile (Figure S2) comprising one Gaussian function for each headgroup on either side of the bilayer electron density (ρH) and one Gaussian function for the chains in the core of the bilayer electron density (ρC). The model also consists of the thickness zH, the standard deviation of the position of the Gaussian peak zH (σH) and the standard deviation of the position of the Gaussian peak at zC (σC). The bilayer is centered at z = zC = 0. We used a Gaussian distribution of zH, with associated degree of polydispersity ΔH. The background was fitted according to the Porod law35C1 + (C2/qC3). The fitting parameters of the model are σH, zH, ΔH, ρH, ρC, σC, C1, C2, and C3. From the fit parameters, it is possible to estimate a total layer thickness lT ∼ (2zH + 2σH) with an uncertainty ΔH.
Cryo-Transmission Electron Microscopy (cryo-TEM)
Experiments were carried out using a field emission cryo-electron microscope (JEOL JEM-3200FSC), operating at 300 kV. Images were taken in bright field mode and using zero loss energy filtering 8 (omega type) with a slit width 20 eV. Micrographs were recorded using a Gatan Ultrascan 4000 CCD camera. The specimen temperature was maintained at −187 °C during the imaging. Vitrified specimens were prepared using an automated a FEI Vitrobot device using Quantifoil 3.5/1 holey carbon copper grids with a hole size 3.5 μm. Just prior to use, grids were plasma cleaned using a Gatan Solarus 9500 plasma cleaner and then transferred into an environmental chamber of an FEI Vitrobot at room temperature and 100% humidity. Thereafter, 3 μL of sample solution was applied on the grid and it was blotted one time for 1 s and then vitrified in a 1/1 mixture of liquid ethane and propane at temperature of −180 °C. Grids with vitrified sample solutions were maintained at liquid nitrogen temperature and then cryo transferred in to the microscope.
Transmission Electron Microscopy (TEM)
TEM imaging was performed using a Philips CM20 TEM microscope operated at 200 kV. Droplets of A6H solutions were placed on Cu grids coated with a carbon film (Agar Scientific, U.K.), stained with uranyl acetate (2 wt %; Sigma-Aldrich, U.K.), and dried.
Raman Spectroscopy
Raman spectra were recorded using a Renishaw inVia Raman microscope. The light source was a multiline laser, and the experiments were performed using the λ = 785 nm edge. Experiments were made on stalks prepared by drying filaments of A6H solutions. The stalks were focused by using a ×50 magnification lens. Spectra were obtained in the interval 100–3000 cm–1, using 20 s collection time with 10% laser power and taking two averages.
Fiber X-ray Diffraction (XRD)
X-ray diffraction was performed on stalks prepared from A6H solutions. The stalk was mounted (vertically) onto the four axis goniometer of a RAXIS IV++ X-ray diffractometer (Rigaku) equipped with a rotating anode generator. The XRD data was collected using a Saturn 992 CCD camera.
Results
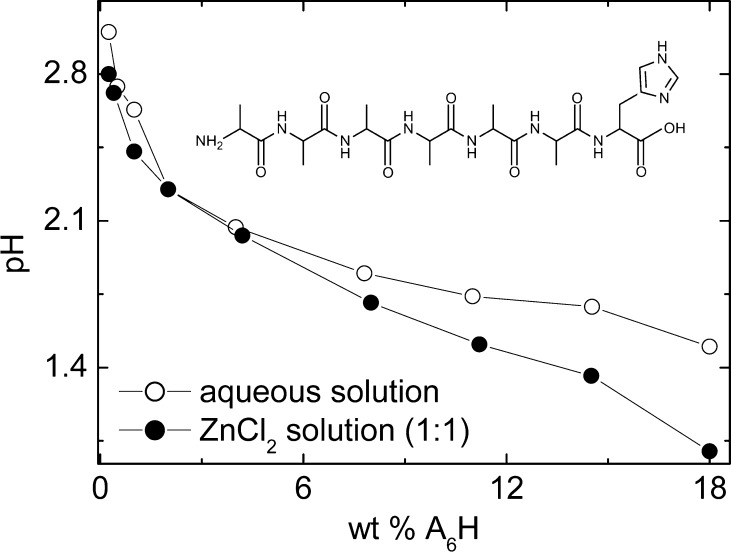
Figure 1 displays the chemical structure of A6H together with the dependence of the pH on the SLP concentration for samples containing A6H dissolved in water or in ZnCl2 solutions. Only solutions with the lowest used molar ratio A6H/ZnCl2 (1:1) are plotted in Figure 1. All pHs in Figure 1 are below 7. Increasing the ZnCl2 content above (1:1) for a fixed A6H concentration decreases the pH of the solution, and the solutions still remain acidic.
Figure 1.
Chemical structure of A6H and dependence of the pH with SLP concentration for A6H dissolved in water or in a ZnCl2 solution (1:1).
The imidazole side chain of the H residue (Figure 1) has pKa ∼ 7.36 Therefore, A6H molecules with protonated and deprotonated imidazole rings coexist in solution at pH 7, while only protonated H-rings are present below pH 7.
In the following we will first study the self-assembly of A6H and the binding of Zn2+ metal ions to A6H in aqueous solutions, with pH 3 to pH 1 (Figure 1). We will then proceed to study the self-assembly of A6H and Zn2+ binding in solutions with pH adjusted to 7.
Self-Assembly of A6H in Water and Study of Zn2+ Binding by A6H in Aqueous Solutions (pH 3 to pH 1)
In this section we study solutions of A6H in water or in ZnCl2 solution. Samples studied in this section have pH values between 3 and 1. In this pH range the interaction of Zn2+ with the imidazole ring in A6H would require deprotonation of the imidazole, that is, the substitution of the proton attached to the imidazole nitrogen atom by a coordinated Zn2+ cation (Figure 1). This process seems to be quite unfavorable for acidic solutions, where metal cations are more likely chelated by the numerous heteroatoms in A6H and not by the imidazole ring in the H residue.
We performed CD experiments to explore the secondary study of A6H in water and in ZnCl2 solution. The CD spectrum in the presence of ZnCl2 is characterized by a negative band at ∼194 nm and a weak positive band at ∼217 nm (Figure S1), characteristic of the polyproline II conformation.37 However, the spectrum for 1 wt % A6H without ZnCl2 (Figure S1) shows a much shallower minimum and maximum. This is characteristic of a disordered conformation.37
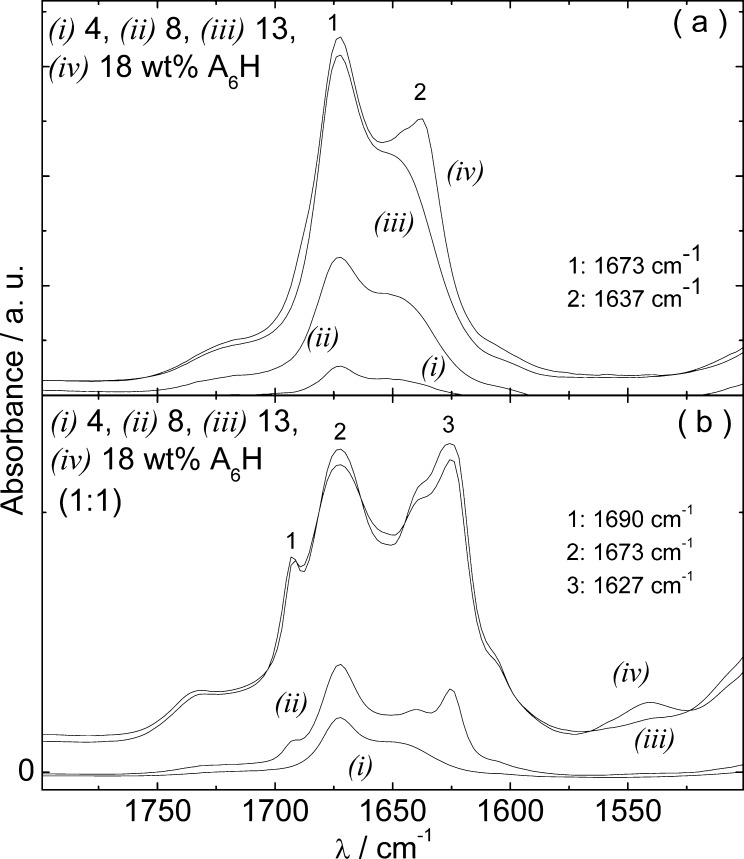
Figure 2 shows the FTIR results obtained for samples containing 4–18 wt % A6H and 4–18 wt % A6H (1:1). The peak at 1673 cm–1 is due to trifluoroacetic acid (TFA) counterions bound to the H residue.38,39 The spectra in Figure 2a reveal β-sheet order for 18 wt % A6H, due to the peak at 1637 cm–1.40−43 The peak at 1690 cm–1 together with the peak at 1627 cm–1 in Figure 2b, suggests antiparallel β-sheet formation.44−46 already for 8 wt % A6H (1:1). The shift of the β-sheet peak from 1637 cm–1 (Figure 2a) to 1627 cm–1 together with the antiparallel β-sheet formation (Figure 2b) provides indirect evidence of Zn2+ binding.
Figure 2.
FTIR spectra for A6H dissolved (a) in water and (b) in a ZnCl2 solution (1:1).
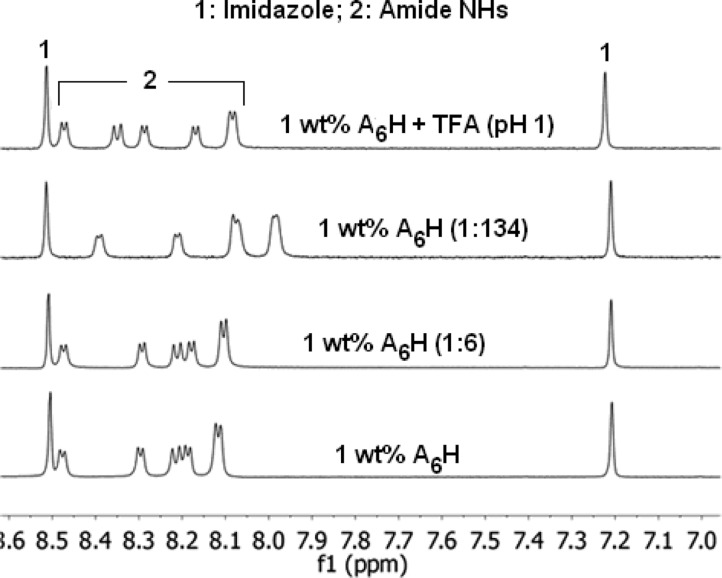
Figure 3 shows 1H NMR spectra measured for 1 wt % A6H in water and in ZnCl2 solutions with molar ratios (1:6) and (1:134). The NMR data for the A6H dissolved in TFA (pH 1) is also shown in Figure 3 as a reference for solution of A6H with a fully protonated imidazole ring at pH 1. NMR spectra for A6H in water show resonance signals corresponding to the amide NH groups and the imidazole ring of A6H (Figure 3). NMR indicates that the imidazole resonances are unaffected upon addition of Zn2+ even if a large excess is added, suggesting that the heterocycle remains protonated and no interaction with Zn2+ takes place. On the other hand, the NH resonances are affected by the addition of Zn2+ (Figure 3) pointing to the coordination of carbonyl oxygen atoms to the Zn2+ cation. It is possible that the coordination of the carbonyl oxygen atoms to the Zn2+ cations allows for the formation of β-sheets at only 8 wt % A6H for samples containing ZnCl2 (Figure 2b), as opposed to the 18 wt % peptide needed for solutions free of Zn2+ cations (Figure 2a).
Figure 3.
NMR for 1 wt % A6H dissolved in water and in ZnCl2 solution (1:134) and (1:6). NMR data for A6H dissolved in TFA is shown as a reference for the sample with a fully protonated imidazole ring (pH 1).
To investigate the effect of ZnCl2 on A6H nanostructure, we performed cryo-TEM and TEM. Aqueous solutions were studied at 18 wt % A6H. Addition of ZnCl2 to 18 wt % A6H solution dramatically increased the viscosity of the sample, turning it into a free-standing gel. Therefore, solutions containing ZnCl2 were studied at 9 and 13 wt % A6H by cryo-TEM and TEM, respectively (instead of 18 wt % A6H), because those are the concentrations closest to 18 wt % fluid enough to allow for microscopy specimen preparation.
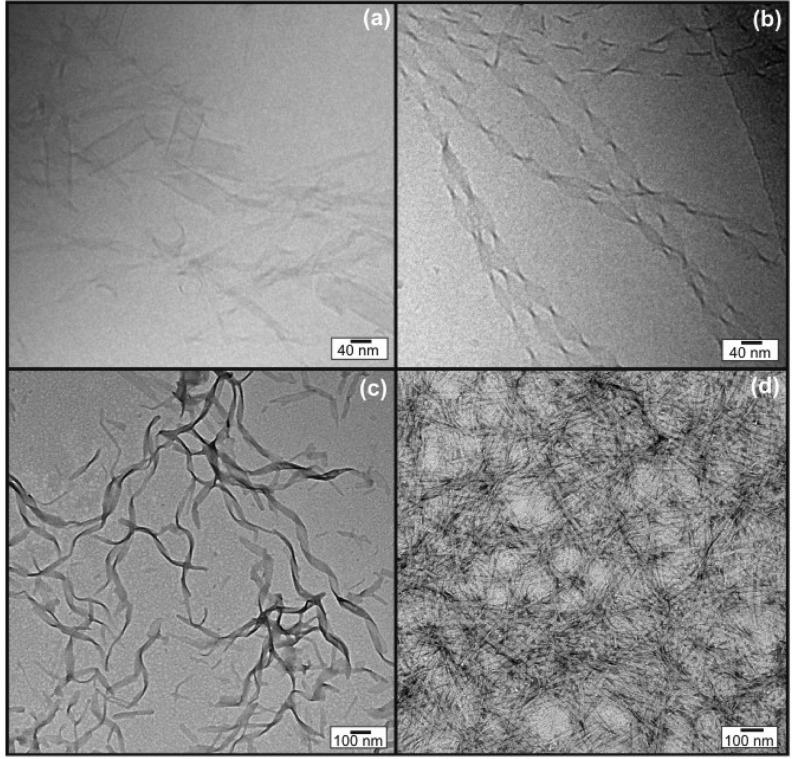
Cryo-TEM experiments provide direct evidence for the self-assembled structure for 18 wt % A6H and 9 wt % A6H (1:1; Figure 4a,b). The 18 wt % A6H sample contained mostly large aggregates resembling ribbons (Figure 4a). Only in a few positions were the edges of the aggregates thin enough to identify sheet-like structures. The width of the sheets in this sample varies between 18 and 52 nm, and the narrow sheets tend to twist more often. The 9 wt % A6H (1:1) sample contained long sheets, 30–50 nm thick, that make helical coils in at least two ways (Figure 4b). The length of the repeat (helix pitch) varies from about 110 to about 190 nm.47
Figure 4.
Cryo-TEM images measured for (a) 18 wt % A6H in water and (b) 9 wt % A6H in a ZnCl2 solution (1:1). TEM images for (c) 18 wt % A6H and (d) 13 wt % A6H in a ZnCl2 solution (1:1).
Figure 4c,d show TEM images obtained for samples dried from 18 wt % A6H and 13 wt % A6H (1:1) solutions. In good agreement with cryo-TEM data, A6H in water self-assembles into wide twisted nanotapes 38.3 ± 8.0 nm thick (Figure 4c), while A6H dissolved in ZnCl2 solutions produces nanotapes 24.2 ± 2.4 nm thick (Figure 4d).
SAXS results are consistent with the self-assembly of A6H in nanotapes. The SAXS profiles measured for samples containing 18 wt % A6H are displayed in Figure S2. The data in Figure S2 was modeled according to a system of Gaussian bilayers, which is in good agreement with the nanotape motif of A6H and is consistent with our previous modeling of SAXS data for nanotape-forming peptide amphiphiles.48−51 The SAXS fit in Figure S2 deviates from the experimental data at very low q for 18 wt % A6H (1:1) because our model does not consider structure factor effects. The parameters obtained from the fits to the data in Figure S2 are listed in Table S1.
The estimated length of the A6H molecule in an antiparallel β-sheet conformation is lE = 7 × 3.4 Å = 23.8 Å (3.4 Å: repeat distance for each residue comprising the β-sheet).52 Therefore, a bilayer comprising A6H molecules in an extended configuration would be ∼2 × lE = 47.6 Å thick.
On the basis of the poor water solubility of the A6 block, we expect that the nanotapes are built out of A6H bilayers, with interdigitated hydrophobic A6 “tails” and H residues exposed to water. This model is confirmed by lT ∼ 33 Å < 2 ×lE obtained for 18 wt % A6H in water (Table S1). A similar structure has previously been proposed by us for free floating sheets of A6R and A12R2 in solution,18,53 and A6RGD fibers.19 An interdigitated bilayer structure is also formed for A6H in a ZnCl2 solution (1:1), since lT ∼ 19.7 Å listed in Table S1.
Raman spectroscopy on stalks dried from 18 wt % A6H in water and 18 wt % A6H in a ZnCl2 solution (1:1) reveal changes in the stretching and bending vibrations bands due to the binding of Zn2+ ions. Figures S3a,b and S3c,d display the 800–1800 cm–1 and the 2700–3400 cm–1 regions of the Raman spectra, respectively. Addition of ZnCl2 leads to frequency and intensity changes for the amide III peak (1240 cm–1), for the amine N–H bend (1315 cm–1),21,54 for the CH3 group deformation (1442 cm–1),21,54 and for the amine N–H stretching (3273 cm–1). The Raman peaks for β-sheet (1662 cm–1) and C–H stretch in the CH3 group (2934 and 2986 cm–1)54 change their shape and intensity in the presence of ZnCl2. Not surprisingly, given the findings from NMR, Raman peaks for the imidazole ring bending vibration (902 and 1091 cm–1)21 remain unaltered under the addition of Zn2+ cations to the solution.
The Raman spectra show that mainly the A6 chain backbone is affected by the addition of ZnCl2 to the solution, most likely due to the binding of Zn2+ cations. This supports our conclusions from the NMR experiments.
Figure S4 shows the XRD profiles obtained by integration of isotropic XRD fiber diffraction patterns measured for stalks dried from 18 wt % A6H without and with (1:1) ZnCl2, also studied by Raman spectroscopy (Figure S3).
XRD for 18 wt % A6H shows reflexions with spacings d = 26.8, 5.4, 4.4, and 3.8 Å. In particular, the reflection at 5.4 Å in Figure S4 corresponds to the reflection at 5.3 Å in the SAXS pattern in Figure S2. We associate the spacing 26.8 Å with the length lT ∼ 33 Å obtained from the modeling the SAXS data (Table S1), allowing for dehydration or drying. We base the indexation of the spacings for 18 wt % A6H on the indexation of similar XRD patterns previously reported by us for A6K14, A6R,18A12R2,53 and A6RGD19 in water. On that basis, d = 5.4 Å is assigned to the stacking distance between β-sheets and d = 4.4 Å is due to the β-strand spacing. The spacing 3.8 Å is ascribed to the diffraction from planes containing Cα moieties.55,56 The relatively small β-sheet stacking distance and β-sheet strand spacing are due to the efficient packing of A residues57 and is consistent with a compact structure as observed for other alanine–rich peptides.57
The XRD profile for 18 wt % A6H (1:1; Figure S4) shows reflections at 35.9, 5.4, and 4.8 Å. The spacings 5.4 and 4.8 Å in Figure S4 are close to the spacings 5.6 and 4.9 Å, respectively, in the SAXS pattern in Figure S2. A long spacing d = 32.3 Å, similar to 35.9 Å in Figure S4, was already observed for free floating sheets of A6R in water and ascribed to a dehydration-driven multilamellar stacking.18
The spacings 5.4 and 4.8 Å in Figure S4 correspond to the β-sheet stacking distance and strand spacing, respectively.
A shift in the β-sheet spacing from 4.4 Å (aqueous solution) to 4.8 Å (1:1 ZnCl2) is a consequence of Zn2+ ion chelation by A6H. This is consistent with NMR results that show the presence of Zn2+ cations (Figure 3), coordinated to the carboxyl oxygen atoms of the amide chain and entrapped within the hydrophobic core of the β-sheet tapes.
Self-Assembly of A6H and Study of Zn2+ Binding by A6H in Aqueous Solutions at Neutral pH
In this section we present results for solutions for which the pH of all the samples has been fixed to 7. A6H molecules with protonated and deprotonated imidazole H rings coexist in solution at pH 7. A deprotonated imidazole ring favors binding of Zn2+ cations through the substitution of the proton attached to the imidazole nitrogen atom by a coordinated Zn2+ cation.
Solutions of A6H in water or ZnCl2 were cloudy and precipitated within 30 min at room temperature for concentrations equal or higher than 0.25 wt %. The sample precipitation might be the signature of pseudocrystallites formation due to charge neutralization. We studied these samples at room temperature using techniques that allow for fast specimen preparation and data acquisition (FTIR, SAXS) or that are not affected by the formation of pseudocrystallites in the sample (TEM, cryo-TEM and XRD). In contrast, the formation of large precipitates can screen the NMR signal. However, despite the white precipitate present at room temperature, at 30 °C appreciable quantities of product were soluble showing sharp NMR signals.
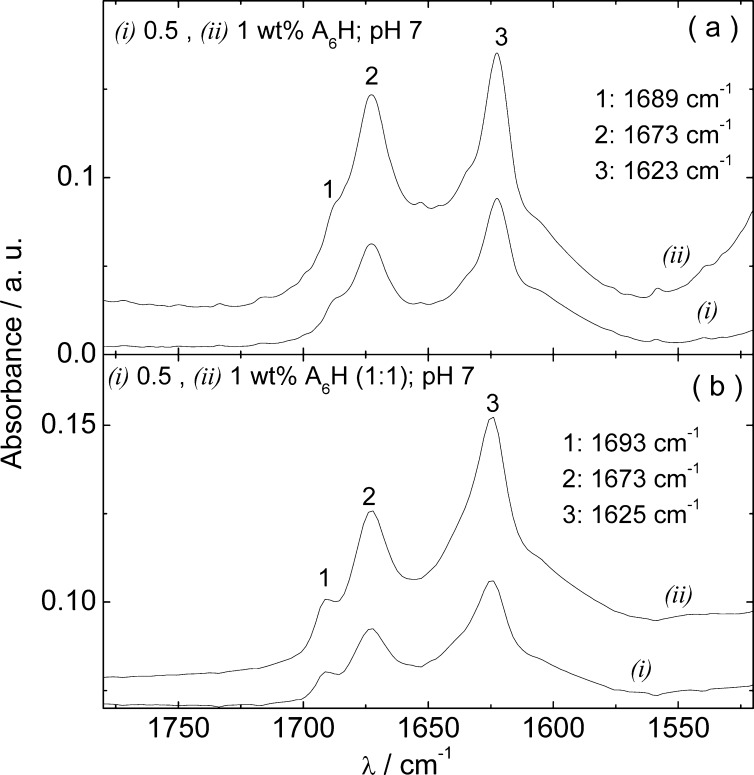
Figure 5 displays the FTIR results measured for 0.5 and 1 wt % A6H in water and in a ZnCl2 solution (1:1) at pH 7. The spectra clearly correspond to an antiparallel β-sheet structure, with positive FTIR bands at 1689–1693 and 1623–1625 cm–1.44−46 Figure 5 shows that the neutralization of A6H solutions reduces the onset for β-sheet formation from 18 to less than 0.5 wt % for A6H in water and from 8 to 0.5 wt % for A6H in ZnCl2 solutions (1:1; Figure 2).
Figure 5.
FTIR spectra for A6H at pH 7 dissolved (a) in water and in (b) in a ZnCl2 solution (1:1).
Integration of the NMR signals using a external standard (hydroquinone in a concentric tube) revealed that the solubility of a 1 wt % A6H solution decreased with temperature from 0.16% to 0.11% upon heating from 30 to 80 °C (Figure S5). Addition of Zn2+ increased the solubility of the peptide (Figure S5). For example, for a A6H in ZnCl2 solution (1:3.5), the solubility at 30 °C increased from 0.16% to 0.46% upon Zn2+ addition (Figure S5). The temperature decrease of solubility was also associated to a shift of the imidazole ring protons resonance, which can be tentatively ascribed to a temperature-induced deprotonation of the heterocyclic ring (Figure S6). DOSY experiments did not reveal significant differences in diffusion coefficients when corrected by temperature and viscosity changes
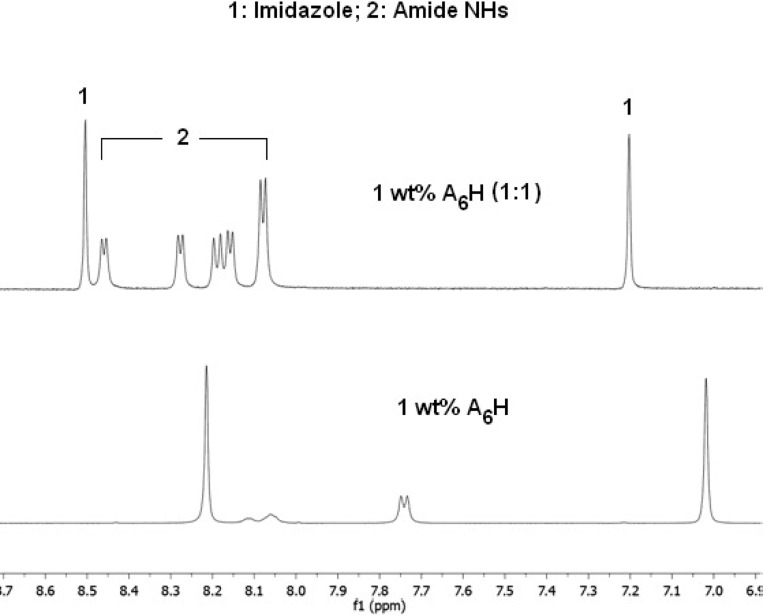
Figures 6 and S7 show very clearly that the addition of ZnCl2 is associated with an interaction of the imidazole ring with Zn2+, which results in a dramatic shift of the proton resonances of the heterocycle. This is in contrast with the results at lower pH. This effect can be ascribed to the coordination of the nitrogen atoms of imidazole with ZnCl2. Remarkably, addition of ZnCl2 resulted in the appearance of the amide NH signals that were hidden or broad in pH 7 buffer solution (Figure 6). Presumably, the coordination of the imidazole basic nitrogen to Zn2+ prevents its action as catalyst for the NH–H2O exchange process.58
Figure 6.
1H NMR spectra measured at 30 °C, for 1 wt % A6H dissolved in buffer (pH 7) and in buffer with ZnCl2 (1:1).
Solutions of A6H were examined using TEM and cryo-TEM. Figure 7a shows a TEM image obtained for a sample dried from 0.5 wt % A6H (pH 7). The self-assembly motif consists of sheets, ∼(200–330) nm thick, which were observed to be isolated or arranged in bundles such as that shown in Figure 7a. TEM and cryo-TEM images for 0.5 wt % A6H (1:1), pH 7, are shown in Figure 7b and c, respectively. The self-assembly motif of this sample is very different from the others studied in this work and consists of pseudocrystalline particles formed by several plate/tape-like sheets. The particles are fairly large, ∼1 μm in length, and seem to grow in a fan-like form from one end and consist of several joined plate/tape-like sheets. The number of sheets varies from just a few to about two dozen depending on the particle.
Figure 7.
(a) TEM images for 0.5 wt % A6H at pH 7 dissolved in (a) water and (b) in a ZnCl2 solution (1:1); (c) cryo-TEM image for the same sample studied in (b).
Figure S8 shows the SAXS profiles measured for 0.25 wt % A6H at pH 7 without and with ZnCl2 (1:1). The experimental data was modeled according to a Gaussian bilayer model as described earlier. The fit parameters are listed in Table S1. According to the results in Table S1, 0.25 wt % A6H (pH 7) adopts a bilayer structure with highly interdigitated bilayers, very similar to that described above for samples with pH 1–2. However lT fitted for 0.25 wt % A6H (1:1) pH 7 (Table S1) shows a dramatic enlargement of the bilayers upon adding NaOH to samples containing ZnCl2. It is possible that the enlargement of the peptide bilayers is associated to the pseudocrystalline structure of the particles shown in Figure 7b,c.
Figure S9 shows the XRD intensity profiles obtained for stalks dried from 4 wt % A6H at pH 7, without and with ZnCl2 (1:1). Both XRD spectra in Figure S9 show reflections with spacings d = 35.9, 5.4, 4.4, and 3.8 Å. Reflections at 35.9, 5.4, 4.4, and 3.8 Å have been discussed above in relation to acidic solutions with and without ZnCl2. In particular, d = 35.9 Å was measured for acidic solutions with ZnCl2 at pH 1–2. Here, it is measured also for solutions free of metal cations at pH 7, because their particular self-assembly motif (Figure 7a) favors a dehydration-driven multilamellar stacking.
Conclusions
In this work we studied the self-assembly of A6H and the binding of Zn2+ metal ions to A6H in aqueous solutions under acidic or neutral conditions. We proved that a change from acidic to neutral conditions lead to a dramatic effect on A6H self-assembly and the chelation of Zn2+ ions by this SLP.
A6H self-assembles, under acidic conditions, into nanotapes comprising bilayers with a hydrophobic interior of interdigitated alanine chains with H residues exposed to water. Peptide nanotapes are held together by a β-sheet structure. The onset concentration for nanotape formation can be reduced 2-fold by the addition (1:1) of Zn2+ ions to the solution, because the coordination of the carbonyl oxygen atoms to the Zn2+ ions enables β-sheet formation at lower concentrations.
A6H mixed with water or ZnCl2 solutions precipitates under neutral conditions after ∼30 min of mixing. Aqueous A6H solutions produce short sheets, while neutral A6H/ZnCl2 solutions contain pseudocrystalline particles consisting of several plate/tape-like sheets. Both nanosheets and pseudocrystalline structures contain an internal bilayer structure, similar to that described for the system in acidic conditions. As expected, the imidazole ring of the H residue chelates Zn2+ ions in neutral conditions. Despite changing the self-assembly motif as a whole, the changes in pH do not change the internal structure of the aggregates that is ruled by the amphiphilic-like nature of A6H.
Acknowledgments
This work was supported by EPSRC Grants EP/F048114/1 and EP/G026203/1 and BBSRC BB/I008187/1. We would like to acknowledge A. Round for support during the beamtime at BM29 (Project Number MX1511). We acknowledge the University of Reading (U.K.) for access to the Chemical Analysis Facility and the Electron Microscopy Laboratory.
Supporting Information Available
CD, Raman, SAXS, NMR, and XRD data and parameters obtained from the fittings to the SAXS data are available. This material is available free of charge via the Internet at http://pubs.acs.org.
The authors declare no competing financial interest.
Supplementary Material
References
- Vauthey S.; Santoso S.; Gong H.; Watson N.; Zhang S. Proc. Natl. Acad. Sci. U.S.A. 2002, 99, 5355–5360. [DOI] [PMC free article] [PubMed] [Google Scholar]
- Santoso S.; Hwang W.; Hartman H.; Zhang S. Nano Lett. 2002, 2, 687–691. [Google Scholar]
- Hamley I. W. Soft Matter 2011, 7, 4122–4138. [Google Scholar]
- Zhang S. G. Nat. Biotechnol. 2003, 21, 1171–1178. [DOI] [PubMed] [Google Scholar]
- Zhao X. B.; Pan F.; Xu H.; Yaseen M.; Shan H. H.; Hauser C. A. E.; Zhang S. G.; Lu J. Chem. Soc. Rev. 2010, 39, 3480–3498. [DOI] [PubMed] [Google Scholar]
- Vauthey S.; Santoso S.; Gong H.; Watson N.; Zhang S. G. Proc. Natl. Acad. Sci. U.S.A. 2002, 99, 5355–5360. [DOI] [PMC free article] [PubMed] [Google Scholar]
- von Maltzahn G.; Vauthey S.; Santoso S.; Zhang S. G. Langmuir 2003, 19, 4332–4337. [Google Scholar]
- Ellis-Behnke R. G.; Liang Y. X.; You S. W.; Tay D. K. C.; Zhang S. G.; So K. F.; Schneider G. E. Proc. Natl. Acad. Sci. U.S.A. 2006, 103, 5054–5059. [DOI] [PMC free article] [PubMed] [Google Scholar]
- Das R.; Kiley P. J.; Segal M.; Norville J.; Yu A. A.; Wang L. Y.; Trammell S. A.; Reddick L. E.; Kumar R.; Stellacci F.; Lebedev N.; Schnur J.; Bruce B. D.; Zhang S. G.; Baldo M. Nano Lett. 2004, 4, 1079–1083. [Google Scholar]
- Chen C. X.; Pan F.; Zhang S. Z.; Hu J.; Cao M. W.; Wang J.; Xu H.; Zhao X. B.; Lu J. R. Biomacromolecules 2010, 11, 402–411. [DOI] [PubMed] [Google Scholar]
- Bucak S.; Cenker C.; Nasir I.; Olsson U.; Zackrisson M. Langmuir 2009, 25, 4262–4265. [DOI] [PubMed] [Google Scholar]
- Nagai A.; Nagai Y.; Qu H. J.; Zhang S. G. J. Nanosci. Nanotechnol. 2007, 7, 2246–2252. [DOI] [PubMed] [Google Scholar]
- Khoe U.; Yang Y. L.; Zhang S. G. Macromol. Biosci. 2008, 8, 1060–1067. [DOI] [PubMed] [Google Scholar]
- Castelletto V.; Nutt D.; Hamley I. W.; Bucak S.; Cenker C.; Olsson U. Chem. Commun. 2010, 46, 6270–6272. [DOI] [PubMed] [Google Scholar]
- Middleton D. A.; Madine J.; Castelletto V.; Hamley I. W. Angew. Chem., Int. Ed. 2013, 52, 10537–10540. [DOI] [PMC free article] [PubMed] [Google Scholar]
- Chen C. X.; Pan F.; Zhang S. Z.; Hu J.; Cao M. W.; Wang J.; Xu H.; Zhao X. B.; Lu J. R. Biomacromolecules 2010, 11, 402–411. [DOI] [PubMed] [Google Scholar]
- Xu H.; Wang J.; Han S. Y.; Wang J. Q.; Yu D. Y.; Zhang H. Y.; Xia D. H.; Zhao X. B.; Waigh T. A.; Lu J. R. Langmuir 2009, 25, 4115–4123. [DOI] [PubMed] [Google Scholar]
- Hamley I. W.; Dehsorkhi A.; Castelletto V. Chem. Commun. 2013, 49, 1850–1852. [DOI] [PubMed] [Google Scholar]
- Castelletto V.; Gouveia R. M.; Connon C. J.; Hamley I. W.; Seitsonen J.; Nykänen A.; Ruokolainen J. Biomater. Sci. 2014, 10.1039/C3BM60232J. [DOI] [PubMed] [Google Scholar]
- Torreggiani A.; Fini G.; Bottura G. J. Mol. Struct. 2001, 565–566, 341–346. [Google Scholar]
- Torregiani A.; Bonora S.; Fini G. Biopolymers 2000, 57, 352–364. [DOI] [PubMed] [Google Scholar]
- Lenz G. R.; Martell A. E. Biochemistry 1964, 3, 750–753. [DOI] [PubMed] [Google Scholar]
- Lenz G. R.; Martell A. E. Biochemistry 1964, 3, 745–750. [DOI] [PubMed] [Google Scholar]
- Dong J.; Atwood C. S.; Anderson V. E.; Siedlak S. L.; Smith M. A.; Perry G.; Carey P. R. Biochemistry 2003, 42, 2768–2773. [DOI] [PubMed] [Google Scholar]
- Talmard C.; Bouzan A.; Faller P. Biochemistry 2007, 46, 13658–13666. [DOI] [PubMed] [Google Scholar]
- Hamley I. W. Chem. Rev. 2012, 112, 5147–5192. [DOI] [PubMed] [Google Scholar]
- Suzuki K.; Miura T.; Takeuchi H. Biochem. Biophys. Res. Commun. 2001, 285, 991–996. [DOI] [PubMed] [Google Scholar]
- Miura T.; Suzuki K.; Kohata N.; Takeuchi H. Biochemistry 2000, 39, 7024–7031. [DOI] [PubMed] [Google Scholar]
- Yang D.-S.; McLaurin J. A.; Qin K.; Westaway D.; Fraser P. E. Eur. J. Biochem. 2000, 267, 6692–6698. [DOI] [PubMed] [Google Scholar]
- Hosseinkhani H.; Aoyama T.; Ogawa O.; Tabaya Y. J. Controlled Release 2003, 88, 297–312. [DOI] [PubMed] [Google Scholar]
- Hosseinkhani H.; Aoyama T.; Ogawa O.; Tabata Y. J. Controlled Release 2002, 83, 287–302. [DOI] [PubMed] [Google Scholar]
- Kohlbrecher J.; Bressler I.. SASfit, A program for fitting simple structural models to small angle scattering data; PSI: Switzerland, 2011.
- Pabst G.; Rappolt M.; Amenitsch H.; Laggner P. Phys. Rev. E 2000, 62, 4000–4008. [DOI] [PubMed] [Google Scholar]
- Castelletto V.; Cheng G.; Stain C.; Connon C.; Hamley I. Langmuir 2012, 28, 11599–11608. [DOI] [PubMed] [Google Scholar]
- Guinier A.; Fournet G.. Small-Angle Scattering of X-rays, John Wiley & Sons, Inc.: New York, 1955. [Google Scholar]
- Walba H.; Isensee R. W. J. Org. Chem. 1961, 26, 2789–2791. [Google Scholar]
- Paramonov S. E.; Jun H. W.; Hartgerink J. D. J. Am. Chem. Soc. 2006, 128, 7291–7298. [DOI] [PubMed] [Google Scholar]
- Gaussier H.; Morency H.; Lavoie M. C.; Subirade M. Appl. Environ. Microbiol. 2002, 68, 4803–4808. [DOI] [PMC free article] [PubMed] [Google Scholar]
- Pelton J. T.; McLean L. R. Anal. Biochem. 2000, 277, 167–176. [DOI] [PubMed] [Google Scholar]
- Haris P.; Chapman D. Biopolymers 1995, 37, 251–263. [DOI] [PubMed] [Google Scholar]
- Stuart B.Biological Applications of Infrared Spectroscopy; Wiley: Chichester, 1997. [Google Scholar]
- Rosler A.; Klok H.-A.; Hamley I. W.; Castelletto V.; Mykhaylyk O. O. Biomacromolecules 2003, 4, 859–863. [DOI] [PubMed] [Google Scholar]
- Miyazawa T.; Blout E. R. J. Am. Chem. Soc. 1961, 83, 712–719. [Google Scholar]
- Krimm S.; Bandekar J. J. Adv. Protein Chem. 1986, 38, 181–364. [DOI] [PubMed] [Google Scholar]
- Barth A. Biochim. Biophys. Acta, Bioenerg. 2007, 1767, 1073–1101. [DOI] [PubMed] [Google Scholar]
- Barth A.; Zscherp C. Q. Rev. Biophys. 2002, 35, 369–430. [DOI] [PubMed] [Google Scholar]
- Adamcik J.; Jung J. M.; Flakowski J.; De Los Rios P.; Dietler G.; Mezzenga R. Nat. Nanotechnol. 2010, 5, 423–428. [DOI] [PubMed] [Google Scholar]
- Castelletto V.; Cheng G.; Greenland B. W.; Hamley I. W.; Harris P. J. F. Langmuir 2011, 27, 2980–2988. [DOI] [PubMed] [Google Scholar]
- Castelletto V.; Gouveia R.; Connon C. J.; Hamley I. W. Faraday Discuss. 2013, 10.1039/C1033FD00064H. [DOI] [PubMed] [Google Scholar]
- Castelletto V.; Hamley I. W.; Adamcik J.; Mezzenga R.; Gummel J. Soft Matter 2012, 8, 217–226. [Google Scholar]
- Castelletto V.; Hamley I. W.; Whitehouse C.; Matts P. J.; Osborne R.; Baker E. S. Langmuir 2013, 29, 9149–9155. [DOI] [PubMed] [Google Scholar]
- Creighton T. E.Proteins: Structures and Molecular Properties; W.H. Freeman: New York, 1992. [Google Scholar]
- Hamley I. W.; Dehsorkhi A.; Castelletto V.; Seitsonen J.; Ruokolainen J.; Iatrou H. Soft Matter 2013, 9, 4794–4801. [Google Scholar]
- Kumar S.; Rai A. K.; Rai S. B.; Rai D. K.; Singh A. N.; Singh V. B. J. Mol. Struct. 2006, 791, 23–29. [Google Scholar]
- Sunde M.; Serpell L. C.; Bartlam M.; Fraser P. E.; Pepys M. B.; Blake C. C. F. J. Mol. Biol. 1997, 273, 729–739. [DOI] [PubMed] [Google Scholar]
- Serpell L. C. Biochim. Biophys. Acta, Bioenerg. 2000, 1502, 16–30. [DOI] [PubMed] [Google Scholar]
- Rathore O.; Sogah D. Y. J. Am. Chem. Soc. 2001, 123, 5231–5239. [DOI] [PubMed] [Google Scholar]
- Eriksson M.; Hard T.; Nilsson L. Biophys. J. 1995, 69, 329–339. [DOI] [PMC free article] [PubMed] [Google Scholar]
Associated Data
This section collects any data citations, data availability statements, or supplementary materials included in this article.


