

Abstract
Despite intensive efforts on annotation of eukaryotic transcriptoms, little is known about the regulation of low-abundance transcripts. To address this question, we analysed the regulation of novel low-abundance transcript variants of human acyl-CoA binding protein (ACBP), an important multifunctional housekeeping protein, which we have identified by screening of human expressed sequence tags in combination with ab initio gene prediction. By using RT-, real-time RT- and rapid amplification of cDNA ends-PCR in five human tissues, we find these transcripts, which are generated by a consequent use of alternative promoters and alternate first or first two exons, to be authentic ones. They show a tissue-specific distribution and intrinsic responsiveness to glucose and insulin. Promoter analyses of the corresponding transcripts revealed a differential regulation mediated by sterol regulatory element-binding protein-2, hepatocyte nuclear factor-4α and nuclear factor κB (NF-κB), central transcription factors of fat and glucose metabolism and inflammation. Subcellular localization studies of deduced isoforms in liver HepG2 cells showed that they are distributed in different compartments. By demonstrating that ACBP is a target of NF-κB, our findings link fatty acid metabolism with inflammation. Furthermore, our findings show that low-abundance transcripts are regulated in a similar mode than their high-abundance counterparts.
Keywords: diazepam binding inhibitor, alternative promoters, alternative splicing, NF-κB-specific regulation, inflammation
Introduction
In the past few years it became evident from transcription studies (tiling array and tag sequencing data) that the eukaryotic genome is transcribed to a much higher extent than assumed. In addition to this process of pervasive transcription which produces a high amount of non-coding RNAs with unknown functions [1–3], the presence and function of rare messages or lower abundance transcripts is intensively discussed. They are widely present in yeast, fly, mouse, rat, human, Arabidopsis and rice and account for 20%–40% of the mRNA mass [4]. So far, little is known about their specific regulation and function [5, 6]. It has been suggested that high-abundance transcripts are produced by housekeeping genes, while low-abundance transcripts may meet more specialized functions [5]. Here we analysed the transcript profile of the human acyl-CoA binding protein (ACBP) gene locus with particular emphasis on the regulation of low-abundance transcripts. We selected this gene because ACBP functions as a typical housekeeping protein with basic cellular functions such as fatty acid metabolism and steroidogenesis but is also described to mediate highly specialized and regulated processes such as insulin secretion [7, 8], cholecystokinin secretion [9], inflammation [10–12] or apoptosis [13]. ACBP and its cleavage peptides also play an important role in γ-aminobutyric acid A receptor activity regulation. Based on this function it is called diazepam binding inhibitor or Endozepine [14, 15]. It also interacts with peripheral benzodiazepine receptors that have been found at high levels in steroidogenic organs, lymphocytes, macrophages/granulocytes, platelets and in the peripheral nervous system [15–19]. The question arises how ACBP can achieve multiple regulatory functions. So far, three different splice variants of the ACBP gene have been reported [20]. By using bioinformatic approaches such as expressed sequence tag database screening and ab initio gene prediction followed by experimental verifications we identified 10 authentic low-abundance ACBP transcripts which were produced by extensive alternative splicing and alternative promoter usage. A detailed characterization provides evidence for a specific regulation of these transcripts encoding different ACBP isoforms which are localized in distinct subcellular compartments. In addition, we found one transcript variant to be a novel nuclear factor κB (NF-κB) target, associating for the first time ACBP with inflammation. Notwithstanding of the unknown precise role of the ACBP transcript variants, their specific regulation suggest a specific function and their identification is crucial for the understanding of related ACBP functions.
Materials and methods
In silico analyses of the human Acbp gene locus
Acbp transcript variants were identified by screening the EST database (dbEST) of NCBI in combination with ab initio gene prediction using the GenScan gene structure recognition program [21]. Genomic Acbp sequence was obtained from GenBank (NT_022135.15, Homo sapiens Build 36.2) starting at nucleotide position 8,832,152. ESTs and ab initio sequences were used as queries for BLASTx (NCBI) against the non-redundant protein database and NCBP BLASTp was used for protein alignments (http://blast.ncbi.nlm.nih.gov/Blast.cgi). Deduced protein sequences were obtained using ORF prediction of the ExPASy server of the Swiss Institute of Bioinformatics (SIB) and compared to known proteins (SWISSProt/TrEMBL) using BLASTP. DNA and protein sequence alignments were carried out using programs of NCBI, EBI and http://www.expasy.org/prosite. ACBP promoter fragments were analysed for putative transcription factor binding sites using the TransFac program (Biobase, 7.0 Public 2005, http://www.gene-regulation.com/pub/databases.html).
Nomenclature of Acbp transcript variants
Based on this, we entitled the four known Acbp transcript variants as 1A(1) (NM_001079862), 1B (M14200), 1D(1)-B(1) (NM_020548) and 1C (NM_001079863) encoding the three known isoforms ACBP-1A (87 amino acids (aa), NP_001073331), ACBP-1B (104 aa, NP_065438) and ACBP-1C (88 aa, NP_001073332). Although NM_020548 is deposited in GenBank (NCBI) as reference sequence that includes exon 1D(1) as first exon preceding exon 1B, 1D(1) is not included in the current Acbp gene model. The model refers to M14200, where exon 1B is classified as first exon. Hence, 1D(1) is a so far undescribed alternative first exon. The four novel Acbp transcript variants are characterized by unique 5′-ends and are named 1A(1)-B(1), 1A(1)-B(2), 1D(1) and 1D(2). Transcripts 1A(1)-B(1) and 1A(1)-B(2) are composed of five exons and differ only by 5 bp that are absent in exon B(2), a 5′-exon of B(1), produced by the usage of an alternative splice site acceptor. Transcripts 1D(1) and 1D(2) contain four exons where exon 1D(2) is a 3′-exon of 1D(1) showing an extension of 249 bp due to the usage of an alternative donor splice site (Figs 1 and 2).
Fig 1.
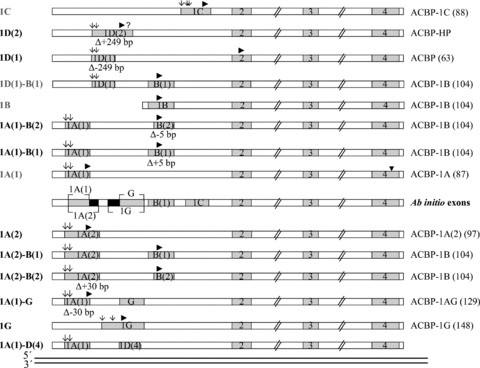
Schematic representation of alternatively spliced Acbp transcripts based on ESTs and ab initio analyses. Each thick line represents the alignment of a single EST or ab initio model with the Acbp gene. Exons are shaded, the white boxes represent introns. The number of each exon is given within the box. Translation start sites are indicated with a filled arrowhead, alternative TSSs with arrows. All transcripts show variable 5′-ends followed by the shared sequence for exons 2 to 4. Exon B(2) represents the 5′-exon of B(1) and is 5 bp smaller in size due to an alternative 3′-splice acceptor site, exon 1D(2) is the extended 3′-exon of 1D(1) generated by an alternative 5′-splice donor site. Exon 1A(2) is the non-EST based ab initio 3′- exon of 1A(1) showing an extension of 30 bp. Ab initio exon G represents the internal form, whereas 1G is a further alternative first exon. The number of amino acid residues of deduced ACBP isoforms is given in parentheses.
Fig 2.
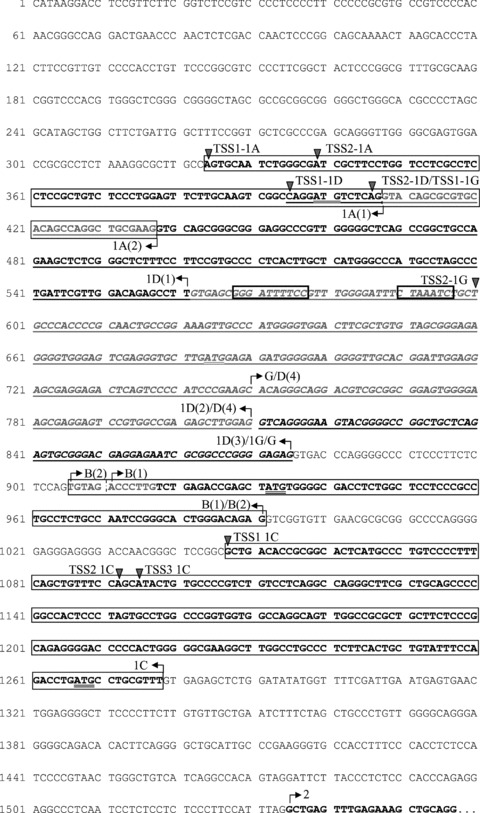
Nucleotide sequence of human Acbp. Shown is the 5′-part of the genomic sequence NT_022135.15 (start position 8,832,152 nt) inclusive of the first 23 bp of exon 2. Exons are in bold, to distinguish overlapping exons some are also underlined. Exons 1A, 1D, 1C and 1G represent the alternative first exons, exons B(1) and B(2) are forms of the alternative internal exon B. TSSs are marked with a triangle, arrows indicate exon boundaries, ATG translation starts are double underlined. Base position 1 is the 5′-end of the alternative promoter fragments.
Verification of Acbp splice variants by RT-PCR and sequencing
Poly(A)+ mRNA of human liver, hippocampus, heart, skeletal muscle and adipose tissue was received from Clontech Laboratories Inc (Mountain View, CA, USA). At least two different batches of each tissue type were analysed. cDNAs for RT-PCR were synthesized from 1 μg mRNA by oligo-dT priming using Omniscript Reverse Transcriptase (Qiagen, Hilden, Germany) according to the manufacturer’s instructions. PCR was carried out with Platinum Taq DNA Polymerase from Invitrogen (Karlsruhe, Germany) using 2.0 μl of the 1:5 diluted cDNA first-strand synthesis reaction. The bases for designing sequence-specific primer were the EST data and ab initio predicted exons. Primers used are indicated in Table 1. Amplification was carried out as described previously [20]. The sequence of each amplified DNA fragment from all tissues tested was purified using the QIAquick Gel Extraction Kit (Qiagen) and sequenced as described by Nitz et al. [20]. Sequence data were analysed by Lasergene sequence analysis software (DNASTAR).
Table 1.
Primers used for RT-PCR and RACE-PCR
| (A) | RT-PCR Primer | Sequence (5′→ 3′) | Products (bp) |
|---|---|---|---|
| F | 1A(1)-2 | GATGTCTCAGGCTGAGTTTG | 355 |
| F | 1A(2)-2 | GCTGCGAAGGCTGAGTTTG | 353 |
| F | 1A(1)-B1 | GGATGTCTCAGTGTAGACC | 441 |
| F | 1A(1)-B2 | GGATGTCTCAGACCCTTGTC | 433 |
| F | 1A(2)-B1 | GGCTGCGAAGTGTAGACCC | 440 |
| F | 1A(2)-B2 | GGCTGCGAAGACCCTTGTCT | 435 |
| F | 1A(1)-G(1) | GATGTCTCAGCACAGGGCAG | 480, 415 |
| F | 1G-2 | CCGGGAGAGGCTGAGTTTG | 345 |
| F | 1C-2 | CTGATGCCTGCGTTTGCTGAG | 359 |
| F | 1D(1)-B1 | GACAGAGCCTTTGTAGACC | 441 |
| F | 1D(1)-2 | ACAGAGCCTTGCTGAGTTTG | 354 |
| F | 1D(2)-2 | GAGCTTGGAGGCTGAGTTTG | 354 |
| R | Exon 4 | CGAATTCCCACCATCCACG | |
| (B) | 5′-RACE primer | Sequence (5′→ 3′) | |
| 1A(1)-2 | TCTCAAACTCAGCCTGAGACATCCTG | 136, 150 | |
| 1A(2)-2 | CAAACTCAGCCTTCGCAGCCTGGCTGTG | 177 | |
| B-2 | TCTCAAACTCAGCCTCTGTCCCAGTG | 217, 222, 231, 236 | |
| 1C-2 | TCTCAAACTCAGCAAACGCAGGCATC | 250, 254, 298 | |
| 1D(1)-B(1) | CAGACAAGGGTCTACAAAGGCTCTG | 225, 236 | |
| 1D(1)-2 | TCAAACTCAGCAAGGCTCTGTCCAAC | 220, 231 | |
| 1G-2 | TGCAGCTTTCTCAAACTCAGCCCTCTC | ||
| 1G-2nested | CTCTCCCCGGGCCGCGAT | 240, 307, 501 |
Nucleotides of the first exon are in italics, nucleotides of the corresponding following exon in normal.
F = forward; R = reverse.
5′-rapid amplification of cDNA ends (RACE)
Amplification of 5′-termini of Acbp transcripts was performed with the SMART RACE cDNA Amplification Kit including the Advantage II PCR kit (BD Biosciences, Heidelberg, Germany) according to the manufacturer’s protocol. If it was necessary, nested PCRs were performed. Specific RACE and nested primers are indicated in Table 1. RACE products were sequenced and analysed as described above.
Quantification of Acbp transcript variants
For real-time RT-PCR assessing the tissue specificity of Acbp transcript variants cDNAs of human liver, adipose tissue, hippocampus, heart and skeletal muscle were prepared using the BD SMART PCR cDNA Synthesis Kit (Clontech) according to manufacturer’s instructions and diluted 1:10 in TE buffer. Real-time PCRs were performed for three times in triplicate using the ABI PRISM 7000 Sequence Detection System instrument and software (Applied Biosystems, Foster City, CA, USA). TaqMan assays (Table 2) were synthesized by ABI, probes were designed as multiexon probes. PCR set-up was done according to ABI instructions. Quantification via standard curves was performed as described previously [20]. To assess the relative abundance of the transcript variants we applied the comparative ΔCt-method [20]. This method was also used for determination of transcript variant-specific expression levels of insulin or glucose treated HepG2 cells and lipopolysaccharid (LPS), peptidoglycan from E. coli 0111:B4 (PGN-EB), tumour necrose factor α (TNF-α), interleukin-1β (IL-1β) or interferon-γ (IFN-γ) treated HepG2 and Tammy-Horsfall urinary glycoprotein (THP)-1 cells. Here, cDNA was prepared from total RNA using the iScript cDNA synthesis kit (Bio-Rad Laboratories, München, Germany) according to manufacturer’s protocol and diluted 1:1 in TE buffer. Real-time PCRs were performed for three times in triplicate. For all analyses hypoxanthine-guanine-phosphoribosyltransferase test (HPRT)1 was used as endogenous control.
Table 2.
Primer and probe sequences used for real-time PCR assays of novel human Acbp splice variants
| Transcript | Forward primer | Taqman probe | Reverse primer |
|---|---|---|---|
| 1A(1) | TCCCTGGAGTTCTTGCAAGTC | TCAGCCTGAGACATCC c | CTCCTCTGCAGCTTTCTCAAAC |
| 1A(1)-B(1) | TCCCTGGAGTTCTTGCAAGTC | ATGTCTCAGTGTAGACCCTTG | CCCACATAGCTCGGTCTCAGA |
| 1A(1)-B(2) | TCCCTGGAGTTCTTGCAAGTC | AAGGGTCTGAGACATCC c | CCCACATAGCTCGGTCTCAGA |
| 1A(2) | GCCAGGATGTCTCAGGTACAG | TCAGCCTTCGCAGCCTG c | CTCCTCTGCAGCTTTCTCAAAC |
| 1A(2)-B(1) | GCCAGGATGTCTCAGGTACAG | CTGCGAAGTGTAGACCC | CACATAGCTCGGTCTCAGACAA |
| 1A(2)-B(2) | GCCAGGATGTCTCAGGTACAG | AAGGGTCTTCGCAGCCTG c | CCCACATAGCTCGGTCTCAGA |
| 1A(1)-G | TCCCTGGAGTTCTTGCAAGTC | CCTGTGCTGAGACATC c | CGCCGCGACGTCCT |
| 1D(1)-B(1) | CCTAGCCCTGATTCGTTGGA | AAGGGTCTACAAAGGCTC c | CCCACATAGCTCGGTCTCAGA |
| 1D(1) | CCTAGCCCTGATTCGTTGGA | CAGAGCCTTGCTGAGTTT | CTAACCTCCTCTGCAGCTTTCTC |
| 1D(2) | GGAAGCGAGGAGTCCGT | CTTGGAGGCTGAGTTTG | CTAACCTCCTCTGCAGCTTTCT |
| 1G | GCGGGACGAGGAGAATCG | CAAACTCAGCCTCTCCCC c | CTAACCTCCTCTGCAGCTTTCT |
Primer and probe sequences are 5′→ 3′; c, complementary strand; probes span exon-exon boundaries; nucleotides binding at the 5′- or 3′-exon (relative to the respective intron) are in italics and in normal character, respectively. The sizes of the fragments were between 230 and 362 bp.
Plasmid construction
All expression clones and promoter-reporter gene constructs were produced using cloning based on PCR and Gateway technology (Invitrogen). Primer sequences are available on request. The strategy to construct the eight promoter regions was based on results of 5′-RACE. Thus, transcriptional start sites were used for promoter constructs. Promoter sizes (bp) include 5′-CACC of Gateway cloning were the following: (i) 328, (ii) 343, (iii) 399, (iv) 410, (v) 604, 1051, (vi) 1096, (vi) 1099. Constructs were cloned into the pSEAP- (secretory alkaline phosphatise [SEAP]) basic vector (Promega, Mannheim, Germany), containing cassette C of the Gateway vector conversion system. Human NF-κB subunits p50 and p65 and nuclear forms of sterol regulatory element-binding protein (SREBP) isoforms 1A, 1C and 2 were cloned into the expression vector pcDNA-DEST40. Amplification was done using a Touch-up PCR increasing annealing temperature three times by 2°C, starting 2°C under the specific primer Tm. Human hepatocyte nuclear factor (HNF)-1α and HNF-4α expression clones are described in Klapper et al.[22, 23]. Open reading frames (ORFs) of ACBP splice variants 1A(2), 1A(1)-G, 1G and 1D were cloned into the expression vector pcDest40 to generate C-terminal fusions with V5 tag. Eight ACBP promoter fragments were produced according to 5′-RACE results and inserted in the pSEAP-basic vector (Promega), containing cassette C of the Gateway vector conversion system. All fragments included the transcription start site (TSS) and are characterized by the same 5′-end. All sequences and plasmids were confirmed by sequencing as described above.
Cell culture, transient transfections and stimulations
Human HepG2 and THP-1 cells were grown in Roswell Park Memorial Institute (RPMI) 1640 (Invitrogen) supplemented with 10% foetal calf serum and 1% Glutamax at 37°C, 5% CO2 in a humidified incubator. HepG2 cells were fed every 2 days and subcultured at preconfluent densities using 0.25% trypsin in PBS. THP-1 cells were fed every 2 to 3 days. HepG2 cells were transfected at 40–50% confluency with FuGene6 (Roche, Grenzach, Germany). For transfection all plasmids were purified with the PureLink spin column kit (Invitrogen). For stimulations assayed by real-time PCR, 3 × 10⁵ HepG2 and 4 × 10⁵ THP-1 cells were plated in 6-well plates. To analyse ACBP transcript expression levels, HepG2 cells were treated for 12 hrs with 1, 3, 5 or 10 nM insulin (Sigma Aldrich, München, Germany) or with 10 or 20 mM glucose (Sigma Aldrich). Treatments with bacterial components and cytokines were as follows: HepG2 were exposed for 4 hrs with 1 μg/ml LPS (E. coli 055:B5, Sigma), for 6 and 12 hrs with 50 μg/ml PGN-EB (E. coli 0111:B4, InvivoGen, Toulouse, France), for 4, 6 and 12 hrs with 2, 10 or 50 ng/ml human TNF-α (PeproTech, Hamburg, Germany) or for 2, 4, 8 and 12 hrs with 10 ng/ml human IL-1β (PeproTech) and 4, 8 and 12 hrs with 12.5 ng/ml IFN-γ (PeproTech). THP-1 cells were treated for 4 hrs with 1 μg/ml LPS, for 4 and 8 hrs with 50 μg/ml PGN-EB, for 6 hrs with 10 ng/ml TNF-α, for 4 and 8 hrs with 12.5 μg/ml IL-1β and for 4 and 8 hrs with 12.5 ng/ml IFN-γ. NF-κB essential modulator binding domain binding peptide (NBD, Calbiochem, Bad Soden, Germany) was used as an NF-κB inhibitor. NBD was dissolved in dimethylsulfoxide (DMSO) and added in a concentration of 50 μM. HepG2 and THP-1 cells were pre-incubated for 30 min. with NBD and then 10 ng/ml TNF-α was added for 6 hrs.
SEAP reporter gene assays
Acbp promoter analyses were performed with SEAP as reporter gene. HepG2 cells were seeded at a density of 3×10⁴ cells/well in 96-well culture plates and co-transfected in triplicate with 32 ng of each promoter construct and 16.6 ng of human SREBP-1A, -1C, -2, HNF-1α, HNF-4α, NF-κB-p50 or NF-κB-p65 expression plasmids. In control approaches the empty vector pcDest40 was co-transfected with the promoter constructs. Stimulation experiments (control: without stimulation) was performed after cells reached confluence. The luciferase reporter vector pGL3 (was included in all transfection experiments for normalization using the Bright-Glo luciferase assay system (Promega). Chemiluminescence measurements were done as described previously [20]. Relative SEAP activities were computed by subtracting the background values obtained with the pSEAP-Basic transfection samples and normalization using pGL3 data. Stimulations of transfected HepG2 cells were done after cells reached confluence with 1 μg/ml LPS, 50 μg/ml PGN-EB, 10 ng/ml TNF-α, 10 ng/ml IL-1β or 12.5 ng/ml IFN-γ.
Immunoblotting
The polyclonal antibodies for ACBP isoforms were designed by Eurogentec (Köln, Belgium). For Western blotting proteins of adipose tissue, liver and hippocampus were obtained from BioCat (Heidelberg, Germany). Proteins of whole cell extracts from HepG2 cell cultures were prepared using natrium-EDTA-Tris (NET)-buffer [50 mM tris-(hydroxymethyl) amino-ethane (TRIS) pH 7.5; 150 mM NaCl; 1 mM ethylenediaminetetraacetic acid pH 8.0; 0.5% NP-40; 10% protease inhibitor]. Homogenates were sonicated for 30 s and incubated for 20 min. on ice before centrifugation at 14,000 rpm for 20 min. All following steps were done using the NuPAGE kit purchased from Invitrogen according to the manufacturer’s protocol. After appropriate treatment of 20 μg protein, samples were resolved by SDS-PAGE (4–12%) and transferred by electroblotting to PVDF-membranes that were blocked in 1× TBST containing 3% non-fat milk for 16 hrs and incubated with the appropriate primary antibodies in TBST containing 3% non-fat milk. Primary antibodies were diluted 1:1000. Primary antibody-probed blots were visualized with an appropriate horseradish peroxidase coupled secondary antibody using enhanced chemiluminescence detection (ECL+, Amersham, Freiburg, Germany) and immunoreactive bands were recorded on Hyperfilms (Amersham). Blocking experiments were done using 25- and 75-fold excess of the aforementioned specific peptide fragments.
Subcellular localization studies
HepG2 cells were seeded on cover slips in 24-well plates at a density of 4 × 10⁴ cells/well and transfected at 50% confluency with 200 ng of ACBP:V5 constructs for 24 hrs. For immunofluorescent detection of V5 fusion proteins, transfected cells were fixed with 2% paraformaldehyde in PBS for 10 min., followed by methanol treatment at –20°C for 10 min. Cells were blocked in TRIS buffered saline (TBS) containing 0.1% bovine serum albumin and 0.2% glycine for 1.5 hrs and incubated with anti-V5 antibody at 1:200 dilution (Invitrogen) overnight at 4°C. Cells were then washed with TBST (TBS with 0.1% Tween20) two times for 5 min. and with TBS three times for 10 min. and incubated with a secondary Alexa Fluor 594 conjugated goat anti-mouse IgG (Molecular Probes, Eugene, OR, USA) at 1:1000 dilution in TBS containing Hoechst 33258 (Frankfurt, Germany) (1 μg/ml) for 1 hr at 37°C. As negative control, cells were transfected with empty pcDest40. After a washing procedure described above, cover slips were mounted with Fluorescent Mounting Medium (DakoCytomation, Glostrup, Denmark) on glass slides and analysed using a confocal laser scanning microscope (LSM 510 UV Meta, Carl Zeiss, Oberkochen, Germany).
Data analysis
To determine whether and which data groups differed significantly from each other two-sided t-test or one-way ANOVA followed by Tukey’s HSD multiple range test were used. If it was necessary comparisons among groups were made using Kruskal–Wallis test followed by Nemenyi test.
Results
Identification of ACBP splice variants by dbEST screening
The human Acbp gene (ID 1622) spans 6023 bp in the chromosome 2q12-q21 region. Six coding exons are described, of which three are alternative first exons (1A, 1B, 1C) and three constitutive exons [2–4]. Screening of human dbEST at NCBI provided evidence for a more complex gene structure of Acbp than previously described. We identified in total 522 ESTs homologous to Acbp. By EST mapping to the genomic Acbp sequence we arranged them to eight different combinatorial main splice variants excluding those with an incomplete structure and those showing variations in the 3′-UTR region (Figs 1 and 2, Table 3). Splice variants were named according to their alternative first or first two exons. These exons are followed by the conserved exons 2 to 4 that encode the acyl-CoA binding domain. Different exon forms are specified by numbers in parentheses behind the exon character. Four Acbp transcripts were known, whereas four transcripts were novel (1D(2), 1D(1), 1A(1)-B(2), 1A(1)-B(1)). ORF prediction of these four novel transcripts (Fig. 3A) revealed that 1A(1)-B(1), 1A(1)-B(2), 1D(1)-B(1), 1A(2)-B(1) and 1A(2)-B(2) encode for the known isoform ACBP-1B of 104 amino acids (aa) as main ORF. Transcript 1D(1) codes for an N-terminal truncated ACBP isoform of 63 aa missing the first 24 aa in comparison to the main isoform 1A. For 1D(2) BLASTx analysis revealed a 96% similarity to a predicted Macaca mulatta specific ACBP protein of 144 aa (XP_001087153.1). This protein holds a 60 aa comprising alternative N-terminus preceding the acyl-CoA binding domain (Fig. 3B). In the human sequence the main ORF starting in exon 1D(2) is interrupted by a stop-codon (UGA) also located within 1D(2) at aa position 18.
Table 3.
Compilation of novel Acbp transcript variants and corresponding ESTs and ab initio predicted non-EST-based transcripts
| Transcript variant | Accession no. | EST acc. | Protein variant |
|---|---|---|---|
| 1A(1)-B(1) | FM213125 | AA306540, AW978623 | ACBP-1B (104 aa) |
| 1A(1)-B(2) | FM213126 | AV654487, CD365144 | ACBP-1B (104 aa) |
| 1D(1)-B(1) | NM_020548 FM213131 | AA862787, BI825918 | ACBP-1B (104 aa) |
| 1D(1) | FM213129 | AA442323, BM908030 | ACBP-1D (63 aa) |
| 1D(2) | FM213130 | BE541092, CA426141 | ACBP-HP (144 aa) |
| 1A(2) | FM213122 | ACBP-1A(2) (97 aa) | |
| 1A(1)-G | FM213128 | ACBP-1AG (129 aa) | |
| 1G | FM213127 | ACBP-1G (148 aa) | |
| 1A(2)-B(1) | FM213123 | ACBP-1B (104 aa) | |
| 1A(2)-B(2) | FM213124 | ACBP-1B (104 aa) | |
| 1A(1)-D(4) | FM213132 | No ORF |
Transcripts are named according to their first or first two exons. For each transcript variant two
ESTs are given as example, aa = amino acid residues, Acc. = accession number, HP = hypothetical protein, no. = number, ORF = open reading frame.
Fig 3.
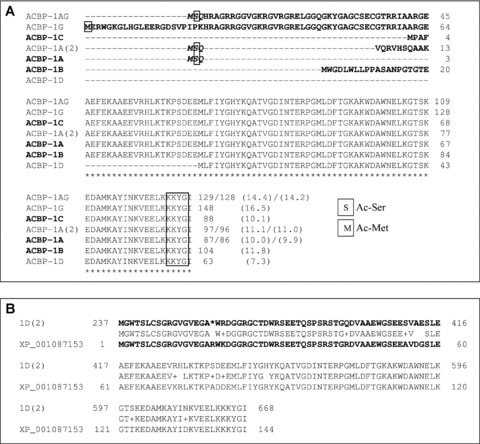
Alignment of ACBP isoforms deduced from ORF analyses. (A) Known ACBP isoforms 1A, 1B and 1C are given in bold. Unique N-terminal parts of the proteins based on alternate first or first two exons are in bold, numbers indicate protein length, calculated molecular sizes in kD are given in parentheses. Ac-Ser indicates an acetylation of serine, Ac-Met of methionine as predicted co-translational modification. KKYG = KKXX-like ER retention signal. (B) Blastx output of transcript 1D(2). Deduced hypothetical ACBP (ACBP-HP) with an interrupted ORF after amino acid 17 with a similarity of 96% to a predicted ACBP of 144 amino acid residues (XP_001087153.1) of Macaca mulatta.
Identification of ACBP splice variants by ab initio analyses
In addition to EST analyses we performed an ab initio gene prediction. This analysis revealed the putative existence of three further non-EST based exons (cutoff value 0.02) within the genomic Acbp locus which we named 1A(2), 1G and G (Figs 1 and 2). 1A(2) is a 3′-exon of the common exon 1A(1). It is based on an alternative splice site donor located 30 bp downstream of the usual splice site. Exon G is located between the common exon 1A and exon B, starting 343 bp behind 1A. Exon 1G, predicted as putative first exon, is a 5′-exon of G and 96 bp larger in size. ORF predictions of the six novel ab initio transcripts revealed that five of them encode for ACBP homologous as main ORF of which three resulted in novel ACBP isoforms (Fig. 3A). They are characterized by alternate N-terminal parts of the protein followed by 84 aa that account for the functional ACBP binding domain encoded by exons 2 to 4. The ORF of transcript 1A(2) encodes the isoform ACBP-1A(2) which contains in total 97 aa of which 13 form the unique N-terminus. In transcripts 1A(1)-G and 1G translation starts in exon 1A(1) and 1G, respectively. Their ORFs encode for isoforms ACBP-1AG and ACBP-1G of 129 aa and 148 aa. In ACBP-1AG, exon G encodes for 42 additional aa following the three first aa MSQ of exon 1A(1). In ACBP-1G, exon 1G replaces exon 1A(1) and accounts for the alternative N-terminus of 64 aa. Transcripts 1A(2)-B(1) and 1A(2)-B(2) encode for the known isoform ACBP-1B.
Verification of alternative Acbp splice variants by RT-PCR
Multiple alternative Acbp transcript variants were discovered by means of dbEST screenings and a computational gene-finding approach described above. To verify the screening results and the predicted exon positions in the genomic Acbp locus RT-PCR was performed on poly(A)+ RNA from human adipose tissue, liver, hippocampus, heart and skeletal muscle followed by sequencing of RT-PCR products. We obtained 13 PCR products of appropriate sizes corresponding to 13 different alternative transcript variants (Fig. 4A). Using the forward primer 1A(1)-G an additional non-EST based transcript variant of 415 bp could be amplified containing exon D(4) instead of exon G, spliced between exons 1A(1) and B(2). This randomly detected transcript was entitled 1A(1)-D(4).
Fig 4.
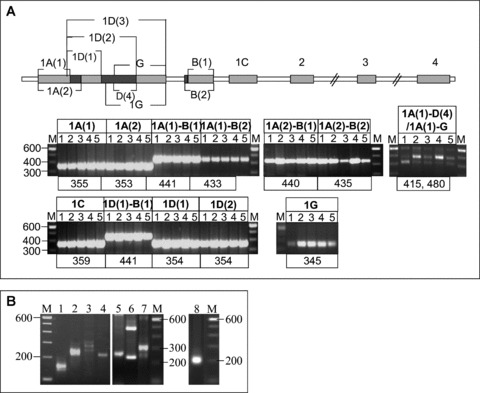
Identification of novel splice variants of the human Acbp locus by RT- and RACE-PCR. (A) RT-PCR was performed in five different human tissue types. RT-PCR products were generated using primers spanning the alternative first and the corresponding following exon in combination with a primer located in exon 4 and confirmed by sequencing. For exon composition of each transcript variant see Fig. 1. M = DNA 100 bp size marker, 1 = adipose tissue, 2 = liver, 3 = heart, 4 = hippocampus, 5 = skeletal muscle; product sizes are given in bp. A schematic diagram of exon distribution on genomic level is given above the RT-PCR results for comprehension. (B) 5′-RACE experiments, exemplary shown in adipose tissue. Primers used spanned the alternative first exon and the following exon. M = DNA 100 bp size marker, 1 = exon 1A(1), 2 = exon B, 3 = exon 1C, 4 = 1D(1), 5 = exon 1D(1)-B(1), 6 and 7 = exon 1G (different PCR conditions), 8 = exon 1A(2). Representative gels were shown. The results were obtained from at least two independent experiments.
Mapping of transcription start sites
TSSs were determined by 5′-RACE analyses in adipose tissue and liver. Primers used spanned the alternative first and the following exon. PCR products were analysed by agarose gel electrophoresis and sequencing. Several products corresponding to different 5′-ends which were not coincident with the start positions of GenBank and EST sequences were observed (Fig. 4), indicating the use of alternative promoters and different 5′-UTR regions. All products contained one guanosine at their 5′-end as part of the 5′-terminal cap structure indicating authentic 5′-termini. For the known exon 1A(1) two TSSs (RACE products of 150 bp and 136 bp) separated by 14 bp were detected (Fig. 2). Sequencing of the two RACE products of exon 1B revealed four overlapping products of 236 bp, 231 bp, 222 bp and 217 bp that showed the same TSSs that were identified for exon 1A. Accordingly, these transcripts are controlled by the same promoters. Products 236 bp and 231 bp are each characterized by TSS1 and products of 222 bp and 217 bp by TSS2 of 1A. The two shorter ones correspond to transcript variant 1A(1)-B(2) which holds 5 bp less at the 5′-part of exon B(1) (Figs 1 and 2). We could not identify a distinct TSS for exon 1B, indicating that this exon is rather an internal than a separate alternative first exon. In case of the previously unknown alternative first exon 1D we used two different primers, one accordingly to the exon boundary 1D(1) and one complementary to exons 1D(1)-B(1). In both cases, we identified two TSSs separated by 10 bp (Fig. 2) represented by two overlapping RACE products of 231 bp and 220 bp (transcript 1D(1)) and 236 bp and 225 bp (transcript 1D(1)-B(1)) (Fig. 1). For exon 1C we identified three different TSSs (RACE products 298 bp, 253 bp and 250 bp) separated by 44bp (TSS1 and 2) and 2bp (TSS2 and 3). A faint fourth band above 300 bp was not accessible for sequencing. This band possibly represented the 5′-end of exon 1C as indicated by ESTs BG036730 and BI829637. To analyse if ab initio exons G and 1G are indeed internal or first exons we used a primer spanning this exon and exon 2. Nested-PCR resulted in three major products of 501 bp, 240 bp and 307 bp where the largest one represented a transcript whose 5′-terminus was defined by TSS2 of exon 1D(1) that contained a further 65 bp comprising 3′-extension of exon D(2) that was not supported by ESTs or ab initio predictions. In this case, the first exon 1G is a second 3′-exon of 1D(1) and was entitled exon 1D(3) (Figs 2 and 3). The 240 bp product represented a transcript including exon 1A as alternative first exon followed by exon G which here is used as an internal exon. We classified this transcript variant as 1A(1)-G. Additionally, by sequencing the product of 307 bp, exon G was also shown to be a distinct alternative first exon with a specific TSS located 194 bp downstream of TSS2 of exon 1D(1) and accordingly, with a distinct promoter. We named this transcript variant 1G (Figs 1 and 2). Some minor bands were obtained which could not be sequenced but maybe could represent further 5′-termini.
Tissue-specific distribution of Acbp transcripts
To investigate the expression pattern of the Acbp transcript variants we performed real-time RT-PCR in human adipose tissue, liver, heart, hippocampus and skeletal muscle using splice junction-specific probes. The tissues choice was based on the assumption, that the metabolisms of these tissues are very different. The tissue-specific distribution of the 10 new identified and the two known transcripts is shown in Fig. 5A. 1A(1) shows an equally expression level in adipose tissue, liver and heart with decreasing amounts in hippocampus and substantial lower levels in skeletal muscle. No substantially differences in expression levels could be observed for transcript 1D(1) with the exception of hippocampus. In comparison to all other transcripts the expression of 1D(1) was relatively high in skeletal muscle. Transcript variants 1A(1)-B(1), 1A(1)-B(2) clearly predominated in adipose tissue, 1D(1)-B(1) and 1A(1)-G in adipose tissue and liver, whereas transcripts containing the 3′-exon of 1A(1), namely 1A(2), 1A(2)-B(1) and 1A(2)-B(2), showed highest expression levels in liver. Variants 1D(2) and 1G were characterized by high expression levels in heart and hippocampus. Among the five transcripts that codify the ACBP isoform with 104 amino acid residues (Table 3), two are more expressed in adipose (1A(1)-B(1), 1A(1)-B(2)), and three are more expressed in the liver (1A(2)-B(1), 1A(2)-B(2) and 1D(1)-B(1)), having the later shown more expression in heart and muscle.
Fig 5.
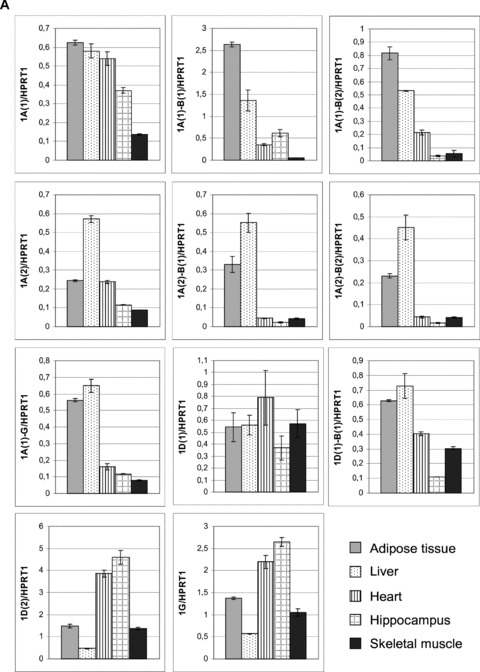
Real-time RT-PCR of novel Acbp transcript variants. PCR was performed in five different human tissues using transcript-specific primer pairs and probes as depicted in Table 2. (A) Tissue-specific distribution of transcript variants. Expression levels were quantified via standard curves and normalized to levels of HPRT1. (B) Relative abundance of transcript variants compared to the common variant 1A(1). Expression levels were quantified using ΔΔCt method, HPRT1 was used as endogenous control. All values indicate the mean ± S.D. calculated from three experiments which were performed in triplicate. The results are expressed as mean ± S.D. for n= 3 in triplicate for each bar.
Estimation of the abundance of novel Acbp transcript variants
Real-time PCR was also performed to analyse the abundance of the novel Acbp transcripts in relation to the main transcript 1A(1) (Fig. 5B). For this purpose we selected those novel transcript variants which encode for putative ACBP isoforms (Fig. 1 and 4A). In all five tissues, the novel transcript variants were expressed at extremely lower levels compared to 1A(1) that showed very high expression levels. Of the transcripts encoding isoform ACBP-1B, A(1)-B(1) showed the highest expression levels, followed by a clear decrease of abundance of 1A(1)-B(2), 1D(1)-B(1), 1A(2)-B(1) and 1A(2)-B(2). In liver, adipose tissue and hippocampus a relative abundance of 1A(1)-B(1) of 2.6%, 1.6% and 1.1%, respectively, could be observed, in heart and skeletal muscle of only 0.3% and 0.1%. In general, the non-EST based transcript variants 1A(2), 1A(1)-G, 1G, 1A(2)-B(1) and 1A(2)-B(2) showed the lowest expression levels with very low levels for 1A(2)-B(1) and 1A(2)-B(2) in comparison to 1A(1). As transcripts 1A(1)-G and 1G contain the same 3′-exon boundary of exon G, no specific Taqman assay could be designed for 1G (Figs 1 and 2). Accordingly, real-time analyses resulted in a co-detection of these transcripts. Anyhow, the expression levels of 1G were in general clearly higher as those of 1A(1)-G. Our real-time analyses revealed the novel transcript variants as low-abundance transcripts in comparison to 1A(1).
Specific regulation of Acbp transcripts by insulin and glucose
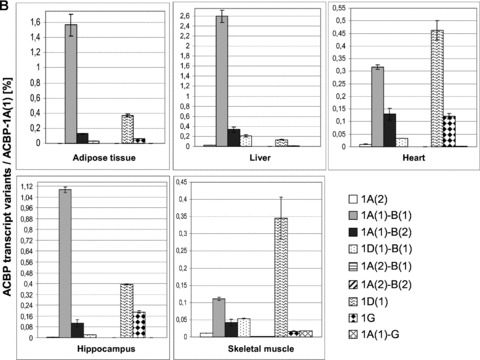
In rats ACBP is reported to be regulated by feeding status [24] which indicates a possible regulation by insulin or glucose. We therefore analysed levels of Acbp transcripts in insulin and glucose treated HepG2 cells. We selected transcripts coding for the novel ACBP isoforms 1A(2), 1AG, 1G and 1D, as well as the known isoforms 1A, 1B and 1C. Results revealed a variant-specific responsiveness of ACBP to insulin and glucose (Fig. 6A). Cells treated with 1, 3, 5 or 10 nM insulin for 12 hrs showed a non-dose dependend moderate but significant decrease of 1G transcript levels to about 77% (P≤ 0.05). As Taqman assay for 1G also detects transcript 1A(1)-G which is controlled by a different promoter, the observed results are not explicitly for 1G and the true insulin-mediated decreasing effects may be stronger. No effect was observed for all other transcripts. Cells treated with 10 or 20 mM glucose for 12 hrs showed a high significant (P≤ 0.01) down-regulation of 1D(1) to approximately 60%. A moderate but significant reduction in expression levels to about 70% (P≤ 0.05) was obtained for transcript 1C.
Fig 6.
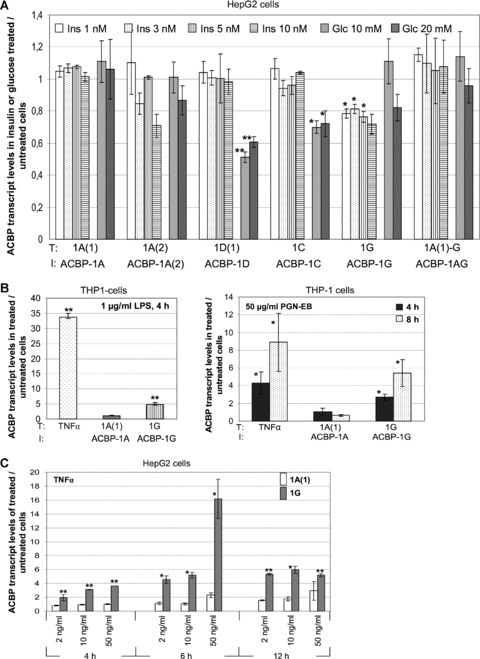
Acbp transcript expression levels after incubation of HepG2 and THP-1 cells with different stimuli. Data are mean ± S.D. for n= 3 in triplicate for each bar. T = transcript; I = isoform. (A) Real-time RT-PCR analysis of Acbp transcript variants in insulin or glucose treated HepG2 cells. Expression levels are shown relative to untreated cells and were calculated viaΔΔCt method with HPRT1 as reference. Statistical relevance was verified by one-way anova and Tukey as multiple range test. (B) Transcript levels of Acbp-1A(1) and -1G in THP-1 cells after incubation with bacterial components LPS and PGN-EB. Statistical relevance was verified by two-sided t-test (**=P≤ 0.01, *=P≤ 0.05). (C) Effects of TNF-α, (D) IL-1β, (E) IFN-γ on transcript levels of Acbp-1A(1) and -1G in HepG2 and THP-1 cells. Statistical relevance was verified by two-sided t-test (***=P≤ 0.001**=P≤ 0.01, *=P≤ 0.05).
Basal activity of alternative Acbp promoters
Based on 5′-RACE results we produced a series of eight alternative Acbp promoter fragments and cloned them upstream of the SEAP reportergene (Fig. 7A). All fragments include the TSS and are characterized by the same 5′-end but differing 3′-termini that where related to the corresponding first exon. Promoter fragments were PA1 (324 bp) and PA2 (339 bp), directing the expression of Acbp transcript variants 1A(1), 1A(1)-B(1), 1A(1)-B(2), 1A(1)-G, 1A(2), 1A(2)-B(1) and 1A(2)-B(2), PD1 (395 bp) and PD2/PG1 (406 bp) directing the expression of transcripts 1D(1), 1D(2), 1D(1)-B(1) and 1G, PG2 (600 bp) directing the expression of transcript 1G and PC1 (1047 bp), PC2 (1092 bp) and PC3 (1095 bp) directing the expression of transcript 1C. Each promoter in the progression of PA1 to PC3 contained a 3′-extension of PA1 with indicated sizes. Promoter: reporter constructs were transiently transfected into HepG2 cells, including samples of pSEAP-basic plasmid to determine background values, to analyse their basal activities (Fig. 8A). PA1 showed an about 1040-fold higher activity in comparison to pSEAP-basic (data not shown) and could therefore be classified as a strong promoter. Activities of all other Acbp promoters were referred to PA1. Strong basal activities were also obtained for PA2 and PD1 with a 2.5- and 2.8-fold higher activity in comparison to PA1, followed by PC3 which showed a 1.8-fold higher activity. The extension of 15 bp in fragment PA2 led to a considerable increase of promoter activity, whereas additional 56 bp in PD1 resulted in no further effects. A dramatically decrease of basal activity to 0.03-fold was observed for PD2 comprising 11 bp more than PD1. Also PC1, PC2 and PG2 showed only weak basal activities in comparison to PA1. Thus, alternative Acbp promoters differ essentially in their basal activities in HepG2 cells.
Fig 7.
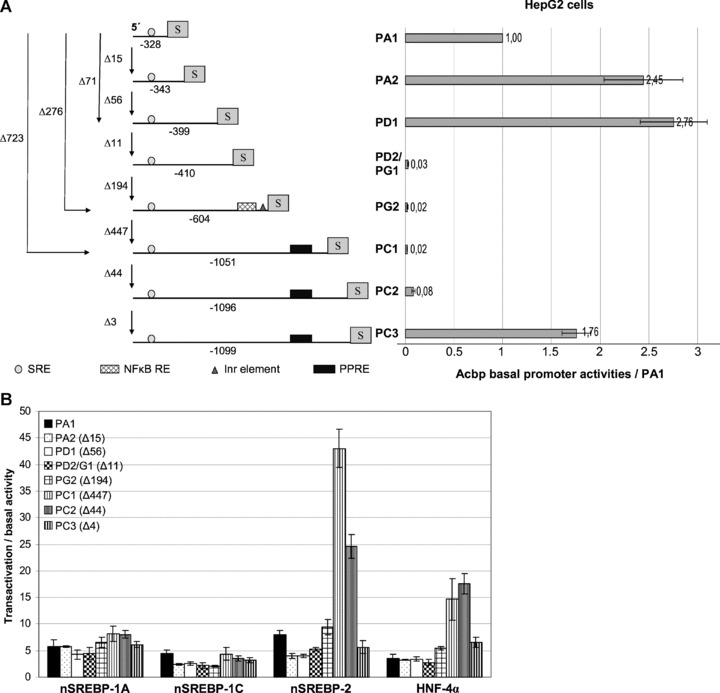
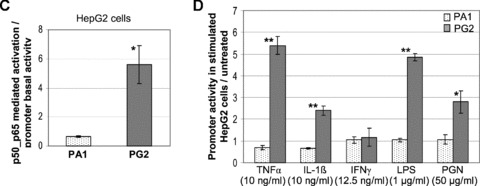
Analysis of alternative Acbp promoters. (A) Schematic view of the promoter constructs used and corresponding basal activity levels. S = SEAP reporter gene, Inr = initiator element, NF-κB RE = NF-κB responsive element, PPRE = PPARγ2 responsive element, SRE = sterol regulatory element. Promoter sizes are given below the constructs including 5′-CACC of Gateway cloning. Numbers beside the constructs indicate size differences between single promoter fragments, numbers next to the graph of basal activity the fold activity level compared to promoter PA1. Values represent the mean ± S.D., n= 5 for each bar. (B) SREBP and HNF-4α-mediated activation of alternative Acbp promoters. nSREBP = nuclear form of SREBP-1A, -1C or -2. Values indicate fold induction compared to basal activity and represent the mean ± S.D. calculated from three (HNF-4α) and four (SREBPs) experiments which were performed in triplicate. Statistic relevance (P≤ 0.05) was verified by one-way anova and Tukey as multiple range test with the exception of SREBP activation for PA2, PG2 and PC2 and HNF-4α stimulation for PC1 and PC2. Here the nonparametric Kruskal–Wallis test and Nemenyi were used. (C) NF-κB subunits p50/p65 mediated stimulation of alternative Acbp promoter PG2. Promoter PA1 of common transcript 1A(1) was used as control. Values are fold inductions compared to basal activity and represent the mean ± S.D., n= 4 in triplicate for each bar. Statistic relevance (P≤ 0.05) was verified by two-sided t-test. (D) Promoter activities of PA1 and PG2 in HepG2 cells stimulated with cytokines and bacterial components. Values are fold promoter inductions in stimulated transfectants compared to untreated transfectants and represent the mean ± S.D., n= 3 in triplicate for each bar. Statistic relevance was verified by two-sided t-test (**=P≤ 0.01, *=P≤ 0.05).
Fig 8.
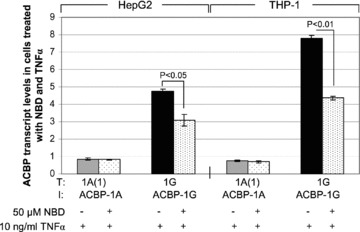
Effect of NF-κB inhibitor NBD on TNF-α induced increase of Acbp-1G transcript levels in HepG2 and THP-1 cells. Prior to TNF-α exposure for 6 hrs, cells were pre-treated with NDB for 30 min. Values are the mean ± S.D., n= 3 in triplicate for each bar. Statistical relevance was verified by two-sided t-test.
SREBPs and HNF-4α differentially induce the activity of Acbp promoters
ACBP is described to be regulated by SREBPs which are important transcription factors of fatty acid and cholesterol metabolism. To analyse if the alternative Acbp promoters are differentially induced by SREBPs we co-transfected HepG2 cells with Acbp promoter constructs and nSREBP-1A, nSREBP-1C or nSREBP-2. All eight promoters were activated by all SREBPs, but to a different extend (Fig. 7B). On average, SREBP-1A caused a 5.9-fold and SREBP-1C a 3.1-fold activation of promoter activity. Significant differences in trans-activation levels were obtained using SREBP2 with the highest activation of 43-fold for PC1 and 24.6-fold for PC2. PC3, characterized by only three additional bp in comparison to PC2, showed a decline of activation to a value comparable to PA1, PA2, PD1, PD2/PG1 and PG2 which showed on average a 6.2-fold increase in activity. Next, we analysed the transactivation potential of the two HNF-4α and HNF-1α. HNF-4α is described to bind fatty acyl-CoAs as ligands and to peroxisome proliferator-activated receptor (PPAR) responsive elements (PPREs), one such element is present in promoter fragments of series C. All Acbp promoters revealed to be HNF-4α targets. Noticeable activation levels of 14.7-fold and 17.6-fold were found for promoters PC1 and PC2, respectively, with a decrease to 6.5-fold for PC3 (Fig. 7B). Promoters of D and A series showed with a 2.8- to 3.6-fold induction no significant difference among each other but a significant lower activation level as promoter C series. Comparable to PC3 a moderate activation of 5.5-fold was received for PG2. Activation of A, D and G promoters lacking the PPRE element may indicate the existence of another HNF-4α binding site. In contrast, using HNF-1α no transactivation could be observed (data not shown).
Specific regulation of transcript variant 1G by cytokines and bacterial components
Our in silico promoter analyses predicted a putative NF-κB binding element (5′-GGGATTTTCC-3′) in the alternative Acbp promoter PG2 at 572 – 581 bp (Figs 2 and 6A) which is in analogy to the known consensus sequence 5′-GGGRNNYYCC-3′. The 12 bp downstream of the NF-κB binding site a putative initiator element (Inr) was predicted which is a transcription control element in TATA less promoters. To examine if ACBP transcript variant 1G is a possible NF-κB target we incubated HepG2 and THP-1 cells with bacterial components and different cytokines which are known to activate the NF-κB pathway and analysed the expression levels of the common transcript 1A(1) and the novel transcript 1G. Stimulation of TNF-α mRNA levels served as positive control. As shown in Fig. 6B, incubation of THP-1 cells with LPS or PGN-EB resulted in a specific induction of transcript variant 1G by 4.9-fold and 5.4-fold, respectively. Transcript levels of 1A(1) were not affected.
In HepG2 cells no effect of LPS and PGN-EB could be observed (data not shown). However, a time-course experiment in HepG2 cells using indicated amounts of TNF-α as stimulus revealed a significant increase of transcript 1G up to 16-fold after 6 hrs with no induction of 1A(1) (Fig. 6C). In THP-1 cells TNF-α led to a specific 1G induction of 7.8-fold after 4 hrs (Fig. 7). In both cell lines, transcript 1G was also significantly activated by 5.4-fold in HepG2 and 10.4-fold in THP-1 cells after 4 hrs exposition to IL-1β (Fig. 6D). Beside LPS, PGN-EB, TNF-α and IL-1β which are known to induce the NF-κB pathway, we used IFN-γ as stimulus (Fig. 6E) which is described to activate the JAK/STAT (Janus kinase/signal transducers and activators of transcription) signalling pathway. Here, no stimulatory effects on Acbp-1G expression levels could be observed. A consistent repressing effect in both cell lines could were evident only for transcript 1G.
Inhibition of Acbp-1G stimulation by NBD (NF-κB essential modulator binding domain)
To investigate if the specific stimulation of Acbp transcript 1G after treatments of HepG2 and THP-1 cells with different cytokines is mediated by NF-κB we performed inhibitor assays using NBD to inhibit the NF-κB pathway and TNF-α for stimulation. Thirty minutes before TNF-α stimulation HepG2 and THP-1 cells were incubated with 50 μM NBD. In both, HepG2 and THP-1 cells a significant reduction of the TNF-α effect could be obtained (Fig. 8) indicating that NF-κB is involved in the stimulation process. No difference was observed between the control stimulations with the vehicle DMSO and NBD (data not shown).
Stimulatory effects of NF-κB, cytokines and bacterial components on promoter PG2
To examine if the alternative promoter PG2 can be transactivated by NF-κB transcription factors we transiently transfected HepG2 cells with subunits p50 and p65 and assayed the promoter activity in relation to basal activity. NF-κB subunits p50/p65 mediated a 5.6-fold activation of PG2 activity (Fig. 8C). To verify the results of real-time PCR where transcript levels of 1G were specifically stimulated by TNF-α and IL-1β, we treated HepG2 cells 24 hrs after PG2:SEAP transfection with indicated amounts of TNF-α and IL-1β and assayed the promoter activity. Promoter construct PA1 was used as control. As shown in Fig. 6 both treatments led to a 5.4- and 2.4-fold activation, respectively, of PG2 whereas activity of PA1 was unaffected. Treatments with IFN-γ showed no effect on both promoters. Unlike the results of real-time PCR, LPS and PGN-EB mediated a specific activation of promoter PG2 activity by 4.8- and 2.8-fold, respectively.
Subcellular localization of predicted ACBP isoforms
Due to the low-abundance character of the novel Acbp transcripts, we were not able to prove the new ACBP isoforms in our Western analyses (data not shown). To analyse the subcellular distribution of the putative new isoforms ACBP-1A(2), ACBP-1AG, ACBP-1G and ACBP-1D we fused the ORFs C-terminal in frame with the V5 tag. Twenty-four hours after transfection HepG2 cells were analysed by immunostaining using anti-V5 antibody and an Alexa Fluor 594 coupled secondary IgG in combination with Hoechst 33258 (Fig. 9). In general, all V5 tagged isoforms show robust expression. ACBP-1G and ACBP-1D produced higher amounts in comparison to ACBP-1A(2) and ACBP-1AG. The signal of isoform ACBP-1A(2) was stronger in the nucleus in comparison to the cytosol. ACBP-1G:V5 showed high expression levels also in cytosol and nucleus. However, it was evident that cells with low expression rates were characterized by a localization of ACBP-1G:V5 mainly in nucleus, whereas immunostaining in cytosol was weakly detected. Maybe this isoform holds a specific role in nucleus. For ACBP-1AG:V5 we observed a more vesicular distribution of immunoreactivity. This isoforms was excluded form the nucleus. Interestingly, localization of N-terminal truncated isoform ACBP-1D was concentrated in distinct vesicular structures with an enrichment around the nucleus indicating a specific targeting of this isoform. Continuative experiments concerning the subcellular localization of the novel ACBP isoforms have to be carried out.
Fig 9.
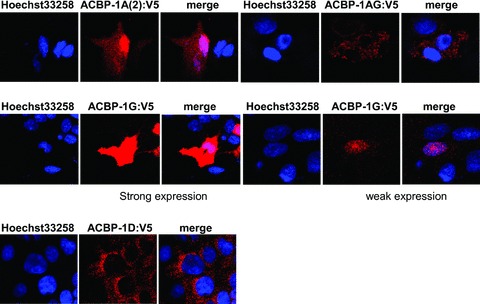
Confocal images of HepG2 cells expressing V5-tagged ACBP isoforms 1A(2), 1AG, 1G and 1D. A typical appearance of confocal images from three independent experiments is shown. V5 transfectants were immunostained with anti-V5 antibody and an Alexa Fluor 594 coupled secondary IgG and counterstained with Hoechst 33258 (DNA). Co-localizations are shown in magenta. Representative images were shown. The results were obtained from at least two independent experiments.
Discussion
Low-abundance transcripts were traditionally considered as transcriptional ‘noise’. Instead, low-abundance transcripts represent the majority of mRNAs in mammals [6, 25]. They are often not conserved between species and are described as genome specific or species specific [26, 27]. Unlike the higher abundance transcripts which fulfil housekeeping functions, lower abundance transcripts meet specialized functions [5]. They are involved in cellular differentiation, metabolism, phenotypic alternation and regulation of gene expression by sequestering nucleic acid binding proteins and in the production of low abundance proteins [26]. Unfortunately, technical limitations make their characterization difficult and often no hypothesis can be made about their functions and regulations. Here, we identified and characterized 10 novel transcripts of the human ACBP gene locus. Quantification of these Acbp transcript variants in relation to the common variant 1A(1) revealed them as low-abundance transcripts, at least in the analysed tissue types. These transcripts, which are differentially regulated, covered seven so far undescribed exons. Five of them are alternative 3′- and 5′-exons of annotated ones produced through alternative selection of different 3′- and 5′-splice sites. Alternative 3′- and 5′-exons account for ∼26% of splice events in mammals and are therewith relative prevalent [28]. With the exception of exons B(2) and G, all new exons are used as alternative first exons which show, according to our 5′-RACE analyses, at least two to three different TSSs. Hence, low-abundance ACBP transcript variants are generated by a consequent use of alternative promoters and alternate first or first two exons.
Alternative promoters have been identified in several human genes [29]. They are used as a versatile mechanism to create diversity and flexibility in regulation of gene expression. Alternative promoters determine the level of transcription initiation and confer different tissue-specific and/or development-specific expression patterns. In case of Acbp we identified eight alternative promoters showing different basal activities ranging from extremely high to very low levels in HepG2 cells. These promoters partially confer tissue specificity as was shown in our expression profile studies of the novel transcript variants in five different human tissues. Although we found no unique distribution of a specific transcript variant, a certain tissue dominance could be observed, suggesting a more specific role of the variants in the corresponding tissues. Interestingly, transcript variants containing the same first exon showed a different tissue dominance, and their tissue expression levels coincides only in part with basal activities of alternative promoters in HepG2 cells. Thus, alternative promoters seem to be only one class of regulatory elements that determine Acbp transcript levels. A functional association of promoter structure and alternative splicing is reported for other genes including transcription factors that influence splice site selection, but this is not correlated to promoter strength [30–32]. Hence, timing and level of splicing to specific products has to be elucidated in more detail for our identified transcript variants.
Promoter and quantification analyses revealed that the novel Acbp transcript variants are differentially regulated by SREBP-1A, -1C and -2, as well as HNF-4α. It is known that Acbp is a target of PPARs and the SREBP family [33]. A specific activation of promoter C by PPARγ2 was previously shown by Nitz et al.[20]. SREBPs are important regulators of lipid homeostasis with overlapping and isoform-specific functions [34]. Concerning human Acbp a stimulation mediated by SREBP-1A was shown by Swinnen et al.[35], whereas a specific regulation via SREBP-1C and SREBP-2 has not been reported. HNF-4α, which is activated by acyl-CoAs, is described to interact with PPARγ-binding elements of which one is present in the promoters of Acbp splice variant 1C [20]. HNF-4α and SREBP-2 mediated a differentially stimulation of the alternative promoters. Both factors predominantly activated promoters PC1, PC2 and PG2 which direct the expression of transcripts encoding ACBP isoforms 1C and 1G. Hence, these splice variants may contribute to the cholesterol metabolism, since SREBP-2 primarily regulates genes associated with cholesterol synthesis or uptake. HNF-4a interacts with genes that are involved in diverse function, including fatty acid, amino acid, glucose and also cholesterol metabolism [36]. ACBP is also described to be a subject of metabolic regulation. It is reported that ACBP levels are decreased in liver of fasting rats [24] indicating a regulation by insulin or glucose. Sandberg et al.[37] showed an induction of ACBP-1A expression by insulin but not glucose in rodent hepatocytes. Our investigations in both glucose and insulin treated HepG2 cells showed a differential regulation of specific transcript variants. In contrast to Sandberg and colleagues [37] we observed no insulin mediated induction of transcript 1A(1). However, transcript 1G was moderate but significantly down-regulated. We observed a similar effect also in Simpson–Golabi–Behmel syndrome (SGBS) cells (data not shown) where preadipocyte to adipocyte differentiation is induced by insulin. For glucose, we found a specific down regulation of Acbp transcripts 1D(1) and 1C. These data indicate that transcripts 1G, 1D(1) and 1C maybe induced during fasting and all three can be regarded to some extend as metabolic ACBP isoforms. The differential regulation of specific Acbp transcripts via insulin and glucose also links this gene to glucose metabolism.
Interestingly, in silico promoter analyses revealed an NF-κB element within the promoter of transcript 1G. The ubiquitous transcription factor NF-κB is an effector of a wide range of inflammatory diseases. NF-kappa B complex, which consists of subunits p50 and p65, is kept in an inactive form in the cytoplasm where it is bound to inhibitory proteins called IκBs. It is activated by pathogens such as viruses, bacterias and by pro-inflammatory cytokines and stress inducer. After activation it translocates into the nucleus where it induces transcription of genes involved in immune responses, inflammation and cell proliferation [38]. Our stimulation and promoter analyses with different cytokines and the bacterial components LPS and PGN-EB in two different cell lines in combination with the suppressive effect of the NF-κB inhibitor NBD have shown for the first time that a specific Acbp transcript variant (1G) is a NF-κB target gene. Previous studies [10–12] have shown, that ACBP peptide fragments modulate the LPS-induced production of monokines (i.e. TNF, IL-1) which are NF-κB targets. Thus, a positive feedback-loop regulating NF-κB-depending pro-inflammatory processes may exist. Taken together, our and previous observation gives an important link of fatty acid metabolism and inflammation and suggests a possible role of ACBP in diseases related to inflammation. If the predicted NF-κB binding element within the promoter of 1G is responsible for the observed stimulatory effects remains to be investigated.
ORF predictions of the novel transcripts revealed four homologous ACBP isoforms that vary in their N-termini. We assume that these isoforms are of low abundance as their corresponding transcripts. Maybe, this was the reason why we were not able to detect these isoforms in common Western analyses. Special techniques are needed to analyse low-abundance proteins. Despite recent advances, current proteomics technologies are still not able to reliably detect such proteins. It is well known that some of the most important proteins in biological systems are those which are present at very low levels [39–41]. As N-termini might affect cellular distribution of the protein we analysed the subcellular localization of the predicted ACBP isoforms in HepG2 cells using V5 as reporter. In general, we found interesting differences within the subcellular distribution of the isoforms. ACBP-1A(2) and -1G were localized in cytosol and nucleus, as it was described for the known isoforms ACBP-1A, 1B and 1C [20]. However, ACBP-1G showed a clear prominent nuclear distribution which argues for a central role of this isoform in this compartment. For ACBP-1AG and -1D, of which -1D is the first example of an N-terminal truncated ACBP isoform, we found a distinct subcellular distribution. ACBP-1AG was characterized by a vesicular distribution with a low signal intensity in nucleus, indicating a more specific role in vesicle transport, whereas ACBP-1D showed a vesicular localization pattern with a strong enrichment around the nucleus indicating a possible ER localization. Interestingly, although our primary sequence analyses of all four isoforms revealed no specific targeting signal, isoforms ACBP-1AG and -1D were predicted to enter the non-classical, not signal peptide triggered, secretory pathway as described for many other proteins [42–45]. Maybe, this could be a first indication for a possible secretion of these isoforms as was also described for an extracellularly targeted ACBP in Arabidopsis thaliana[46]. Of course, in either case the specific localization of the new isoforms has to be analysed in more detail using different specific cell biological methods to clarify their distribution pattern.
In summary, our studies identified novel low-abundant transcripts of the human ACBP gene locus, produced by alternative splicing and alternative promoter usage, which are regulated in a complex and specific manner as their high-abundance counterparts. The mode of regulation clearly demonstrates that Acbp is a multifunctional gene. Furthermore, we show for the first time that one Acbp transcript (1G) is a NF-κB target which links fatty acid metabolism with inflammation. In the future, cellular effects of knockdown of specific Acbp transcripts on inflammatory pathway will be performed. In addition, the impact of overexpression of specific Acbp transcripts on gene could be an approach in order to investigate the function of low-abundant ACBP proteins.
Acknowledgments
We thank Y. Dignal and D. Hallack for excellent technical assistance. This work was financially supported by the BMBF-Project ‘Fat and Metabolism – Genvariation, Genregulation and Genfunction’ (AZ 0313437B).
References
- 1.Petherick A. Genetics: the production line. Nature. 2008;454:1042–5. doi: 10.1038/4541042a. [DOI] [PubMed] [Google Scholar]
- 2.Carninci P. Tagging mammalian transcription complexity. Trends Genet. 2006;22:501–10. doi: 10.1016/j.tig.2006.07.003. [DOI] [PubMed] [Google Scholar]
- 3.Bertone P, Stolc V, Royce TE, et al. Global identification of human transcribed sequences with genome tiling arrays. Science. 2004;306:2242–6. doi: 10.1126/science.1103388. [DOI] [PubMed] [Google Scholar]
- 4.Carninci P, Shibata Y, Hayatsu N, et al. Normalization and subtraction of cap-trapper-selected cDNAs to prepare full-length cDNA libraries for rapid discovery of new genes. Genome Res. 2000;10:1617–30. doi: 10.1101/gr.145100. [DOI] [PMC free article] [PubMed] [Google Scholar]
- 5.Kim YC, Jung YC, Xuan Z, et al. Pan-genome isolation of low abundance transcripts using SAGE tag. FEBS Lett. 2006;580:6721–9. doi: 10.1016/j.febslet.2006.11.013. [DOI] [PMC free article] [PubMed] [Google Scholar]
- 6.Lee S, Bao J, Zhou G, et al. Detecting novel low-abundant transcripts in Drosophila. Rna. 2005;11:939–46. doi: 10.1261/rna.7239605. [DOI] [PMC free article] [PubMed] [Google Scholar]
- 7.Borboni P, Condorelli L, De Stefanis P, et al. Modulation of insulin secretion by diazepam binding inhibitor and its processing products. Neuropharmacology. 1991;30:1399–403. doi: 10.1016/s0028-3908(11)80008-0. [DOI] [PubMed] [Google Scholar]
- 8.Chen ZW, Agerberth B, Gell K, et al. Isolation and characterization of porcine diazepam-binding inhibitor, a polypeptide not only of cerebral occurrence but also common in intestinal tissues and with effects on regulation of insulin release. Eur J Biochem. 1988;174:239–45. doi: 10.1111/j.1432-1033.1988.tb14088.x. [DOI] [PubMed] [Google Scholar]
- 9.Li Y, Hao Y, Owyang C. Diazepam-binding inhibitor mediates feedback regulation of pancreatic secretion and postprandial release of cholecystokinin. J Clin Invest. 2000;105:351–9. doi: 10.1172/JCI7204. [DOI] [PMC free article] [PubMed] [Google Scholar]
- 10.Taupin V, Herbelin A, Descamps-Latscha B, et al. Endogenous anxiogenic peptide, ODN-diazepam-binding inhibitor, and benzodiazepines enhance the production of interleukin-1 and tumor necrosis factor by human monocytes. Lymphokine Cytokine Res. 1991;10:7–13. [PubMed] [Google Scholar]
- 11.Taupin V, Gogusev J, Descamps-Latscha B, et al. Modulation of tumor necrosis factor-alpha, interleukin-1 beta, interleukin-6, interleukin-8, and granulocyte/macrophage colony-stimulating factor expression in human monocytes by an endogenous anxiogenic benzodiazepine ligand, triakontatetraneuropeptide: evidence for a role of prostaglandins. Mol Pharmacol. 1993;43:64–9. [PubMed] [Google Scholar]
- 12.Zavala VTaF. Peripheral benzodiazepine receptors and the cytokine network: studies in the immune system and in the brain. Biological Psychiatry. 1997;42:82S–83S. [Google Scholar]
- 13.Shulga N, Pastorino JG. Acyl coenzyme A-binding protein augments bid-induced mitochondrial damage and cell death by activating mu-calpain. J Biol Chem. 2006;281:30824–33. doi: 10.1074/jbc.M602503200. [DOI] [PubMed] [Google Scholar]
- 14.Guidotti A, Forchetti CM, Corda MG, et al. Isolation, characterization, and purification to homogeneity of an endogenous polypeptide with agonistic action on benzodiazepine receptors. Proc Natl Acad Sci USA. 1983;80:3531–5. doi: 10.1073/pnas.80.11.3531. [DOI] [PMC free article] [PubMed] [Google Scholar]
- 15.Shoyab M, Gentry LE, Marquardt H, et al. Isolation and characterization of a putative endogenous benzodiazepineoid (endozepine) from bovine and human brain. J Biol Chem. 1986;261:11968–73. [PubMed] [Google Scholar]
- 16.Benavides J, Quarteronet D, Plouin PF, et al. Characterization of peripheral type benzodiazepine binding sites in human and rat platelets by using [3H]PK 11195. Studies in hypertensive patients. Biochem Pharmacol. 1984;33:2467–72. doi: 10.1016/0006-2952(84)90719-6. [DOI] [PubMed] [Google Scholar]
- 17.Zavala F, Haumont J, Lenfant M. Interaction of benzodiazepines with mouse macrophages. Eur J Pharmacol. 1984;106:561–6. doi: 10.1016/0014-2999(84)90059-1. [DOI] [PubMed] [Google Scholar]
- 18.Itzhak Y, Baker L, Norenberg MD. Characterization of the peripheral-type benzodiazepine receptors in cultured astrocytes: evidence for multiplicity. Glia. 1993;9:211–8. doi: 10.1002/glia.440090306. [DOI] [PubMed] [Google Scholar]
- 19.Cahard D, Canat X, Carayon P, et al. Subcellular localization of peripheral benzodiazepine receptors on human leukocytes. Lab Invest. 1994;70:23–8. [PubMed] [Google Scholar]
- 20.Nitz I, Doring F, Schrezenmeir J, et al. Identification of new acyl-CoA binding protein transcripts in human and mouse. Int J Biochem Cell Biol. 2005;37:2395–405. doi: 10.1016/j.biocel.2005.06.008. [DOI] [PubMed] [Google Scholar]
- 21.Burge C, Karlin S. Prediction of complete gene structures in human genomic DNA. J Mol Biol. 1997;268:78–94. doi: 10.1006/jmbi.1997.0951. [DOI] [PubMed] [Google Scholar]
- 22.Klapper M, Bohme M, Nitz I, et al. The human intestinal fatty acid binding protein (hFABP2) gene is regulated by HNF-4alpha. Biochem Biophys Res Commun. 2007;356:147–52. doi: 10.1016/j.bbrc.2007.02.091. [DOI] [PubMed] [Google Scholar]
- 23.Klapper M, Bohme M, Nitz I, et al. Transcriptional regulation of the fatty acid binding protein 2 (FABP2) gene by the hepatic nuclear factor 1 alpha (HNF-1alpha) Gene. 2008;416:48–52. doi: 10.1016/j.gene.2008.02.025. [DOI] [PubMed] [Google Scholar]
- 24.Bhuiyan J, Pritchard PH, Pande SV, et al. Effects of high-fat diet and fasting on levels of acyl-coenzyme A binding protein in liver, kidney, and heart of rat. Metabolism. 1995;44:1185–9. doi: 10.1016/0026-0495(95)90013-6. [DOI] [PubMed] [Google Scholar]
- 25.Holland MJ. Transcript abundance in yeast varies over six orders of magnitude. J Biol Chem. 2002;277:14363–6. doi: 10.1074/jbc.C200101200. [DOI] [PubMed] [Google Scholar]
- 26.Blencowe BJ. Alternative splicing: new insights from global analyses. Cell. 2006;126:37–47. doi: 10.1016/j.cell.2006.06.023. [DOI] [PubMed] [Google Scholar]
- 27.Modrek B, Lee CJ. Alternative splicing in the human, mouse and rat genomes is associated with an increased frequency of exon creation and/or loss. Nat Genet. 2003;34:177–80. doi: 10.1038/ng1159. [DOI] [PubMed] [Google Scholar]
- 28.Koren E, Lev-Maor G, Ast G. The emergence of alternative 3’ and 5’ splice site exons from constitutive exons. PLoS Comput Biol. 2007;3:e95. doi: 10.1371/journal.pcbi.0030095. [DOI] [PMC free article] [PubMed] [Google Scholar]
- 29.Ayoubi TA, Van De Ven WJ. Regulation of gene expression by alternative promoters. FASEB J. 1996;10:453–60. [PubMed] [Google Scholar]
- 30.Kornblihtt AR. Chromatin, transcript elongation and alternative splicing. Nat Struct Mol Biol. 2006;13:5–7. doi: 10.1038/nsmb0106-5. [DOI] [PubMed] [Google Scholar]
- 31.Kornblihtt AR. Promoter usage and alternative splicing. Curr Opin Cell Biol. 2005;17:262–8. doi: 10.1016/j.ceb.2005.04.014. [DOI] [PubMed] [Google Scholar]
- 32.Cramer P, Pesce CG, Baralle FE, et al. Functional association between promoter structure and transcript alternative splicing. Proc Natl Acad Sci USA. 1997;94:11456–60. doi: 10.1073/pnas.94.21.11456. [DOI] [PMC free article] [PubMed] [Google Scholar]
- 33.Neess D, Kiilerich P, Sandberg MB, et al. ACBP–a PPAR and SREBP modulated housekeeping gene. Mol Cell Biochem. 2006;284:149–57. doi: 10.1007/s11010-005-9039-9. [DOI] [PubMed] [Google Scholar]
- 34.Eberle D, Hegarty B, Bossard P, et al. SREBP transcription factors: master regulators of lipid homeostasis. Biochemie. 2004;86:839–48. doi: 10.1016/j.biochi.2004.09.018. [DOI] [PubMed] [Google Scholar]
- 35.Swinnen JV, Alen P, Heyns W, et al. Identification of diazepam-binding Inhibitor/Acyl-CoA-binding protein as a sterol regulatory element-binding protein-responsive gene. J Biol Chem. 1998;273:19938–44. doi: 10.1074/jbc.273.32.19938. [DOI] [PubMed] [Google Scholar]
- 36.Mietus-Snyder M, Sladek FM, Ginsburg GS, et al. Antagonism between apolipoprotein AI regulatory protein 1, Ear3/COUP-TF, and hepatocyte nuclear factor 4 modulates apolipoprotein CIII gene expression in liver and intestinal cells. Mol Cell Biol. 1992;12:1708–18. doi: 10.1128/mcb.12.4.1708. [DOI] [PMC free article] [PubMed] [Google Scholar]
- 37.Sandberg MB, Bloksgaard M, Duran-Sandoval D, et al. The gene encoding acyl-CoA-binding protein is subject to metabolic regulation by both sterol regulatory element-binding protein and peroxisome proliferator-activated receptor alpha in hepatocytes. J Biol Chem. 2005;280:5258–66. doi: 10.1074/jbc.M407515200. [DOI] [PubMed] [Google Scholar]
- 38.Baldwin AS., Jr The NF-kappa B and I kappa B proteins: new discoveries and insights. Annu Rev Immunol. 1996;14:649–83. doi: 10.1146/annurev.immunol.14.1.649. [DOI] [PubMed] [Google Scholar]
- 39.Gao M, Deng C, Yu W, et al. Large scale depletion of the high-abundance proteins and analysis of middle- and low-abundance proteins in human liver proteome by multidimensional liquid chromatography. Proteomics. 2008;8:939–47. doi: 10.1002/pmic.200600099. [DOI] [PubMed] [Google Scholar]
- 40.Wienkoop S, Weckwerth W. Relative and absolute quantitative shotgun proteomics: targeting low-abundance proteins in Arabidopsis thaliana. J Exp Bot. 2006;57:1529–35. doi: 10.1093/jxb/erj157. [DOI] [PubMed] [Google Scholar]
- 41.Qian WJ, Kaleta DT, Petritis BO, et al. Enhanced detection of low abundant human plasma proteins using a tandem IgY12-supermix immunoaffinity separation strategy. Mol Cell Proteomics. 2008;7:1963–73. doi: 10.1074/mcp.M800008-MCP200. [DOI] [PMC free article] [PubMed] [Google Scholar]
- 42.Chang HC, Samaniego F, Nair BC, et al. HIV-1 Tat protein exits from cells via a leaderless secretory pathway and binds to extracellular matrix-associated heparan sulfate proteoglycans through its basic region. Aids. 1997;11:1421–31. doi: 10.1097/00002030-199712000-00006. [DOI] [PubMed] [Google Scholar]
- 43.Mehul B, Hughes RC. Plasma membrane targetting, vesicular budding and release of galectin 3 from the cytoplasm of mammalian cells during secretion. J Cell Sci. 1997;110:1169–78. doi: 10.1242/jcs.110.10.1169. [DOI] [PubMed] [Google Scholar]
- 44.Mignatti P, Morimoto T, Rifkin DB. Basic fibroblast growth factor, a protein devoid of secretory signal sequence, is released by cells via a pathway independent of the endoplasmic reticulum-Golgi complex. J Cell Physiol. 1992;151:81–93. doi: 10.1002/jcp.1041510113. [DOI] [PubMed] [Google Scholar]
- 45.Rubartelli A, Bajetto A, Allavena G, et al. Secretion of thioredoxin by normal and neoplastic cells through a leaderless secretory pathway. J Biol Chem. 1992;267:24161–4. [PubMed] [Google Scholar]
- 46.Li HY, Xiao S, Chye ML. Ethylene- and pathogen-inducible Arabidopsis acyl-CoA-binding protein 4 interacts with an ethylene-responsive element binding protein. J Exp Bot. 2008;59:3997–4006. doi: 10.1093/jxb/ern241. [DOI] [PMC free article] [PubMed] [Google Scholar]