

An alternatively spliced transcript of human AQP4 that lacks exon 4 is identified. In transfected cells, AQP4-Δ4 shows no water transport properties, is retained in the ER, and has a dominant-negative effect on full-length AQP4. In skeletal muscles, AQP4-Δ4 mRNA expression inversely correlates with the level of AQP4 protein in different muscles.
Abstract
Two major isoforms of aquaporin-4 (AQP4) have been described in human tissue. Here we report the identification and functional analysis of an alternatively spliced transcript of human AQP4, AQP4-Δ4, that lacks exon 4. In transfected cells AQP4-Δ4 is mainly retained in the endoplasmic reticulum and shows no water transport properties. When AQP4-Δ4 is transfected into cells stably expressing functional AQP4, the surface expression of the full-length protein is reduced. Furthermore, the water transport activity of the cotransfectants is diminished in comparison to transfectants expressing only AQP4. The observed down-regulation of both the expression and water channel activity of AQP4 is likely to originate from a dominant-negative effect caused by heterodimerization between AQP4 and AQP4-Δ4, which was detected in coimmunoprecipitation studies. In skeletal muscles, AQP4-Δ4 mRNA expression inversely correlates with the level of AQP4 protein and is physiologically associated with different types of skeletal muscles. The expression of AQP4-Δ4 may represent a new regulatory mechanism through which the cell-surface expression and therefore the activity of AQP4 can be physiologically modulated.
INTRODUCTION
Aquaporin-4 (AQP4) is a water-selective membrane protein expressed in the CNS and other tissue, including skeletal muscle (Frigeri et al., 1995, 1998). The two major isoforms produced by the aquaporin gene are M1 and M23 (Jung et al., 1994), which are arranged in the plasma membrane to form supramolecular structures called orthogonal arrays of particles (OAPs). Of importance, the size and number of OAPs depend on the ratio between the two major isoforms, the longest being M1, the OAP size-limiting isoform (Nicchia et al., 2010). Although the physiological role of OAPs is not known, they were recently identified as the major target of AQP4 autoantibodies produced by patients affected by neuromyelitis optica, a demyelinating autoimmune disease (Nicchia et al., 2009). Studies discovered the expression of other AQP4 isoforms in rat tissue (Moe et al., 2008), and in particular the Mz isoform of AQP4 appears to affect OAP formation. However, the Mz isoform is not expressed in humans (Rossi et al., 2012) and thus is of limited interest.
The regulation of AQP4 expression and/or activity is one of the major issues in studies regarding the physiopathological role of AQP4. There are contrasting data regarding AQP4 short-term regulation by phosphorylation. Previous reports on transfected cells suggested inhibition of activity by Ser-180 phosphorylation (Han et al., 1998; Zelenina et al., 2002; McCoy et al., 2010), and other studies showed activation after phosphorylation of Ser-111 (Gunnarson et al., 2008). However, in rat astrocyte primary cultures, which retain a high level of AQP4 protein, phosphorylation appears not involved in modulating its activity (Nicchia et al., 2008), and Ser-111 appears not involved in AQP4 channel gating (Assentoft et al., 2013).
A second way in which AQP4 may be regulated is linked to its translocation to the plasma membrane. Several studies performed using cultured astrocytes report a significant intracellular AQP4 expression, which would suggest the need for AQP4 trafficking (Nicchia et al., 2008; Potokar et al., 2013). However, in the brain AQP4 is largely expressed in the glial cell plasma membrane, with no significant intracellular pool, suggesting that there is no need for regulation of water transport by AQP4 translocation in the CNS.
The third way in which AQP4 is regulated is by changes in expression levels. Several studies report changes in the surface expression of AQP4, mainly in pathological conditions. Loss of AQP4 has been reported in ischemia (Frydenlund et al., 2006), brain injury, and models of Duchenne muscular dystrophy (Frigeri et al., 2001) and Alzheimer's disease (Yang et al., 2011). However, the molecular signaling that induces these changes is not known, nor is whether analogous changes happen under physiological conditions.
Finally, recent studies indicate a complex mechanism of translational control of AQP4 that could be responsible for the different expression of the two major isoforms in AQP4-expressing tissues (Rossi et al., 2010; Pisani et al., 2011). These reports also suggest that regulation of AQP4 expression and OAP formation and size can occur at the posttranscriptional level. Furthermore, it is likely that additional posttranscriptional mechanisms occur to finely regulate AQP4 expression or function. Indeed, it is not known why tissues expressing similar levels of AQP4 mRNA display large differences in AQP4 protein content.
To evaluate the expression of new AQP4 isoforms in tissues in which the quantitative levels of AQP4 protein are low compared with the levels of AQP4 mRNA (i.e., skeletal muscle), we generated and screened a human skeletal muscle coding sequence (CDS) library of AQP4 transcripts. We identified a novel short isoform of human AQP4 and named it AQP4-Δ4, as it is generated from alternative splicing of exon 4 of the aquaporin-4 gene, leading to an in-frame deletion of exon 4 in the AQP4 mRNA. We found that this isoform is expressed in skeletal muscle and has a negative-dominant effect on the full-length protein, suggesting a new way to modulate membrane expression and activity of water transport in AQP4-expressing tissues.
RESULTS
AQP4 CDS library reveals a new mRNA splicing isoform in human skeletal muscle
The human AQP4 gene occupies the q11.2 position on chromosome 18 and consists of five exons that span 13.75-kb pairs. We constructed AQP4-CDS libraries from two human tissues: skeletal muscle and cerebellum. CDS library analysis in human deltoid showed the lack of 81 base pairs corresponding to the entire exon 4 of AQP4 in ∼15% of isolated clones (Figure 1). These clones, containing the M1 starting methionine, were in-frame and therefore could potentially express a new isoform, which we named AQP4-Δ4 (GenBank: KF055862). No AQP4-Δ4 isoform was isolated from human cerebellum. In total, 35 clones were analyzed for both libraries.
FIGURE 1:

Characteristics of the alternatively spliced transcript of human AQP4. (A) Schematic representation of the human AQP4 gene (top), the normally spliced AQP4 isoform (middle), and the exon-skipped AQP4-Δ4 isoform (bottom). The exons are shown as boxes, and their relative sizes are depicted; alternative splicing patterns are indicated as lines connecting the exons. (B) Nucleotide and amino acid (capital letters) sequences of AQP4. The alternatively spliced exon 4 and the related 27 deleted amino acids are shown in red. (C) Transmembrane topology of AQP4 showing relative orientation of N- and C-termini, transmembrane segments (numbers), and loops (capital letters). The deleted portion is indicated in green. (D, E) Location of deleted portion (green) in AQP4 monomer (D) and AQP4 tetramer (E) in structural models designed using PyMOL software (De Lano Scientific). (F, G) Topological prediction of AQP4-Δ4 with predicted transmembrane regions and probability graphs by TMHMM (www.cbs.dtu.dk/services/TMHMM/) and (G) OCTOPUS (http://octopus.cbr.su.se/).
If translated from M1, this new isoform could produce a smaller AQP4 protein of 296 amino acids missing the final part of transmembrane helix 5 and loop E (Figure 1B). Protein hydrophobicity plots of the AQP4-Δ4 transcript demonstrated that loss of exon 4 would leave the general transmembrane helix structure intact and with no frame shift, but the second, highly conserved NPA motif is absent. This motif contains a structural domain that plays a crucial role in AQP4 membrane targeting and water-selective permeation (Guan et al., 2010). Immunofluorescence experiments, using transfected cells, indicate that the C-terminal motif of AQP4-Δ4 is still intracellular (Supplemental Figure S1), and therefore the general topological structure of the N- and C-termini is retained.
PCR and quantitative PCR specific for AQP4 alternative splicing isoforms and protein expression in human tissues
To establish whether AQP4-Δ4 expression is restricted solely to the human deltoid, Real time-PCR (RT-PCR) was used to determine its expression in other skeletal muscles (thenar eminence, masseter), as well as in the cerebrum and cerebellum. Primers used for PCR (P3 and P4 in Figure 2A) were complementary to the exon 3 and 5 regions and amplified both AQP4 and AQP4-Δ4 fragments, generating two amplicons of 299 and 218 base pairs, respectively. As positive control we performed PCR on total RNA extracted from HeLa cells transfected with M1 or M1-Δ4 in molar ratio 1:1.
FIGURE 2:

Expression of AQP4 transcripts and protein in human tissue. (A) Primers used for RT-PCR and qPCR with their relative location in AQP4 and AQP4-Δ4 mRNA. (B) Coamplification by RT-PCR of AQP4 splice variant with full-length AQP4 from four different human cDNAs. Two bands are visible in skeletal muscles. No AQP4-Δ4 amplicon was detected in human cerebellum. (C) Histogram showing percentage of AQP4-Δ4 (Δ4) relative to the total measured by RT-PCR (*p = 0.03, n = 3). (D) Immunoblot detection of AQP4 protein expressed in human brain and skeletal muscle. Two bands of 32 and 30 kDa were detected corresponding, respectively, to M1 and M23. Actin was used as a loading control. (E) qPCR analysis showing absolute quantities of AQP4 and AQP4-Δ4 mRNA (left) and the ratio between the two forms (right) in human tissue using isoform-specific primers (*p < 0.05, n = 4; **p < 0.01, n = 4).
Coamplification of AQP4-spliced variant with full-length AQP4 from five different human cDNAs showed that the full-length was the most abundant AQP4 mRNA (Figure 2B). AQP4-Δ4 was detected in all skeletal muscles analyzed. A high level of AQP4-Δ4 expression was observed in the thenar eminence muscles of the human hand palm and masseter, whereas moderate expression was detected in the deltoid, in which, according to the analysis on the CDS library, the AQP4-Δ4 transcript represented 15% of total AQP4 transcripts.
To accurately quantify full-length and AQP4-Δ4 mRNA in different tissues, we used quantitative PCR (qPCR). Figure 2E shows the absolute copy number of each isoform. Both cerebellum and brain expressed high levels of full-length AQP4 mRNA compared with the skeletal muscle sample. Furthermore, analysis of the abundance of AQP4-Δ4 mRNA revealed that the relative amounts of AQP4-Δ4 in the thenar eminence were threefold and eightfold greater than those found in brain and cerebellum, respectively (Figure 2E, right). Of interest, despite the thenar eminence and deltoid having the same copy number as full-length AQP4, the percentage of deleted isoform with respect to the total was about twice as great in thenar eminence than in the deltoid. Of interest, AQP4-Δ4 mRNA was also amplified from brain and cerebellum to the same amount as for skeletal muscle samples, but its relative expression compared with the full length corresponded to only ∼5–10%.
The AQP4 protein expression levels were examined by immunoblotting (Figure 2D). M1-AQP4-Δ4 has a predicted molecular weight of 30 kDa, and hence it is indistinguishable from M23-AQP4. In the human skeletal muscle biopsies analyzed, only the deltoid showed moderate expression of AQP4 isoforms, whereas the thenar eminence and masseter only displayed a weak signal. Of interest, by comparing the immunoblotting with the PCR results (Figure 2, B and D), it can be deduced that the higher the percentage of AQP4-Δ4 isoform, the lower is the protein expression in the tissue. This was particularly evident in the deltoid and thenar eminence muscles, showing equal full-length copy number but different AQP4-Δ4 amounts, which appeared to be inversely proportional to the protein levels of AQP4.
Characterization of AQP4-Δ4 protein: a dominant-negative effect on AQP4 expression
Initial data reported in Figure 2 suggest that the spliced isoform may have a dominant-negative effect on AQP4 expression levels. Thus, to investigate the role played by AQP4-Δ4 on AQP4 total protein expression levels, we transiently cotransfected equal amounts of AQP4 and AQP4-Δ4 or “empty vector” plasmids into HeLa cells and analyzed the AQP4 protein level by Western blot. The most relevant observation was the inhibition of AQP4 expression in the presence of AQP4-Δ4, supporting a dominant-negative modulation of the AQP4-Δ4 variant (Figure 3, A–C). The negative effect of AQP4-Δ4 was confirmed by immunofluorescence on cotransfected cells, in which the expression of the splice variant down-regulated AQP4 expression (Figure 3G). Of importance, this dominant-negative modulation also occurs in rat astrocyte primary cell cultures, which express high levels of endogenous AQP4 (Nicchia et al., 2008). Indeed, transfection of astrocytes with AQP4-Δ4 leads to a decrease in AQP4 protein levels compared with the same cells transfected with an empty plasmid (Figure 3, D–F).
FIGURE 3:

Dominant-negative effect of AQP4-Δ4 in mammalian cells. (A, B) Immunoblot analysis of AQP4 expression in HeLa cells cotransfected with AQP4 and AQP4-D4 (D4), both cloned into pTARGET or empty vector (EV). Protein samples were analyzed by SDS–PAGE (A) or blue native PAGE (BN-PAGE; B). (C) Densitometric analysis reported as AQP4/actin expression ratio. The histogram shows the analysis of five independent experiments (*p < 0.05). (D, E) AQP4 expression in rat primary astrocyte cultures transfected with deleted isoform, cloned into pTARGET mammalian expression vector or empty vector, and analyzed by SDS–PAGE (D) or BN-PAGE (E). The multiple bands detected after BN-PAGE (B, D) correspond to supramolecular organization (i.e., OAPs) of AQP4. (F) Histogram for the densitometric analysis of the protein bands in D, calculated as AQP4/GFAP expression ratio. Analysis of three independent experiments (*p < 0.05). (G) Immunofluorescence AQP4 staining in HeLa cells cotransfected with AQP4 and empty vector (EV) or AQP4 and AQP4-D4 in a 1:1 ratio. Scale bar, 50 μm. Images are representative of six independent experiments.
Characterization of AQP4-Δ4: protein stability and dominant-negative effect
To estimate the half-life of the two AQP4 variants, transfected HeLa cells with AQP4 and AQP4-Δ4 were treated with cycloheximide (CHX) to inhibit protein synthesis.
The level of the different AQP4 variants was determined by Western blot analysis over an 8-h interval. AQP4 (half-life, >8 h) appeared to be significantly more stable than AQP4-Δ4, the expression of which rapidly decreased after 2 h of incubation with CHX, thus exhibiting a rapid turnover (Figure 4A).
FIGURE 4:

AQP4-Δ4 protein stability and dominant-negative effect. (A) Immunoblot analysis of AQP4 expression in HeLa cells transfected with AQP4 or AQP4-Δ4 and treated with 30 μM CHX for the indicated duration to stop protein synthesis. (B) Immunoblot analysis of AQP4-Δ4 (Δ4) levels in transiently transfected HeLa cells treated or not with 15 μM MG132 proteasome inhibitor (MG132 ±). (C) Histograms for the densitometric analysis of the AQP4 expression levels obtained after CHX treatment (left; mean ± SE; **p < 0.01; n = 3–5 independent experiments) or MG132 treatment (right; n = 3 or 4 independent experiments; *p < 0.05). (D) HeLa cells transiently transfected with AQP4 alone or in the presence of dominant-negative AQP4-D4 were labeled for 30 min with [35S]cysteine/methionine and chased for the indicated times. Cells were then solubilized, and lysates were immunoprecipitated with anti-AQP4 antibody and analyzed by autoradiography as described in Materials and Methods. Where indicated, transfected HeLa cells were pretreated with 30 μM proteasome inhibitor MG132 for 3 h before starvation, and proteasome inhibitor was maintained throughout the experiments. (D) Representative autoradiograms of immunoprecipitated proteins with chase times of 0, 1, 2, and 4 h. (E) Averaged kinetics of protein degradation from four independent sets of experiments (mean ± SE; **p < 0.01).
To further investigate AQP4-Δ4 turnover, we treated HeLa cells with the well-characterized proteasome inhibitor MG132 for 7 h and probed immunoblots of total cell lysate with anti-AQP4 antibodies (Figure 4B). AQP4-Δ4 increases its expression level threefold after proteasome inhibition, suggesting that its rapid turnover is due to proteasome degradation (Figure 4C).
To study AQP4 stability in the presence of AQP4-Δ4, we designed pulse-chase experiments on transiently transfected cells (Figure 4D). These experiments were performed using in vivo labeling of cells with a [35S]methionine-cysteine mixture (see Materials and Methods), followed by chase for an indicated time (0–4 h) and subsequent immunoprecipitation.
In the absence of AQP4-Δ4 the AQP4 protein decreased slightly (in the range of 70%) during a 4-h chase (Figure 4E, open circles). In contrast, in the presence of AQP4-Δ4, the AQP4 signal decreased rapidly and significantly during the chase (down to 40% after 4 h; Figure 4E, filled square).
To evaluate whether the proteasome pathway is responsible for AQP4 down-regulation in the presence of AQP4-Δ4, we conducted pulse-chase experiments in the presence of the proteasome inhibitor MG132.
In MG132-treated cells, the degradation of AQP4 in the presence of AQP4-Δ4 significantly slowed and was comparable to AQP4 degradation in the absence of AQP4-Δ4, suggesting that the dominant-negative effect of AQP4-Δ4 on AQP4 occurs via the proteasome pathway.
Characterization of AQP4-Δ4: protein subcellular localization
Because the biological function of AQP4 is intimately linked to its membrane localization, we determined the subcellular localization of the novel isoform. Green fluorescent protein (GFP)–tagged AQP4-Δ4 expressed in transfected cells presented a major intracellular localization, suggesting reduced labeling at the plasma membrane (Figure 5). To analyze the subcellular compartment in which the AQP4-Δ4 variant is retained, we cotransfected cells with AQP4-Δ4-GFP and calreticulin–red fluorescent protein (RFP), a chaperone protein located in the endoplasmic reticulum (ER), or with the trans-Golgi glycosyltransferase-RFP. We examined cellular localization by confocal microscopy. The AQP4-Δ4 signal did not overlap with the Golgi marker, whereas it did colocalize extensively with the ER marker (Figure 5, top and middle). This improper trafficking also occurred in rat astrocyte primary cell cultures (Figure 5, bottom). Weak staining of AQP4-Δ4 was also observed at the plasma membrane level (Supplemental Figures S2 and S3). These data indicate that the AQP4-Δ4 splice variant mostly resides in the ER. The improper trafficking and ultimate degradation of AQP4-Δ4 is consistent with its rapid turnover.
FIGURE 5:

AQP4-Δ4 protein subcellular localization. Confocal image of localization of AQP4-Δ4 (Δ4, green) in transfected HeLa cells and rat astrocyte primary cultures using subcellular markers (red). Note the colocalization of the spliced isoform with ER in both cell types. Images are representative of six independent experiments. Scale bar, 15 μm.
AQP4-Δ4 dominant-negative effect by protein misrouting and hetero-oligomeric complexes
There are several examples of truncated splice variants with altered trafficking that are able to misroute their respective canonical protein (Karpa et al., 2000; Sarmiento et al., 2004; Zmijewski and Slominski, 2009). Thus we tested the hypothesis that the function of AQP4-Δ4 protein is to control cell surface expression of the full-length protein by accumulating the newly synthesized channels in the ER.
To this purpose, we cotransfected HeLa cells with AQP4 tagged with GFP and calreticulin-RFP in the presence or absence of AQP4-Δ4. After 30 h of transfection, we examined cells by confocal microscopy. Image analysis (Figure 6A) showed retention of full-length AQP4 in the ER in the presence of AQP4-Δ4 compared with cells only expressing AQP4. Finally, to analyze whether the degradation of AQP4 requires physical interaction with AQP4-Δ4, we performed coimmunoprecipitation experiments. In these experiments (Figure 6B), AQP4-Δ4 was tagged with GFP and immunoprecipitated with anti-GFP antibodies, and immunoblots were performed with anti-AQP4 antibodies. Transfected cells were treated for 7 h with 15 μM proteasome inhibitor MG132 to prolong AQP4-Δ4 half-life. The results showed copurification of AQP4 with AQP4-Δ4, demonstrating physical interaction between the two isoforms.
FIGURE 6:

AQP4 WT is retained in ER when coexpressed with AQP4-Δ4. (A) Confocal images of full-length AQP4 and AQP4-Δ4 (green) with ER marker (red). Note that full-length AQP4 in the presence of the spliced isoform (Δ4) is strongly retained in the ER compartment (bottom). Images are representative of four independent experiments. Scale bar, 15 μm. (B) Immunoblot of anti-GFP precipitated proteins revealed with anti-AQP4 antibodies. HeLa cells were cotransfected with the indicated expression constructs and treated for 7 h with 15 μM proteasome inhibitor MG132 to prolong AQP4-Δ4 half-life; immunoprecipitation with agarose beads was performed using anti-GFP (anti-GFP) or rabbit (immunoglobulin G) antibodies. The top band corresponds to AQP4-GFP, and the bottom band corresponds to AQP4 without a tag. Note the presence of AQP4 in the second lane. EV, empty vector.
Effect of AQP4-Δ4 on plasma membrane water permeability
To test whether the expression of AQP4-Δ4 resulted in a reduction in AQP4-mediated water transport, we transiently transfected a stably expressing AQP4 cell line with AQP4-Δ4 (Figure 7). Water transport measurement showed strongly reduced osmotic cell response in the presence of AQP4-Δ4, in line with the hypothesis of its dominant-negative effect. Furthermore, a stable cell line expressing high levels of AQP4-Δ4 showed no increase in water permeability compared with wild-type cells. These data indicate that AQP4-Δ4 is not a functional water channel, and its dominant-negative effect causes a reduction in plasma membrane water permeability due to reduction in AQP4 plasma membrane abundance.
FIGURE 7:
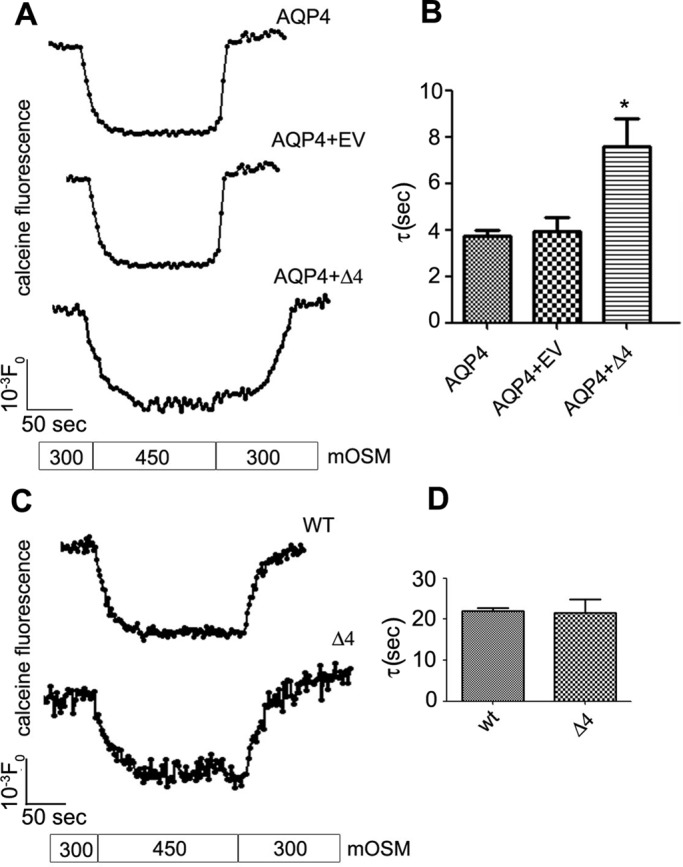
Analysis of the effect of AQP4-Δ4 on cell water transport. (A) A stable cell line expressing a high level of AQP4 was transiently transfected with AQP4-Δ4 (Δ4), and after 36 h water transport analysis was performed using the calcein-quenching method after osmotic shock at 10°C. Top, time course of the stable cell line; middle, time course of the cell line transiently transfected with the control vector (EV); bottom, time course of cell expressing AQP4-Δ4 (Δ4). (B) Mean values ± SEM of the time constant (n = 3–5 independent experiments; *p < 0.05). (C) kinetics of fluorescent calcein of wild-type and AQP4-Δ4 (Δ4) stable cell lines. (D) Mean values ± SEM of the time constant (n = 3–5 independent experiments).
AQP4-Δ4 mRNA in rat skeletal muscle inversely correlates with AQP4 protein expression
AQP4 expression is associated with the glycolytic capacity of the muscle (Basco et al., 2013). To analyze the expression level of AQP4-Δ4 in rat skeletal muscles with different fiber composition and glycolytic capacity, we evaluated two typical fast-twitch muscles, namely the extensor digitorum longus (EDL) and quadriceps, and a typical slow muscle, the soleus (Figure 8). Furthermore, we also analyzed the flexor digitorum brevis (FDB), which is an oxidative glycolytic fast-twitch muscle with peculiarly low AQP4 expression. Coamplification of AQP4 splice variant with full-length AQP4 showed that the full-length form was the most abundant AQP4 mRNA in skeletal muscle (Figure 8A). Although at a low level, AQP4-Δ4 was detected in rat skeletal muscles, and its relative amount was about four times higher in the FDB and soleus compared with the EDL and quadriceps (Figure 8B). These data were inversely related to the protein levels of AQP4 in the same muscles (Figure 8C) and in agreement with findings in human skeletal muscles (Figure 2). Thus the low AQP4 protein expression levels in the soleus and FDB are likely to be the result of the negative effect of higher expression levels of AQP4-Δ4 mRNA. This suggests that AQP4-Δ4 actively regulates the functional expression of AQP4 in skeletal muscle.
FIGURE 8:
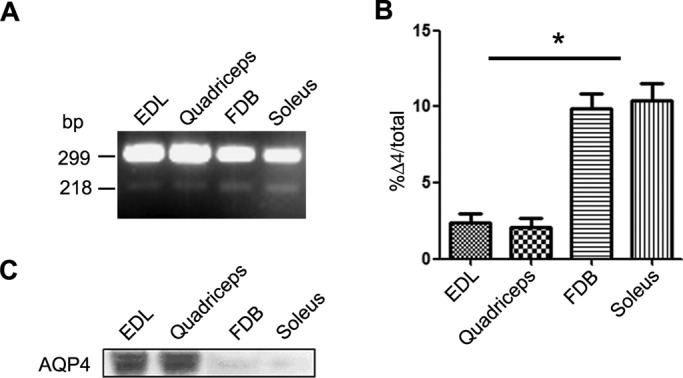
Expression of AQP4-Δ4 in rat skeletal muscle. (A) Coamplification by RT-PCR of AQP4 splice variant with full-length AQP4 from rat EDL, quadriceps, FDB, and soleus muscles and cerebellum. Note the two bands visible in skeletal muscles. (B) Densitometric analysis of AQP4-Δ4 abundance in different muscles (*p < 0.05; n = 3). (C) Immunoblot analysis of AQP4 expression in the analyzed rat tissues.
DISCUSSION
We recently demonstrated the existence of a complex mechanism of AQP4 translational control via leaky scanning and reinitiation (Rossi et al., 2010; Pisani et al., 2011), which allows the synthesis of the AQP4-M23 isoform from M1 mRNA. However, this mechanism could be part of a more complex network, which could account for discrepancies between the protein and mRNA AQP4 levels in different tissues and different physiopathological conditions described in the literature.
In the present study we identified a novel alternative spliced isoform of AQP4 derived from exon 4 skipping, which could be implicated in the mechanism of tissue-specific posttranscriptional regulation of AQP4 production through alternative splicing and a dominant-negative effect. Alternative splicing of pre-mRNA plays a key role in posttranscriptional gene regulation by generating distinct protein variants from the same genetic information, which differ in structure and function compared with the full-length protein. It has been estimated that >90% of all human multiexon genes are alternatively spliced (Wang et al., 2008). The importance of alternative splicing has been well established in normal development and differentiation (Kalsotra and Cooper, 2011). Furthermore, alternative splicing regulates quantitative levels of proteins in two ways: by producing alternative transcripts carrying a premature termination codon, resulting in nonsense-mediated mRNA degradation, and, if the aberrant transcript is translated, down-regulation of the corresponding protein levels via dominant-negative mechanisms (Kim et al., 2008; Shyu et al., 2008).
An initial sequence analysis of AQP4 intronic splicing acceptors shows that the splicing acceptors of introns 3 and 4 (flanking exon 4) are very similar and that the polypyrimidine tract of introns 1–3 contains UUCU elements, which are the binding sites for the polypyrimidine tract–binding protein (PTB). Of interest, PTB differentially modulates alternative splicing of a set of muscle-specific transcripts, allowing expression of muscle-specific isoforms (Lin and Tarn, 2011). Therefore it is possible to hypothesize that, during AQP4 pre-mRNA splicing, exon 4 skipping may occur via PTB.
Structure–function relationship of AQP4-Δ4
AQP4 exon 4 (81 base pairs) encodes 27 amino acids, and its skipping removes the final part of transmembrane helix 5 and loop E of the full-length AQP4. Of importance, the second NPA motif, which is coded by exon 4, is lost in AQP4-Δ4. Demonstrating its essential role in the formation of the structural domain for water permeation in the aquaporin monomeric channel (Guan et al., 2010), water permeability experiments indicate loss of function of AQP4-Δ4. Furthermore, the spliced protein overexpressed in a stable cell line does not increase basal cell water permeability, thus further demonstrating loss of function of AQP4-Δ4. Although there is a report of one splice variant of AQP4 in rat that lacks exon 2 (Moe et al., 2008), AQP4-Δ4 is the first human AQP4 splice product reported. Confocal microscopy experiments reveal that AQP4-Δ4 accumulates in the ER as opposed to full length AQP4, which is expressed mostly in the plasma membrane. As a consequence, retention of AQP4-Δ4 in the ER targets this protein for degradation, as demonstrated with proteasome inhibition experiments. The improper trafficking and ultimate degradation of AQP4-Δ4 are consistent with its rapid turnover as demonstrated by protein synthesis inhibition with cycloheximide.
Using qPCR analysis, we found that the AQP4-Δ4 transcript has similar mRNA levels in CNS and skeletal muscle, but its relative amount is much higher in skeletal muscle samples. This implies that the expression of AQP4-Δ4 mRNA is not limited to human skeletal muscle and suggests that it may be subjected to regulation under physiological or pathological conditions. Of importance, the expression levels of AQP4-Δ4 mRNA in different human muscles inversely correlated with total AQP4 protein expression level. Moreover, we showed by ectopic expression of AQP4 forms in mammalian cells and rat astrocyte primary cultures that AQP4-Δ4 exerts a dominant-negative effect over the full-length AQP4 protein. This makes a substantial functional difference from reports on other intracellular aquaporins such as AQP2, AQP6, and AQP11 (Nozaki et al., 2008). Indeed, AQP2 is localized in vesicles that recycle to the apical membrane of kidney collecting duct principal cells under vasopressin stimulation. Furthermore AQP6 and AQP12 have been reported to be exclusively intracellular: AQP6 in endosomes of kidney intercalated cells of the collecting duct (Yasui et al., 1999), and AQP11 was found to have an essential role in ER homeostasis in kidney and liver (Rojek et al., 2013).
Expression of AQP4-Δ4 as a new way to attenuate AQP4 expression and reduce water permeability of the plasma membrane
The dominant-negative effect that AQP4-Δ4 exerts over the full-length form could be explained by the oligomeric structure of AQP4 tetramers. It can be hypothesized that multimeric complexes formed by the full-length and truncated isoforms are probably retained in the ER because they are incorrectly assembled and, thus, targeted for degradation. This indicates that exon 4 is required for departure of AQP4 from the ER and for its forward transport through the plasma membrane pathway. Together these results suggest that inhibition of AQP4 by the AQP4-Δ4 variant is due to a protein–protein interaction in the ER, which, in turn, leads to a reduction in mature AQP4 expression in the plasma membrane.
The regulation of AQP4 expression/activity has not been thoroughly demonstrated. For example, short-term regulation by phosphorylation, which has been proposed to regulate AQP4 activity in transfected cells (Gunnarson et al., 2008), has not been confirmed in other models (Nicchia et al., 2008; Assentoft et al., 2013). However, the incongruence between mRNA and protein levels suggests a posttranscriptional level of regulation. We postulate that the functional significance of AQP4-Δ4 may reside in its ability to modulate AQP4 expression and activity at the posttranslational processing level. Of interest, from the confocal microscopy analysis (see also Supplemental Figure S3) it emerges that a minor amount of AQP4-Δ4 is still able to reach the plasma membrane, but this quantity would not increase the water transport. This suggests that AQP4-Δ4 can have a dual role of controlling plasma membrane water permeability by a dominant-negative effect and by insertion of inactive channels. This mechanism may be particularly relevant in skeletal muscle, where AQP4 is expressed in fast-twitch fibers, and particularly in those characterized by high glycolytic activity. Analysis of AQP4 in human skeletal muscles revealed that the level of AQP4-Δ4 mRNA inversely correlated with the total AQP4 protein expression levels. Of importance, the same correlation was assessed in rat skeletal muscle and in particular between slow muscle, such as the soleus, and fast muscle, such as the EDL. This indicates that in skeletal muscle AQP4-Δ4 substantially contributes to regulating the protein expression level of AQP4 and is responsible for the differences observed between fast and slow muscle. Thus the observed dominant-negative effect is a physiological mechanism that regulates AQP4 expression in slow and fast skeletal muscles. Further studies are required to determine the extent of this regulation in other tissues where AQP4 is strongly expressed and in tissues such as cardiac muscle, where AQP4 mRNA has been detected with minimal or no protein expression. Finally, aberrant AQP4-Δ4 expression could potentially lead to abnormal regulation of water balance, which may be involved in neurological and muscular disorders. For example, in dystrophic muscle of the mdx mouse—the animal model of Duchenne muscular dystrophy—the expression level of AQP4 protein is strongly reduced, but the level of mRNA is unaltered.
In conclusion, we identified and characterized an alternatively spliced form of AQP4 expressed in human skeletal muscle that modulates the protein level of full-length AQP4 in a dominant-negative way. Expression of AQP4-Δ4 may be an efficient mechanism for posttranscriptional regulation of AQP4 production and regulation of the water permeability of the plasma membrane.
MATERIALS AND METHODS
Human samples
Total human cerebellum, kidney, and stomach RNA was obtained from Clontech (Diatech Lab Line Srl, Milan, Italy), and total human brain frontal cortex RNA was obtained from Agilent Technologies (Milan, Italy). Human skeletal muscle samples were obtained from patients who underwent surgery. In detail, skeletal muscle biopsies were obtained from surgical removal of deep soft tissue that, after histology analysis, proved to be benign lesions of the soft tissues. Informed consent was obtained from patients. From each sample, depending on the size of the tissue, two portions were obtained for RNA and protein extraction.
Human AQP4 CDS library and sequencing
Human deltoid RNA extraction was carried out using TRIzol reagent (Invitrogen, Milan, Italy) according to the instruction manual. One microgram of total cerebellum and deltoid RNA was retrotranscribed using Super Script III reverse transcriptase (Invitrogen) as recommended by the manufacturer, and the single-stranded cDNA obtained was PCR amplified using primers P1 and P2 described in Table 1. PCR products were analyzed using 1% agarose gel by electrophoresis in TAE (Tris-acetate-EDTA) buffer. The selected PCR fragment of the expected size (1 kb) was cut from the agarose gel after electrophoresis separation, purified using the Qiaex II gel extraction kit (Qiagen, Milan, Italy), and then cloned into pCR2.1-TOPO vector using the Topo TA Cloning kit (Invitrogen). The recombinant vector was then transformed into chemically competent Escherichia coli. The recombinant E. coli harboring the recombinant plasmid was screened in selective Lysogeny broth (LB)/isopropyl-β-d-thiogalactoside/X-gal/ampicillin/agar plates (AmpBlue; Invitrogen). White colonies were cultured overnight in LB medium containing 50 μg/ml ampicillin, and plasmid DNA was isolated using QIAprep Spin Miniprep Kit (Qiagen) and sequenced (BMR Genomics, Padua, Italy). Analysis and multialignment of sequences were performed using ChromasLite2 (Technelysium, South Brisbane, Australia) and clustalW European Bioinformatics Institute Tools (www.ebi.ac.uk/Tools/clustalw2/index.html).
TABLE 1:
Primers used in this study.
| Primer name | Sequence |
|---|---|
| P1 | GAGAGCTGCACTCTGGCTGG |
| P2 | GTCTGCTTTCAGTGCGATCT |
| P3 | ATCTTTGCCAGCTGTGATTC |
| P4 | TGTTTGCTGGGCAGCTTTGC |
| P5 | AAGGCGGTGGGGTAAGTGT |
| P6 | CTGTGACTGCTTTCCAGAAAGC |
| P7 | GGACATTTATTTGCAATATATTGGGTT |
| P8 | TTCTTTAAAACGACGTTTGAATTCA |
| P9 | ATTTTTGCCAGCTGTGATTC |
| P10 | CGTCTGCTGTGCAGCTTTGC |
RNA extraction, RT-PCR, and quantitative RT-PCR
Human and rat RNA extraction was carried out using TRIzol according to the instruction manual. Two micrograms of total RNA from human and rat tissues was reverse transcribed using ThermoScript reverse transcriptase (Invitrogen). PCR primers (P3 and P4 for human and P9 and p10 for rat; Table 1) were designed so that the coamplified PCR products derived from either AQP4 or AQP4-Δ4 splice variant could be readily distinguishable on 2% agarose gel.
AQP4 and the spliced variant AQP4-Δ4 were analyzed by real-time quantitative RT-PCR using Power Syber Green and the StepOne Real-Time PCR Detection System (Applied Biosystems, Milan, Italy). Primers were designed using PrimerExpress software (Applied Biosystems). The primers used were P5 and P6 (Table 1) for both isoforms Ex 1/2 amplification and P7 and P8 (Table 1) for specific AQP4-Δ4 Ex 3/5 amplification. The standard curve approach was used to obtain absolute quantification of the AQP4 mRNA (AQP4 and AQP4-Δ4) copy numbers in real-time PCR. The standard curve for AQP4 mRNA quantification was obtained using the pTarget vector (circular or linear) containing human AQP4 or AQP4-Δ4 CDS. The standard template log(copy number) was calculated as reported in previously (Wong and Medrano, 2005), and the target copy number was calculated using the same standard curve. Within each experiment, PCRs were performed in duplicate. Each PCR was evaluated by melting-curve analysis.
Plasmids, cell cultures, and transfection
Human AQP4 and AQP4-Δ4 CDS were cloned into the pTarget Mammalian Expression Vector system (Promega, Milan, Italy) and into pcDNA 6.2/C-EmGFP (Invitrogen). The Golgi-resident enzyme β-1,4-galactosyltransferase 1 (td-tomato-Golgi) and the ER chaperone protein calreticulin (FRP-ER) were also used for colocalization experiments.
Rat cortical astrocyte primary cultures were prepared as previously described (Nicchia et al., 2005).
HeLa, rat astrocyte, and TNC-1 (Mola et al., 2009) cell lines were maintained in Dulbecco's high-glucose medium (Invitrogen) supplemented with 10% fetal bovine serum (Invitrogen) and penicillin/streptomycin (Invitrogen). Six hours before transfection, the cells were plated at 60–70% of confluence using antibiotic-free medium. Cells were transfected with Optifect (Invitrogen) according to the manufacturer's protocol and analyzed after 30–48 h.
Cycloheximide and MG-132 cell treatment
For CHX treatment, 48 h posttransfection, HeLa cells were treated with 30 μM CHX (Sigma-Aldrich, Milan, Italy) or dimethyl sulfoxide (DMSO) and harvested after various time points.
For proteasome inhibition experiments, 24 h posttransfection, HeLa cells were treated with 15 μM MG-132 (Sigma-Aldrich) or DMSO for 7 h and then harvested for protein extraction.
Blue native-PAGE
Blue native SDS–PAGE was performed as previously reported (Rossi et al., 2010). A confluent layer of transfected HeLa cells and rat astrocytes was scraped and lysed into 7–10 volumes of BN buffer (1% Triton X-100, 12 mM NaCl, 500 mM 6-aminohexanoic acid, 20 mM Bis-Tris, pH 7.0; 2 mM EDTA; 10% glycerol), plus Protease Inhibitor Cocktail (Roche Diagnostic, Monza, Italy) on ice, vortexed every 10 min for 1 h, and centrifuged at 22,000 × g for 30 min at 4°C. Supernatants were collected and the total protein content calculated using the Bradford assay (Bio-Rad, Milan, Italy).
Twenty micrograms of protein sample was mixed with 5% CBB G-250 (Coomassie blue G-250) and loaded in polyacrylamide native gradient gels (4–9%). Twenty micrograms of ferritin was used as molecular weight standard (440 and 880 kDa). The running buffers were the anode buffer (25 mM imidazole, pH 7) and blue cathode buffer (50 mM tricine; 7.5 mM imidazole; 0.02% Coomassie blue G-250; pH 7). Electrophoresis was stopped when the tracking line of CCB G-250 dye had left the edge of the gel. Proteins were blotted onto polyvinylidene difluoride (PVDF) membranes (Millipore, Milan, Italy) for immunoblot analysis.
Protein sample preparation and Western blotting
Several 10-μm-thick cryosections of human and rat tissues were dissolved in seven volumes of RIPA lysis buffer (10 mM Tris-HCl, pH 7.4, 140 mM NaCl, 1% Triton X-100, 1% Na deoxycholate, 0.1% SDS, 1× Protease Inhibitor Cocktail, 1 mM Na3VO4, 1 mM NaF, and 1 mM EDTA).
Transfected HeLa cells and rat astrocytes were washed once in ice-cold phosphate-buffered saline (PBS) and dissolved in RIPA buffer as described.
Cells and tissues lysates were then sonicated for 10 s on ice, and after a 30-min incubation on ice, the samples were centrifuged at 22,000 × g for 30 min at 4°C. Supernatants were collected, and protein concentration was determined using the Bradford assay (Bio-Rad).
Membrane proteins were dissolved in Laemmli Sample Buffer (Bio-Rad) and 50 mM dithiothreitol, heated to 37°C for 10 min, resolved on a 13% polyacrylamide gel, and transferred onto nitrocellulose membranes (Immobilon PVDF; Millipore). After transfer, the membranes were blocked and incubated with antibodies. Reactive proteins were revealed with an enhanced chemiluminescent detection system (ECL-Plus; Pierce Euroclone, Milan, Italy) and visualized on a VersaDoc imaging system (Bio-Rad). Images were analyzed using ImageJ software (National Institutes of Health, Bethesda, MD). For relative quantification, the optical density value was determined for equal-sized boxes drawn around antibody-stained bands, with background values taken below each band of interest to account for nonspecific antibody staining in the lane.
Coimmunoprecipitation
Protein lysates prepared as described previously were incubated overnight at 4°C on a mechanical rotator with 2 μl of anti-GFP antibody (Santa Cruz Biotechnology, DBA, Milan, Italy). The next day, 50 μl of prewashed agarose beads (rProteinG Agarose; Invitrogen) was added and incubated for 1 h at 4°C. Negative controls were set up by omitting the protein lysate or antibodies.
To precipitate the immunocomplexes, the samples were centrifuged at 22,000 × g at 4°C for 5 min and washed five times with washing buffer (0.2% Triton X-100; 10 mM Tris-HCl, pH 7.4; 150 mM NaCl, 1 mM EDTA, 1 mM ethylene glycol tetraacetic acid [EGTA]) plus Protease Inhibitor Cocktail. Proteins were eluted from the agarose beads by adding 50 μl of 2× Laemmli Sample Buffer and incubating at 60°C for 10 min. The eluted proteins were subjected to SDS–PAGE as described.
Pulse chase
Twelve hours after transfection, HeLa cells were starved for 30 min in cysteine/methionine-free DMEM and then pulse labeled for 30 min with 400 μCi/ml [35S]methionine and [35S]cysteine (EasyTag EXPRESS35S protein labeling mix; Perkin Elmer, Milan, Italy) at 37°C.
After labeling, the cells were washed once with DMEM supplemented with 10% fetal bovine serum and 10-fold excess of cold methionine and cysteine and then chased for 1–4 h in the same medium.
At different chase times (0–4 h), cells were lysed 30 min on ice in 1% Triton X-100, 10 mM Tris-HCl, pH 7.4, 150 mM NaCl, 1 mM EDTA, and 1 mM EGTA plus Protease Inhibitor Cocktail. Lysates were centrifuged at 22,000 × g for 20 min, and supernatants were incubated overnight at 4°C on a mechanical rotator with 2 μl of anti-AQP4 antibody (Santa Cruz Biotechnology).
Immunocomplexes were precipitated as described, and the eluted proteins were subjected to SDS–PAGE. Gels were dried and exposed to a phosphorimager screen, and the signal was visualized with the Storm PhosphorImager system (Molecular Dynamics, Milan, Italy). Densitometric analysis of protein bands was carried out using ImageJ and plotted against the time of treatment. Bands present in the chase samples were expressed as percentage of the signal present in the pulse lane.
For proteasome inhibition experiments, 30 μM MG132 was added 3 h before the starvation period and included throughout the labeling and chase.
Immunofluorescence
Rat astrocytes and HeLa cells plated on coverslips were fixed in 4% paraformaldehyde, washed in PBS, and permeabilized with 0.3% Triton X-100 in PBS. After blocking with 0.1% gelatin in PBS, cells were incubated with primary antibodies for 1 h at room temperature. After washing in PBS, cells were incubated for 30 min with Alexa-conjugated secondary antibodies. Coverslips were mounted on slides with mounting medium and examined by using a Nikon Eclipse TE2000-E microscope equipped for epifluorescence and Plan Apo λ 10× objectives (Nikon, Milan, Italy). Digital images were obtained with a C4742-95 digital camera (Hamamatsu, Milan, Italy) and NIS-elements, version 3.30, software (Nikon). Once captured, the auto contrast function was applied to the whole images using Photoshop CS5 (Adobe, Italy).
Cells transfected with fluorescent protein expression vectors were fixed in 4% paraformaldehyde, washed in PBS, and examined by confocal microscopy (TCS SP3; Leica, Milan, Italy).
Antibodies
Anti-AQP4 was from Santa Cruz Biotechnology (goat polyclonal immunoglobulin G) and diluted to 1:400 for immunofluorescence and 1:500 for immunoblot analysis. Rabbit anti-actin and anti-GFAP (Sigma) were used for immunoblots at 1:500. Anti-GFP for immunoprecipitation was from Santa Cruz Biotechnology. The secondary antibodies used for Western blot included peroxidase-conjugated, donkey anti-goat and goat anti-rabbit (Santa Cruz Biotechnology) at a dilution of 1:7500. The secondary antibody used for immunofluorescence was Alexa 594–conjugated donkey anti-goat (Molecular Probes, Milan, Italy) at a dilution of 1:1000.
Water transport measurements
Functional studies were performed on TNC1-AQP4, an astrocyte immortalized cell line stably transfected with AQP4 (Mola et al., 2009). TNC1-AQP4 cells were transiently transfected with the plasmid encoding AQP4-Δ4 and TNC1-AQP4-Δ4 stably expressing cells. The 80–90% confluent cells grown on 20-mm-diameter round coverslips were incubated at 37°C for 45 min with 10 μM membrane permeable calcein-AM (Molecular Probes), which is trapped intracellularly after cleavage by esterases. As previously described (Mola et al., 2009), the calcein fluorescence signal was dependent on perfusate osmolarity (quenching method). The signal decreases upon perfusion with hypertonic solution as a consequence of water efflux and cell shrinkage. The fluorescence signal increases with a hypotonic solution due to cell swelling.
After being rinsed in PBS (pH 7.4), the cover glasses were mounted in a custom perfusion chamber designed for rapid solution exchange without causing cell detachment. Solution exchange time was <200 ms at 40 ml/min perfusion rate. For osmotic water permeability measurements, solutions were exchanged between PBS and hypertonic saline (with added 150 mM d-mannitol). Solution osmolalities were measured using a freezing point–depression osmometer. Calcein fluorescence was measured continuously using an epifluorescence microscope (TE 2000S; Nikon Instruments) equipped with a charge-coupled device camera (MicroMax 512BFT; Princeton Instruments, Trenton, NJ) using a DeltaRAM high-speed multiwavelength illuminator (Photon Technology International, Birmingham, NJ). Excitation was at 490 nm, and the emission was detected at 520 nm. Data were recorded and processed using MetaMorph/MetaFluor software (Universal Imaging Corp., Crisel Instuments, Rome, Italy).
The time constant of cell shrinkage due to the hypertonic stimulus was obtained by fitting the data with an exponential function.
Rat skeletal muscle isolation and sample preparation
Two-month-old male Wistar rats (weight 125–150 g) were used in the experiments. Selected muscles from the hind limbs were dissected from rats killed by decapitation, and for each specific muscle, one was used for the protein analysis and the contralateral one for mRNA analysis. Western blot and RT-PCR were performed as described (Basco et al., 2013).
Statistical analysis
All data are reported as mean ± SEM. We used the Student's t test for unpaired data and analysis of variance for multiple statistical comparisons between groups. Differences were considered significant only for p < 0.05. The experiments were repeated three or four times as indicated in the figure legends.
Animal care
All experiments conformed to international guidelines on the ethical use of animals and were designed to minimize the number of animals used and their suffering. Experiments in this study were approved by the Italian Health Department (Art. 9 del Decreto Legislativo 116/92).
Supplementary Material
Acknowledgments
Funding was provided by the Association Française Contre les Myopathies (Project 14336) and Ministry of Education, Universities and Research Grant PON01_01297 (Virtualab) to A.F. and “Futuro in Ricerca” RBFR10PJJX_001 to G.P.N. We acknowledge the conscientious effort of Gaetano de Vito in maintaining healthy rodent colonies during all the phases of the experiments. We are also grateful to Stefania Rosito for technical assistance.
Abbreviations used:
- AQP4
aquaporin-4
- CDS
coding sequence
- CHX
cycloheximide
- EDL
extensor digitorum longus
- ER
endoplasmic reticulum
- FDB
flexor digitorum brevis
- GFP
green fluorescent protein
- OAPs
orthogonal arrays of particles
- qPCR
quantitative PCR
- RT-PCR
real time PCR
Footnotes
This article was published online ahead of print in MBoC in Press (http://www.molbiolcell.org/cgi/doi/10.1091/mbc.E13-06-0331) on December 19, 2013.
*These authors contributed equally to the study.
M.D., F.P., and A.F. conceived and designed the experiments. M.D., F.P., D.B., F.C., G.P.N., and M.G.M. performed the experiments. M.S., M.S., G.P.N., and A.F. analyzed the data. F.C., M.S., and A.F. contributed reagents/materials/analysis tools. M.D., M.S., G.P.N., and A.F. wrote the article.
The authors declare that they have no conflict of interest.
REFERENCES
- Assentoft M, Kaptan S, Fenton RA, Hua SZ, de Groot BL, Macaulay N. Phosphorylation of rat aquaporin-4 at Ser(111) is not required for channel gating. Glia. 2013;61:1101–1112. doi: 10.1002/glia.22498. [DOI] [PubMed] [Google Scholar]
- Basco D, Blaauw B, Pisani F, Sparaneo A, Nicchia GP, Mola MG, Reggiani C, Svelto M, Frigeri A. AQP4-dependent water transport plays a functional role in exercise-induced skeletal muscle adaptations. PLoS One. 2013;8:e58712. doi: 10.1371/journal.pone.0058712. [DOI] [PMC free article] [PubMed] [Google Scholar]
- Frigeri A, Gropper MA, Umenishi F, Kawashima M, Brown D, Verkman AS. Localization of MIWC and GLIP water channel homologs in neuromuscular, epithelial and glandular tissues. J Cell Sci. 1995;108:2993–3002. doi: 10.1242/jcs.108.9.2993. [DOI] [PubMed] [Google Scholar]
- Frigeri A, Nicchia GP, Nico B, Quondamatteo F, Herken R, Roncali L, Svelto M. Aquaporin-4 deficiency in skeletal muscle and brain of dystrophic mdx mice. FASEB J. 2001;15:90–98. doi: 10.1096/fj.00-0260com. [DOI] [PubMed] [Google Scholar]
- Frigeri A, Nicchia GP, Verbavatz JM, Valenti G, Svelto M. Expression of aquaporin-4 in fast-twitch fibers of mammalian skeletal muscle. J Clin Invest. 1998;102:695–703. doi: 10.1172/JCI2545. [DOI] [PMC free article] [PubMed] [Google Scholar]
- Frydenlund DS, et al. Temporary loss of perivascular aquaporin-4 in neocortex after transient middle cerebral artery occlusion in mice. Proc Natl Acad Sci USA. 2006;103:13532–13536. doi: 10.1073/pnas.0605796103. [DOI] [PMC free article] [PubMed] [Google Scholar]
- Guan XG, Su WH, Yi F, Zhang D, Hao F, Zhang HG, Liu YJ, Feng XC, Ma TH. NPA motifs play a key role in plasma membrane targeting of aquaporin-4. IUBMB Life. 2010;62:222–226. doi: 10.1002/iub.311. [DOI] [PubMed] [Google Scholar]
- Gunnarson E, Zelenina M, Axehult G, Song Y, Bondar A, Krieger P, Brismar H, Zelenin S, Aperia A. Identification of a molecular target for glutamate regulation of astrocyte water permeability. Glia. 2008;56:587–596. doi: 10.1002/glia.20627. [DOI] [PubMed] [Google Scholar]
- Han Z, Wax MB, Patil RV. Regulation of aquaporin-4 water channels by phorbol ester-dependent protein phosphorylation. J Biol Chem. 1998;273:6001–6004. doi: 10.1074/jbc.273.11.6001. [DOI] [PubMed] [Google Scholar]
- Jung JS, Bhat RV, Preston GM, Guggino WB, Baraban JM, Agre P. Molecular characterization of an aquaporin cDNA from brain: candidate osmoreceptor and regulator of water balance. Proc Natl Acad Sci USA. 1994;91:13052–13056. doi: 10.1073/pnas.91.26.13052. [DOI] [PMC free article] [PubMed] [Google Scholar]
- Kalsotra A, Cooper TA. Functional consequences of developmentally regulated alternative splicing. Nat Rev Genet. 2011;12:715–729. doi: 10.1038/nrg3052. [DOI] [PMC free article] [PubMed] [Google Scholar]
- Karpa KD, Lin R, Kabbani N, Levenson R. The dopamine D3 receptor interacts with itself and the truncated D3 splice variant d3nf: D3-D3nf interaction causes mislocalization of D3 receptors. Mol Pharmacol. 2000;58:677–683. doi: 10.1124/mol.58.4.677. [DOI] [PubMed] [Google Scholar]
- Kim E, Goren A, Ast G. Alternative splicing: current perspectives. Bioessays. 2008;30:38–47. doi: 10.1002/bies.20692. [DOI] [PubMed] [Google Scholar]
- Lin JC, Tarn WY. RBM4 down-regulates PTB and antagonizes its activity in muscle cell-specific alternative splicing. J Cell Biol. 2011;193:509–520. doi: 10.1083/jcb.201007131. [DOI] [PMC free article] [PubMed] [Google Scholar]
- McCoy ES, Haas BR, Sontheimer H. Water permeability through aquaporin-4 is regulated by protein kinase C and becomes rate-limiting for glioma invasion. Neuroscience. 2010;168:971–981. doi: 10.1016/j.neuroscience.2009.09.020. [DOI] [PMC free article] [PubMed] [Google Scholar]
- Moe SE, Sorbo JG, Sogaard R, Zeuthen T, Petter Ottersen O, Holen T. New isoforms of rat aquaporin-4. Genomics. 2008;91:367–377. doi: 10.1016/j.ygeno.2007.12.003. [DOI] [PubMed] [Google Scholar]
- Mola MG, Nicchia GP, Svelto M, Spray DC, Frigeri A. Automated cell-based assay for screening of aquaporin inhibitors. Anal Chem. 2009;81:8219–8229. doi: 10.1021/ac901526k. [DOI] [PMC free article] [PubMed] [Google Scholar]
- Nicchia GP, Mastrototaro M, Rossi A, Pisani F, Tortorella C, Ruggieri M, Lia A, Trojano M, Frigeri A, Svelto M. Aquaporin-4 orthogonal arrays of particles are the target for neuromyelitis optica autoantibodies. Glia. 2009;57:1363–1373. doi: 10.1002/glia.20855. [DOI] [PubMed] [Google Scholar]
- Nicchia GP, Rossi A, Mola MG, Pisani F, Stigliano C, Basco D, Mastrototaro M, Svelto M, Frigeri A. Higher order structure of aquaporin-4. Neuroscience. 2010;168:903–914. doi: 10.1016/j.neuroscience.2010.02.008. [DOI] [PubMed] [Google Scholar]
- Nicchia GP, Rossi A, Mola MG, Procino G, Frigeri A, Svelto M. Actin cytoskeleton remodeling governs aquaporin-4 localization in astrocytes. Glia. 2008;56:1755–1766. doi: 10.1002/glia.20724. [DOI] [PubMed] [Google Scholar]
- Nicchia GP, Srinivas M, Li W, Brosnan CF, Frigeri A, Spray DC. New possible roles for aquaporin-4 in astrocytes: cell cytoskeleton and functional relationship with connexin43. FASEB J. 2005;19:1674–1676. doi: 10.1096/fj.04-3281fje. [DOI] [PubMed] [Google Scholar]
- Nozaki K, Ishii D, Ishibashi K. Intracellular aquaporins: clues for intracellular water transport. Pflugers Arch. 2008;456:701–707. doi: 10.1007/s00424-007-0373-5. [DOI] [PubMed] [Google Scholar]
- Pisani F, Rossi A, Nicchia GP, Svelto M, Frigeri A. Translational regulation mechanisms of aquaporin-4 supramolecular organization in astrocytes. Glia. 2011;59:1923–1932. doi: 10.1002/glia.21234. [DOI] [PubMed] [Google Scholar]
- Potokar M, Stenovec M, Jorgacevski J, Holen T, Kreft M, Ottersen OP, Zorec R. Regulation of AQP4 surface expression via vesicle mobility in astrocytes. Glia. 2013;61:917–928. doi: 10.1002/glia.22485. [DOI] [PubMed] [Google Scholar]
- Rojek A, Fuchtbauer EM, Fuchtbauer A, Jelen S, Malmendal A, Fenton RA, Nielsen S. Liver-specific aquaporin 11 knockout mice show rapid vacuolization of the rough endoplasmic reticulum in periportal hepatocytes after amino acid feeding. Am J Physiol Gastrointest Liver Physiol. 2013;304:G501–G515. doi: 10.1152/ajpgi.00208.2012. [DOI] [PubMed] [Google Scholar]
- Rossi A, Crane JM, Verkman AS. Aquaporin-4 Mz isoform: brain expression, supramolecular assembly and neuromyelitis optica antibody binding. Glia. 2012;59:1056–1063. doi: 10.1002/glia.21177. [DOI] [PMC free article] [PubMed] [Google Scholar]
- Rossi A, Pisani F, Nicchia GP, Svelto M, Frigeri A. Evidences for a leaky scanning mechanism for the synthesis of the shorter M23 protein isoform of aquaporin-4: implication in orthogonal array formation and neuromyelitis optica antibody interaction. J Biol Chem. 2010;285:4562–4569. doi: 10.1074/jbc.M109.069245. [DOI] [PMC free article] [PubMed] [Google Scholar]
- Sarmiento JM, Anazco CC, Campos DM, Prado GN, Navarro J, Gonzalez CB. Novel down-regulatory mechanism of the surface expression of the vasopressin V2 receptor by an alternative splice receptor variant. J Biol Chem. 2004;279:47017–47023. doi: 10.1074/jbc.M410011200. [DOI] [PubMed] [Google Scholar]
- Shyu AB, Wilkinson MF, van Hoof A. Messenger RNA regulation: to translate or to degrade. EMBO J. 2008;27:471–481. doi: 10.1038/sj.emboj.7601977. [DOI] [PMC free article] [PubMed] [Google Scholar]
- Wang ET, Sandberg R, Luo S, Khrebtukova I, Zhang L, Mayr C, Kingsmore SF, Schroth GP, Burge CB. Alternative isoform regulation in human tissue transcriptomes. Nature. 2008;456:470–476. doi: 10.1038/nature07509. [DOI] [PMC free article] [PubMed] [Google Scholar]
- Wong ML, Medrano JF. Real-time PCR for mRNA quantitation. Biotechniques. 2005;39:75–85. doi: 10.2144/05391RV01. [DOI] [PubMed] [Google Scholar]
- Yang J, et al. Loss of astrocyte polarization in the tg-ArcSwe mouse model of Alzheimer's disease. J Alzheimers Dis. 2011;27:711–722. doi: 10.3233/JAD-2011-110725. [DOI] [PubMed] [Google Scholar]
- Yasui M, Kwon TH, Knepper MA, Nielsen S, Agre P. Aquaporin-6: an intracellular vesicle water channel protein in renal epithelia. Proc Natl Acad Sci USA. 1999;96:5808–5813. doi: 10.1073/pnas.96.10.5808. [DOI] [PMC free article] [PubMed] [Google Scholar]
- Zelenina M, Zelenin S, Bondar AA, Brismar H, Aperia A. Water permeability of aquaporin-4 is decreased by protein kinase C and dopamine. Am J Physiol Renal Physiol. 2002;283:F309–F318. doi: 10.1152/ajprenal.00260.2001. [DOI] [PubMed] [Google Scholar]
- Zmijewski MA, Slominski AT. CRF1 receptor splicing in epidermal keratinocytes: potential biological role and environmental regulations. J Cell Physiol. 2009;218:593–602. doi: 10.1002/jcp.21632. [DOI] [PMC free article] [PubMed] [Google Scholar]
Associated Data
This section collects any data citations, data availability statements, or supplementary materials included in this article.