

Abstract
We describe a novel method for the measurement of protein tyrosine phosphatase (PTP) activity in single human airway epithelial cells (hAECs) using capillary electrophoresis. This technique involved the microinjection of a fluorescent phosphopeptide that is hydrolyzed specifically by PTPs. Analyses in BEAS-2B immortalized bronchial epithelial cells showed rapid PTP-mediated dephosphorylation of the substrate (2.2 pmol min−1 mg−1) that was blocked by pretreatment of the cells with the PTP inhibitors pervanadate, Zn2+, and 1,2-naphthoquinone (76%, 69%, 100% inhibition relative to PTP activity in untreated controls, respectively). These studies were then extended to a more physiologically relevant model system: primary hAECs cultured from bronchial brushings of living human subjects. In primary hAECs, dephosphorylation of the substrate occurred at a rate of 2.2 pmol min−1 mg−1, and was also effectively inhibited by pre-incubation of the cells with the inhibitors pervanadate, Zn2+, and 1,2- naphthoquinone (91%, 88%, and 87% median PTP inhibition, respectively). Reporter proteolysis in single BEAS-2B cells occurred at a median rate of 43 fmol min−1 mg−1 resulting in a mean half-life of 20 min. The reporter displayed a similar median half-life of 28 min in these single primary cells. Finally, single viable epithelial cells (which were assayed for PTP activity immediately after collection by bronchial brushing of a human volunteer) showed dephosphorylation rates ranging from 0.34–36 pmol min−1 mg−1 (n = 6). These results demonstrate the utility and applicability of this technique for the ex vivo quantification of PTP activity in small, heterogeneous, human cells and tissues.
INTRODUCTION
Inhalation of fine and ultrafine particulate matter (PM) generated by the combustion of fossil fuels is linked to increased incidences of morbidity and mortality, including elevated blood pressure,1 decreased cardiac autonomic control,2 and significantly increased risk of myocardial infarction and stroke.3 In vitro studies have demonstrated that PM leads to increased inflammatory signaling in airway cells4–6 and suggest that inhibition of protein tyrosine phosphatases (PTPs) plays a prominent role in this process.7–8 Immortalized airway cell lines and conventionally cultured primary airway epithelia are valuable model systems for these studies, but fail to fully recapitulate the phenotype of cells in the intact airway.9 Analysis of primary airway epithelium specimens, obtained through bronchial biopsy from human subjects exposed to well-characterized PM provide a more physiologically relevant model for studies of PM inhalation and its effects on airway signaling. However, analysis of these ex vivo specimens is technically challenging due to the very small sample sizes (on average 105 total cells) and low cell viabilities of 11–33% that are typically recovered. In addition, samples obtained by biopsy are composed of a mixture of cell types with immune and squamous cells comprising 2–44% of the cells.10
Previous analyses of epithelial cells from bronchial brushing specimens have utilized a variety of analytical methods although most studies have employed genetic approaches due to the readily available amplification methods for nucleotide analyses. Fluorescence in situ hybridization (FISH)11 and polymerase chain reaction (PCR)12 have been used, respectively, to detect chromosomal abnormalities and viral DNA in bronchial brushings. RNA microarrays13 have been used to probe for transcriptional changes associated with airway disease. Immunohistochemistry (IHC) using anti-phosphotyrosine antibodies has been employed to assess the presence of phosphoproteins in these samples as an indirect measure of PTP activity.14 However, none of these approaches directly measures PTP activity in living cells.
Chemical cytometry is a well-established approach to characterize and quantify cellular components, including metabolites and signaling cascades in single cells.15–25 Among the many chemical cytometric approaches that have been described, the use of capillary electrophoresis with laser-induced fluorescence (CE-LIF) is well-suited for addressing the aforementioned challenges associated with bronchial brushings. Specifically, by offering limits of detection approaching 10–21 mol, CE-LIF is amenable to the analysis of size-limited samples, including single cells.26 This provides two additional advantages when dealing with heterogeneous samples. Because information about each cell is acquired independently, variation between similar cells as well as between subpopulations is preserved rather than lost during population averaging.24 Additionally, individual cells of interest can be readily selected from a mixed population by vital staining to assess viability or extracellular markers. Finally, using the CELIF approach, enzyme activity can be measured directly without the need for genetic manipulation of the cells, and is thus applicable to both immortalized and primary cells.27 The advantages of chemical cytometry in single-cell analyses led to the recent development of a single-cell assay of PTP activity28 using a fluorescent phosphopeptide PTP substrate termed “pTS13” (Glu-Glu-Leu-Glu-Asp-Asp-pTyr-Glu-Asp-Asp-Nle-Glu-Glu-amide, where Nle is norleucine and pTyr is phosphotyrosine). Initial validation for this approach was performed in A431 epidermoid carcinoma cells, a well-established model system for the study of tyrosine phosphorylation dynamics.29
In the present study, we demonstrate the utility of a previously described fluorescent peptide reporter for the quantification of PTP activity in single hAECs, including cells in a specimen obtained by airway biopsy of a human volunteer. Single cells were microinjected with a fluorescent peptide substrate of PTPs and dephosphorylation rates were measured through resolution and quantification of phosphorylated and dephosphorylated reporter species by capillary electrophoresis. Intracellular proteolysis of the peptide was assessed in single BEAS- 2B cells using previously established capillary electrophoresis conditions capable of resolving the peptide from all fluorescent cleavage products. PTP activity was then quantified in single BEAS-2B cells, as well as the inhibition of PTP activity resulting from exposure to three environmental toxins. This approach was then extended to the analysis of single cultured primary hAECs, wherein reporter proteolysis, PTP activity, and PTP inhibition by toxins were quantified. Finally, single viable epithelial cells in a fresh bronchial brushing specimen were identified and PTP activity was assessed, demonstrating the direct applicability of this chemical cytometry method to the analysis of fresh ex vivo airway samples.
EXPERIMENTAL SECTION
Materials
BEAS-2B cells were obtained from ATCC. Keritinocyte Basal Medium (KBM-Gold), Bronchial Epithelial Basal Medium (BEGM), and Singlequots™ growth factors, cytokines, and supplements were from Lonza. Sylgard 184 polydimethylsiloxane (PDMS) was purchased from Dow Corning, antibodies from Biolegend, and fluorescence microscopy filter sets from Chroma. All other chemicals were purchased from either Sigma or Fisher.
Cell culture
BEAS-2B cells were grown in Keritinocyte Growth Medium (KGM) prepared from KBM-Gold and a KGM-Gold Singlequots™ kit. Primary hAECs were grown in Bronchial Epithelial Growth Medium (BEGM) prepared from BEBM and a BEGM Singlequots™ kit. BEAS-2B cultures were propagated in 25 cm2 tissue culture flasks and passaged when cells reached 60–80% confluency. Cells intended for single cell analysis were grown on cell chambers comprising a silicone O-ring attached to a round no. 1 glass coverslip (25 mm diameter) with PDMS. Cryopreserved primary hAECs (passage 3) were thawed and plated directly onto cell chambers. Cells from the ex vivo bronchial brushing specimen were grown in cell chambers in which a polystyrene coverslip replaced the glass coverslip.
Procurement of bronchial brushing specimen
Flexible bronchoscopy with brush cytology was performed on healthy volunteers, as previously described,30 under a protocol approved by the Committee on the Protection of the Rights of Human Subjects at the University of North Carolina at Chapel Hill. Briefly, the nares and nasopharynx of the volunteer are anesthetized using lidocaine, then a flexible bronchoscope is inserted transnasally and advanced to the larynx, where further lidocaine is administered for laryngeal anesthesia. The bronchoscope is then further advanced to the main, lobar, or segmental bronchi, where tissue is visualized, anesthetized with lidocaine, and then removed by 5 or 6 passes of a 3 mm × 115 cm cytology brush (Bronchoscope Cytology Brush; Bard, Tewksbury, MA) along the endobronchial surface. The bronchoscope is removed from the airways and the cytology brush is rinsed with BEGM to suspend bronchial tissue.
Immunofluorescence
Cells in a chamber were rinsed with 37 °C extracellular buffer (ECB; 10 mM HEPES, 135 mM NaCl, 5 mM KCl, 1 mM CaCl2, 1 mM MgCl2, pH 7.4) to remove media. Excess ECB was aspirated and antibody solution (Alexafluor 647 anti-human C326 (EpCAM) diluted 1:40 in ECB) was added to the chamber and incubated for 15 min at 37 °C. Unbound antibody was then removed by rinsing the chamber with ECB. Propidium iodide solution (5 μg/mL in ECB) was then added to the chamber and cells were incubated for 5 min. Excess propidium iodide was removed by rinsing with ECB and cells were imaged at 25X magnification. Fluorescence images were obtained with xenon arc lamp illumination for detection of Alexafluor 647 (peak ex: 620 nm, em: 700 nm) and propidium iodide (ex: 540 nm, em: 605 nm). Digital images were acquired and processed using Micro-Manager and ImageJ software.
Single cell capillary electrophoresis
Single cells grown in chambers were microinjected with TS13 or pTS13 using a Transjector 5246 microinjection system (Eppendorf AG, Hamburg, Germany). Cells were kept at 37 °C under a flow of warm ECB until the desired time point was reached, whereupon the cell of interest was lysed with an Nd:YAG pulsed laser (532 nm). Cell contents were aspirated into the capillary by electrokinetic injection (5 s at 79 V/cm) and CE-LIF was performed at 263 V/cm on a customized system. CE separations were performed in 140 mM borate, 150 mM sodium dodecyl sulfate (SDS), 50 mM NaCl, pH 7.4. Fluorescence and current data were collected using Labview (National Instruments, Austin, TX) and analyzed with Matlab (The Mathworks, Natick, MA) and Origin (OriginLab, Northampton, MA) software.
Reporter lifetime measurement in single cells
BEAS-2B cells or cultured primary hAECs were microinjected with TS13 and analyzed by CE-LIF after 1.5–12 min. The amount of intact TS13 remaining was calculated as the corrected area of the TS13 peak divided by the sum of the corrected areas for all peaks. Data was analyzed using Excel (Microsoft) and Origin (Microcal).
Single cell phosphatase activity assay
BEAS-2B, cultured primary hAEC, and fresh primary human airway cells were microinjected with pTS13 and analyzed by CE-LIF after 60 s. For heterogeneous airway samples, epithelial cells were identified by anti-EpCAM vital staining prior to microinjection and viable cells by propidium iodide staining. Dephosphorylation was assessed by dividing the corrected area of the pTS13 peak by the combined corrected areas of pTS13 and TS13 peaks. Quantification of TS13 and pTS13 was by comparing the corrected peak areas to that of standards of known concentration.
Statistical analysis
Comparisons of PTP inhibition between treated and untreated cells and across similarly treated cell lines was performed by bootstrapping.31 For each pair of quantities to be compared, 10,000 bootstrap samples of each quantity were generated. The distribution of the difference between the means (or variances) of the two groups was estimated by taking the pairwise differences of each pair of bootstrap replicates. One-sided p-values for testing the null hypothesis of no mean (or variance) difference between the two groups was estimated by counting the number of bootstrap replicates that had a mean (or variance) difference of less than 0 divided by the number of bootstrap replicates (i.e. 10,000). The bootstrap calculations were performed using R version 2.15.0.
RESULTS AND DISCUSSION
Lifetime of the PTP reporter in single BEAS-2B cells
BEAS-2B cells are immortalized, non-tumorigenic human bronchial epithelial cells commonly used in airway research owing to their ability to recapitulate many of the features of normal primary airway cells including antioxidative capacity, inflammatory response, and matrix attachment.32–34 In order to accurately measure PTP activity in cells, the reporter substrate must be resistant to intracellular degradation by proteolytic or other metabolic activity. To assess reporter susceptibility to intracellular degradation in BEAS-2B cells, single cells were microinjected with non-phosphorylated pTS13, termed “TS13”, and analyzed by CE-LIF. The median amount of TS13 introduced into a single cell was 0.69 amol (1 μM for a cell volume of 500 fL) with first and third quartiles (Q1 and Q3) of 0.21 and 0.83 amol (0.42 and 2.0 μM). The electrophoretic traces possessed a peak co-migrating with TS13 and a peak co-migrating with the 8-residue fragment (6FAM-Glu-Glu-Leu-Glu-Asp-Asp-Tyr-Glu-COOH) of TS13. This peak is likely to be a degradation product of TS13, and was previously observed in A431 lysates and single cells (Figure S1 A-C).28 Average migration times for the TS13 and the 8-residue fragment were 1220 ± 160 s and 1520 ± 260 s with efficiencies of 5.7 ± 1.1 × 10⁴ and 6.6 ± 4.5 × 10⁴ theoretical plates, respectively. The separation resolution the peptides was 13 ± 4.9. The area of the fragment peak, relative to the combined peak areas for the fragment and TS13, was linearly correlated with incubation time (R2 = 0.76) (figure 1A) and the degradation rate of TS13 was linearly correlated with the amount of TS13 injected (R2 = 0.92) (figure 1B), suggesting first-order reaction kinetics. Assuming an average protein concentration in the cell of 1 g/mL, the median rate of degradation was 43 fmol min−1 mg−1 (Q1 and Q3 of 15 and 82 fmol min−1 mg−1, equating to a median half-life of 20 min (Q1 and Q3 of 15 and 89 min). This is comparable to the 39 fmol min−1 mg−1 median rate previously measured in single A431 cells.28 Reporter degradation in BEAS-2B cells results in 2–3% breakdown within the 60 s timespan of dephosphorylation experiments. Therefore, reporter optimization to enhance proteolytic stability was deemed unnecessary.
Figure 1.
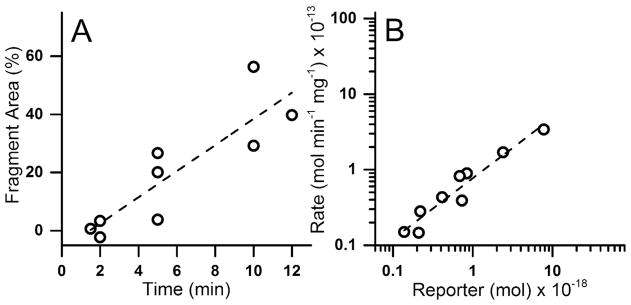
Fragmentation of TS13 in single BEAS-2B cells. Each symbol represents the measurement from a single cell. A) The percentage of the peak area of the fluorescent 8-residue fragment with respect to the total peptide loaded into the cells was plotted over time. B) Rate of conversion of TS13 to the 8-residue fragment was plotted against the total amount of TS13 loaded into a cell. Dashed lines indicate linear regression with R2 = 0.76 (A) and 0.92 (B).
Measurement of PTP activity in single BEAS-2B cells
To determine the utility of pTS13 for measuring PTP activity in single human airway epithelial cells, BEAS-2B cells were microinjected with pTS13 and their contents analyzed by CE-LIF (figure 2). The median amount of reporter introduced into a cell was 1.1 amol (Q1 = 0.66 amol, Q3 = 3.0 amol). Rapid PTP-dependent substrate dephosphorylation was observed, with 90% (n = 10) of the cells completely dephosphorylating the peptide within 60 s. While exact rates could not be calculated for cells without remaining phosphorylated peptide, the median dephosphorylation rate was greater than 2.2 pmol min−1 mg−1 (Q1 and Q3 of 1.1 and 6.0 pmol min−1 mg−1). The single BEAS- 2B cell that did not fully dephosphorylate the reporter contained 0.7 amol (1.4 μM) of reporter, within the interquartile range for the amount loaded, suggesting that incomplete reporter dephosphorylation was not due to excessive loading, but more likely reflects intercellular heterogeneity. Reporter breakdown was negligible over the 60 s time course of these experiments.
Figure 2.

PTP activity was assessed in single BEAS-2B cells in the absence of toxins (open circles) or after pretreatment with pervanadate (closed circles), Zn2+ (open triangles), or 1,2- naphthoquinone (closed triangles). Dashes indicate mean phosphorylation remaining after 60 s. Each symbol marks the measurement from a single cell and the y-axis reflects the percentage of pTS13 relative to total TS13 and pTS13.
Inhibition of PTP activity in single BEAS-2B cells
Treatment of cells with environmental toxins or other PTP inhibitors resulted in substantial inhibition of PTP activity in single BEAS-2B cells. Treatment with pervanadate (1 mM), Zn2+ (100 μM), and 1,2- naphthoquinone (150 μM) resulted in statistically significant PTP inhibition relative to untreated cells (p < 0.0001), with medians of 76% (Q1 = 62%, Q3 = 86%), 69% (Q1 = 58%, Q3 = 73%), and 100% (Q1 = 95%, Q3 = 100%), respectively, of the reporter remaining phosphorylated after 60 s. As compared to A431 cells,28 pervanadate treatment of BEAS-2B cells resulted in greater PTP inhibition (p = 0.050) and intercellular heterogeneity of response, represented by the standard deviation of each sample (28.6% vs 9.3% for A431 and BEAS-2B respectively), was less pronounced (p = 0.035). Comparisons between BEAS-2B and A431 cells treated with Zn2+ suggest greater susceptibility to PTP inhibition in BEAS-2B cells, but the difference was not statistically significant (p = 0.096). These data suggest that the PTPs are more susceptible to toxin inhibition in BEAS-2B cells than in A431 cells, and that the clonal heterogeneity is less pronounced. These conclusions are consistent with the relatively normal biochemical phenotype exhibited by BEAS-2B (discussed above) as well as established links between tumorigenic cell lines and increased heterogeneity.35
Lifetime of the PTP reporter in single primary hAECs
To determine whether the PTP reporter was resistant to degradation in primary cells, the lifetime of the PTP reporter was evaluated in single primary airway epithelial cells by microinjection of TS13 and analysis by CE-LIF. In addition to TS13, a second peak was observed with the same migration time as the 8-residue fragment peak seen in BEAS-2B cells (Figure S1 D). The area of this fragment peak relative to the combined area of all peaks was linearly correlated with incubation time (R2 = 0.83) (figure 3A). The median amount of reporter injected into cells was 11 amol (22 μM) with Q1 and Q3 of 1.0 and 15 amol (2.0 and 30 μM), and a strong linear correlation was observed between the degradation rate and amount of TS13 loaded into a cell (R2 = 0.96) (figure 3B), again suggesting first-order degradation kinetics. The median degradation rate was 550 fmol min−1 mg−1 (Q1 and Q3 of 100 and 1700 fmol min−1 mg−1), equating to a median half-life of 28 min (Q1 and Q3 of 17 and 44 min) in cells. While the measured degradation rate in primary cells was an order of magnitude greater than seen in BEAS-2B cells, the average amount of peptide measured per cell was proportionately larger as well. The mechanism underlying this disparity is unknown, but is likely due to differences in microinjection efficiency (i.e. differential delivery of reporter). No difference was found between reporter half-life in primary hAECs and BEAS-2B (p = 0.28), suggesting that the apparent rate disparity is a consequence of substrate concentration rather than innate differences in degradative capacity. The similarity in reporter half-life and degradation pattern is consistent with the biochemical similarities, including antioxidative capacity, inflammatory response, and matrix attachment,32–34 between BEAS-2B and primary airway cells.
Figure 3.
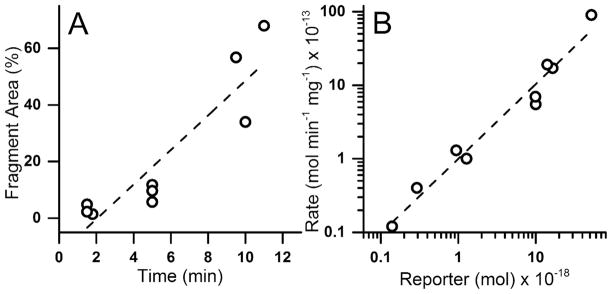
Fragmentation of TS13 in single primary hAECs. Each symbol represents the measurement from a single cell. A) The percentage of the peak area of the fluorescent 8-residue fragment with respect to the total peptide loaded into the cells was plotted over time. B) Rate of conversion of TS13 to the 8-residue fragment was plotted against the total amount of TS13 loaded into a cell. Dashed lines indicate linear regression with R2 = 0.83 (A) and 0.96 (B).
Measurement of PTP activity in single primary hAECs. Introduction of pTS13 into living cells by microinjection allows direct analysis of primary cells without genetic manipulation (e.g. expression of a biosensor). To demonstrate the value of this technique for measuring PTP activity in primary hAECs, pTS13 was microinjected into single cultured primary hAECs and dephosphorylation was measured by CE-LIF (figure 4). Exact dephosphorylation rates for 7 of 12 primary hAECs could not be calculated due to complete dephosphorylation of pTS13 within the 60 s incubation time, but the median dephosphorylation rate of the remaining cells was greater than 2.2 pmol min−1 mg−1 (Q1 and Q3 of 0.20 and 18 pmol min−1 mg−1). Plots of dephosphorylation rate vs. total amount of reporter demonstrated that PTP activity was not saturated across the mass range of reporter delivered (0.1–100 amol), and that dephosphorylation rate was linearly correlated to amount of reporter (R2 = 0.99) (figure 5E).
Figure 4.

PTP activity was assessed in single primary hAECs in the absence of toxins (open circles) or after pretreatment with pervanadate (closed circles), Zn2+ (open triangles), or 1,2- naphthoquinone (closed triangles). Dashes indicate the mean phosphorylation remaining after 60 s. Each symbol marks the measurement from a single cell and the y-axis reflects the percentage of pTS13 relative to total TS13 and pTS13.
Figure 5.

Viable epithelial cells from a bronchial brushing specimen were identified, microinjected with pTS13, and analyzed by CE-LIF. After immunofluorescent staining, cells of interest were visualized using bright field (A) as well as fluorescence microscopy for the presence of propidium iodide (B) and Alexafluor 647 anti-EpCAM (C) to assess viability and identify epithelial cells. Cells were then microinjected with a 6-FAM/pTS13 mixture and analyzed by CE-LIF after 120 s, with a representative electrophoretic trace shown in (D) [labeled peaks represent 6-FAM (“F”), TS13 (“N”), and pTS13 (“P”)]. (E) Dephosphorylation rate was plotted against total amount of reporter to compare unpassaged bronchial brushing cells (open circles) and untreated primary hAECs (closed circles).
Inhibition of PTP activity in single primary hAECs
Treatment of cells with environmental toxins significantly inhibited PTP activity relative to untreated controls (p < 0.0001 for each treatment relative to control). The fraction of phosphopeptide remaining after 60 s in cells treated with pervanadate, Zn2+ or 1,2-NQ was a median of 91% (Q1 = 86%, Q3 = 98%), 88% (Q1 = 87%, Q3 = 91%), and 87% (Q1 = 75%, Q3 = 92%) , respectively . As compared to BEAS-2B cells, PTP activity in primary airway cells exhibited lower sensitivity to inhibition by naphthoquinone (p = 0.0027), but were more susceptible to inhibition by Zn2+ (p = 0.0039) and pervanadate (p = 0.0001). While the mechanistic basis for these differences is not well understood, they may reflect differential concentrations of intracellular antioxidants, metal binding and transport or xenobiotic metabolism in BEAS-2B cells and primary airway cells. Additionally, intercellular heterogeneity of response to treatment, measured as the standard deviation within a treatment group, was less pronounced in primary hAECs treated with pervanadate (p = 0.019 vs. BEAS-2B, p = 0.003 vs. A431) and Zn2+ (p = 0.0026 vs. BEAS-2B, p = 0.0161 vs. A431). In addition, there is precedence for a role of passage number as a determinant of intercellular heterogeneity in cultured cells.35–36
Analysis of bronchial brushing specimen
Bronchial biopsies obtained from human subjects are a source of primary airway cells that most closely approximate the tissue in vivo. However, analysis of these cells is challenging due to the small sample size, low viability, and contamination with extracellular materials. To demonstrate the applicability of pTS13 to the study of PTP activity in these ex vivo samples, single viable epithelial cells from bronchial brushings were identified by vital staining (figure 5A-C), microinjected with pTS13, and analyzed by CE-LIF (figure 5D). The amount of pTS13 injected ranged from 0.6–41 amol (1.2– 82 μM) and dephosphorylation rate was positively correlated with total amount of reporter injected (R2 = 0.89). Dephosphorylation rates ranged from 0.34–36 pmol min−1 mg−1. Plots of dephosphorylation rate versus total amount of reporter suggested that, for a given reporter concentration, dephosphorylation occured more slowly in ex vivo brushing cells than in untreated primary hAECs (figure 5E). One possible explanation for this result is that cells from ex vivo specimens were not passaged, while primary hAECs underwent three passages prior to analysis. It has recently been demonstrated that freshly isolated cells differ metabolically from cultured cells.37 Alternatively, this difference may reflect variation between the human subjects from which primary hAECs and brushings were obtained, however detailed information about inter-subject variability and individual subject characteristics was not available. Analysis of cells directly obtained from bronchial brushing of a human subject demonstrates the applicability of this technique to the measurement of PTP activity in ex vivo airway tissue samples.
CONCLUSION
A recently developed chemical cytometry reporter of PTP activity was demonstrated to be a valuable tool for the study of human airway cells. Immortalized bronchial epithelial cells, cultured primary airway epithelial cells, and unpassaged cells represented by an ex vivo human bronchial biopsy specimen were microinjected with a fluorescent phosphopeptide and dephosphorylation was quantified using CE-LIF. Inhibition of PTP activity was observed in immortalized and primary cells after treatment with several environmentally relevant inhibitors of PTP activity. Comparison of BEAS-2B and primary hAECs identified statistically significant differences in the response to these agents, with hAECs showing greater response to both pervanadate and Zn2+, while BEAS-2B cells were more potently inhibited by 1,2- naphthoquinone. In addition to information about the magnitude of PTP activity and inhibition, analysis of cells individually provided insight into the heterogeneity within populations of BEAS-2B cells and primary hAECs. Relative to BEAS-2B cells, the variability of response was smaller for primary hAECs treated with pervanadate. Achieving statistical significance for comparisons of variability between populations is typically challenging, especially with small samples sizes, further demonstrating the power of this technique. Finally, the pre-selection of viable epithelial cells for analysis was critical to the successful analysis of the heterogeneous, size-limited ex vivo specimen. While the sample size achieved in these experiments permit only limited biological insights, the methodology described demonstrates a novel approach to studying PTP signaling in cultured and ex vivo specimens.
The over one hundred enzymes that comprise the PTP superfamily play a pivotal role in cellular physiology by catalyzing the dephosphorylation of signaling intermediates. By functioning to oppose the activity of tyrosine kinases, the activity of PTPs maintains signaling quiescence in resting cells and restores basal homeostasis following activation induced by physiological stimuli such as growth factors and inflammatory mediators. Thus the capability that the method described in this study enables to measure PTP activity in ex vivo specimens will be a valuable tool for the study of conditions including cardiovascular and metabolic disease, immune dysfunction, and cancer. It is increasingly clear that that no single approach is sufficient to decode the complexity of cell signaling, and direct enzyme activity measurement may be used to develop functional biomarkers of disease and pharmacodynamic readouts of exposure to toxins and therapeutics alike.
Supplementary Material
Acknowledgments
RP wishes to thank Michelle Kovarik, Ph.D., Angela Proctor, Ph.D., and Pavak Shah for valuable discussion and technical assistance. This work was funded by the NIH (R01CA139599, T32GM008719, and 5F30ES019829).
Footnotes
Publisher's Disclaimer: Disclaimer: The research described in this article has been reviewed by the National Health and Environmental Effects Research Laboratory, U.S. EPA, and approved for publication. The contents of this article should not be construed to represent Agency policy nor does mention of trade names or commercial products constitute endorsement or recommendation for use.
References
- 1.Bartoli CR, Wellenius GA, Diaz EA, Lawrence J, Coull BA, Akiyama I, Lee LM, Okabe K, Verrier RL, Godleski JJ. Environ Health Perspect. 2008:117. doi: 10.1289/ehp.11573. [DOI] [PMC free article] [PubMed] [Google Scholar]
- 2.Liao D, Duan Y, Whitsel EA, Zheng ZJ, Heiss G, Chinchilli VM, Lin HM. Am J Epidemiol. 2004;159:768–777. doi: 10.1093/aje/kwh109. [DOI] [PubMed] [Google Scholar]
- 3.Miller KA, Siscovick DS, Sheppard L, Shepherd K, Sullivan JH, Anderson GL, Kaufman JD. N Engl J Med. 2007;356:447–458. doi: 10.1056/NEJMoa054409. [DOI] [PubMed] [Google Scholar]
- 4.Samet JM, Rappold A, Graff D, Cascio WE, Berntsen JH, Huang YC, Herbst M, Bassett M, Montilla T, Hazucha MJ, Bromberg PA, Devlin RB. Am J Respir Crit Care Med. 2009;179:1034–1042. doi: 10.1164/rccm.200807-1043OC. [DOI] [PubMed] [Google Scholar]
- 5.Pourazar J, Mudway IS, Samet JM, Helleday R, Blomberg A, Wilson SJ, Frew AJ, Kelly FJ, Sandstrom T. Am J Physiol Lung Cell Mol Physiol. 2005;289:L724–730. doi: 10.1152/ajplung.00055.2005. [DOI] [PubMed] [Google Scholar]
- 6.Wang T, Chiang ET, Moreno-Vinasco L, Lang GD, Pendyala S, Samet JM, Geyh AS, Breysse PN, Chillrud SN, Natarajan V, Garcia JG. Am J Respir Cell Mol Biol. 2009 doi: 10.1165/rcmb.2008-0402OC. [DOI] [PMC free article] [PubMed] [Google Scholar]
- 7.Lee SR, Kwon KS, Kim SR, Rhee SG. J Biol Chem. 1998;273:15366–15372. doi: 10.1074/jbc.273.25.15366. [DOI] [PubMed] [Google Scholar]
- 8.Tal TL, Bromberg PA, Kim Y, Samet JM. Toxicol Appl Pharmacol. 2008;233:382–388. doi: 10.1016/j.taap.2008.09.013. [DOI] [PMC free article] [PubMed] [Google Scholar]
- 9.Stewart CE, Torr EE, Mohd Jamili NH, Bosquillon C, Sayers I. J Allergy (Cairo) 2012;2012:943982. doi: 10.1155/2012/943982. [DOI] [PMC free article] [PubMed] [Google Scholar]
- 10.Romagnoli M, Vachier I, Vignola AM, Godard P, Bousquet J, Chanez P. Respir Med. 1999;93:461–466. doi: 10.1016/s0954-6111(99)90088-4. [DOI] [PubMed] [Google Scholar]
- 11.Yendamuri S, Vaporciyan AA, Zaidi T, Feng L, Fernandez R, Bekele NB, Hofstetter WL, Jiang F, Mehran RJ, Rice DC, Spitz MR, Swisher SG, Walsh GL, Roth JA, Katz RL. J Thorac Oncol. 2008;3:979–984. doi: 10.1097/JTO.0b013e3181834f3a. [DOI] [PMC free article] [PubMed] [Google Scholar]
- 12.Bewig B, Haacke TC, Tiroke A, Bastian A, Bottcher H, Hirt SW, Rautenberg P, Haverich A. Respiration. 2000;67:166–172. doi: 10.1159/000029481. [DOI] [PubMed] [Google Scholar]
- 13.Yang IV, Tomfohr J, Singh J, Foss CM, Marshall HE, Que LG, McElvania-Tekippe E, Florence S, Sundy JS, Schwartz DA. Am J Respir Crit Care Med. 2012;185:620–627. doi: 10.1164/rccm.201108-1503OC. [DOI] [PMC free article] [PubMed] [Google Scholar]
- 14.Hamilton LM, Puddicombe SM, Dearman RJ, Kimber I, Sandstrom T, Wallin A, Howarth PH, Holgate ST, Wilson SJ, Davies DE. Eur Respir J. 2005;25:978–985. doi: 10.1183/09031936.05.00098604. [DOI] [PubMed] [Google Scholar]
- 15.Bergquist J, Tarkowski A, Ekman R, Ewing A. Proc Natl Acad Sci U S A. 1994;91:12912–12916. doi: 10.1073/pnas.91.26.12912. [DOI] [PMC free article] [PubMed] [Google Scholar]
- 16.Lillard SJ, Yeung ES, McCloskey MA. Anal Chem. 1996;68:2897–2904. doi: 10.1021/ac960412j. [DOI] [PubMed] [Google Scholar]
- 17.Hogan BL, Yeung ES. Anal Chem. 1992;64:2841–2845. doi: 10.1021/ac00046a031. [DOI] [PubMed] [Google Scholar]
- 18.Kennedy RT, Oates MD, Cooper BR, Nickerson B, Jorgenson JW. Science. 1989;246:57–63. doi: 10.1126/science.2675314. [DOI] [PubMed] [Google Scholar]
- 19.Olefirowicz TM, Ewing AG. Anal Chem. 1990;62:1872–1876. doi: 10.1021/ac00216a026. [DOI] [PubMed] [Google Scholar]
- 20.Wallingford RA, Ewing AG. Anal Chem. 1988;60:1972–1975. doi: 10.1021/ac00169a027. [DOI] [PubMed] [Google Scholar]
- 21.Jankowski JA, Tracht S, Sweedler JV. Trac-Trends in Analytical Chemistry. 1995;14:170–176. [Google Scholar]
- 22.Xue Q, Yeung ES. Anal Chem. 1994;66:1175–1178. doi: 10.1021/ac00079a036. [DOI] [PubMed] [Google Scholar]
- 23.Krylov SN, Zhang Z, Chan NW, Arriaga E, Palcic MM, Dovichi NJ. Cytometry. 1999;37:14–20. doi: 10.1002/(sici)1097-0320(19990901)37:1<14::aid-cyto2>3.0.co;2-j. [DOI] [PubMed] [Google Scholar]
- 24.Lin Y, Trouillon R, Safina G, Ewing AG. Anal Chem. 2011;83:4369–4392. doi: 10.1021/ac2009838. [DOI] [PMC free article] [PubMed] [Google Scholar]
- 25.Lu C. Chemical cytometry : ultrasensitive analysis of single cells. Wiley-VCH; Weinheim: 2010. p. xix.p. 247. [Google Scholar]
- 26.Whitmore CD, Olsson U, Larsson EA, Hindsgaul O, Palcic MM, Dovichi NJ. Electrophoresis. 2007;28:3100–3104. doi: 10.1002/elps.200700202. [DOI] [PubMed] [Google Scholar]
- 27.Essaka DC, Prendergast J, Keithley RB, Hindsgaul O, Palcic MM, Schnaar RL, Dovichi NJ. Neurochem Res. 2012;37:1308–1314. doi: 10.1007/s11064-012-0733-1. [DOI] [PMC free article] [PubMed] [Google Scholar]
- 28.Phillips RM, Bair E, Lawrence DS, Sims CE, Allbritton NL. Anal Chem. 2013;85:6136–6142. doi: 10.1021/ac401106e. [DOI] [PMC free article] [PubMed] [Google Scholar]
- 29.Gill GN, Weber W, Thompson DM, Lin C, Evans RM, Rosenfeld MG, Gamou S, Shimizu N. Somat Cell Mol Genet. 1985;11:309–318. doi: 10.1007/BF01534689. [DOI] [PubMed] [Google Scholar]
- 30.Ghio AJ, Bassett M, Chall AN, Levin DG, Bromberg PA. Journal of Bronchology. 1998;5:185–194. [Google Scholar]
- 31.Efron B, Tibshirani R. An introduction to the bootstrap. Chapman & Hall; New York: 1993. p. xvi.p. 436. [Google Scholar]
- 32.Kinnula VL, Yankaskas JR, Chang L, Virtanen I, Linnala A, Kang BH, Crapo JD. Am J Respir Cell Mol Biol. 1994;11:568–576. doi: 10.1165/ajrcmb.11.5.7946385. [DOI] [PubMed] [Google Scholar]
- 33.McGovern T, Risse PA, Tsuchiya K, Hassan M, Frigola G, Martin JG. Am J Physiol Lung Cell Mol Physiol. 2010;299:L808–815. doi: 10.1152/ajplung.00438.2009. [DOI] [PubMed] [Google Scholar]
- 34.Heijink IH, Brandenburg SM, Noordhoek JA, Postma DS, Slebos DJ, van Oosterhout AJ. Eur Respir J. 2010;35:894–903. doi: 10.1183/09031936.00065809. [DOI] [PubMed] [Google Scholar]
- 35.Masramon L, Vendrell E, Tarafa G, Capella G, Miro R, Ribas M, Peinado MA. J Cell Sci. 2006;119:1477–1482. doi: 10.1242/jcs.02871. [DOI] [PubMed] [Google Scholar]
- 36.Brock A, Chang H, Huang S. Nat Rev Genet. 2009;10:336–342. doi: 10.1038/nrg2556. [DOI] [PubMed] [Google Scholar]
- 37.Nemes P, Knolhoff AM, Rubakhin SS, Sweedler JV. ACS Chem Neurosci. 2012;3:782–792. doi: 10.1021/cn300100u. [DOI] [PMC free article] [PubMed] [Google Scholar]
Associated Data
This section collects any data citations, data availability statements, or supplementary materials included in this article.