

Abstract
Gamma-aminobutyric acid (GABA) is a major inhibitory neurotransmitter in mammalian brain. GABA receptor are involved in a number of complex disorders, including substance abuse. No variants of the commonly studied GABA receptor genes that have been associated with substance dependence have been determined to be functional or pathogenic. To reconcile the conflicting associations with substance dependence traits, we performed a meta-analysis of variants in the GABAA receptor genes (GABRB2, GABRA6, GABRA1, and GABRG2 on chromosome 5q and GABRA2 on chromosome 4p12) using genotype data from 4739 cases of alcohol, opioid, or methamphetamine dependence and 4924 controls. Then, we combined the data from candidate gene association studies in the literature with two alcohol dependence (AD) samples, including 1691 cases and 1712 controls from the Study of Addiction: Genetics and Environment (SAGE), and 2644 cases and 494 controls from our own study. Using a Bonferroni-corrected threshold of 0.007, we found strong associations between GABRA2 and AD (P=9 × 10⁻⁶ and odds ratio (OR) 95% confidence interval (CI)=1.27 (1.15, 1.4) for rs567926, P=4 × 10⁻⁵ and OR=1.21 (1.1, 1.32) for rs279858), and between GABRG2 and both dependence on alcohol and dependence on heroin (P=0.0005 and OR=1.22 (1.09, 1.37) for rs211014). Significant association was also observed between GABRA6 rs3219151 and AD. The GABRA2 rs279858 association was observed in the SAGE data sets with a combined P of 9 × 10⁻⁶ (OR=1.17 (1.09, 1.26)). When all of these data sets, including our samples, were meta-analyzed, associations of both GABRA2 single-nucleotide polymorphisms remained (for rs567926, P=7 × 10⁻⁵ (OR=1.18 (1.09, 1.29)) in all the studies, and P=8 × 10⁻⁶ (OR=1.25 (1.13, 1.38)) in subjects of European ancestry and for rs279858, P=5 × 10⁻⁶ (OR=1.18 (1.1, 1.26)) in subjects of European ancestry. Findings from this extensive meta-analysis of five GABAA receptor genes and substance abuse support their involvement (with the best evidence for GABRA2) in the pathogenesis of AD. Further replications with larger samples are warranted.
Keywords: addiction, gamma-aminobutyric acid receptor, association, meta-analysis, susceptibility gene
INTRODUCTION
Alcohol, heroin, opiate, and methamphetamine dependence (AD, HD, OD, and MD, respectively) are chronic, relapsing disorders characterized by compulsive seeking, abuse, tolerance, and physical dependence on the substance in question despite adverse social, personal, and legal consequences. The cost of drug abuse has grown to approximately one trillion dollars per year in the United States (Califano, 2007). Family, twin, and adoption studies have shown that genetic factors have an important role in the etiologies of AD and drug dependence, and these disorders share common genetic risk to some extent (Fu et al, 2002; True et al, 1999; Xian et al, 2008). Variation in the function of the gamma-aminobutyric acid (GABA) receptor subunit genes is hypothesized to have a role in developing the disorders (Addolorato et al, 2012; Davis and Wu, 2001). GABA is the major inhibitory neurotransmitter in mammalian brain, where it acts at GABAA receptors, which are ligand-gated multisubunit chloride channels. The GABAA receptors are targets for many clinically important drugs, such as the benzodiazepines, general anesthetics, and barbiturates. At least 16 distinct subunits of GABAA receptors have been identified. Functional receptors are pentameric, consisting of protein products of several subunit classes: alpha, beta, gamma, delta, and rho. The genes encoding these proteins are organized chromosomally in clusters, including the gene cluster GABRB2, GABRA6, GABRA1, and GABRG2 on chromosome 5q and the gene cluster GABRG1, GABRA2, GABRA4, and GABRB1 on chromosome 4p12 (McLean et al, 1995; Reich et al, 1998).
Ethanol acts by binding and altering membrane-bound ligand-gated and voltage-dependent ion channels (Davies, 2003). The GABAA receptor subunits form pentameric receptor, which is most commonly observed in the postsynaptic cell membrane of the mammalian brain, and it allows passage for chloride ions in the center of the pentamer and binding sites for GABA and modulatory drugs. Ethanol is believed to affect GABAA receptors and their subunit composition. Alterations in the GABAA receptor subunits are responsible for GABAergic signaling changes, which are ultimately associated with chronic alcohol use (Weiner and Valenzuela, 2006). Specifically, the mesolimbic GABAergic neurons act as inhibitory regulators of dopamine (DA) neurons in the ventral tegmental area (VTA) of the brain. However, in the presence of addictive drugs, mesolimbic dopaminergic neurons are activated. For example, cannabinoids in GABAergic neurons cause disinhibition (ie, activation) of DA neurons and eventually lead to increased DA levels in the VTA region (Luscher and Malenka, 2011). Similar to the mechanism of action of opioids, alcohol inhibits GABAergic transmission in the VTA by promoting GABAA receptor function and hence leads to activation of mesolimbic DA neurons (Nestler, 2005).
Chromosome 5 GABAA Receptor Gene Cluster
Four genes, encoding β2, α6, α1, and γ2 subunits of the GABAA receptor, form a GABA gene cluster on chromosome 5. The GABRB2 gene, encoding the β2 subunit and spanning 259 694 base pairs (bp), is located on 5q34. This receptor mediates the fastest known inhibitory synaptic transmission in the central nervous system. The marker rs2229944 is a synonymous single-nucleotide polymorphism (SNP) in exon 10 of this gene. The GABRA6 gene, spanning 16 940 bp, is also located on 5q34. The frequently analyzed SNP rs3219151 is in the 3′ untranslated region (UTR). The GABRA1 gene of 52 kilo-bp (kbp) is on 5q34-q35 where SNP rs2279020 is located in intron 10. Mutations in this gene can cause juvenile myoclonic epilepsy and childhood absence epilepsy type 4 (Cossette et al, 2002). The GABRG2 gene, covering 87 897 bp, is at 5q31.1-q33.1 and two SNPs that we will consider, rs211014 and rs211013, map to intron 8. This gene has also been associated with epilepsy and febrile seizures (Kang et al, 2009). Linkage and association studies have reported, for example, that the 5q34 GABAA receptor genes were involved in AD risk in Finns (Radel et al, 2005), and the 5q33 GABAA receptor genes were associated with HD in Chinese subjects (Loh et al, 2007).
Chromosome 4 GABAA Receptor Gene Cluster
Another GABA gene cluster consisting of GABRG1, GABRA2, GABRA4, and GABRB1 is located on chromosome 4p12, spanning approximately 1302 kbp. The 140-kbp GABRA2 gene encodes the alpha 2 subunit of the GABAA receptor. Variation in GABRA2 was associated with AD and with brain oscillations (Edenberg et al, 2004). Two synonymous SNPs, rs279858 in exon 5 and rs567926 in the 3′ UTR, have been studied most often.
The two gene clusters are parts of the numerous subunit isoforms of the GABAA receptors, which differ in agonist affinity, likelihood of opening, conductance, and other properties (Cossart et al, 2005). They are also members of the large ‘Cys-loop' super family of structurally similar and evolutionarily related ligand-gated ion channels that also include nicotinic acetylcholine receptors, glycine receptors, and the serotonin-3 (5HT3) receptor. These clusters are paralogous (Ensembl release 70). Figure 1 shows the schematic structures of the eight chromosome 5 and 4 cluster genes, including the five genes and seven SNPs meta-analyzed in this study. Among the eight cluster genes, only five genes were studied in this meta-analysis because the data were insufficient for meta-analysis for the other three genes. Supplementary Table 1 summarizes the human medical diseases and traits that have been reported to be associated with these genes.
Figure 1.
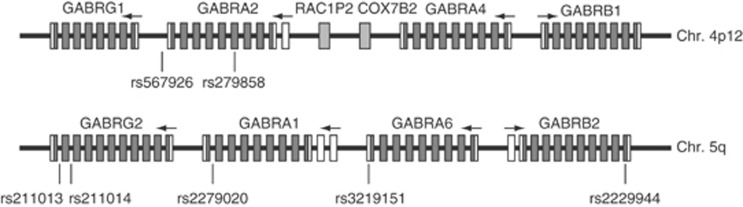
Schematic structure of the chromosome 4 and 5 gene clusters. The solid (dark gray) and open rectangles represent the coding and 5′ and 3′ UTRs, respectively, and their boundaries are the start codon ATG or stop codon TGA. The arrows indicate transcriptional directions of each gene (5′–3′). Light gray rectangles represent two unrelated genes (chromosome 4p12), whose structures were not shown. The vertical lines above rs numbers indicate the relative positions of the SNPs analyzed in this meta-analysis. To better show the gene structures, the length of each component was adjusted, and thus the rectangle lengths, inter-rectangle distances, and intergenic regions did not reflect their actual proportions.
To reconcile conflicting findings obtained by independent research groups in genetic association studies and to elucidate the genetic relationship with substance dependence traits, the current meta-analysis compiled the available genotype data for each of seven SNPs (GABRA1 rs2279020, GABRA2 rs567926 and rs279858, GABRA6 rs3219151, GABRB2 rs2229944, and GABRG2 rs211014 and rs211013). AD and drug dependence were first analyzed separately, and then combined (to consider shared genetic risks mapped to these elements of the GABA neurotransmission system). In addition, we combined the genotype data sets from candidate gene-based studies with genotype information for the same candidate loci extracted from two genome-wide association studies (GWASs), including 1691 cases (AD) and 1712 controls from the Study of Addiction: Genetics and Environment (SAGE), and 2644 cases (AD) and 494 screened controls from our own GWAS.
MATERIALS AND METHODS
Our Data
Subjects were recruited at five US clinical sites: Yale University School of Medicine, the University of Connecticut Health Center, the University of Pennsylvania Perelman School of Medicine, the Medical University of South Carolina, and McLean Hospital. All subjects were interviewed using the Semi-Structured Assessment for Drug Dependence and Alcoholism (Gelernter et al, 2005; Pierucci-Lagha et al, 2007) to derive diagnoses of lifetime AD, CD, OD, MD, and other major psychiatric traits according to the Diagnostic and Statistical Manual of Mental Disorders, 4th edition (DSM-IV) criteria (American Psychiatric Associaton, 1994). Samples were genotyped on the Illumina HumanOmni1-Quad v1.0 microarray (Illumina, San Diego, CA). Only unrelated individuals (AD cases and screened controls) were analyzed in this meta-analysis. Details regarding the sample and quality control can be found in our recent paper (Gelernter et al, 2013).
SAGE Data
SAGE samples were genotyped on the Illumina Human1M array, including individuals from the Collaborative Study on the Genetics of Alcoholism (Edenberg, 2002), the Family Study of Cocaine Dependence (Bierut et al, 2008), and the Collaborative Genetic Study of Nicotine Dependence (Bierut, 2007). More details regarding the sample and quality control can be found at the dbGap (http://www.ncbi.nlm.nih.gov/projects/gap/cgi-bin/study.cgi?study_id=phs000092.v1.p1).
Literature Search
The candidate gene-based association studies included in the meta-analysis were selected from PubMed and from the database of Chinese Academic Journals with keywords ‘GABA receptor', ‘GABR', ‘gamma-aminobutyric acid', ‘association', ‘associated', ‘drug', ‘substance', ‘alcoholism', ‘alcohol', ‘alcoholics', ‘heroin', ‘cocaine', ‘opiate', ‘opioid', ‘methamphetamine', ‘methadone', ‘morphine', ‘opium' and the specific aliases or abbreviations for the genes. All references cited in these studies and in published reviews were examined in order to identify additional works not indexed by the databases. The analyzed data cover all identified English publications up to January 2012 (for the candidate gene-based association studies).
Inclusion Criteria
Eligible studies had to meet all of the following criteria: they had to (i) be published in peer-reviewed journals and contain original and independent data; (ii) present sufficient data to calculate the odds ratio (OR) with confidence interval (CI) and P-value; (iii) be association studies investigating one or more of the seven SNPs named above using either case–control or family-based approaches; (iv) describe or reference the genotyping primers and protocols used; (v) investigate one or more of the following: AD, cocaine, HD, and MD (abuse); and (vi) use random population or healthy individuals as controls in case–control studies. Authors were contacted in cases where we determined it would be useful to have additional information regarding their studies. The procedure of ‘extended-quality score' (Li et al, 2006) was applied to assist in the assessment of quality of the individual association studies.
SNP Selection
Among all the eligible candidate gene association studies of substance use disorders that meet all of the above criteria, seven SNPs were selected for the meta-analysis. No other SNPs were identified with sufficient sample size or statistical power to permit meta-analysis. Of the seven SNPs, none are known to be functional or represent the full range of genetic diversity for each of the genes (one or two SNPs per gene) except that GABRA2 rs279858 is a tag SNP for the risk-resilience haplotypes. A summary of the seven SNPs and related studies is shown in Supplementary Table 2.
Statistical Analyses
Studies were divided according to the populations studied—European, Asian, African, or American-Indian ancestries. When a study contained data from multiple populations, each was considered effectively as an independent study. Data from the case–control studies were summarized by two-by-two tables. From each table, a log-OR and its sampling variance were calculated (Li et al, 2006). The Cochran's χ2-based Q statistic test was computed in order to assess heterogeneity to ensure that each group of studies was suitable for meta-analysis. Where heterogeneity was found, the random effects model, which yields a wider CI, was adopted. The Egger's funnel plot asymmetry (Egger et al, 1997), which uses a linear regression approach to measure funnel plot asymmetry on the natural logarithm of the OR, was applied to assess evidence for publication bias. The larger the deviation of each study from the funnel curve, the more pronounced the asymmetry. Results from small studies scatter widely at the bottom of the plot, with the spread narrowing among larger studies. The significance of the intercept was evaluated using the T-test. In addition, the procedure of Duval and Tweedie's Trim and Fill (Duval and Tweedie, 2000) was used to impute the potentially missing studies. Then, the procedure adds estimates for these missing studies to the meta-analysis, and then re-computes the adjusted overall effect size.
ORs were pooled using the method of DerSimonian and Laird (1986), and 95% CIs were constructed using the method of Woolf (1955). The significance of the overall OR was determined using the Z-test. To measure sensitivity of our analysis results, each study was removed in turn from the total, and the remainder then reanalyzed. This procedure was applied to ensure that no individual study was entirely responsible for the combined results. In addition, different combinations of populations and traits (AD, OD, and MD) were also analyzed if possible. Genotypic analyses were performed using both dominant and recessive models. Retrospective analysis was carried out to understand better the potential effect of year of publication upon the results. The type I error rate was set at 0.05. The tests were two-tailed. To evaluate the linkage disequilibrium (LD) of the known SNPs, haplotype construction was performed using the HapMap samples on Haploview software (Barrett et al, 2005), as detailed in our previous study (Li et al, 2011). The additional genotype data from SAGE and our own samples were analyzed using the same approaches, and then combined for meta-analysis. We evaluated possible functional effects of each SNP using FuncPred (http://snpinfo.niehs.nih.gov/snpinfo/snpfunc.htm).
RESULTS
The combined search of candidate gene-based association studies yielded 388 references. After discarding overlapping references and those that clearly did not meet the stated criteria, 33 studies remained. These studies were then filtered to ensure conformity with the inclusion criteria. One study (Lind et al, 2008) was excluded because it investigated families comprised of monozygotic and dizygotic twin pairs; one study (Khan et al, 2009) was excluded because the definition of alcoholism was based on alcohol consumption only; and four studies (Agrawal et al, 2006, Dick et al, 2005, 2006,Edenberg et al, 2004) were excluded because the data were not made available after we contacted the authors to request access to the data. In the end, 27 studies (Chang et al, 2002; Covault et al, 2004, 2008,Enoch et al, 2009; Fehr et al, 2006; Foley et al, 2004; Han et al, 2008; Hsu et al, 1998; Lappalainen et al, 2005; Li et al, 2002; Lin et al, 2003; Loh et al, 1999,2000,2007,Lydall et al, 2011; Nishiyama et al, 2005; Onori et al, 2010; Park et al, 2006; Sander et al, 1999; Soyka et al, 2008) met our criteria for inclusion (Supplementary Table 3). These studies included a total of 4739 cases (AD, HD, or MD) and 4924 controls.
LD and Haplotype Structure Analyses
Based on the LD plots for European population, each gene can be roughly assigned an independent LD structure (Supplementary Figures 1 and 2); in some cases LD extends across more than one gene. GABRG2 rs211014 and rs211013 are within a haplotype block, which spans approximately half of the gene. One non-synonymous coding SNP, rs17855003, which is very close to rs211014 and rs211013, also maps within the same block. GABRA6 rs3219151 is in a very large haplotype block flanked by GABRB2. This strong LD block contains three other non-synonymous SNPs including GABRA6 rs3811993, rs34907804, and GABRB2 rs2229945 (Supplementary Figure 1). GABRA2 rs567926 and rs279858 also share a very strong LD block with three other non-synonymous SNPs rs519972, rs41310789, and rs17852044 (rs519972: benign (Sunyaev et al, 2001; Xu and Taylor, 2009); rs41310789: exonic splicing enhancers or silencers (Xu and Taylor, 2009); and rs17852044: possibly damaging (Sunyaev et al, 2001; Xu and Taylor, 2009) based on bioinformatics prediction), and the LD structure contains only a single haplotype block (Supplementary Figure 2). Compared with the European LD plots, the Asian plots (Supplementary Figures 3 and 4) showed same results with consistent haplotype structure but stronger LD. We previously analyzed the region of GABRA2 through GABRG1 using our own samples of six different populations: European American, African American, Chinese American, and Asian (ie, Thai, Chinese Thai, and Hmong). A 280-kbp region of considerably higher LD spanned the intergenic region in Hmong while two or more LD blocks were observed in other populations (Ittiwut et al, 2008). The strong LD between these SNPs may raise the possibility that an association is driven in part by variants in the adjacent locus (Gelernter and Kranzler, 2009). For instance, markers in the 3' region of GABRA2 are in LD with markers at the adjacent GABRG1 (Covault et al, 2008; Ittiwut et al, 2008). It is possible that the association identified in GABRA2 has a component because of LD with GABRG1, with risk loci in both genes (Covault et al, 2008; Enoch et al, 2009). In this meta-analysis, we analyzed all the functional receptor genes with available genotype data sets sufficient for meta-analyses (GABRB2, GABRA6, GABRA1, and GABRG2 on chromosome 5q and GABRA2 on chromosome 4p12). The results for each gene and polymorphism are detailed below.
GABRG2 rs211014
The frequencies of the risk allele (C) were 50% (47–51%) in Asian control populations and 55% (53–56%) in affected subjects. All studies showed higher frequencies in cases than in controls. The combined studies of AD, HD, and MD produced an overall P-value of 0.0005 with OR 1.22 (1.09, 1.37; Table 1 and Supplementary Table 4). There was no evidence for heterogeneity among studies (P>0.05) and no evidence for publication bias (P>0.05). Furthermore, the studies of HD and MD also showed strong association with P=0.0088 (OR=1.22 (1.05, 1.41)). Evidence of association was also found in the studies of AD (P=0.02, OR=1.24 (1.03, 1.48)). The significant results were also consistent in the genotypic analyses; the dominant model ((CC+CA) vs AA; P=0.0007 and OR=1.39 (1.15, 1.69)) showed more statistical significance than the recessive model (CC vs (CA+AA); P=0.02, OR=1.23 (1.03, 1.48)). The subgrouped studies of AD and those of HD and MD also showed significant association with P-values of 0.01 and 0.02, respectively (Table 1). The full version of Table 1 is shown in Supplementary Table 4.
Table 1. Results of the Overall and Subgrouped Studies for Both Allelic and Genotypic Analyses.
| Genes/SNPs/groups | #Cases/controlsa | OR (95% CI) | P(Z) | P(Q) | OR (95% CI) | P(Z) | P(Q) | OR (95% CI) | P(Z) | P(Q) |
|---|---|---|---|---|---|---|---|---|---|---|
| GABRG2 rs211014 | (CC+CA)/AA | CC/(CA+AA) | Allelic analysis | |||||||
| All studies | 1103/1358 | 1.39 (1.15,1.69) | 0.0007 | 0.8556 | 1.23 (1.03,1.48) | 0.0226 | 0.8054 | 1.22 (1.09,1.37) | 0.0005 | 0.9486 |
| Alcohol dependence | 501/464 | 1.49 (1.09,2.03) | 0.0118 | 0.7441 | 1.21 (0.91,1.61) | 0.1837 | 0.9616 | 1.24 (1.03,1.48) | 0.021 | 0.9199 |
| Heroin and methamphetamine | 602/894 | 1.34 (1.05,1.71) | 0.02 | 0.6292 | 1.25 (0.99,1.57) | 0.0632 | 0.4026 | 1.22 (1.05,1.41) | 0.0088 | 0.6885 |
| All studies+SAGE | 2794/3070 | 1.25 (1.08,1.45) | 0.0035 | 0.6622 | 1.04 (0.94,1.15) | 0.4272 | 0.4067 | 1.09 (1.01,1.18) | 0.0366 | 0.2664 |
| All studies+SAGE+our GWAS | 5438/3564 | 1.18 (1.04,1.35) | 0.0134 | 0.572 | 1.03 (0.94,1.12) | 0.5296 | 0.5485 | 1.06 (0.99,1.14) | 0.095 | 0.2846 |
| GABRG2 rs211013 | (AA+AG)/GG | AA/(AG+GG) | Allelic analysis | |||||||
| All studies | 1538/1516 | 1.21 (1.03,1.41) | 0.0166 | 0.7314 | 1.04 (0.85,1.29) | 0.6941 | 0.9023 | 1.11 (0.99,1.23) | 0.0634 | 0.9784 |
| Asians | 949/1121 | 1.24 (1.03,1.48) | 0.0207 | 0.9383 | 1 (0.74,1.34) | 0.986 | 0.8414 | 1.12 (0.98,1.28) | 0.0919 | 0.9621 |
| Heroin and methamphetamine | 545/755 | 1.29 (1.03,1.61) | 0.0284 | 0.6695 | 0.91 (0.63,1.32) | 0.6248 | 0.5404 | 1.13 (0.95,1.33) | 0.1653 | 0.9083 |
| GABRA6 rs3219151 | (AA+AG)/GG | AA/(AG+GG) | Allelic analysis | |||||||
| Alcohol dependence | 1103/841 | 1.5 (1.23,1.84) | 0.0001 | 0.2438 | 1.36 (0.91,2.04) | 0.1375 | 0.0187 | 1.34 (1.17,1.54) | 4 × 10⁻⁵ | 0.1069 |
| Alcohol dependence (Asians) | 599/545 | 1.46 (1.16,1.85) | 0.0015 | 0.1384 | 1.8 (1.2,2.69) | 0.0043 | 0.0612 | 1.41 (1.18,1.68) | 0.0002 | 0.1665 |
| Alcohol dependence+SAGE | 2796/2552 | 1.24 (1.01,1.52) | 0.0406 | 0.0222 | 1.21 (0.95,1.55) | 0.1297 | 0.0196 | 1.18 (1.02,1.37) | 0.0308 | 0.005 |
| GABRB2 rs2229944 | (TT+TC)/CC | Allelic analysis | ||||||||
| Alcohol dependence | 1046/803 | 0.69 (0.5,0.96) | 0.0293 | 0.0781 | 0.73 (0.54,1) | 0.0465 | 0.1327 | |||
| GABRA2 rs567926 | (CC+TC)/TT | CC/(CT+TT) | Allelic analysis | |||||||
| All studies (alcohol dependence) | 1759/1727 | 1.33 (1.12,1.57) | 0.001 | 0.7412 | 1.32 (1.13,1.54) | 0.0004 | 0.7188 | 1.27 (1.15,1.4) | 2 × 10⁻⁶ | 0.7906 |
| Europeans | 1612/1628 | 1.35 (1.13,1.6) | 0.0007 | 0.6982 | 1.31 (1.12,1.54) | 0.0009 | 0.6012 | 1.27 (1.15,1.41) | 4 × 10⁻⁶ | 0.6799 |
| All studies+SAGE+our GWAS | 4403/2221 | 1.28 (1.1,1.49) | 0.0018 | 0.7505 | 1.18 (1.04,1.33) | 0.0078 | 0.3288 | 1.18 (1.09,1.29) | 7 × 10⁻⁵ | 0.2719 |
| All studies+SAGE+our GWAS (Europeans) | 2829/1688 | 1.28 (1.09,1.49) | 0.002 | 0.5242 | 1.34 (1.13,1.59) | 0.0006 | 0.8037 | 1.25 (1.13,1.38) | 8 × 10⁻⁶ | 0.6369 |
| GABRA2 rs279858 | (GG+GA)/AA | GG/(GA+AA) | Allelic analysis | |||||||
| Europeans | 2000/2059 | 1.35 (1.17,1.57) | 6 × 10⁻⁵ | 0.4249 | 1.23 (1.02,1.48) | 0.0316 | 0.6843 | 1.21 (1.1,1.32) | 4 × 10⁻⁵ | 0.388 |
| SAGE-EA | 1113/1279 | 1.21 (1.02,1.43) | 0.029 | 1.01 (0.81,1.25) | 0.93 | 1.12 (0.99,1.26) | 0.053 | |||
| SAGE-AA | 576/430 | 1.33 (1.03,1.72) | 0.027 | 0.85 (0.51,1.43) | 0.54 | 1.21 (0.98,1.48) | 0.07 | |||
| Europeans+SAGE-EA | 3113/3338 | 1.29 (1.15,1.44) | 9 × 10⁻⁶ | 0.4333 | 1.13 (0.98,1.3) | 0.0938 | 0.5544 | 1.17 (1.09,1.26) | 9 × 10⁻⁶ | 0.3926 |
| All studies+SAGE+our GWAS (Europeans) | 3961/2966 | 1.29 (1.15,1.44) | 6 × 10⁻⁶ | 0.5481 | 1.13 (0.99,1.3) | 0.0741 | 0.6443 | 1.18 (1.1,1.26) | 5 × 10⁻⁶ | 0.48 |
Abbreviations: AA, African American; EA, European American; SAGE, Study of Addiction: Genetics and Environment data sets.
P(Z): Z test used to determine the significance of the overall OR. P-values <0.05 are indicated in boldfaces.
P(Q): Cochran's X2-based Q statistic test used to assess the heterogeneity.
P(T): T-test used to evaluate the significance of publication bias (data not shown). P (one-tailed) >0.1.
Bold represents the P-values <0.05.
All studies: all candidate gene-based studies.
The full version of this table is shown in Supplementary Table 4.
Sample sizes (cases–controls) in the meta-analyses.
GABRG2 rs211013
The frequencies of the risk allele (A) were 49% (46–55%) in European control populations and 52% (45–55%) in affected subjects, but lower and more variable across Asian populations, both control 32% (27–48%) and affected, 35% (25–49%). Of 13 studies included, 8 studies showed significantly higher frequency in cases than in controls and 2 studies showed no significant difference. Under the dominant model ((AA+AG) vs GG), the combined studies (AD, HD, or MD) produced a significant overall P-value of 0.016 with OR 1.21 (1.03, 1.41; Table 1). There was no evidence for heterogeneity among studies, or of publication bias. The association was also found in the combined Asian studies with P=0.02 (OR=1.24 (1.03, 1.48)). The studies of HD and MD also showed association with P=0.028 (OR=1.29 (1.03, 1.61)). However, there was no significant association in the allelic analysis (P=0.06) or under the recessive model (Supplementary Table 4).
GABRA6 rs3219151
The frequencies of the risk allele (T) were 50% (44–56%) in European control populations and 56% (43–65%) in affected, with lower frequencies in both Asian control populations 30% (23–34%) and affected, 32% (25–44%). Of 10 studies included, 5 showed higher frequency in cases than in controls. There was evidence of heterogeneity between studies when all the studies were combined, and no significant association was found when the random effects model was applied, although the fixed effects model produced a P=0.036. However, there was evidence of association in the combined studies of AD with P=4 × 10⁻⁵ (OR=1.34 (1.17, 1.54)); no significant heterogeneity was found. A similarly strong association was also detected under the dominant model (Table 1).
GABRA1 rs2279020 and GABRB2 rs2229944
The frequency of the A allele of GABRA1 rs2279020 varied across Asian control populations 46% (40–51%) and it was unequivocally the major allele in European samples (66%). Of seven studies included, four showed lower frequency in cases than in controls, and one showed no significant difference. The random effects model was applied because of weak heterogeneity. There was no evidence of significant association based on any data set in either allelic or genotypic analysis (Supplementary Table 4). The frequency of the T allele of GABRB2 rs2229944 was low across the Asian control populations 4% (3–6%), and slightly higher in Europeans 8% (4–15%). Of nine studies included, six showed lower frequency in cases than in controls. The random effects model was also applied, and there was no evidence of significant association except in the combined studies of AD (eg, P=0.029 (OR=0.69 (0.5, 0.96); Supplementary Table 4).
GABRA2 rs567926
The frequencies of the risk allele (C) were 38% (34–42%) in European control populations and 44% (39–50%) in affected, whereas it was 36% and 41% in African Americans, respectively (Supplementary Figure 5). All studies showed higher frequency in cases than in controls. The combined studies produced a strong overall P-value of 2 × 10⁻⁶ with OR 1.27 (1.15, 1.4; Table 1). The dominant and recessive models also showed evidence of association with P-values of 0.001 and 0.0004; ORs of 1.33 (1.12, 1.57) and 1.32 (1.13, 1.54), respectively (Table 1). No evidence was found for heterogeneity or publication bias.
GABRA2 rs279858
Consistent with the strong LD observed between these loci, the association identified for GABRA2 rs279858 was similar to that seen with GABRA2 rs567926. The frequencies of the risk allele (G) were 41% (34–59%) and 46% (41–63%) in European control and affected populations, respectively, and the eight studies included all showed higher frequency in cases than in controls (Supplementary Figure 6). However, the study investigating African American (58% in controls and 29% in cases) and that of plains Indian (36.2% in controls and 35.9% in cases) showed association in the opposite direction. The combined European subjects showed a strong overall P-value of 4 × 10⁻⁵ with OR 1.21 (1.1, 1.32; Table 1). Evidence of association was also found under the dominant and recessive models with P-values=6 × 10⁻⁵ and 0.032 and ORs=1.35 (1.17, 1.57) and 1.23 (1.02, 1.48), respectively (Table 1).
The association findings reflect the LD blocks and structures described above. This supports the conclusion that it is necessary to investigate these non-synonymous SNPs with cognizance of the LD plots (such as those listed in Supplementary Table 5), as it is possible that any of the associations is due to LD with an unobserved functional SNP. Demographic information for the included studies is shown in Supplementary Table 3. The results for all of the combined studies and subgrouped studies are shown in Table 1 and Supplementary Table 4 for both allelic and genotypic analyses. Forest plots are shown in Figure 2.
Figure 2.

Forest plots of OR with 95% CI. Black squares indicate the OR, with the size of the square inversely proportional to its variance, and horizontal lines represent the 95% CIs. The pooled results are indicated by the unshaded black diamond. Only the results for the five associated SNPs and the significant pooled results are shown.
Publication Bias Analyses
No evidence of significant publication bias was found using the Egger's regression test with regard to any of the SNPs. However, the analysis of Duval and Tweedie's trim and fill showed that for the allelic analysis of GABRG2 rs211013 (Supplementary Figure 7), there might potentially be five missing studies, and the adjusted overall OR was 1.17 (1.06, 1.28), larger than the corresponding observed OR of 1.11 (0.99, 1.23). For the recessive model (Supplementary Figure 8), the analysis predicts that there are about four missing studies, and the adjusted results showed a larger effect size, OR=1.32 (1.15, 1.52) (compared with observed OR=1.21 (1.03, 1.41). That is, the imputed missing studies revealed consistent association. The results are consistent with trend toward stronger association if larger samples are included. The same pattern was found in the allelic analysis of GABRG2 rs211014 (Supplementary Figure 9). The classic fail-safe analysis showed that for GABRG2 rs211014, 16, 16, and 3 assumed studies could bring the overall P-value to>0.05 for the allelic analysis, dominant model, and recessive model, respectively. For GABRA2 rs567926, 34, 18, and 11 assumed studies could bring the overall P-value to>0.05 for the allelic analysis, dominant model, and recessive model, respectively. For GABRA2 rs279858, 29, 21, and 3 assumed insignificant studies could bring the P-value (European population) to >0.05 for the allelic analysis, dominant model, and recessive model, respectively. The results consistently supported the significant associations detected in the meta-analysis. Supplementary figures show the funnel plots for the allelic and genotypic analyses of GABRG2 rs211013 (Supplementary Figures 7 and 8) and rs211014 (Supplementary Figures 9 and 10), GABRA6 rs3219151 (Supplementary Figure 11), GABRA2 rs567926 (Supplementary Figure 12), and rs279858 (Supplementary Figure 13), respectively. Supplementary Figures 7–9 clearly indicate the changes between the observed and adjusted values of effect size described above.
Sensitivity and Retrospective Analyses
The results for GABRG2 rs211014, GABRA6 rs3219151, and GABRA2 rs567926 and rs279858 were consistent (and showed associations), and were not changed substantially by the removal of any data set. The P-values were never >0.005, >0.037, >0.025, or >0.0015, respectively, in either allelic or genotypic analysis (Supplementary Table 6). However, for GABRG2 rs211013, one of the P-values became insignificant (P=0.067) when the study by Sander et al (1999) was removed. Retrospective analysis showed that the cumulative results tended to be stable for each SNP, but more studies are needed. The results of the allelic analysis of GABRA2 rs279858 are shown in Figure 3. The results for other significant SNPs are shown in Supplementary Figures 14–19.
Figure 3.

Retrospective analysis for GABRA2 rs279858 in the European populations.
The SAGE Data
The SAGE data sets were analyzed separately, and then combined with the above candidate gene-based studies for meta-analyses. The GABRA2 rs279858 association was replicated using 1114 cases and 1282 controls of European Americans (P=0.029) as well as 577 cases and 430 controls of African Americans (P=0.027), and the combined P-value was 9 × 10⁻⁶ (OR=1.17 (1.09, 1.26)) in the European ancestry populations (Table 1). GABRG2 rs211014 showed evidence of association with a combined P=0.0035 and OR=1.25 (1.08, 1.45) in all these studies under the dominant model; and GABRA6 rs3219151 revealed evidence of weak association in the studies of AD (including the SAGE data) with a combined P=0.03 and OR=1.18 (1.02, 1.37).
Our Data
Our samples showed no evidence of significant associations individually, however, significant associations were observed when all of the data sets were combined in meta-analyses. For example, for GABRA2 rs567926, the P-values were 7 × 10⁻⁵ (OR=1.18 (1.09, 1.29)) in all the studies, and 8 × 10⁻⁶ (OR=1.25 (1.13, 1.38)) in Europeans; for GABRA2 rs279858, the P-value was 5 × 10⁻⁶ (OR=1.18 (1.1, 1.26)) in Europeans; and for GABRG2 rs211014 the P-value was 0.017 (OR=1.13 (1.02, 1.25)).
Bioinformatics Predictions of SNP Functions
The bioinformatics analyses of SNP function prediction showed that GABRG2 rs211013 might disrupt splicing activity and cause alternative splicing, and its alternative allele might affect splicing; and GABRA6 rs3219151 might affect microRNA-binding site activity. None of the other five SNPs studied were predicted to have direct functional consequences. Using the non-coding data from the ENCODE project, two (CIZ and Hbp1) and three motifs (Elf3, KAISO, and FEV), and four (H3k09me3, H3k9me3, H2az, and H3k27me3) and two histone marks (H3k09me3 and H3k9me3) were found for GABRA2 rs279858 and GABRG2 rs211013, respectively (Boyle et al, 2012).
DISCUSSION
On chromosome 5q, three of the five SNPs studied, including GABRG2 rs211013 and rs211014, and GABRA6 rs3219151, were found to be associated with AD, HD, and/or MD based on the combined data sets from the included candidate gene-based association studies in this meta-analysis. Rs211014 and rs211013 are in intron 8 of GABRG2. The SNP rs3219151 is located in the 3′ UTR of GABRA6. On chromosome 4p12, both of the two SNPs studied, GABRA2 rs567926 and rs279858, were found to be associated with AD. A recent study (Olfson and Bierut, 2012) also found association of GABRA2 rs279858 with AD based on the SAGE samples (P=0.0052 and OR=1.16 (1.05, 1.28)). Zintzaras (2012) also observed an association of GABRA2 with alcoholism with marginal significance for GABRA2 rs279858 (OR=1.27 (1.01–1.60)) and rs567926 (OR=1.24 (1.06–1.46)). Our meta-analysis combined a larger number of the existing data sets, including the SAGE data sets and our GWAS data sets, to achieve higher statistical power (this meta-analysis was expected to cover the majority of the sample genotypes and SNPs reported in the (Zintzaras, 2012) paper. For instance, when all the data sets were combined, associations of both GABRA2 SNPs were observed (for rs567926, P=7 × 10⁻⁵ (OR=1.18 (1.09, 1.29)) in all the studies, and P=8 × 10⁻⁶ (OR=1.25 (1.13, 1.38)) in Europeans; for rs279858, P=5 × 10⁻⁶ (OR=1.18 (1.1, 1.26)) in Europeans). Rs279858 is a synonymous SNP in exon 5 of GABRA2 while rs567926 is near its 3′ UTR. The SNPs mapped to 3′ UTRs may conceivably be functionally important, by, for example, altering the microRNA binding, and this regulating the mRNA stability and gene translation. The synonymous and intronic SNPs are presumably in LD with non-synonymous or regulatory polymorphisms that could alter the gene expression, or they could themselves also be functional. These SNPs might also be in LD with functional variants in other genes mapped within the GABA receptor gene clusters.
Inconsistency among the individual association studies included here prompted us to examine the reported associations in an attempt to understand better the roles of these gene clusters in AD and drug dependence. There are three leading possible explanations for the discrepant results. The first is differences in diagnostic classification and in ascertainment of the cases. Some studies applied DSM criteria to diagnose the disorders whereas others used ICD-10 criteria. Then, different studies reflect association with non-identical phenotypes that are subtly, or even substantively, different. The second is that a case–control design used in an individual study might give rise to spurious association if the populations from which the patient and control samples were drawn differed in allele frequency, that is, population stratification (Pritchard et al, 2000). Third, sample size and statistical power varied among the individual studies, and there was the expectation of random variation.
The genetic contribution to vulnerability to develop alcohol or drug dependence has generally been estimated in the range 40–70%, depending on the substance, consistent with complex inheritance in which multiple genes exert a small effect of vulnerability or protection, along with the environment (Frank et al, 2012; Gelernter and Kranzler, 2009; Goldman et al, 2005; Heath et al, 2011; Kendler et al, 2007; Wang et al, 2013). By analyzing potential associations between specific alleles and multiple substance phenotypes, our analyses may represent a necessary step toward identifying the effects of phenotype-influencing genes with improved certainty. The significantly associated SNPs identified in this study may be worthwhile for further replication. For instance, Bauer et al (2007) reported that the GABRA2 variant deserves careful clinical consideration, as the high-risk allele may respond better to certain medications to treat AD, like acamprosate or naltrexone, but not others, whereas the low-risk allele shows more variability in drinking behavior. Similarly, the other GABAA receptor subunit genes may have a comparably important role in differentiating responses to medications, underscoring the clinical importance of the variants in these genes.
The limitations of this study included the fact that only seven SNPs were selected for meta-analysis because no other SNPs were found to be likely to provide sufficient sample size or statistical power for meta-analysis based on the available candidate gene-based association studies of substance use disorders. Some relevant studies (Agrawal et al, 2006; Dick et al, 2005, 2006, Edenberg et al, 2004) were not included because of data availability. Moreover, although other GABA receptor genes have been proposed to be associated with drug or AD, there were not sufficient published data on them for meta-analysis. For example, we only analyzed the GABRA2 gene on chromosome 4p12, but not its adjacent gene, GABRG1, because of insufficient genetic data available for a meta-analysis although GABRG1 has also been reported to be associated to AD (Covault et al, 2008; Edenberg et al, 2004; Enoch et al, 2009; Ittiwut et al, 2012). In addition, in this meta-analysis most original association studies had no information on comorbidity in their research subjects, which made it impossible for us to address some other interesting issues, such as whether an observed association with one substance might be driven by another. Further studies of the full range of genetic diversity are warranted for these genes.
Quantitative measurements may be useful for higher statistical power. Association studies can result in either false-negative or false-positive findings because of limited sample size and population stratification bias. Control samples need to be well characterized and matched for population. Interaction effects of genetic variants could obscure single-variant effects, and could cause some of the inconsistent findings among studies that examined each individual marker independently. Future studies should strive to examine joint and interactive effects of the identified variants. Studies that investigate the familial transmission using transmission disequilibrium test in large samples may further help to clarify the role of these SNPs.
In summary, we performed a meta-analysis based on published candidate gene association studies of five GABA receptor genes (GABRB2, GABRA6, GABRA1, and GABRG2 on chromosome 5q and GABRA2 on 4p12) with AD, HD, and/or MD. Strong evidence of associations was found between GABRA2 and AD (P-values=9 × 10⁻⁶ and 4 × 10⁻⁵ for rs567926 and rs279858, respectively), between GABRG2 and dependence on alcohol and heroin (P=0. 0005 for rs211014), and between GABRA6 and AD (P=0.0002 for rs3219151) based on all of the combined candidate gene-based studies. When all of these existing data sets, including those from SAGE and our GWAS, were combined, the GABRA2 associations were also observed (for rs567926, P=7 × 10⁻⁵ (OR=1.18 (1.09, 1.29)) in all the studies, and P=8 × 10⁻⁶ (OR=1.25 (1.13, 1.38)) in Europeans; for rs279858, P=5 × 10⁻⁶ (OR=1.18 (1.1, 1.26)) in Europeans). The selected threshold of Bonferroni correction for multiple testing was 0.007 (it was 0.0035 considering the dominant and recessive models; however, the two models were not independent, and therefore, 0.0035 was thought to be too stringent). The statistical power analysis showed acceptable or high power, considering the observed allele frequencies (0.35–0.37) and ORs (around 1.2) of GABRA2 rs567926 and rs279858 (Supplementary Table 7). To our knowledge, this is the first meta-analysis between these GABA receptor genes and drug dependence. The results support the involvement of the brain GABA receptor gene, GABRA2, in the pathogenesis of AD. Further replications with larger samples are warranted.
FUNDING AND DISCLOSURE
Dr Henry Kranzler has been a consultant or advisory board member for the following pharmaceutical companies: Alkermes, Lilly, Lundbeck, Pfizer, and Roche. He is also a member of the American Society of Clinical Psychopharmacology's Alcohol Clinical Trials Initiative, which is supported by Lilly, Lundbeck, AbbVie, and Pfizer. The remaining authors declare no conflict of interest.
Acknowledgments
This work was supported by the research grants DA12690, DA12849, DA18432, RC2DA028909, DA030976, AA11330, AA12870, and AA017535 from the National Institutes of Health, and by the Start-up Fund from University of Vermont, USA. Some genotyping services were provided by the Center for Inherited Disease Research (CIDR). CIDR is fully funded through a federal contract from the National Institutes of Health to the Johns Hopkins University, contract number HHSN268200782096C. The Study of Addiction: Genetics and Environment (SAGE) described in this manuscript were obtained from the database of Genotypes and Phenotypes (dbGaP) through accession number phs000092.v1.p1. Funding support for SAGE was provided through U01 HG004422, U10 AA008401, P01 CA089392, R01 DA013423, and R01 DA019963. We also thank the reviewers and editor for providing helpful comments.
Footnotes
Supplementary Information accompanies the paper on the Neuropsychopharmacology website (http://www.nature.com/npp)
Electronic database information
Accession numbers and URLs for the data of the GABRB2, GABRA6, GABRA1, GABRG2, and GABRA2 genes in this article are as follows:
GenBank, http://www.ncbi.nlm.nih.gov/Genbank/ for genomic structure;
Online Mendelian Inheritance in Man (OMIM), http://www.ncbi.nlm.nih.gov/Omim;
Genotype data, http://www.hapmap.org/;
Genome data, http://genome.ucsc.edu/.
Supplementary Material
References
- Addolorato G, Leggio L, Hopf FW, Diana M, Bonci A. Novel therapeutic strategies for alcohol and drug addiction: focus on GABA, ion channels and transcranial magnetic stimulation. Neuropsychopharmacology. 2012;37:163–177. doi: 10.1038/npp.2011.216. [DOI] [PMC free article] [PubMed] [Google Scholar]
- Agrawal A, Edenberg HJ, Foroud T, Bierut LJ, Dunne G, Hinrichs AL, et al. Association of GABRA2 with drug dependence in the collaborative study of the genetics of alcoholism sample. Behav Genet. 2006;36:640–650. doi: 10.1007/s10519-006-9069-4. [DOI] [PubMed] [Google Scholar]
- American Psychiatric Association 1994Diagnostic and Statistical Manual of Mental Disorders (DSM)Fourth EditionAmerican Psychiatric Press: Washington, DC [Google Scholar]
- Barrett JC, Fry B, Maller J, Daly MJ. Haploview: analysis and visualization of LD and haplotype maps. Bioinformatics. 2005;21:263–265. doi: 10.1093/bioinformatics/bth457. [DOI] [PubMed] [Google Scholar]
- Bauer LO, Covault J, Harel O, Das S, Gelernter J, Anton R, et al. Variation in GABRA2 predicts drinking behavior in project MATCH subjects. Alcohol Clin Exp Res. 2007;31:1780–1787. doi: 10.1111/j.1530-0277.2007.00517.x. [DOI] [PMC free article] [PubMed] [Google Scholar]
- Bierut LJ. Genetic variation that contributes to nicotine dependence. Pharmacogenomics. 2007;8:881–883. doi: 10.2217/14622416.8.8.881. [DOI] [PubMed] [Google Scholar]
- Bierut LJ, Strickland JR, Thompson JR, Afful SE, Cottler LB. Drug use and dependence in cocaine dependent subjects, community-based individuals, and their siblings. Drug Alcohol Depend. 2008;95:14–22. doi: 10.1016/j.drugalcdep.2007.11.023. [DOI] [PMC free article] [PubMed] [Google Scholar]
- Boyle AP, Hong EL, Hariharan M, Cheng Y, Schaub MA, Kasowski M, et al. Annotation of functional variation in personal genomes using RegulomeDB. Genome Res. 2012;22:1790–1797. doi: 10.1101/gr.137323.112. [DOI] [PMC free article] [PubMed] [Google Scholar]
- Califano JA.2007. High Society: How Substance Abuse Ravages America and What to Do About It. PublicAffairs: New York City, New York, USA.
- Chang YT, Sun HS, Fann CS, Chang CJ, Liao ZH, Huang JL, et al. Association of the gamma-aminobutyric acid A receptor gene cluster with alcohol dependence in Taiwanese Han. Mol Psychiatry. 2002;7:828–829. doi: 10.1038/sj.mp.4001110. [DOI] [PubMed] [Google Scholar]
- Cossart R, Bernard C, Ben-Ari Y. Multiple facets of GABAergic neurons and synapses: multiple fates of GABA signalling in epilepsies. Trends Neurosci. 2005;28:108–115. doi: 10.1016/j.tins.2004.11.011. [DOI] [PubMed] [Google Scholar]
- Cossette P, Liu L, Brisebois K, Dong H, Lortie A, Vanasse M, et al. Mutation of GABRA1 in an autosomal dominant form of juvenile myoclonic epilepsy. Nat Genet. 2002;31:184–189. doi: 10.1038/ng885. [DOI] [PubMed] [Google Scholar]
- Covault J, Gelernter J, Hesselbrock V, Nellissery M, Kranzler HR. Allelic and haplotypic association of GABRA2 with alcohol dependence. Am J Med Genet B Neuropsychiatr Genet. 2004;129B:104–109. doi: 10.1002/ajmg.b.30091. [DOI] [PubMed] [Google Scholar]
- Covault J, Gelernter J, Jensen K, Anton R, Kranzler HR. Markers in the 5'-region of GABRG1 associate to alcohol dependence and are in linkage disequilibrium with markers in the adjacent GABRA2 gene. Neuropsychopharmacology. 2008;33:837–848. doi: 10.1038/sj.npp.1301456. [DOI] [PMC free article] [PubMed] [Google Scholar]
- Davies M. The role of GABAA receptors in mediating the effects of alcohol in the central nervous system. J Psychiatry Neurosci. 2003;28:263–274. [PMC free article] [PubMed] [Google Scholar]
- Davis KM, Wu JY. Role of glutamatergic and GABAergic systems in alcoholism. J Biomed Sci. 2001;8:7–19. doi: 10.1007/BF02255966. [DOI] [PubMed] [Google Scholar]
- DerSimonian R, Laird N. Meta-analysis in clinical trials. Control Clin Trials. 1986;7:177–188. doi: 10.1016/0197-2456(86)90046-2. [DOI] [PubMed] [Google Scholar]
- Dick DM, Edenberg HJ, Xuei X, Goate A, Hesselbrock V, Schuckit M, et al. No association of the GABAA receptor genes on chromosome 5 with alcoholism in the collaborative study on the genetics of alcoholism sample. Am J Med Genet B Neuropsychiatr Genet. 2005;132B:24–28. doi: 10.1002/ajmg.b.30058. [DOI] [PubMed] [Google Scholar]
- Dick DM, Plunkett J, Wetherill LF, Xuei X, Goate A, Hesselbrock V, et al. Association between GABRA1 and drinking behaviors in the collaborative study on the genetics of alcoholism sample. Alcohol Clin Exp Res. 2006;30:1101–1110. doi: 10.1111/j.1530-0277.2006.00136.x. [DOI] [PubMed] [Google Scholar]
- Duval S, Tweedie R. Trim and fill: a simple funnel-plot-based method of testing and adjusting for publication bias in meta-analysis. Biometrics. 2000;56:455–463. doi: 10.1111/j.0006-341x.2000.00455.x. [DOI] [PubMed] [Google Scholar]
- Edenberg HJ. The collaborative study on the genetics of alcoholism: an update. Alcohol Res Health. 2002;26:214–218. [PMC free article] [PubMed] [Google Scholar]
- Edenberg HJ, Dick DM, Xuei X, Tian H, Almasy L, Bauer LO, et al. Variations in GABRA2, encoding the alpha 2 subunit of the GABA(A) receptor, are associated with alcohol dependence and with brain oscillations. Am J Hum Genet. 2004;74:705–714. doi: 10.1086/383283. [DOI] [PMC free article] [PubMed] [Google Scholar]
- Egger M, Davey Smith G, Schneider M, Minder C. Bias in meta-analysis detected by a simple, graphical test. BMJ. 1997;315:629–634. doi: 10.1136/bmj.315.7109.629. [DOI] [PMC free article] [PubMed] [Google Scholar]
- Enoch MA, Hodgkinson CA, Yuan Q, Albaugh B, Virkkunen M, Goldman D. GABRG1 and GABRA2 as independent predictors for alcoholism in two populations. Neuropsychopharmacology. 2009;34:1245–1254. doi: 10.1038/npp.2008.171. [DOI] [PMC free article] [PubMed] [Google Scholar]
- Fehr C, Sander T, Tadic A, Lenzen KP, Anghelescu I, Klawe C, et al. Confirmation of association of the GABRA2 gene with alcohol dependence by subtype-specific analysis. Psychiatr Genet. 2006;16:9–17. doi: 10.1097/01.ypg.0000185027.89816.d9. [DOI] [PubMed] [Google Scholar]
- Foley PF, Loh EW, Innes DJ, Williams SM, Tannenberg AE, Harper CG, et al. Association studies of neurotransmitter gene polymorphisms in alcoholic Caucasians. Ann N Y Acad Sci. 2004;1025:39–46. doi: 10.1196/annals.1316.005. [DOI] [PubMed] [Google Scholar]
- Frank J, Cichon S, Treutlein J, Ridinger M, Mattheisen M, Hoffmann P, et al. Genome-wide significant association between alcohol dependence and a variant in the ADH gene cluster. Addict Biol. 2012;17:171–180. doi: 10.1111/j.1369-1600.2011.00395.x. [DOI] [PMC free article] [PubMed] [Google Scholar]
- Fu Q, Heath AC, Bucholz KK, Nelson E, Goldberg J, Lyons MJ, et al. Shared genetic risk of major depression, alcohol dependence, and marijuana dependence: contribution of antisocial personality disorder in men. Arch Gen Psychiatry. 2002;59:1125–1132. doi: 10.1001/archpsyc.59.12.1125. [DOI] [PubMed] [Google Scholar]
- Gelernter J, Kranzler HR. Genetics of alcohol dependence. Hum Genet. 2009;126:91–99. doi: 10.1007/s00439-009-0701-2. [DOI] [PMC free article] [PubMed] [Google Scholar]
- Gelernter J, Panhuysen C, Weiss R, Brady K, Hesselbrock V, Rounsaville B, et al. Genomewide linkage scan for cocaine dependence and related traits: significant linkages for a cocaine-related trait and cocaine-induced paranoia. Am J Med Genet B Neuropsychiatr Genet. 2005;136B:45–52. doi: 10.1002/ajmg.b.30189. [DOI] [PubMed] [Google Scholar]
- Gelernter J, Sherva R, Koesterer R, Almasy L, Zhao H, Kranzler H, et al. 2013Genome-wide association study of cocaine dependence and related traits: FAM53B identified as a risk gene Mol Psychiatry(advance online publication 20 August 2013;doi: 10.1038/mp.2013.99 [DOI] [PMC free article] [PubMed]
- Goldman D, Oroszi G, Ducci F. The genetics of addictions: uncovering the genes. Nat Rev Genet. 2005;6:521–532. doi: 10.1038/nrg1635. [DOI] [PubMed] [Google Scholar]
- Han DH, Bolo N, Daniels MA, Lyoo IK, Min KJ, Kim CH, et al. Craving for alcohol and food during treatment for alcohol dependence: modulation by T allele of 1519T>C GABAAalpha6. Alcohol Clin Exp Res. 2008;32:1593–1599. doi: 10.1111/j.1530-0277.2008.00734.x. [DOI] [PubMed] [Google Scholar]
- Heath AC, Whitfield JB, Martin NG, Pergadia ML, Goate AM, Lind PA, et al. A quantitative-trait genome-wide association study of alcoholism risk in the community: findings and implications. Biol Psychiatry. 2011;70:513–518. doi: 10.1016/j.biopsych.2011.02.028. [DOI] [PMC free article] [PubMed] [Google Scholar]
- Hsu YP, Seow SV, Loh EW, Wang YC, Chen CC, Yu JM, et al. Search for mutations near the alternatively spliced 8-amino-acid exon in the GABAA receptor gamma 2 subunit gene and lack of allelic association with alcoholism among four aboriginal groups and Han Chinese in Taiwan. Brain Res Mol Brain Res. 1998;56:284–286. doi: 10.1016/s0169-328x(98)00053-9. [DOI] [PubMed] [Google Scholar]
- Ittiwut C, Listman J, Mutirangura A, Malison R, Covault J, Kranzler HR, et al. Interpopulation linkage disequilibrium patterns of GABRA2 and GABRG1 genes at the GABA cluster locus on human chromosome 4. Genomics. 2008;91:61–69. doi: 10.1016/j.ygeno.2007.08.007. [DOI] [PMC free article] [PubMed] [Google Scholar]
- Ittiwut C, Yang BZ, Kranzler HR, Anton RF, Hirunsatit R, Weiss RD, et al. GABRG1 and GABRA2 variation associated with alcohol dependence in African Americans. Alcohol Clin Exp Res. 2012;36:588–593. doi: 10.1111/j.1530-0277.2011.01637.x. [DOI] [PMC free article] [PubMed] [Google Scholar]
- Kang JQ, Shen W, Macdonald RL. The GABRG2 mutation, Q351X, associated with generalized epilepsy with febrile seizures plus, has both loss of function and dominant-negative suppression. J Neurosci. 2009;29:2845–2856. doi: 10.1523/JNEUROSCI.4772-08.2009. [DOI] [PMC free article] [PubMed] [Google Scholar]
- Kendler KS, Myers J, Prescott CA. Specificity of genetic and environmental risk factors for symptoms of cannabis, cocaine, alcohol, caffeine, and nicotine dependence. Arch Gen Psychiatry. 2007;64:1313–1320. doi: 10.1001/archpsyc.64.11.1313. [DOI] [PubMed] [Google Scholar]
- Khan AJ, Ruwali M, Choudhuri G, Mathur N, Husain Q, Parmar D. Polymorphism in cytochrome P450 2E1 and interaction with other genetic risk factors and susceptibility to alcoholic liver cirrhosis. Mutat Res. 2009;664:55–63. doi: 10.1016/j.mrfmmm.2009.02.009. [DOI] [PubMed] [Google Scholar]
- Lappalainen J, Krupitsky E, Remizov M, Pchelina S, Taraskina A, Zvartau E, et al. Association between alcoholism and gamma-amino butyric acid alpha2 receptor subtype in a Russian population. Alcohol Clin Exp Res. 2005;29:493–498. doi: 10.1097/01.alc.0000158938.97464.90. [DOI] [PubMed] [Google Scholar]
- Li D, Collier DA, He L. Meta-analysis shows strong positive association of the neuregulin 1 (NRG1) gene with schizophrenia. Hum Mol Genet. 2006;15:1995–2002. doi: 10.1093/hmg/ddl122. [DOI] [PubMed] [Google Scholar]
- Li D, Zhao H, Gelernter J. Strong association of the alcohol dehydrogenase 1B gene (ADH1B) with alcohol dependence and alcohol-induced medical diseases. Biol Psychiatry. 2011;70:504–512. doi: 10.1016/j.biopsych.2011.02.024. [DOI] [PMC free article] [PubMed] [Google Scholar]
- Li T, Liu X, Zhao J, Hu X, Ball DM, Loh el W, et al. Allelic association analysis of the dopamine D2, D3, 5-HT2A, and GABA(A)gamma2 receptors and serotonin transporter genes with heroin abuse in Chinese subjects. Am J Med Genet. 2002;114:329–335. doi: 10.1002/ajmg.10200. [DOI] [PubMed] [Google Scholar]
- Lin SK, Chen CK, Ball D, Liu HC, Loh EW. Gender-specific contribution of the GABA(A) subunit genes on 5q33 in methamphetamine use disorder. Pharmacogenomics J. 2003;3:349–355. doi: 10.1038/sj.tpj.6500203. [DOI] [PubMed] [Google Scholar]
- Lind PA, Macgregor S, Agrawal A, Montgomery GW, Heath AC, Martin NG, et al. The role of GABRA2 in alcohol dependence, smoking, and illicit drug use in an Australian population sample. Alcohol Clin Exp Res. 2008;32:1721–1731. doi: 10.1111/j.1530-0277.2008.00768.x. [DOI] [PMC free article] [PubMed] [Google Scholar]
- Loh EW, Higuchi S, Matsushita S, Murray R, Chen CK, Ball D. Association analysis of the GABA(A) receptor subunit genes cluster on 5q33-34 and alcohol dependence in a Japanese population. Mol Psychiatry. 2000;5:301–307. doi: 10.1038/sj.mp.4000719. [DOI] [PubMed] [Google Scholar]
- Loh EW, Smith I, Murray R, McLaughlin M, McNulty S, Ball D. Association between variants at the GABAAbeta2, GABAAalpha6 and GABAAgamma2 gene cluster and alcohol dependence in a Scottish population. Mol Psychiatry. 1999;4:539–544. doi: 10.1038/sj.mp.4000554. [DOI] [PubMed] [Google Scholar]
- Loh EW, Tang NL, Lee DT, Liu SI, Stadlin A. Association analysis of GABA receptor subunit genes on 5q33 with heroin dependence in a Chinese male population. Am J Med Genet B Neuropsychiatr Genet. 2007;144B:439–443. doi: 10.1002/ajmg.b.30429. [DOI] [PubMed] [Google Scholar]
- Luscher C, Malenka RC. Drug-evoked synaptic plasticity in addiction: from molecular changes to circuit remodeling. Neuron. 2011;69:650–663. doi: 10.1016/j.neuron.2011.01.017. [DOI] [PMC free article] [PubMed] [Google Scholar]
- Lydall GJ, Saini J, Ruparelia K, Montagnese S, McQuillin A, Guerrini I, et al. Genetic association study of GABRA2 single nucleotide polymorphisms and electroencephalography in alcohol dependence. Neurosci Lett. 2011;500:162–166. doi: 10.1016/j.neulet.2011.05.240. [DOI] [PubMed] [Google Scholar]
- McLean PJ, Farb DH, Russek SJ. Mapping of the alpha 4 subunit gene (GABRA4) to human chromosome 4 defines an alpha 2-alpha 4-beta 1-gamma 1 gene cluster: further evidence that modern GABAA receptor gene clusters are derived from an ancestral cluster. Genomics. 1995;26:580–586. doi: 10.1016/0888-7543(95)80178-o. [DOI] [PubMed] [Google Scholar]
- Nestler EJ. Is there a common molecular pathway for addiction. Nat Neurosci. 2005;8:1445–1449. doi: 10.1038/nn1578. [DOI] [PubMed] [Google Scholar]
- Nishiyama T, Ikeda M, Iwata N, Suzuki T, Kitajima T, Yamanouchi Y, et al. Haplotype association between GABAA receptor gamma2 subunit gene (GABRG2) and methamphetamine use disorder. Pharmacogenomics J. 2005;5:89–95. doi: 10.1038/sj.tpj.6500292. [DOI] [PubMed] [Google Scholar]
- Olfson E, Bierut LJ. Convergence of genome-wide association and candidate gene studies for alcoholism. Alcohol Clin Exp Res. 2012;36:2086–2094. doi: 10.1111/j.1530-0277.2012.01843.x. [DOI] [PMC free article] [PubMed] [Google Scholar]
- Onori N, Turchi C, Solito G, Gesuita R, Buscemi L, Tagliabracci A. GABRA2 and alcohol use disorders: no evidence of an association in an Italian case-control study. Alcohol Clin Exp Res. 2010;34:659–668. doi: 10.1111/j.1530-0277.2009.01135.x. [DOI] [PubMed] [Google Scholar]
- Park CS, Park SY, Lee CS, Sohn JW, Hahn GH, Kim BJ. Association between alcoholism and the genetic polymorphisms of the GABAA receptor genes on chromosome 5q33-34 in Korean population. J Korean Med Sci. 2006;21:533–538. doi: 10.3346/jkms.2006.21.3.533. [DOI] [PMC free article] [PubMed] [Google Scholar]
- Pierucci-Lagha A, Gelernter J, Chan G, Arias A, Cubells JF, Farrer L, et al. Reliability of DSM-IV diagnostic criteria using the semi-structured assessment for drug dependence and alcoholism (SSADDA) Drug Alcohol Depend. 2007;91:85–90. doi: 10.1016/j.drugalcdep.2007.04.014. [DOI] [PMC free article] [PubMed] [Google Scholar]
- Pritchard JK, Stephens M, Rosenberg NA, Donnelly P. Association mapping in structured populations. Am J Hum Genet. 2000;67:170–181. doi: 10.1086/302959. [DOI] [PMC free article] [PubMed] [Google Scholar]
- Radel M, Vallejo RL, Iwata N, Aragon R, Long JC, Virkkunen M, et al. Haplotype-based localization of an alcohol dependence gene to the 5q34 {gamma}-aminobutyric acid type A gene cluster. Arch Gen Psychiatry. 2005;62:47–55. doi: 10.1001/archpsyc.62.1.47. [DOI] [PubMed] [Google Scholar]
- Reich T, Edenberg HJ, Goate A, Williams JT, Rice JP, Van Eerdewegh P, et al. Genome-wide search for genes affecting the risk for alcohol dependence. Am J Med Genet. 1998;81:207–215. [PubMed] [Google Scholar]
- Sander T, Ball D, Murray R, Patel J, Samochowiec J, Winterer G, et al. Association analysis of sequence variants of GABA(A) alpha6, beta2, and gamma2 gene cluster and alcohol dependence. Alcohol Clin Exp Res. 1999;23:427–431. [PubMed] [Google Scholar]
- Soyka M, Preuss UW, Hesselbrock V, Zill P, Koller G, Bondy B. GABA-A2 receptor subunit gene (GABRA2) polymorphisms and risk for alcohol dependence. J Psychiatr Res. 2008;42:184–191. doi: 10.1016/j.jpsychires.2006.11.006. [DOI] [PubMed] [Google Scholar]
- Sunyaev S, Ramensky V, Koch I, Lathe W, 3rd, Kondrashov AS, Bork P. Prediction of deleterious human alleles. Hum Mol Genet. 2001;10:591–597. doi: 10.1093/hmg/10.6.591. [DOI] [PubMed] [Google Scholar]
- True WR, Xian H, Scherrer JF, Madden PA, Bucholz KK, Heath AC, et al. Common genetic vulnerability for nicotine and alcohol dependence in men. Arch Gen Psychiatry. 1999;56:655–661. doi: 10.1001/archpsyc.56.7.655. [DOI] [PubMed] [Google Scholar]
- Wang JC, Foroud T, Hinrichs AL, Le NX, Bertelsen S, Budde JP, et al. A genome-wide association study of alcohol-dependence symptom counts in extended pedigrees identifies C15orf53. Mol Psychiatry. 2013;18:1218–1224. doi: 10.1038/mp.2012.143. [DOI] [PMC free article] [PubMed] [Google Scholar]
- Weiner JL, Valenzuela CF. Ethanol modulation of GABAergic transmission: the view from the slice. Pharmacol Ther. 2006;111:533–554. doi: 10.1016/j.pharmthera.2005.11.002. [DOI] [PubMed] [Google Scholar]
- Woolf B. On estimating the relation between blood group and disease. Ann Hum Genet. 1955;19:251–253. doi: 10.1111/j.1469-1809.1955.tb01348.x. [DOI] [PubMed] [Google Scholar]
- Xian H, Scherrer JF, Grant JD, Eisen SA, True WR, Jacob T, et al. Genetic and environmental contributions to nicotine, alcohol and cannabis dependence in male twins. Addiction. 2008;103:1391–1398. doi: 10.1111/j.1360-0443.2008.02243.x. [DOI] [PubMed] [Google Scholar]
- Xu Z, Taylor JA. SNPinfo: integrating GWAS and candidate gene information into functional SNP selection for genetic association studies. Nucleic Acids Res. 2009;37 (Web Server issue:W600–W605. doi: 10.1093/nar/gkp290. [DOI] [PMC free article] [PubMed] [Google Scholar]
- Zintzaras E. Gamma-aminobutyric acid A receptor, alpha-2 (GABRA2) variants as individual markers for alcoholism: a meta-analysis. Psychiatr Genet. 2012;22:189–196. doi: 10.1097/YPG.0b013e328353ae53. [DOI] [PubMed] [Google Scholar]
Associated Data
This section collects any data citations, data availability statements, or supplementary materials included in this article.