

Abstract
Background
The production of biofuels in photosynthetic microalgae and cyanobacteria is a promising alternative to the generation of fuels from fossil resources. To be economically competitive, producer strains need to be established that synthesize the targeted product at high yield and over a long time. Engineering cyanobacteria into forced fuel producers should considerably interfere with overall cell homeostasis, which in turn might counteract productivity and sustainability of the process. Therefore, in-depth characterization of the cellular response upon long-term production is of high interest for the targeted improvement of a desired strain.
Results
The transcriptome-wide response to continuous ethanol production was examined in Synechocystis sp. PCC6803 using high resolution microarrays. In two independent experiments, ethanol production rates of 0.0338% (v/v) ethanol d-1 and 0.0303% (v/v) ethanol d-1 were obtained over 18 consecutive days, measuring two sets of biological triplicates in fully automated photobioreactors. Ethanol production caused a significant (~40%) delay in biomass accumulation, the development of a bleaching phenotype and a down-regulation of light harvesting capacity. However, microarray analyses performed at day 4, 7, 11 and 18 of the experiment revealed only three mRNAs with a strongly modified accumulation level throughout the course of the experiment. In addition to the overexpressed adhA (slr1192) gene, this was an approximately 4 fold reduction in cpcB (sll1577) and 3 to 6 fold increase in rps8 (sll1809) mRNA levels. Much weaker modifications of expression level or modifications restricted to day 18 of the experiment were observed for genes involved in carbon assimilation (Ribulose bisphosphate carboxylase and Glutamate decarboxylase). Molecular analysis of the reduced cpcB levels revealed a post-transcriptional processing of the cpcBA operon mRNA leaving a truncated mRNA cpcA* likely not competent for translation. Moreover, western blots and zinc-enhanced bilin fluorescence blots confirmed a severe reduction in the amounts of both phycocyanin subunits, explaining the cause of the bleaching phenotype.
Conclusions
Changes in gene expression upon induction of long-term ethanol production in Synechocystis sp. PCC6803 are highly specific. In particular, we did not observe a comprehensive stress response as might have been expected.
Keywords: Biofuel, Cyanobacteria, Ethanol production, Synechocystis, Metabolic engineering, Synthetic biology, Transcription
Background
Cyanobacteria are considered to be important and promising resources for the production of biofuels, such as hydrogen [1], ethanol [2], isobutyraldehyde and isobutanol [3], ethylene [4], volatile isoprene hydrocarbons [5] and alkanes [6]. Several commercial companies have begun working toward the metabolic remodeling of genetically modified cyanobacteria [7]. To achieve economically feasible production rates, the following two goals need to be addressed: (i) the yield of the intended product is to be maximized, and (ii) the producer strains should be of considerable robustness to tolerate the product, which is frequently alien to their metabolism.
Indeed, genetic instability and the onset of severe stress responses have been reported. Thus far, two unicellular model strains of cyanobacteria have mainly been used in these studies, Synechococcus sp. PCC7942 and Synechocystis sp. PCC6803 (from now on Synechocystis 6803). A depressed growth rate and a yellow-green phenotype interpreted as severe metabolic stress was reported for an ethylene-producing strain of Synechococcus sp. PCC7942 [4]. A substantial and unspecific general stress response was found upon the external application of ethanol both at proteome [8], as well as transcriptome level in Synechocystis 6803 [9].
To be meaningful for the optimization of biofuel production from cyanobacteria, the actual response to the internal production of a metabolite should be analyzed. Here we focused on an engineered strain of Synechocystis 6803, which synthesizes ethanol from pyruvate by the sequential activity of overexpressed pyruvate decarboxylase (PDC) from Zymomonas mobilis and alcohol dehydrogenase (ADH) from Synechocystis 6803. Employing high-resolution microarrays we identified a remarkably focused remodeling of the transcriptome in the course of 18 days of continuous ethanol production. The response included a discoordinated operon expression between the phycocyanin cpcB and cpcA genes, fully consistent with the observed bleaching phenotype.
Results
Characterization of Synechocystis 6803 upon long-term ethanol production
Engineering cyanobacteria to produce ethanol from pyruvate is accomplished by coupled overexpression of the cytosolic enzymes PDC and ADH. The synthesized ethanol further accumulates in the growth medium, most likely as a result of diffusion from the interior of the cells [2].
Appreciable intra- or extracellular ethanol concentrations, however, appear to be a rather unlikely stress parameter in the course of cyanobacterial evolution. Therefore, examination of long-term ethanol-related stress responses requires particular care with respect to experimental design and data validation. That is to minimize the chance of detecting non-ethanol effects resulting from imbalances in, for example, nutrient availability or physical parameters (pH, temperature, oxygen) that may arise upon long-term cultivation between producer and wild type. Therefore, and for accuracy of data validation and interpretation, two identical cultivation experiments were performed, comprising the ethanol producer strain #309 (Pr) and the empty vector control strain #621 (Co), each cultivated in triplicate in photobioreactors (PBRs). Temperature, pH and oxygen saturation of the cultures were monitored computationally using Crison MultiMeter units; CO2 supply was automatically controlled in dependence of the pH of the medium, which was thereby kept constant within the range between 7.25 and 7.35. As cultivation was performed in 12 h/12 h day/night cycles, samples were consistently taken at the same time point in the middle of the photoperiod, to exclude phase-dependent effects. RNA from cultivation A was used for microarray hybridization, whereas cultivation B was conducted as the validation run for northern blot hybridization, and where appropriate, protein analysis. Figure 1 provides an overview of the general growth parameters, demonstrating highly aligning growth dynamics between both cultivations. The measured increase of 1.08 ± 0.017 optical density at 750 nm (OD) units d-1 (cultivation A)/1.06 ± 0.010 OD units d-1 (cultivation B) for the control and 0.65 ± 0.021 OD units d-1 (cultivation A)/0.66 ± 0.085 OD units d-1 (cultivation B) for the producer strain indicates a significant (approximately 40%) defect in biomass accumulation in the producer strain.
Figure 1.
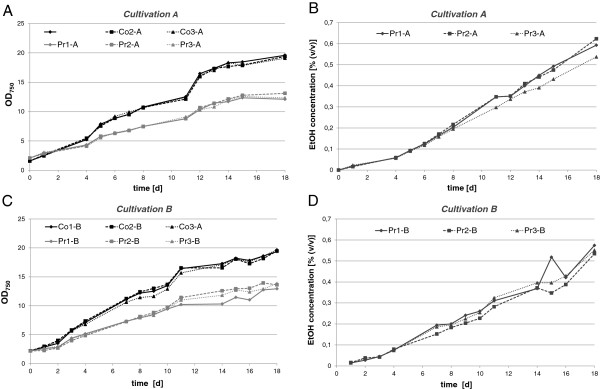
Growth and ethanol production of an ethanologenic Synechocystis 6803 strain (Pr) compared to the empty vector control strain (Co) over a period of 18 days in two independent cultivation experiments, A and B, and in three biological replicates each. (A) Growth curves of triplicate cultures during cultivation A. At time points 4 d, 7 d, 11 d and 18 d, samples were taken for RNA preparation and transcriptome analysis. (B) Accumulation of ethanol in the producer strain (Pr) during cultivation A in three biological replicates. (C) Growth curves of triplicate cultures during cultivation B. At time points 14 d and 18 d, samples were taken for northern and immunoblot analysis. (D) Accumulation of ethanol in the Pr during cultivation B in three biological replicates. Growth during cultivation A: Co, 1.08 ± 0.017 optical density (OD) units d-1; Pr, 0.65 ± 0.021 OD units d-1. Growth during cultivation B: Co, 1.06 ± 0.010 OD units d-1; Pr, 0.66 ± 0.085 OD units d-1. Production during cultivation A: Pr, 0.0338 ± 0.002% ethanol (EtOH) d-1. Production during cultivation B: Pr, 0.0303 ± 0.002% EtOH d-1.
The OD in the controls continued to increase during the whole course of the experiment at a steady pace (Figure 1A,C). An increase in OD was also observed for the ethanol producer strain but at a slower pace, and growth started to level off after approximately 2 weeks.
The production rates were quite similar in both Pr cultivations, with rates of 0.0338 ± 0.002% (v/v) EtOH d-1 (266.7 mg L-1 d-1) in cultivation A and 0.0303 ± 0.002% (v/v) EtOH d-1 (239.1 mg L-1 d-1) in cultivation B. These productivities were comparable to recently published data on a similar Synechocystis 6803 system (212 mg L-1 d-1; [10]) and several orders of magnitude higher than demonstrated for the pioneering Synechococcus PCC 7942 system (4.3 μg L-1 d-1; [2]).
Over 18 days of cultivation, an increase in ethanol concentration from 0% (v/v) to about 0.6% (v/v) was observed in the producer strains (Figure 1B,D), corresponding to a total yield of 4.7 g/L. Despite a visible and significant bleaching phenotype of strain Pr, the chlorophyll a (Chl a) content was nearly identical between the triplicates of ethanol producer and control strain in the early stages of cultivation (Figure 2A). However, between both strains differences in Chl a content rose strongly with increasing cultivation time, which is likely linked to the impaired growth of strain Pr, as indicated by the Chl/OD ratio depicted in Figure 2B and suggested downregulation of light-harvesting capacity.
Figure 2.
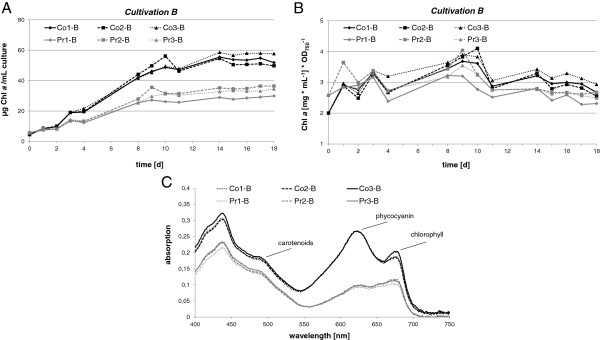
Pigment content of ethanol producer (Pr) compared to isogenic empty vector control strain (Co) from cultivation B in three biological replicates. (A) Chlorophyll content; (B) ratio between chlorophyll and optical density (OD)750 for each triplicate; (C) representative whole-cell absorption spectra at day 18 of the experiment.
These characteristics were clearly linked to the development of a bleaching phenotype.
Microarray analysis of ethanol producer strains
Samples were taken for RNA preparation and subsequent transcriptome analysis at day 4, 7, 11 and 18 of the experiment. Because we used a full transcriptome microarray designed on the basis of previous dRNAseq analysis [11] and the prediction of non-coding RNAs (ncRNAs) [12,13], we were able to measure the differential expression not only of mRNAs, but also of putative antisense RNAs (asRNAs) and ncRNAs in cultures continuously producing ethanol. The complete microarray dataset is accessible [GEO: GSE49552]. The transcripts exhibiting the strongest fold changes in their accumulation are summarized in Table 1. Given the strong phenotype and the fact that 8,887 separate features (mRNAs, UTRs, asRNAs, ncRNAs, internal sense transcripts) can be detected by this microarray, a surprisingly narrow reorganization of the transcriptome was detected (Table 1).
Table 1.
List of transcripts exhibiting the strongest fold changes in transcript accumulation in response to ethanol production (expressed as log 2 difference producer-control strain)
| (log 2 ) fold change | |||||
|---|---|---|---|---|---|
|
Annotation |
Gene function |
Day 4 |
Day 7 |
Day 11 |
Day 18 |
| slr1295-int1 futA1 |
Iron transport system (ferric ions) |
−1.10 |
−1.08 |
−0.34 |
−3.13 |
| slr1295-int3 futA1 |
Iron transport system (ferric ions) |
−1.06 |
−1.16 |
−0.38 |
−3.09 |
| sll1198-as1 trmD (3′ extension of futA1 transcript) |
tRNA (guanine-N1)-methyltransferase |
−1.00 |
−1.01 |
−0.26 |
−2.98 |
| sll0477-as2 |
Biopolymer transport ExbB-like protein |
−0.43 |
−0.86 |
0.67 |
−2.77 |
| sll1577 cpcB |
Phycocyanin beta subunit |
−1.97 |
−2.54 |
−2.16 |
−2.15 |
| slr1192 adhA* |
Alcohol dehydrogenase |
1.95 |
1.85 |
1.49 |
1.82 |
| NC-117 |
ncRNA ncl1390 |
0.10 |
0.25 |
0.83 |
1.93 |
| slr1418-int2 pyrD |
Dihydroorotate dehydrogenase |
1.05 |
0.34 |
−0.56 |
2.03 |
| NC-184 |
ncRNA ncl1740 |
0.22 |
0.12 |
−0.25 |
2.06 |
| sll1809 rps8 |
Ribosomal protein S8 |
1.46 |
1.81 |
1.44 |
2.59 |
| slr0254-as2 |
Hypothetical protein |
0.45 |
0.31 |
−0.22 |
2.72 |
| slr1897-5′UTR srrA** | Periplasmic sugar-binding protein of ABC transporter | 2.28 | 1.90 | 2.58 | 3.29 |
The list is ordered according to fold change at day 18, with transcripts repressed in the upper part and those induced during ethanol production in the lower part. For comparison, values from all four time points are shown but only three mRNAs (cpcB, adhA and rps8) exhibited strong fold changes throughout the course of the experiment. int, gene internal transcript; as, detected transcript is in antisense orientation to mentioned gene. *Overexpressed in producer strain; **part of petJ promoter fragment used for overexpression of adhA.
When applying a log2 fold-change limit of 0.9 across all time points, a total of 31 mRNAs showed differential accumulation between the producer and control strain. Among them, 17 were negatively affected by ethanol production, whereas 14 mRNAs were positively regulated. A considerable subset of regulated genes appears to be related to the ribosomes and photosynthesis. The Venn diagram in Figure 3 indicates only very few overlaps of regulated mRNAs between the four examined time points, whereas the most numerous and the strongest differences were observed at the late cultivation phase, particularly at day 18. However, three mRNAs (adhA, rps8 and cpcB) showed significantly altered levels at all time points, further exhibiting the strongest changes among all mRNAs. Furthermore, the transcript encoding a further ribosomal subunit, rpl28, exhibited significantly enhanced levels in the producer compared to the wild type (WT) in the progressed (day 11; log2 fold change (FC) + 1.14) to late (day 18; log2 FC + 1.19) cultivation phase. Moreover, the mRNA levels for photosystem I subunit PsaC were significantly decreased at day 11 and day 18 in the producer (log2 FC −0.92 and −1.15, respectively).
Figure 3.
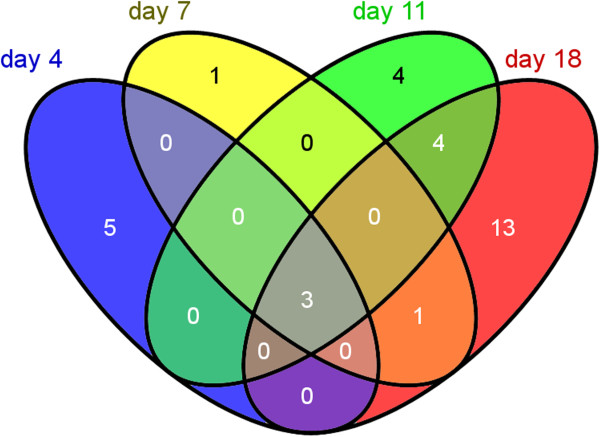
Overlaps between significantly regulated (log2 fold change >0.7 between control and producer strain) mRNAs between the four time points. The numbers of mRNAs are indicated. Only the transcripts of adhA, rps8 and cpcB (center) showed significantly altered levels at all time points. Further details are listed in Table 1. The complete set of microarray data is presented in Additional file 1.
At day 18, when the strongest differences were observed between producer and control strains, only ten features exhibited an at least four-fold change in transcript accumulation (Table 1). Among the most strongly induced genes compared to WT were rps8 (sll1809), encoding the ribosomal protein S8 with a log2 FC of +2.59 at day 18 (Figure 4), compared to a value of +1.82 for the adhA (slr1192) gene, which encodes the ADH [14] that was used here for overexpression. Among the most strongly repressed genes compared to the WT were cpcB (sll1577), encoding the phycocyanin beta subunit of the phycobilisome with a log2 FC of −2.15 (Figure 4) and futA2 (idiA, slr0513), encoding the iron transport system substrate-binding protein with a log2 FC of −1.61. Interestingly, there were several disparately regulated ncRNAs, for instance ncl1740 (NC-184) and ncl1390 (NC-117) with a log2 FC of +2.06 and +1.92, respectively. Among the ncRNAs accumulating at day 18 to a higher level in the control was ncl1600 (NC-181) with a log2 FC of −1.43. The exact function of none of these ncRNAs is known, but we noticed previously that ncl1600 (NC-181) is the top most-induced ncRNA under iron limitation [15]. Therefore, transcripts such as NC-181 and futA2 rather indicate a beginning iron limitation in the control rather than a specific response in the producer strains. Another set of genes repressed in the producer strain encode subunits of photosystem I, psaC and psaK1 with a log2 FC up to −1.15 at day 18.
Figure 4.
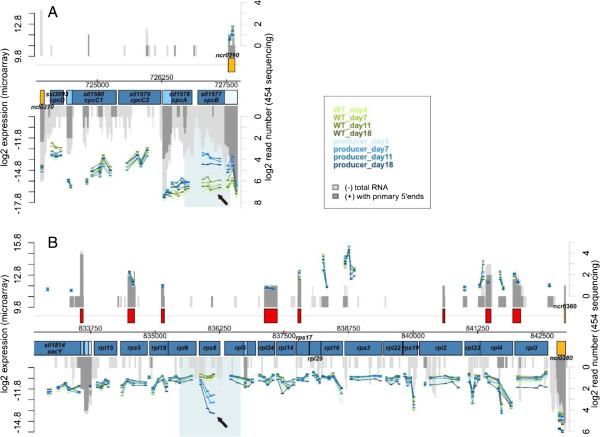
Detail of gene expression analysis (microarrays) in Synechocystis 6803 producer and isogenic control strains (wild type) 4 days (time point t1), 7 days (t2), 11 days (t3) and 18 days (t4) after start of the experiment. (A) The genome section containing the phycocyanin operon cpcBAC2C1D is shown. The location of annotated genes is indicated by the blue boxes. The numbers of RNAseq reads from previous transcriptome analyses under standard conditions [11] are plotted for comparison (dark grey, primary reads; light grey, secondary reads). The normalized log2 expression values obtained by microarray analyses (normalized expression of biological duplicates A1 and A2 in two technical duplicates each) are plotted for each probe as bars in blue (producer A1 and A2, with increasing colour intensity from to to t4) or green (control incubation, with increasing colour intensity from to to t4). The scale for the microarray data is given at the left y-axis. Under ethanol biosynthesis conditions, cpcB– related transcripts decrease in abundance (black arrow). (B) Genome section containing the ribosomal protein operon (genes rpl3-4-23-2-rps19-rpl22-rps3-rpl16-29-rps17-rpl14-24-5-rps8-rpl6-18-rps5-rpl15). Under ethanol biosynthesis conditions, rps8–related transcripts increase as indicated by the arrow. WT, wild type.
An overview on the most strongly responding transcripts has been compiled in Table 1. The complete set of microarray data is visualized in Additional file 1 and can be downloaded from the database [GEO: GSE49552].
Ethanol production induces discoordinated expression of the cpcBA operon
The expression of phycobiliprotein genes in cyanobacteria is well investigated. Transcription of the cpcBAC2C1D operon in Synechocystis 6803 starts from a single major transcriptional start site (TSS) at position −253 with regard to the start codon of cpcB[11]. However, the mRNA accumulation level of cpcBA, the first two genes in the operon, was clearly higher in the wild type than for cpcC2C1D, suggesting possible regulation by imperfect termination of transcription 3′ to cpcA (Figure 4A). Under ethanol-producing conditions specific downregulation of cpcB but not cpcA occurred as revealed by the microarray results shown in Figure 4. Also the remaining operon appeared to be transcribed in a rather unchanged way. As transcription of this operon occurs from a TSS-mapped upstream of cpcB, it appeared puzzling how the mRNA for this gene could decrease, whereas the mRNA levels of the genes located downstream of cpcB in this operon remained stable. The search for an additional TSS upstream of cpcA, possibly linked to a cryptic promoter activated under ethanol-producing conditions was not successful. However, the analysis of transcript accumulation by northern blot analysis using a cpcA-specific probe not only verified the microarray data but also demonstrated the accumulation of a monocistronic cpcA-specific mRNA (cpcA*) not observed before (Figure 5).
Figure 5.

Differential accumulation of the transcripts cpcBA and cpcA* in the ethanol producer (Pr) and non-producer control strains (Co) of Synechocystis 6803, after 14 or 18 days of cultivation in Crison photobioreactors. For loading control, blots were hybridized with a probe against the 16S rRNA.
In order to investigate the possibility of differential transcription of cpcA* from a hitherto undescribed alternative promoter, comparative 5′RACE analysis was conducted, using total RNA from producer and control strains as separate templates. This analysis yielded a 5′ end located 40 nt downstream of the cpcA start codon. As cpcA* is lacking the start codon it cannot become translated to give rise to the phycocyanin α subunit, but is very likely non-functional as an mRNA. As the signal leading to this result was not enhanced by treatment of the RNA with tobacco acid pyrophosphatase (TAP) (not shown), it could not result from activation of an unknown TSS but from the cleavage of a longer transcript. We propose therefore that the differential accumulation of cpcB and cpcA transcripts resulted from a post-transcriptional processing event leading to the strong reduction in cpcB mRNA level and the accumulation of a 5′ truncated cpcA mRNA, called here cpcA*. Western blot analysis as well as zinc-enhanced bilin fluorescence further demonstrated distinctly lower accumulation of the phycocyanin subunits alpha and beta in the EtOH-producing strains compared to the control (Figure 6). We conclude that the observed specific processing of the cpcBA mRNA led to the strongly reduced levels of alpha and beta phycocyanin subunits and was likely causative of the reduction in the light harvesting apparatus observed on spectroscopy (Figure 2).
Figure 6.

Reduced accumulation of α phycocyanin in the producer (Pr1-3) in comparison to the control strain (Co1-3). (A) Soluble protein extract (3 μg) from three replicate cultures for each strain were separated using a 16% Tricine-SDS polyacrylamide gel containing urea (upper panel) and subjected to western blot analysis (lower panel) using a phycocyanin-specific antibody [16]. (B) Zinc fluorescence of covalently attached bilins visualized on a UV transilluminator in a 16% Tricine-SDS gel. Molecular masses inferred from protein marker VI, (M; AppliChem, Darmstadt, Germany) are shown on the right. The samples were prepared at day 14 of the experiment.
Ethanol production induces the transcription of a small part of a ribosomal gene cluster
One of the most prominent differences detected in the microarray analysis was the accumulation of a specific transcript within a large operon of around 9 kb encoding 18 different ribosomal proteins (genes sll1799-sll1813, ssl3432, ssl3436 and ssl3437; rpl3-4-23-2-rps19-rpl22-rps3-rpl16-29-rps17-rpl14-24-5-rps8-rpl6-18-rps5-rpl15). This operon is followed by the secY gene, similar to the situation in Escherichia coli, where it is part of the spc operon of ribosomal proteins [17]. The major TSS of this operon in Synechocystis 6803 is located 337 nt upstream of the rpl3 gene [11], whereas the secY gene is transcribed from a separate TSS. Here, we detected with three out of four microarray probes covering the rps8 gene a significantly higher transcript accumulation in the producer strain than in the control (Figure 4B; log2 fold changes between 1.44 and 2.59, Table 1). Northern blot analysis using a single-stranded RNA probe against the rps8 mRNA detected a transcript of about 350 nt. Its 5′ end was located by 5′RACE to a small window 91 to 96 nt upstream of the rps8 start codon, close to the stop codon of the preceding gene rpl5 (Figure 7). The rps8 gene itself is 402 bp long, suggesting that the specific transcript that accumulates in the producer strain, called here rps8*, does not cover the open reading frame (ORF) over its entire length. Indeed, in the microarray analysis the 3′ end of rps8 mRNA seems not to accumulate to a higher level during ethanol production (Figure 4B). Thus, rps8* is not competent for the synthesis of a full-length Rps8 protein.
Figure 7.
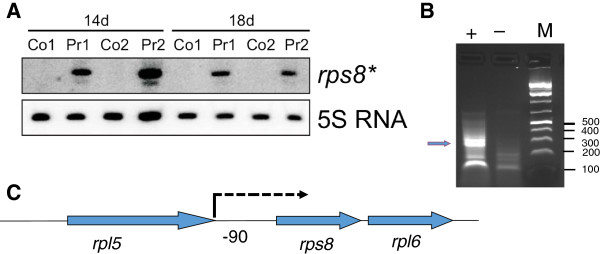
Accumulation of rps8*, an internal transcript within the rps8/spc operon covering part of the rps8 gene and the rpl5-rps8 intergenic spacer. (A) Accumulation of rps8* in the ethanol producer (Pr1 and Pr2) but not in the control strain (Co1 and Co2) after 14 and 18 days of cultivation in Crison photobioreactors. Total RNA was isolated from duplicate cultures, blotted and hybridized with a strand-specific RNA probe antisense to the rps8 sequence. For loading control, blots were hybridized with a probe against the 5S rRNA. (B) 5′RACE mapping of rps8* 5′ ends revealed an initiation of transcription 91 to 96 nt upstream of the rps8 start codon; plus sign (+) indicates treatment of RNA samples with tobacco acid pyrophosphatase; minus sign (−) indicates mock treatment. The bands excised for cloning and sequence analysis is indicated by the arrow. (C) Location of rps8* (arrow) within the rps8/spc operon.
Discussion
The generation of microbial producer strains for the sustainable and economically feasible production of biofuels through photosynthetic processes is considered a challenging topic of research. Here we used a full transcriptome microarray developed on the basis of previous RNAseq and dRNAseq analyses [11] for the model cyanobacterium Synechocystis 6803. In contrast to previous studies in which a massive stress response was reported upon the external application of ethanol [8,9] we used a producer strain in which the ethanol was produced by an intracellular metabolic process. Our results demonstrate the host response on the internal ethanol synthesis to be unexpectedly narrow. In contrast to a comprehensive stress response, we identified mainly minor changes in transcript levels.
We detected a post-transcriptional regulatory component, involving a previously unknown RNA processing event in the cpcBA operon, leading to the generation of a truncated version of the cpcA transcript (cpcA*) by cleavage of the longer transcript at a specific position. According to its sequence, cpcA* is most likely not coding for a protein as it is 5′-truncated with regard to the cpcA reading frame and is interrupted by multiple stop codons in the other two reading frames. Discoordinated operon expression is frequently linked to the activity of regulatory small RNAs [18,19]. Recently, the successful metabolic engineering of E. coli was reported using synthetic small regulatory RNAs [20]. However, a native process that induces specific processing of the cpcBA operon mRNA and is leading to a translational nonfunctional cpcA* transcript is currently not known, nor is the possible function of cpcA*.
The second truncated mRNA that appeared specific for the ethanologenic conditions was rps8*. The protein Rps8 plays a major role in assembly of the 30S ribosomal subunit through interaction with 16S rRNA [21] as well as in the autoregulatory control of ribosomal protein expression from the spc operon in E. coli[22-24]. Although this operon is much longer in Synechocystis 6803 (effectively constituting a fusion of the S10 and spc operons known from enterobacteria), it is tempting to speculate that it plays a regulatory role as well. If so, the preceding intergenic spacer appears conspicuous with its length of 91 nt being by far the longest spacer in this 18-gene operon and constituting the 5′ UTR of rps8. One could speculate that this long 5′ UTR is the autoregulatory target of Rps8 in Synechocystis 6803 and that rps8* serves as competitive binding partner for surplus Rps8 subunits, in this way bypassing the default mechanism for autoregulatory control and allowing further Rps8 production.
In addition to the strongly responding mRNAs for rps8 and cpcB, analyzed here in more detail, in total 240 transcripts were identified that showed mainly minor, but significant expression changes at some point during the experiment. Among these transcripts are many newly discovered transcripts not coding for protein. Some of these transcripts might be regulated by promoters that become induced or repressed at different stages of the production process. Therefore, this dataset can be used in conjunction with our previous genome-wide mapping of TSS [11] to construct expression cassettes that become active or repressed during different stages of the ethanol producing process.
Conclusions
High ethanol production rates were obtained in engineered strains of Synechocystis 6803 over 18 consecutive days in fully automated PBRs. The physiological effects of high ethanol production include a delay in biomass accumulation, downregulation of light-harvesting capacity and the development of a bleaching phenotype. Microarray-based RNA profiling revealed a highly specific stress response, involving differential accumulation levels of only 31 mRNAs and a small number of non-coding RNAs. The molecular basis for the observed physiological effects of ethanol overproduction consists of a specific RNA processing event in the major light-harvesting operon encoding the phycocyanin subunits α and β. Thus, the molecular responses of engineered cyanobacteria upon sustained ethanol production are specific and appear well manageable for desired long-term cultivation.
Materials and methods
Culture media and growth conditions
The ethanologenic Pr strain #309 of Synechocystis 6803 and the isogenic wild-type Co strain #621 were cultivated in triplicate for 19 days in optimized PBRs containing 0.5 L BG11 medium [25] supplemented with 2 mM TES, 35 g/L instant-ocean seawater salts (Aquarium Systems Inc., France) and 10 μg/mL gentamycin. The lid was fitted with ports for incoming pH-, dissolved oxygen- and temperature-sensors as well as sampling ports and connections to in- and out-gas. Dissolved oxygen, pH and temperature were monitored by three-channel MultiMeter 44 devices (Crison Instruments, S. A., Barcelona, Spain). Cells were grown under day-night cycle conditions with a 12-h photoperiod. The light intensity was successively adapted to the increasing cell density (approximately 100 μmol photons m-2 s-1 per OD750 unit) and reached a maximum value of 1,000 μmol photons m-2 s-1. The culture temperature was controlled in a day-night cycle with 35°C daytime and 25°C night-time temperature. During the 12-h photoperiod, the liquid phase was discontinuously aerated with CO2-enriched air (10% CO2), pH-dependent and computer-controlled. At a culture pH above 7.35, the aeration started and incoming air flow ceased at a pH below 7.25. There was no aeration of the culture at night. Cells were constantly mixed by stirring with a magnetic stir bar (7 cm length) at 250 rpm. Samples from discrete stages of cultivation were subsequently subjected to microarray (transcriptome) analysis. Furthermore, growth, ethanol accumulation and pigment profiles were monitored over the cultivation period.
Induction of ethanol synthesis from the petJ promoter in #309 was triggered by centrifugation and resuspension of pre-cultures in copper-free medium. Thereby, pre-cultures of OD750 = 7 to 8 were diluted to a final OD750 of 2 (equivalent to about 10 mg chlorophyll * L-1) and subsequently divided into triplicates. In order to maintain maximal ethanol production, nutrient limitations were counter-steered by proportionate supplementation of a 100× nutrient concentrate when the nitrate concentration was below 50% of the BG11 concentration (determined with Quantofix Nitrate/Nitrite, Macherey-Nagel, Düren, Germany).
Ethanol producer strain and quantification of ethanol accumulation
For generation of the ethanologenic strain #309, initially the dicistronic pdc-adhII cassette was EcoRI/BamHI cut from plasmid pCB4-LR(TF)pa [2] and fused at its 5′ end (via EcoRI) to the promoter PpetJ from Synechocystis 6803. The Z. mobilis adhII gene was replaced by the AdhA-encoding ORF slr1192 from Synechocystis 6803 (synADH) via SacI/PstI. In the final construct [see Additional file 2], the ethanologenic cassette is integrated via SalI/ PstI into the self-replicating plasmid pVZ325, which is a derivative of pVZ321 [26] with an additional spectinomycin/streptomycin (Sp/Sm) resistance cassette (from pRL277 [27]), introduced into the XbaI site (resulting in pVZ321B) and a gentamycin (Gm) resistance cassette (from pVZ322 [26]), replacing the original kanamycin resistance cassette via ClaI/ XhoI. Plasmid pVZ325 was used for generating the empty-vector-control strain #621.
Primers used for cloning were:
synADH-fw: 5′-ATGAGCTCTCTGGATAAAACTAATAAAC -3′
synADH-rev: 5′- ATCTGCAGATCGAATGTCAAGCTTTCC -3′
PpetJ-fw: 5′- GTCGACGGGAATTGCTCTGGCAAC -3′
PpetJ-rev: 5′- GAATTCATTAGTTCTCCTTTCAAGG -3′
Gm-fw: 5′- ATCGATGCTCGAATTGACATAAGC -3′
Gm-rev: 5′- ATCGATGCTCGAATTGACATAAGC -3′
Quantification of ethanol in the liquid phase was accomplished by head-space gas chromatography (GC) using a Shimadzu GC-20104 gas chromatograph, with a medium-bore capillary column (FS-CS-624, length 30 m; I.D. 0.32 mm; film 1.8 μm; Chromatographie Service GmbH, Germany) and a flame ionization detector (FID). For analysis, 0.5 mL of culture were transferred into 20-mL GC vials for headspace autosampling (Shimadzu PAL LHS2-SHIM/AOC-5000) with screwed silicone-septum caps. For generation of a calibration curve, 0.5 mL calibrator solutions of 0.0125, 0.025, 0.059, 0.5, 1.0, 2.0, 3.0, 4.0, 5.0 and 10.0 mg*mL-1 ethanol were measured.
Absorption spectra and determination of the chlorophyll content
Absorption spectra of whole cells were recorded using an UV-2450 PC UV–vis spectrophotometer (Shimadzu Deutschland GmbH, Duisburg, Germany). Chlorophyll contents were measured by spectrophotometry after extraction in 90% methanol [28].
RNA preparation and northern blot hybridization
Samples from discrete stages of cultivation (as labelled in Figure 1) in PBRs were immediately quenched on ice and spun down at 0°C. RNA isolation and northern blot hybridization were performed essentially as described previously [29]. For analysis of the approximately 300-nt rps8 transcript, total RNA was separated by electrophoresis using urea-polyacrylamide gels (8% acrylamide-bisacrylamide, 19:1; 8.3 M urea; 1× TBE (Tris-Borate-EDTA buffer) and transferred to nylon+ membranes using the Trans-Blot SD Semi-Dry Electrophoretic Transfer Cell (Biorad, Munich, Germany). The RNA probe for detection of rps8-specific transcripts was prepared using in vitro transcription with the MAXIscript kit (Invitrogen, Darmstadt, Germany) from a T7 promoter containing PCR fragment, which was amplified with the primer pair rps8-S-for 5′-ATGGCTTCAACAGACACAATTTC-3′ and T7-rps8-S-rev 5′-TAATACGACTCACTATAGGGACCAAATGTAACAAAGGAT-3′. The respective probe for the detection of cpcA transcripts was generated using the primers cpcA-fw: 5′- CAAACCCAAGGCAACAACTT −3′ and cpcA-T7: 5′- TAATACGACTCACTATAGGGGCCGTGGTTAGCTTTGATGT - 3′.
Analyses by 5′RACE
The analyses of RNA primary and secondary 5′ ends followed previously established protocols [30] with the following modifications. For determination of TSS and RNA 5′ ends, 0.65 μg (for cpcA*) and 2.00 μg (for rps8*) of total RNA were subjected to Turbo DNase (Life Technologies, Darmstadt, Germany) digestion, followed by tobacco acid pyrophosphatase (TAP) treatment (Epicentre) and 5′-RNA linker addition using T4 RNA ligase (Epicentre, Madison, Wisconsin, U.S.). Two different oligonucleotides were used as 5′-RNA linkers, li1 in the case of cpcA* and adapterB in the case of rps8*. Synthesis of cDNA was performed with Superscript III reverse transcriptase (Life Technologies) using primers cpcA_R1 or rps8-R1, respectively. For the PCR amplification the RNA-linker-specific primers, Anchor-P1a’ (for cpcA*) or antiadapterB-fw (for rps8*) as well as primer cpcA_R2 or rps8-R1 were used. For the rps8* amplification, a second PCR with nested primers rps8-R2 and antiadapterBII-fw was performed. All reactions were carried out in accordance with the manufacturers’ recommendations.
The following oligonucleotides were used:
li1: 5′- GAUAUGCGCGAAUUCCUGUAGAACGAACACUAGAAGAAA −3′
adapterB: 5′ GUGAUCCAACCGACGCGACAAGCUAAUGCAAGANNN-3′
cpcA_R1: 5′- ATTGTCGGTCAGAGCTTTAG −3′,
cpcA_R2: 5′- TGCAAACCAGCATTAGCTTG −3′,
rps8-R1: 5′- ACCAAATGTAACAAAGGATTTCGCC
rps8-R2: 5′- CCTTCGCCGGTTTCAGAGT
Anchor-P1a′: 5′-CGAATTCCTGTAGAACGAACACTAGAAG-3′
antiadapterB-fw: 5′- TGATCCAACCGACGCGAC
antiadapterBII-fw: 5′- ACCGACGCGACAAGCTAATGC
Gene expression microarray
The microarray design, hybridization procedure and data analysis have been described previously [11,12]. The microarray data are available in the database [GEO: GSE49552].
SDS PAGE and immunoblot analyses
Soluble extracts of Synechocystis 6803 were prepared as described [31]. Proteins were separated by Tricine SDS-PAGE [32] using gels containing 6 M urea and transferred by electrophoresis onto nitrocellulose membranes. Blot membranes were incubated with specific primary antibodies and then with a secondary antibody (goat anti-rabbit IgG-peroxidase conjugate) (Sigma). Immunolabelled bands were visualized using the Immobilon western membrane chemiluminescence system (Millipore, Bedford, MA, USA). For detection of Zn2+ -induced fluorescence a 16% Tricine SDS-PAGE without urea containing 1 mM zinc acetate was used.
Abbreviations
ADH: alcohol dehydrogenase; AsRNA: antisense RNA; Chl a: chlorophyll a; Co: control strain; FC: fold change; GC: gas chromatography; Gm: gentamycin; ncRNA: non-coding RNA; OD: optical density; ORF: open reading frame; PBR: photobioreactor; PDC: pyruvate decarboxylase; PR: producer strain; TAP: Tobacco acid pyrophosphatase; TSS: transcriptional start site; UTR: untranslated region; WT: wild type.
Competing interests
The authors declare that they have no competing interests.
Authors’ contributions
DD, JG, TA, LJ, EK and UD carried out the experimental analyses. DD, JG, AW and WRH participated in the microarray data analysis and drafted the manuscript. DD, JG, TB, AW, UD, HE and WRH conceived of the study, and participated in its design and coordination. All authors read and approved the final manuscript.
Supplementary Material
Genome-wide overview on the log 2 -normalized expression values (left scale) from the microarray analysis of the producer strain versus control as indicated by the coloured lines. Both strands are shown with the location of annotated genes (blue boxes), 5′-UTRs (light grey), internal sense RNAs (light blue), asRNAs (red) and intergenic ncRNA genes (yellow). The normalized log2 expression values obtained by microarray analyses (normalized expression of biological duplicates A1 and A2 in two technical duplicates each) are plotted for each probe as bars in blue (producer A1 and A2, with increasing colour intensity from to to t4) or green (control incubation, with increasing colour intensity from to to t4). The scale for the microarray data is given at the left y-axis. For comparison, the numbers of RNAseq reads from previous transcriptome analyses under standard conditions [11] are plotted (dark grey, primary reads; light grey, secondary reads).
Ethanologenic plasmid pVZ325-PpetJ-PDC-synADH of producer strain #309. Non-ethanologenic empty-vector-control plasmid pVZ325 of control strain #621.
Contributor Information
Dennis Dienst, Email: Dennis.Dienst@algenol.com.
Jens Georg, Email: jens.georg@biologie.uni-freiburg.de.
Thomas Abts, Email: Thomas.Abts@algenol.com.
Lew Jakorew, Email: lew@life.ku.dk.
Ekaterina Kuchmina, Email: ekaterina.kuchmina@biologie.uni-freiburg.de.
Thomas Börner, Email: thomas.boerner@rz.hu-berlin.de.
Annegret Wilde, Email: annegret.wilde@biologie.uni-freiburg.de.
Ulf Dühring, Email: Ulf.Duehring@algenol.com.
Heike Enke, Email: Heike.Enke@algenol.com.
Wolfgang R Hess, Email: wolfgang.hess@biologie.uni-freiburg.de.
Acknowledgements
This work was supported by the German Ministry for Education and Research (BMBF) program Cyanosys to AW, HE and WRH (grant number 0316183) and FORSYS Partner (grant number 0315274) to AW, HE, TB and WRH. We thank Gudrun Krüger, Juliane Wambutt and Andrea Voigt for technical assistance as well as Anne Karradt for providing plasmid pVZ321B.
References
- McKinlay JB, Harwood CS. Photobiological production of hydrogen gas as a biofuel. Curr Opin Biotechnol. 2010;21:244–251. doi: 10.1016/j.copbio.2010.02.012. [DOI] [PubMed] [Google Scholar]
- Deng MD, Coleman JR. Ethanol synthesis by genetic engineering in cyanobacteria. Appl Environ Microbiol. 1999;65:523–528. doi: 10.1128/aem.65.2.523-528.1999. [DOI] [PMC free article] [PubMed] [Google Scholar]
- Atsumi S, Higashide W, Liao JC. Direct photosynthetic recycling of carbon dioxide to isobutyraldehyde. Nat Biotechnol. 2009;27:1177–1180. doi: 10.1038/nbt.1586. [DOI] [PubMed] [Google Scholar]
- Takahama K, Matsuoka M, Nagahama K, Ogawa T. Construction and analysis of a recombinant cyanobacterium expressing a chromosomally inserted gene for an ethylene-forming enzyme at the psbAI locus. J Biosci Bioeng. 2003;95:302–305. doi: 10.1016/S1389-1723(03)80034-8. [DOI] [PubMed] [Google Scholar]
- Lindberg P, Park S, Melis A. Engineering a platform for photosynthetic isoprene production in cyanobacteria, using Synechocystis as the model organism. Metab Eng. 2010;12:70–79. doi: 10.1016/j.ymben.2009.10.001. [DOI] [PubMed] [Google Scholar]
- Schirmer A, Rude MA, Li X, Popova E, del Cardayre SB. Microbial biosynthesis of alkanes. Sci. 2010;329:559–562. doi: 10.1126/science.1187936. [DOI] [PubMed] [Google Scholar]
- Waltz E. Biotech’s green gold? Nat Biotechnol. 2009;27:15–18. doi: 10.1038/nbt0109-15. [DOI] [PubMed] [Google Scholar]
- Qiao J, Wang J, Chen L, Tian X, Huang S, Ren X, Zhang W. Quantitative iTRAQ LC-MS/MS proteomics reveals metabolic responses to biofuel ethanol in cyanobacterial Synechocystis sp. PCC 6803. J Proteome Res. 2012;11:5286–5300. doi: 10.1021/pr300504w. [DOI] [PubMed] [Google Scholar]
- Wang J, Chen L, Huang S, Liu J, Ren X, Tian X, Qiao J, Zhang W. RNA-seq based identification and mutant validation of gene targets related to ethanol resistance in cyanobacterial Synechocystis sp. PCC 6803. BMC Biotechnol Biofuels. 2012;5:89. doi: 10.1186/1754-6834-5-89. [DOI] [PMC free article] [PubMed] [Google Scholar]
- Gao Z, Zhao H, Li Z, Tan T, Lu X. Photosynthetic production of ethanol from carbon dioxide in genetically engineered cyanobacteria. Energy Environ Sci. 2012;5:9857–9865. doi: 10.1039/c2ee22675h. [DOI] [Google Scholar]
- Mitschke J, Georg J, Scholz I, Sharma CM, Dienst D, Bantscheff J, Voss B, Steglich C, Wilde A, Vogel J, Hess WR. An experimentally anchored map of transcriptional start sites in the model cyanobacterium Synechocystis sp. PCC6803. Proc Natl Acad Sci USA. 2011;108:2124–2129. doi: 10.1073/pnas.1015154108. [DOI] [PMC free article] [PubMed] [Google Scholar]
- Georg J, Voss B, Scholz I, Mitschke J, Wilde A, Hess WR. Evidence for a major role of antisense RNAs in cyanobacterial gene regulation. Mol Syst Biol. 2009;5:305. doi: 10.1038/msb.2009.63. [DOI] [PMC free article] [PubMed] [Google Scholar]
- Voss B, Georg J, Schön V, Ude S, Hess WR. Biocomputational prediction of non-coding RNAs in model cyanobacteria. BMC Genomics. 2009;10:123. doi: 10.1186/1471-2164-10-123. [DOI] [PMC free article] [PubMed] [Google Scholar]
- Vidal R, Lopez-Maury L, Guerrero MG, Florencio FJ. Characterization of an alcohol dehydrogenase from the cyanobacterium Synechocystis sp. PCC 6803 that responds to environmental stress conditions via the Hik34-Rre1 two component system. J Bacteriol. 2009;191:4383–4391. doi: 10.1128/JB.00183-09. [DOI] [PMC free article] [PubMed] [Google Scholar]
- Hernandez-Prieto MA, Schön V, Georg J, Barreira L, Varela J, Hess WR, Futschik ME. Iron deprivation in Synechocystis: inference of pathways, non-coding RNAs, and regulatory elements from comprehensive expression profiling. G3 (Bethesda) 2012;2:1475–1495. doi: 10.1534/g3.112.003863. 2012. [DOI] [PMC free article] [PubMed] [Google Scholar]
- Karradt A, Sobanski J, Mattow J, Lockau W, Baier K. NblA, a key protein of phycobilisome degradation, interacts with ClpC, a HSP100 chaperone partner of a cyanobacterial Clp protease. J Biol Chem. 2008;283:32394–32403. doi: 10.1074/jbc.M805823200. [DOI] [PubMed] [Google Scholar]
- Zengel JM, Lindahl L. Diverse mechanisms for regulating ribosomal protein synthesis in Escherichia coli. Progr Nucl Acid Res Mol Biol. 1994;47:331–370. doi: 10.1016/s0079-6603(08)60256-1. [DOI] [PubMed] [Google Scholar]
- Møller T, Franch T, Udesen C, Gerdes K, Valentin-Hansen P. Spot 42 RNA mediates discoordinate expression of the E. coli galactose operon. Genes Dev. 2002;16:1696–1706. doi: 10.1101/gad.231702. [DOI] [PMC free article] [PubMed] [Google Scholar]
- Urban JH, Papenfort K, Thomsen J, Schmitz RA, Vogel J. A conserved small RNA promotes discoordinate expression of the glmUS operon mRNA to activate GlmS synthesis. J Mol Biol. 2007;373:521–528. doi: 10.1016/j.jmb.2007.07.035. [DOI] [PubMed] [Google Scholar]
- Na D, Yoo SM, Chung H, Park H, Park JH, Lee SY. Metabolic engineering of Escherichia coli using synthetic small regulatory RNAs. Nat Biotechnol. 2013;31:170–174. doi: 10.1038/nbt.2461. [DOI] [PubMed] [Google Scholar]
- Held WA, Ballou B, Mizushima S, Nomura M. Assembly mapping of 30 S ribosomal proteins from Escherichia coli. Further studies. J Biol Chem. 1974;249:3103–3111. [PubMed] [Google Scholar]
- Cerretti DP, Mattheakis LC, Kearney KR, Vu L, Nomura M. Translational regulation of the spc operon in Escherichia coli. Identification and structural analysis of the target site for S8 repressor protein. J Mol Biol. 1988;204:309–329. doi: 10.1016/0022-2836(88)90578-5. [DOI] [PubMed] [Google Scholar]
- Gregory RJ, Cahill PB, Thurlow DL, Zimmermann RA. Interaction of Escherichia coli ribosomal protein S8 with its binding sites in ribosomal RNA and messenger RNA. J Mol Biol. 1988;204:295–307. doi: 10.1016/0022-2836(88)90577-3. [DOI] [PubMed] [Google Scholar]
- Merianos HJ, Wang J, Moore PB. The structure of a ribosomal protein S8/spc operon mRNA complex. RNA. 2004;10:954–964. doi: 10.1261/rna.7030704. [DOI] [PMC free article] [PubMed] [Google Scholar]
- Rippka R, Deruelles J, Waterbury JB, Herdman M, Stanier RY. Generic assignments, strain histories and properties of pure cultures of cyanobacteria. J Gen Microbiol. 1979;111:1–61. doi: 10.1099/00221287-111-1-1. [DOI] [Google Scholar]
- Zinchenko VV, Piven IV, Melnik VA, Shestakov SV. Vectors for the complementation analysis of cyanobacterial mutants. Russ J Genet. 1999;35:228–232. [Google Scholar]
- Black TA, Cai Y, Wolk CP. Spatial expression and autoregulation of hetR, a gene involved in the control of heterocyst development in Anabaena. Mol Microbiol. 1993;9:77–84. doi: 10.1111/j.1365-2958.1993.tb01670.x. [DOI] [PubMed] [Google Scholar]
- McKinney G. Absorption of light by chlorophyll solutions. J Biol Chem. 1941;140:315–322. [Google Scholar]
- Dienst D, Dühring U, Mollenkopf HJ, Vogel J, Golecki J, Hess WR, Wilde A. The cyanobacterial homologue of the RNA chaperone Hfq is essential for motility of Synechocystis sp. PCC 6803. Microbiology. 2008;154:3134–3143. doi: 10.1099/mic.0.2008/020222-0. [DOI] [PubMed] [Google Scholar]
- Steglich C, Futschik ME, Lindell D, Voss B, Chisholm SW, Hess WR. The challenge of regulation in a minimal photoautotroph: non-coding RNAs in Prochlorococcus. PLoS Genet. 2008;4:e1000173. doi: 10.1371/journal.pgen.1000173. [DOI] [PMC free article] [PubMed] [Google Scholar]
- Dühring U, Irrgang KD, Lünser K, Kehr J, Wilde A. Analysis of photosynthetic complexes from a cyanobacterial ycf37 mutant. Biochim Biophys Acta. 2006;1757:3–11. doi: 10.1016/j.bbabio.2005.11.001. [DOI] [PubMed] [Google Scholar]
- Schägger H. Tricine-SDS-PAGE. Nat Protoc. 2006;1:16–22. doi: 10.1038/nprot.2006.4. [DOI] [PubMed] [Google Scholar]
Associated Data
This section collects any data citations, data availability statements, or supplementary materials included in this article.
Supplementary Materials
Genome-wide overview on the log 2 -normalized expression values (left scale) from the microarray analysis of the producer strain versus control as indicated by the coloured lines. Both strands are shown with the location of annotated genes (blue boxes), 5′-UTRs (light grey), internal sense RNAs (light blue), asRNAs (red) and intergenic ncRNA genes (yellow). The normalized log2 expression values obtained by microarray analyses (normalized expression of biological duplicates A1 and A2 in two technical duplicates each) are plotted for each probe as bars in blue (producer A1 and A2, with increasing colour intensity from to to t4) or green (control incubation, with increasing colour intensity from to to t4). The scale for the microarray data is given at the left y-axis. For comparison, the numbers of RNAseq reads from previous transcriptome analyses under standard conditions [11] are plotted (dark grey, primary reads; light grey, secondary reads).
Ethanologenic plasmid pVZ325-PpetJ-PDC-synADH of producer strain #309. Non-ethanologenic empty-vector-control plasmid pVZ325 of control strain #621.