Abstract
Inflammation, a precursor to many diseases including cancer and atherosclerosis, induces differential surface expression of specific vascular molecules. Blood-borne nanoparticles (NPs), loaded with therapeutic and imaging agents, can recognize and use these molecules as vascular docking sites. Here, a computational model is developed within the Isogeometric Analysis framework to understand and predict the vascular deposition of NPs within an inflamed arterial tree. The NPs have a diameter ranging from 0.1 to 2.0 μm and are decorated with antibodies directed toward three endothelial adhesion molecules, namely intravascular cell adhesion molecule-1 (ICAM-1), vascular cell adhesion molecule-1 (VCAM-1) and E-selectin, whose surface density depends on the local wall shear stress. Results indicate VCAM-1 targeted NPs adhere more, with ICAM-1 directed NPs adhering least efficiently, resulting in approximately an order-of-magnitude lower average particle surface density. ICAM-1 and E-selectin directed 0.5 μm NPs are distributed more uniformly (heterogeneity index ≈ 0.9 and 1.0, respectively) over the bifurcating vascular branches compared to their VCAM-1 counterparts (heterogeneity index ≈ 1.4). When the NPs are coated with antibodies for VCAM-1 and E-selectin in equal proportions, a more uniform vascular distribution is achieved compared with VCAM-1-only targeted particles, thus demonstrating the advantage of NP multivalency in vascular targeting. Furthermore, the larger NPs (2 μm) adhere more (≈ 200%) in the lower branches compared to the upper branch. This computational framework provides insights into how size, ligand type, density, and multivalency can be manipulated to enhance NP vascular adhesion in an individual patient.
Keywords: vascular targeting, bioadhesion, inflamed endothelium, isogeometric analysis
Introduction
Inflammation is implicated as a precursor to many diseases including cancer, atherosclerosis, arthritis, metabolic disorders, and autoimmune diseases (Packard and Libby, 2008, Chung et al., 2010, Albini et al., 2012, Taube et al., 2012). A distinct hallmark of inflammation is the progressive accumulation at the diseased site of immune cells, which are directly involved in the healing process. This accumulation is regulated by a cascade of events starting with the dilation of the blood vessels and the upregulation of specific receptor molecules on the inflamed endothelium. The intercellular adhesion molecule (ICAM)-1, vascular cell adhesion molecule (VCAM)-1, and selectins (Calderon et al., 2009, Chen et al., 2011) are the most relevant receptors directly involved in the rolling, transient adhesion and firm arrest of circulating immune cells over the diseased endothelium.
Inspired by the vascular behavior of the immune cells, researchers have engineered nanoparticles (NPs) capable of recognizing vascular receptors and firmly adhering to the vessel walls, resisting the dislodging hemodynamic forces. These NPs are sufficiently small to be administered at the systemic level, are loaded with therapeutic and imaging agents, and their surfaces can be decorated with antibodies, ligand molecules, or peptides to specifically recognize counter molecules (receptors) overexpressed at the biological target. The performance of NPs depends on their size, shape and surface properties (Decuzzi and Ferrari, 2006, Decuzzi et al., 2009, Adriani et al., 2012). The authors have extensively utilized mathematical modeling to understand, predict and optimize the vascular transport and adhesion of NPs . In particular, it has been demonstrated that accounting for patient-specific attributes, such as the authentic vessel geometry and architecture, is critically important in predicting the vascular deposition of systemically injected NPs (Hossain et al., 2012b). In vascular targeting, other relevant patient-specific parameters are the type and surface density of the receptors upregulated on the diseased endothelium.
There is strong evidence in the literature for the shear dependent overexpression of inflammatory molecules (McKinney et al., 2006, Tsou et al., 2008). For example, within the context of atherosclerosis, it has been reported (Chiu et al., 2004, Cunningham and Gotlieb, 2004) that disturbed flow features, such as low and oscillating wall shear stress (WSS), induce an inflammatory response resulting in an upregulation of certain cell adhesion molecules (CAMs), namely VCAM-1 and E-selectin, which are characteristic of atheroprone conditions. On the other hand, a higher shear rate environment that induces an elevated level of ICAM-1 expression, but a down regulation of VCAM-1 is considered atheroprotective (Chiu et al., 2004). Along this line, a number of in vitro studies have been carried out correlating WSS to the vascular expression of CAMs. Some of these studies investigated endothelial response to shear flow (steady and pulsatile/disturbed) in the presence of chemical stimuli, for example cytokines such as tumor necrosis factor-alpha (TNF-α), interleukin-1beta (IL-1•), which are also known to elicit certain CAM expressions (Dinarello, 2009, Zhang et al., 2011).
The heterogeneity in WSS distribution within an authentic, patient-specific vascular network and the shear dependent expression of vascular receptor molecules are expected to impact the wall deposition of blood-borne NPs. In this work, a phenomenological model for estimating the vascular density of CAMs as a function of the local WSS is developed and incorporated in an Isogeometric Analysis-based computational framework (Hossain et al., 2012b). This is utilized to understand and predict the deposition patterns of circulating NPs within a patient-specific arterial tree overexpressing ICAM-1, VCAM-1 and E-Selectin molecules. The NPs have a spherical shape with three different diameters, namely 0.1, 0.5 and 2.0 μm, and their surfaces can be decorated with one or two receptors, leading to NP multivalency.
Materials and Methods
The computational model
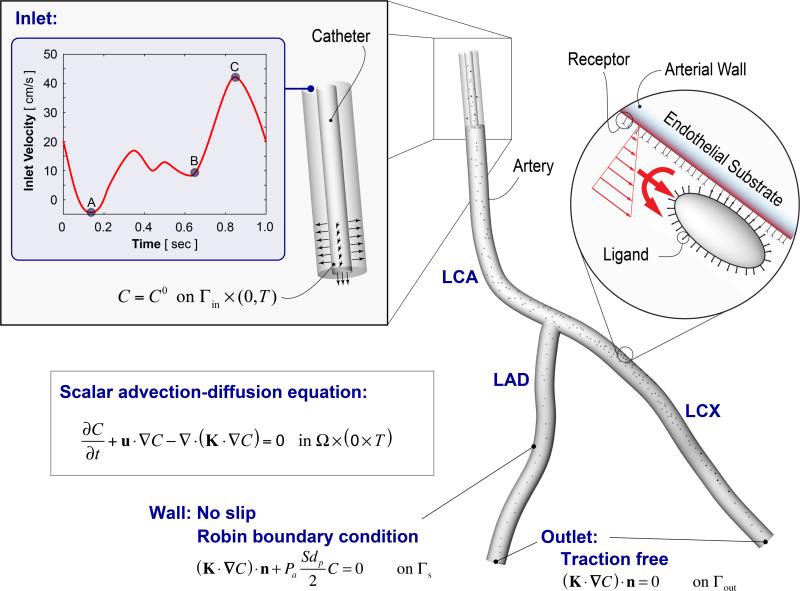
Within the Finite Element based Isogeometric Analysis framework (Bazilevs et al., 2006, Hossain et al., 2012a), a 3D Navier- Stokes solver coupled to the scalar advection-diffusion equation was utilized to simulate blood flow and mass transport of surface functionalized NPs within a patient-specific coronary artery. Figure 1 illustrates the simulation setup. First, a hexahedral solid Non-uniform Rational B-splines (NURBS) model for a left coronary artery (LCA) was constructed directly from CT imaging data of a healthy over 55 volunteer (Zhang et al., 2007). Blood was assumed to be an incompressible Newtonian fluid with a density ρ of 1060 kg/m3 and a viscosity μ of 0.03 Pa-s. A time-dependent patient-specific pulsatile inflow condition (Matsuo et al., 1988, Johnston et al., 2006) with a period of 1 s was imposed at the LCA inlet. A no-slip boundary condition was prescribed at the rigid and impermeable vascular wall, and a traction free outflow boundary condition was implemented at the two branch outlets: left anterior descending (LAD) artery and left circumflex (LCX) branch. A catheter was positioned at the inlet of the LCA segment, through which NPs were injected both radially and axially at a speed of 4 cm/s, over five cardiac cycles. The particle motion through blood flow was assumed to be governed by a linear scalar advection-diffusion equation subjected to appropriate boundary conditions (Figure 1). A special Robin boundary condition was implemented to account for particle adhesion to the vessel wall, which was validated against parallel plate flow chamber experiments under physiologically relevant conditions. The details of our computational framework and the in vitro model validation appear elsewhere (Hossain et al., 2012b). Below, we briefly describe key aspects of the particle adhesion model.
Figure 1.
Particle adhesion modeling and the problem set-up. A patient-specific left coronary artery (LCA) tree is considered that bifurcates into two downstream branches: the left anterior descending (LAD) artery and left circumflex (LCX) branch. Particle transport is simulated utilizing a Navier-Stokes solver coupled to a scalar advection-diffusion equation with appropriate boundary conditions.
Modeling NP adhesion to the vessel wall
The governing equation for particle transport within the blood can be expressed as follows (see Figure 1).
| (1) |
Here, C is the NP volumetric concentration in the fluid, u is the fluid velocity vector, K is the NP diffusivity tensor and t is a point in the time domain [0,T]. The normal component of the flux of particles “diffusing” out of the fluid domain Ω and adhering to the vessel wall Γs is assumed to be directly influenced by the local wall shear rate S, the particle diameter dp, and the probability of adhesion, Pa as follows (Figure 1):
| (2) |
where n is the unit outward normal and dφ/dt is the rate of NP accumulation within the vessel wall, with φ denoting the NP surface density. The notation |s means that the quantities are evaluated at the lumen-wall interface. The parameter Pa is a measure of the strength of adhesion. The larger the value of Pa, the greater the avidity with which the NP stably adheres to the wall. Note, Eq. 2 does not account for the effect of plasma filtration on particle adhesion as it is assumed to be negligible for the larger particles (> 50 nm) under consideration. This assumption needs to be further investigated in future, especially for smaller particles.
From (Decuzzi and Ferrari, 2006), Pa can be modeled as a function of certain NP design parameters such as size, shape and surface properties (e.g., ligand density and type) as well as physiological parameters like local WSS and target receptor density. For a spherical particle in point contact with the wall, the mathematical expression for Pa attains the form:
| (3) |
Here, ml is the uniform surface density of ligand molecules decorating the NP surface that can specifically interact with counter molecules (receptors) expressed on the vessel wall with a surface density mr. Ka0 is an affinity constant characterizing the molecular interaction between ligands and receptors at zero mechanical load, λ is a characteristic length of the ligand-receptor bond, generally of the order of 0.1 – 1 nm; kBT is the Boltzmann thermal energy (= 4.142×10⁻²¹ J); Fs (=1.668) is the coefficient of hydrodynamic drag force on a spherical particle; μS is the WSS. Table 1 lists the adhesion parameters used in the model.
Table 1.
Particle adhesion parameters used in the simulation (Hossain et al., 2012a).
| Parameters | Value |
|---|---|
| Surface density of ligand molecules | ml = 1015 #/m2 |
| Surface density of receptor molecules | mr = 1013 #/m2 |
| Ligand-receptor affinity constant at zero load | Ka0 = 2.3×10⁻⁷ m2 |
| Characteristic length of ligand-receptor bond | λ = 1×10⁻¹⁰m |
| Dynamic viscosity of water | μ = 0.001 N-s/m2 |
| Drag coefficient on the spherical particle | Fs = 1.668 |
It is worth noting that the interplay between advection and diffusion phenomena (see Eq. 1), characterized by the Péclet number, affects the distribution of nanoparticle deposition. As previously reported in (Hossain et al., 2012b), due to the highly convective nature of the particle transport in the coronary arteries, where global Péclet number Pe can be 1000 and higher for all the particle sizes considered, diffusion plays a negligible role in particle mass transport within the core of the blood flow. On the other hand, in the boundary layer and in regions of flow disturbances, particle transport is diffusion dominated (Pe less than 1). Hence, particle adhesion to the wall is essentially a diffusive process, and strongly modulated by the particle deposition parameter Π = PaSdp/2 [see discussions in (Hossain et al., 2012b)].
The particle surface can also be decorated with ligands targeting more than one receptor type simultaneously, leading to multivalency. Particle adhesion to each receptor type is assumed to be independent (i.e., mutually exclusive). For a particle coated with equal proportions (50:50) of anti VCAM-1 (aVCAM-1) antibody and anti E-selectin (aEsel) antibody, the probability of adhesion (see Eq. 2) becomes Pa = 0.5PaVCAM + 0.5PaEsel. Here, PaVCAM is the probability of adhesion for aVCAM-1 antibody coated particles with a uniform ligand density of ml (with 100% coverage), and PaEsel is the same for aEsel.
Shear stress-dependent density of vascular receptors
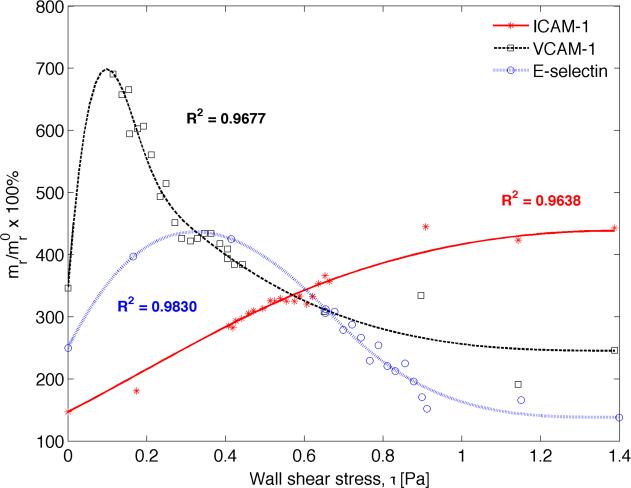
Recently, Tsou and co-workers (Tsou et al., 2008) conducted an in vitro study aimed at understanding how fluid shear stress regulates membrane expression of CAMs, namely ICAM-1, VCAM-1, and E-selectin . To that end, human aortic endothelial cells (ECs) were exposed to a linear gradient of shear stress in a Hele-Shaw parallel plate flow chamber, while simultaneously being chemically stimulated by TNF-α, a cytokine that elicits CAM expression. The relative change in CAM expression was quantified as a function of WSS magnitude for the range 0 to 1.6 Pa, which is physiologically relevant. A functional relationship between local WSS and the corresponding CAM surface density was devised by fitting cubic splines to the experimental data employing the method of least squares. The in vitro data and the fitted curves are presented in Figure 2.
Figure 2.
Predicting inflammatory response to shear stress. Receptor surface density vs. wall shear stress relationship determined by curve fitting to in-vitro data for TNF-α stimulated CAM expression, obtained from (Tsou et al., 2008). Here stars, squares, and circles denote experimental data for ICAM-1, VCAM-1 and E-selectin, respectively, and the solid lines represent the corresponding fitted data. The quantities are reported as percent (%) of unstimulated CAM expression under static conditions (mr/mr0). Addition of TNF-alpha under static conditions stimulated up-regulation of VCAM-1 by 350%, ICAM-1 by 150% and E-selectin by 250%.
Figure 2 shows that WSS magnitude induces different effects on different CAM expressions. ICAM-1 expression increases monotonically when subjected to rising WSS in the presence of TNF-α stimulation, peaking to about 450% of the un-stimulated static condition and plateauing around 1.2 Pa of WSS magnitude. Conversely, VCAM-1 and E-selectin density decrease with increasing WSS with concomitant TNF-α stimulation, resulting in a maximum upregulation of 600% and 400%, respectively. The peak occurs early at 0.1 – 0.15 Pa for VCAM-1 before attenuating to a level (≈ 260%) below that induced by TNF-α stimulation under static conditions (≈ 350%). Similarly, E-selectin expression upregulation peaks around 0.4 Pa of WSS magnitude, before diminishing to a level (≈ 150%) below that triggered by the initial TNF-α stimulation under static conditions (≈ 250%). Interestingly, it appears that below 0.6 Pa, VCAM-1 has the most pronounced response to local WSS, followed by E-selectin and ICAM-1, respectively. Beyond this value, the roles are reversed between ICAM-1 and VCAM-1.
Heterogeneity index
In order to assess the uniformity of particle distribution between the two downstream branches, a heterogeneity index is defined as follows: H = NLCX/NLAD. Here, N is the surface density of particles integrated over the entire surface of the branch, divided by the total surface area of the branch.
Isogeometric analysis solution approach
Employing the methodology described above and in (Hossain et al., 2012b), blood flow and particle transport simulations were run utilizing an in-house numerical code (Hossain, 2009). Quadratic NURBS were used for the spatial discretization. A residual-based multiscale method (Bazilevs et al., 2007) was implemented to solve the system of equations employing the Newton-Raphson procedure in concert with a multi-stage predictor-corrector algorithm at each time step. The generalized-α method (Jansen et al., 2000) was used for time advancement with a time step of 0.05 s. Simulations were carried out until all the particles left the fluid domain after catheter injection.
Results and Discussion
As illustrated in Figure 1, the problem setup involves the LCA tree that bifurcates into two downstream branches: the LAD artery and the LCX branch. Simulations were run on this 3D patient-specific coronary artery geometry to quantify the surface density of vascular receptor molecules and the deposition pattern of blood-borne particles.
Quantification of the surface density for the target receptors
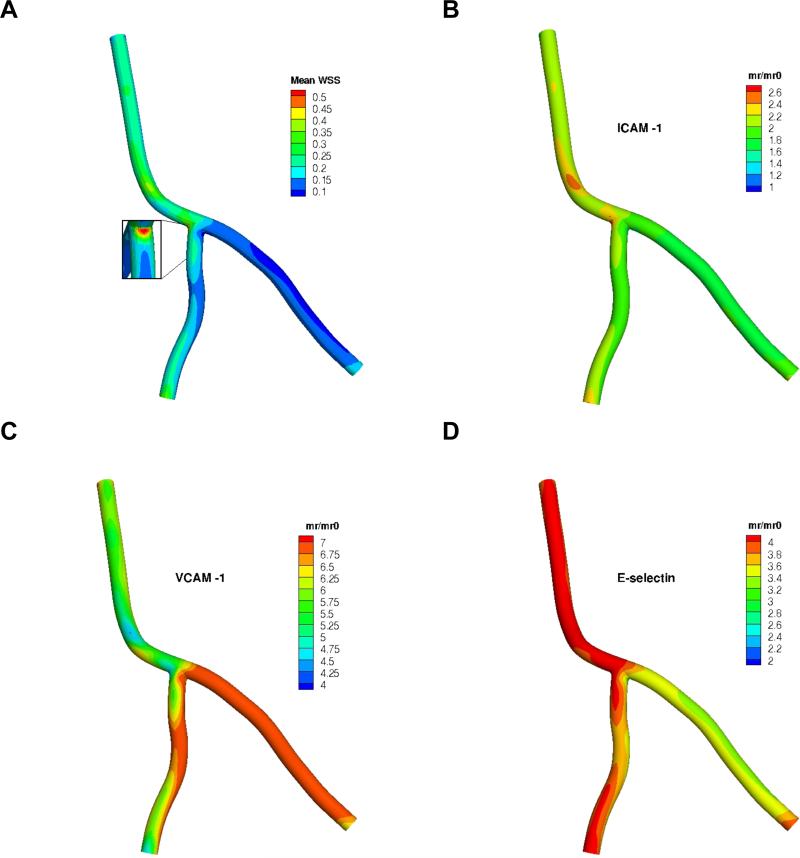
Blood flow simulations were carried out for a few cardiac cycles, from which the velocity vector u and spatial distribution of time-averaged WSS (mean WSS) within the arterial tree were computed. A 60:40 LCA:LAD flow split was observed at the bifurcation. Utilizing the phenomenological model correlating the cell adhesion molecule expression to local WSS presented in the prequel, the surface density mr of the three candidate target receptors (ICAM-1, VCAM-1 and E-selectin) were assessed with respect to their unstimulated expression under static conditions mr0, which can be thought of as the baseline, healthy state. Results are presented in Figure 3. The mean WSS magnitude ranges from 0 to 0.6 Pa, which is physiologically relevant (Doriot et al., 2000). Alternate areas of high (at the LCA-LAD junction) and low (at the LCA-LCX and LAD-LCX junctions) levels of WSS are observed near the bifurcation (inset in Figure 3A). The downstream branches, and the LCX in particular, appear to have a relatively lower range of WSS (0.05 to 0.3 Pa) compared to the LCA. Such spatially heterogeneous distribution of local WSS triggers distinctly different inflammatory responses for the three CAMS under consideration. ICAM-1 attains a relatively uniform distribution throughout the arterial tree exhibiting a modest response of roughly 2-fold overexpression relative to the base-line value (Figure 3B). This trend is consistent with data observed in vivo (Chen et al., 2011). A significantly higher VCAM-1 density is observed in the LCX branch amounting to a 7-fold increase compared to the baseline value commensurate with the local WSS range (< 0.2 Pa) that is generally considered atheroprone (Figure 3C). A reverse trend is observed for E-selectin upregulation in the LCX (Figure 3D), where it has a lower surface density relative to other branches. Overall, it appears that the same WSS values induce a slightly muted E-selectin response when compared to VCAM-1. With this patient-specific spatial distribution of the target receptors, the wall deposition pattern of blood-borne NPs is investigated next.
Figure 3.
A) Time-averaged wall shear stress (mean WSS) in the coronary artery segment (no catheter at inlet) in Pa (N/m2), and the resulting spatial distribution of mr/mr0 for the three receptors: B) ICAM-1, C) VCAM-1 and D) E-selectin. Note: color map scales are different.
Single receptor targeted nanoparticles
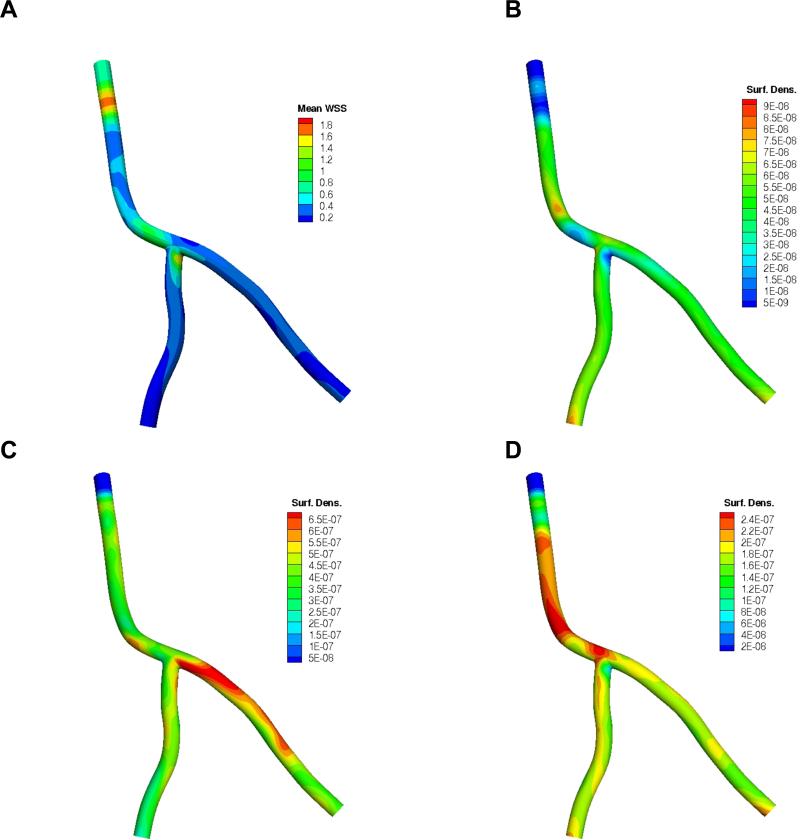
With a catheter now positioned at the inlet of the artery segment, particles were released directly into the bloodstream. Figure 4A depicts the resulting time-averaged mean WSS distribution. The corresponding time evolution of the particle volumetric concentration in blood (#/cm2), normalized by the NP concentration at the catheter injection site C0 (see Figure 1), is presented in Supplementary Figure 1. Aided by the catheter injection speed, it takes about one cardiac cycle for the NPs to fill up the major portion of the coronary artery segment including the downstream branches. Once the catheter injection is ceased after five cardiac cycles, it takes about four to five more seconds for all the particles to leave the arterial tree. The simulations were performed independently for each receptor type under consideration. The ensuing spatial distributions of 0.5 μm NPs are presented in Figure 4B, C and D, for the aICAM-1, aVCAM-1 and aEsel cases, respectively. The results are reported in terms of particle surface density (#/cm2) normalized by the total number of particles injected ninj. NP dose can vary widely depending on a number of factors, including the size, shape and type of particles used, NP delivery mechanism and location, the vessel caliber, target tissue/site, and toxicity (Teeguarden et al., 2007). For the catheter-based drug delivery system under consideration, ninj was estimated by time integrating the flux of particles entering the fluid domain with a concentration C0 at an injection speed uin of 4 cm/s (e.g., for a unit concentration C0 = 1 #/cm3, ninj is approximately 28). C0 and uin are therefore design parameters that can be tuned based on the desired NP surface density for optimum therapeutic effect.
Figure 4.
A) Time-averaged wall shear stress (mean WSS) distribution in the coronary artery segment (with catheter at inlet) in Pa (N/m2); and the corresponding surface density (cm-2) of 0.5 μm particles at the end of simulation (t = 9 s) in terms of nadh /(ninj ×A) for the 3 targeted receptors: B) ICAM-1, C) VCAM-1, D) E-selectin. Note: color map scales are different. Here nadh is the number of adhered particles, ninj is the total number of injected particles and A (cm2) is the surface area.
Both local receptor density and mean WSS magnitude appear to regulate particle adhesion, resulting in a spatially inhomogeneous particle distribution pattern in all three cases. The higher the receptor density and lower the WSS magnitude, the greater the number of particles adhered per unit area. In fact, subjected to the same hemodynamic conditions, it is the local receptor density that modulates particle adhesion as areas with higher receptor density generally exhibit enhanced particle accumulation for all three cases. Results in Figure 4 show that ICAM-1 directed particles adhere less than VCAM-1 and E-selectin. This is largely due to a relatively smaller number of receptors available for binding (Figure 3B). Particle distribution is comparatively uniform throughout the arterial tree for aICAM-1 decorated particles. A few localized pockets of inhomogeneity that do occur appear to correlate well with higher receptor density sites. There are a few of exceptions to this observation. For example, at the inlet where the catheter is located, due to considerably higher WSS values (> 1 Pa) induced by flow acceleration through the annular space between the catheter and the vessel wall, a far smaller number of particles adhere. This causes a significant (≈80%) reduction in surface density relative to the rest of the arterial tree despite having roughly the same receptor density (Figure 3B). Because of the unusually high local WSS near the inlet (Figure 4A), the adhesive interactions need to overcome much larger hemodynamic forces to form ligand-receptor bonds, resulting in fewer particles attaching stably to the vessel wall. A similar phenomenon occurs in the bifurcation region where the LAD and the LCX meet.
From Figure 4C, it appears that VCAM-1 directed NPs lodge more in the LCX compared to the LCA and LAD. The reason for this is that the LCX sees WSS levels in the region of 0 – 0.15 Pa (Figure 3A) that induce maximum (up to 7-fold increase) upregulation of VCAM-1 (Figure 3C). The higher receptor density facilitates enhanced adhesive interaction, resulting in a denser particle concentration at the vessel wall. Conversely, E-selectin targeted particles appear to have adhered more in the upper branch (LCA) relative to the lower branches (LCX and LAD). In certain low WSS spots near sharp bends and the bifurcation, there is almost a 2-fold increase in particle density. Interestingly, particle adhesion is not suppressed as much for VCAM-1 and E-selectin targeted particles at the high WSS regions near the catheter and LCD-LCX, in contrast with ICAM-1. Enhanced CAM expression (3-fold for VCAM-1 and 2-fold for E-selectin relative to ICAM-1) promotes adhesive interactions that enable the particles to better withstand the dislodging hemodynamic forces, resulting in greater particle accumulation.
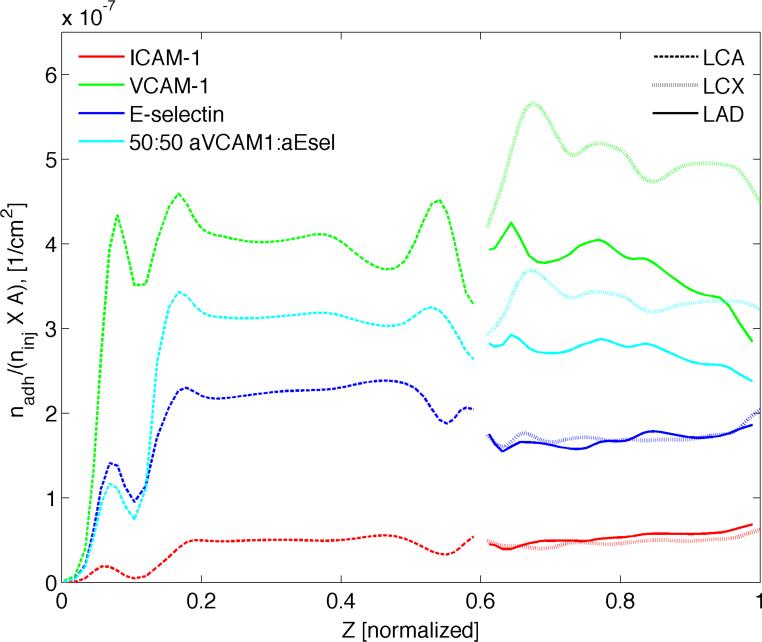
In order to understand how the adhered particles are dispersed throughout the different branches and to see if there is a bias toward one over the other, the mean particle distribution along the length of the artery tree was plotted (Figure 5). The number of adhered particles (dp = 0.5 μm) is averaged over the circumference of each cross-section taken at various centerline locations along the arterial segment. This mean distribution is relevant from a therapeutic perspective as the cells within the arterial wall tissue are more likely to respond to this averaged quantity. As before, particle surface density (#/cm2), normalized by the total number of particles injected ninj is reported. Interestingly, sharp peaks in average concentration occur around the site of catheter injection in all three cases. This can be attributed to the corresponding steep increase in particle availability near the vessel wall C|s integrated over time (Supplementary Figure 2). As one moves downstream past the particle injection site and along the centerline of the LCA, NP availability remains more or less uniform with distance until it reaches the bifurcation area where a noticeably steeper rise in C|s is observed continuing all the way up to the branch outlets. With the concentration profiles for the two branches essentially superimposed on each other, the NPs seem to be split symmetrically between the LAD and LCX. From Figure 5, it appears that both E-selectin and ICAM-1 directed 0.5 μm particles exhibit a symmetric distribution over the two branches. On the other hand, aVCAM-1-decorated NPs seem to adhere significantly more in the LCX relative to the LCA and LAD, the latter two attaining a similar level of average particle density. This results in a noticeably asymmetric distribution over the two downstream branches. Subjected to the same hemodynamic conditions, any such departure of average particle surface density from the profiles in Supplementary Figure 2 can be attributed to the variation in mean target receptor density along the length of the artery segment. For example, the higher level of CAM overexpression attracts a larger proportion of aVCAM-1-coated NPs within the LCX. In a similar vein, rather than slowly increasing in correspondence with increasing particle availability, particle adhesion appears to decline with distance along the length of the downstream branches.
Figure 5.
Comparison of ICAM-1, VCAM-1 and E-selectin directed particles. Surface density of 0.5 μm particles at the end of simulation (t = 9 s) averaged over the circumference of each cross section taken at various “Z”-locations along the vessel centerline. Here nadh is the number of adhered particles, ninj is the total number of injected particles and A (cm2) is the surface area.
Overall, VCAM-1 targeted particles appear to fare better than the rest with almost an order-of-magnitude higher surface density than that for ICAM-1 targeted particles, which adhere least efficiently (Supplementary Table 1). aICAM-1 particles on the other hand achieve a more or less uniform distribution along the length of the artery segment. In contrast, E-selectin directed particles appear to lodge more in the upper branch (LCA), while VCAM-1 targeted particles adhere more in the LCX.
To study the effect of particle size on distribution, the same simulations were run for 0.1 μm and 2.0 μm sized NPs. The total area-averaged particle density increased with increasing size in all three cases (Supplementary Table 1). For ICAM-1 directed particles, the larger the particle, the greater the asymmetry between the two downstream branches with LAD attracting an increasingly greater proportion of particles (Supplementary Table 2). E-selectin targeted particles achieve a relatively more uniform dispersion between the two branches, especially in the case of smaller NPs (H ≈ 1 for dp = 0.1 and 0.5 μm). But as the particle size increases, the aICAM-1 particles end up adhering more in the LAD than the LCX (H ≈ 0.7 for dp = 2.0 μm). Conversely, VCAM-1 directed particles have a consistently higher surface density in the LCX regardless of particle size. However, as opposed to their ICAM-1 and E-selecting counterparts, the maximum inhomogeneity between the two branches occurs for 0.5 μm particles (H ≈ 1.35), while 0.1 and 2.0 μm particles yield a similar degree of heterogeneity (H ≈ 1.2).
Multi-receptor targeted nanoparticles
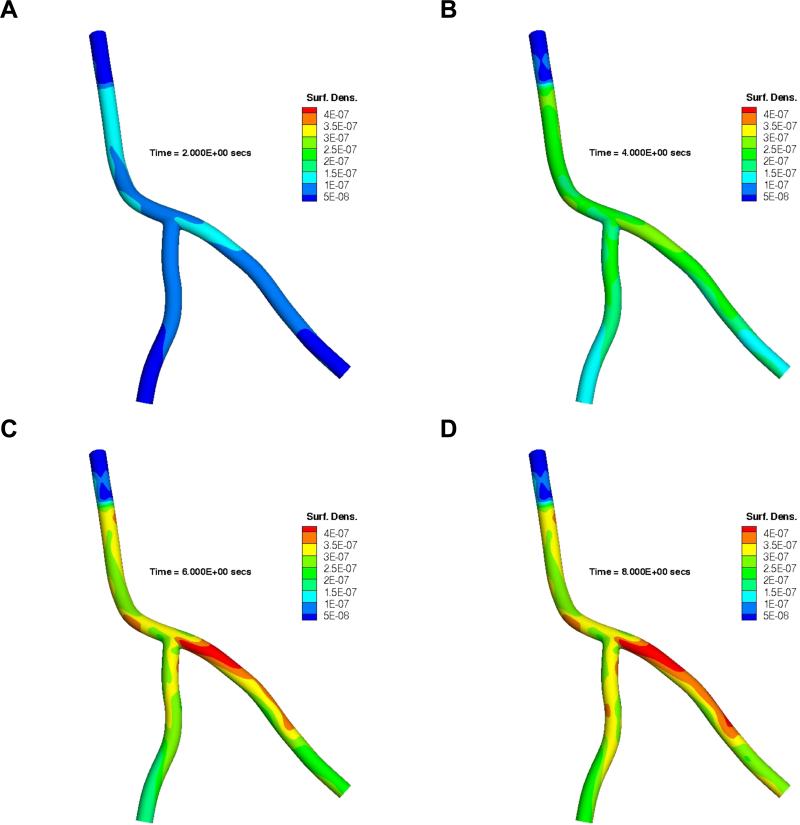
Next, we investigated dual receptor targeted particles where each particle has 50% aVCAM-1 and 50% aEsel ligand coverage. Figure 6 shows the time evolution of the spatial distribution of 0.5 μm particles directed simultaneously to two receptors as described in the Materials and Methods Section. At 2 s (Figure 6A), a higher NP surface density near the catheter exit is observed due to greater particle availability in this region compared to the downstream areas (Supplementary Figure 1A). From that point onward, particle concentration grows and approaches a more uniform distribution with continued particle release (Figure 6B). Once the catheter injection is ceased (t > 5 s), local flow features change, affecting the WSS distribution pattern and magnitude, where the latter is reduced by almost a factor of 3 (Supplementary Figure 3). The particles remaining in the circulation are now subjected to more favorable hemodynamic conditions and the particle adhesion pattern is therefore dictated more by the specific interactions between the ligands and receptors. Hence, it is the local receptor density (predicated upon particle availability) that modulates the adhesion behavior post catheter-injection. In Figure 6C, the outgoing particles therefore lodge preferentially in the LCX, specifically to sites with higher VCAM-1 and E-selectin density (mr/mr0 ≈ 7 and 3, respectively).
Figure 6.
Time evolution of spatial distribution of 0.5 μm particles decorated with 50% aVCAM-1 and 50% aEsel ligands targeting both VCAM-1 and E-selectin simultaneously. Here results are presented at A) t = 0 s, B) t = 2 s, C) t = 6 s, and D) t = 8 s, in terms of nadh/(ninj × A ) where nadh is the number of adhered particles per unit area A (cm2), ninj is the total number of injected particles.
Since the aVCAM:aSel particles posses an equal (50:50) probability of forming a bond with the two target receptor types, chances are they will adhere most in regions with the highest average VCAM-1 and E-selectin density. Therefore, the particle adhesion pattern is most likely to reflect that for the receptor type with a higher proportion of cumulative expression at a given location. Considering how VCAM-1 upregulation trumps that for E-selectin in most areas within the artery segment under investigation, the spatial distribution pattern is expected to be slightly biased toward that for VCAM-1 directed particles, as is quite evident in the case of LCX (compare with the same in Figure 4C). However, the scenario is not as straightforward for the LAD (or LCA for that matter) as discussed below.
The spatial distribution pattern for VCAM-1 and E-selectin expression within the LAD appear to be opposite in nature, in that VCAM-1 “peaks” are essentially matched by the E-selectin “valleys”. Although the VCAM-1 density ratio (mr/mr0) ranges between 4 to 7, which is significantly higher than that for E-selectin (3.5 to 4.5), the dual receptor targeting particles “see” a roughly uniform receptor density (≈ 5) on average, resulting in a more or less homogenous particle distribution along the branch length (Figure 5). Consequently, there is now a more symmetric distribution of particles between the two downstream branches under the dual receptor targeting approach (H ≈ 1.2) compared to their VCAM-1 only counterparts (heterogeneity index, H ≈ 1.4). Quite expectedly, the area-averaged particle density magnitude along the artery length for the 50:50 aVCAM-1:aEsel particles (Figure 5) falls roughly halfway between the same for VCAM-1 only and E-selectin only targeted particles, though the concentration profile pattern appears to be slightly skewed toward that for VCAM-1 targeted particles.
Similar studies were conducted for 30:70 and 60:40 aVCAM:aEsel particles (Supplementary Figure 5). The larger the proportion of VCAM-1 targeting component on the particle surface, the closer is the distribution pattern (and magnitude) to that of VCAM-1 targeting particles, and the greater is the asymmetry between the two branches (Supplementary Table 2). On the other hand, when aEsel ligands make up a higher proportion of particle surface coverage (e.g., 30:70 aVCAM:aEsel), a more uniform spatial distribution of particles is obtained. However, the overall particle surface density decreases. With a greater proportion of aEsel ligand coverage, particles have a higher probability of adhesion to E-selectin receptors. Therefore, regions with a higher E-selectin density elicit enhanced particle deposition subjected to similar hydrodynamic conditions. However, since E-selectin response to inflammation is generally modest compared to VCAM-1, there is a relatively smaller number of E-selectins available for molecular interaction at a given site. As a result, VCAM-1 adhesion behavior trumps that of E-selectin when they are targeted simultaneously. Consequently, a 30:70 aVCAM-1:aEsel ratio yields a lower particle surface density than its 50:50 counterpart.
adhesion model through the particle availability term C|s = particle concentration at the lumen wall interface. The area-averaged quantity (time-integrated over the duration of simulation) along the length of the coronary artery segment is presented in Supplementary Figure 2. When compared with the corresponding adhered particle distribution patterns (Figs. 5 and 8) along the vessel length, in certain cases (for example VCAM-1 targeted particles) it deviates significantly from the C|s pattern observed in Supplementary Figure 2. Considering how this profile of C|s is essentially the same for different sized particles in the highly advective coronary flow with relatively very low isotropic diffusivity (global Pe > 1000), it appears that the particle deposition parameter (=PaSdp/2) plays a relatively more dominant role in modulating particle adhesion pattern as reported in (Decuzzi and Ferrari, 2006, Hossain et al., 2012b). Also, from Supplementary Figure 2, we observe little heterogeneity in this average C|s between the two down stream branches, and yet we see various cases with a particle heterogeneity index > 1, further eluding to the fact that factors other than nanoparticle concentration transported by the bloodstream, namely local wall shear stress and receptor density, contribute to particle deposition heterogeneity for the cases considered herein.
Figure 8.
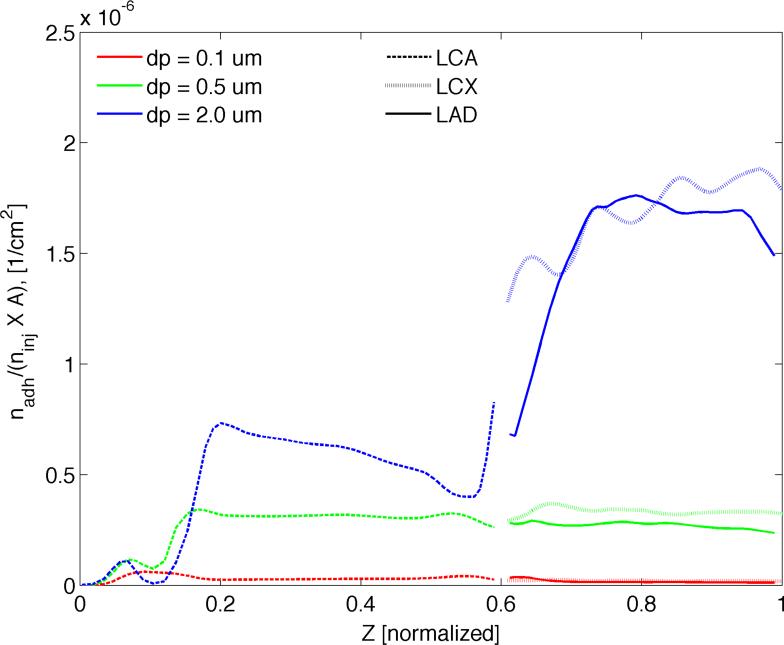
Comparison of particle size under dual targeting. The number of adhering 0.1, 0.5, and 2.0 μm particles at the end of simulation (t = 9 s) averaged over the circumference of each cross section taken at various “Z”-locations along the vessel centerline. Here nadh is the number of adhered particles, ninj is the total number of injected particles and A (cm2) is the surface area.
Similarly, when the branching angle was increased [see (Hossain et al., 2012b)], average C|s along the artery length was not affected much, although the flow split among the branches changed appreciably. Interestingly, the particle deposition pattern was affected due to the resulting changes in local wall shear rate patterns. The above scenario may very well be different for smaller caliber vessels.
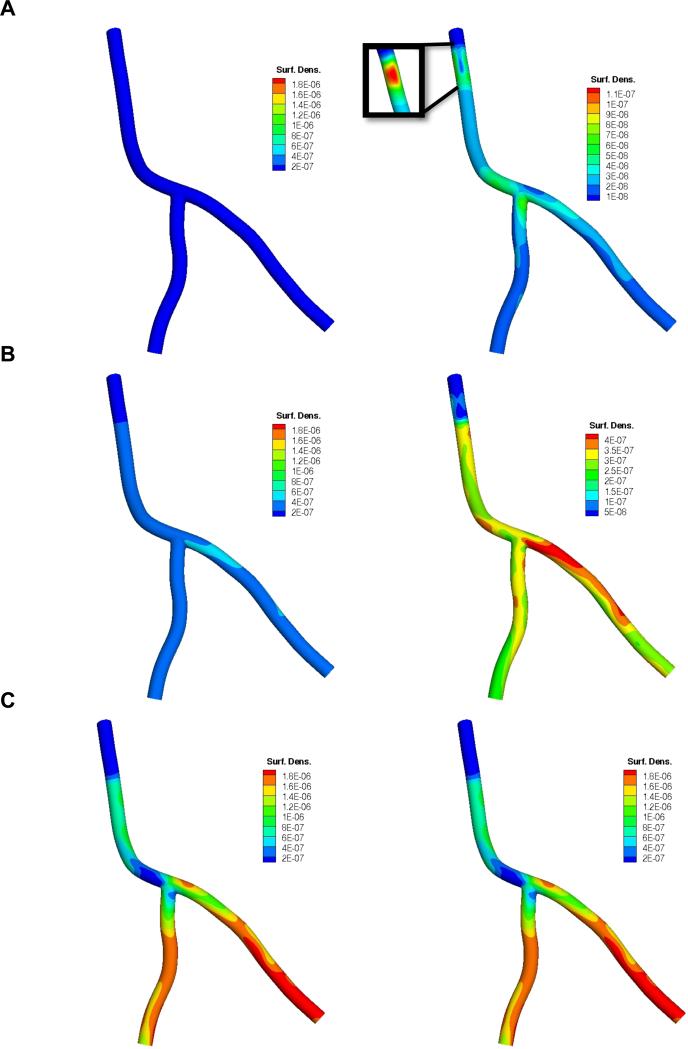
To investigate the role of particle geometry on adhesion under a dual-receptor targeting approach, the simulations were run for three different particles sizes for the 50:50 aVCAM:aEsel case. Figure 7 reports the spatial distribution of A) 0.1 μm, B) 0.5 μm and C) 2.0 μm particles in terms of their surface density (cm-2) normalized by the total number of injected particles (ninj). Spatial distribution pattern and magnitude varies significantly with particle size with larger particles adhering more. In Figure 8, it appears that 0.5 μm-sized particles yield a similar level of average particle surface density throughout all three branches: LCA, LAD and LCX. Clearly, larger particles (dp = 2.0 μm) lodge more efficiently in the downstream branches, while smaller particles (dp = 0.1 μm) adhere more in the upper (LCA) branch. The adhesion pattern correlates well with the local time-averaged WSS distribution pattern (Figure 3A), that is smaller particles attaining a higher surface density in high WSS regions and larger particles accumulating more in lower WSS areas. A case in point is particle density near the catheter, the sharp bend in the LCA and the LAD-LCX junction, where 2.0 μm particles lodge in significantly reduced numbers relative to the rest of the artery segment. On the other hand, for the dp = 0.5 μm case, the localized areas of low WSS just mentioned are much more densely populated than anywhere else. These observations are consistent with our findings in (Hossain et al., 2012b) that appear to be true for both single (Supplementary Figures 6 and 7) and two receptor-targeting particles.
Figure 7.
Surface density (cm-2) of A) dp = 0.1 μm, B) dp = 0.5 μm and C) dp = 2.0 μm sized particles at the end of simulation (t = 9 s) in terms of nadh/(ninj × A) where particle surface has 50% aVCAM-1 and 50% aEsel coverage. In the right column, color map scales are different. Here nadh is the number of adhered particles, ninj is the total number of injected particles and A (cm2) is the surface area.
Interestingly, for all three aVCAM:aEsel cases considered under the dual targeting approach, 0.5 μm particles have a higher heterogeneity index compared to the 0.1 μm and 2.0 μm particles. It appears that the larger particles yield a more symmetric distribution between the downstream branches. Also, the greater the proportion of aEsel, the more homogeneous is the distribution.
It is worth noting that since the primary focus of this work was on the transport and adhesion modeling, the coronary artery geometry was assumed rigid, neglecting both the motion of the heart and the vessel compliance. The results presented herein therefore should be interpreted within the constraint of a few potential limitations. For example, rigid wall models tend to overestimate local wall shear stress (Torii et al., 2009), which is a strong modulator of particle adhesion. However, since the time-averaged WSS is not known to be affected appreciably by wall deformation (Bazilevs, Takizawa et al. 2013), rigid wall approximation is deemed reasonable for our purposes (i.e., particle firm adhesion under shear flow). Nevertheless, particle adhesion to a moving and deformable coronary artery wall is worth investigating in future.
The effect of flow-split on particle adhesion involving multi-patient models needs to be studied as well. In a previous work (Hossain, Zhang et al. 2012) it was demonstrated that a considerable change in the bifurcation angle (by increasing the included angle between LAD and LCX by 30 degrees), keeping everything else the same, alters the LCX/LAD flow split, which also affects the local wall shear rate distribution, and consequently, the particle adhesion pattern. Similarly, by changing the relative resistance in the two outflow branches and keeping everything else the same, LoGerfo et al. also showed that the greater the flow split ratio, the lower the near wall velocity in the disturbed flow region (LoGerfo et al., 1981). These observations further indicate that patient-specific information is an essential ingredient in simulating realistic flow features and particle adhesion.
Extension of the current model to account for particle extravasation is also planned for future. There are a number of ways this can be incorporated depending on the particle size and tissue uptake mechanism. For example, smaller particles (< 50 nm) like drug molecules and LDLs, which are beyond the scope of this work, can permeate through the endothelial gaps. On the other hand, to account for the tissue uptake of larger particles (> 50 nm) upon their firm adhesion, the probability of adhesion formulation can be modified to include transcytosis. Additionally, rather than relying on an indirect estimation of patient-specific CAM distribution exploiting the relationship between local WSS and inflammatory response in-vitro, a more direct approach can be adopted in future as our model can readily include in-vivo receptor density data obtained from animal and human subjects through molecular imaging and/or histological analysis.
Conclusions
Utilizing a catheter-based delivery system, the NP transport within a patient-specific arterial tree was simulated and the surface density of adherent particles was quantified. The role of particle size on vascular deposition was analyzed under both single (ICAM-1, VCAM-1 and E-selectin) and dual receptor (aVCAM-1:aEsel) targeting. The complex interplay between local WSS, surface receptor density and particle availability dictate the particle adhesion pattern. Overall, VCAM-1 targeted particles adhere more, with ICAM-1 directed particles adhering least efficiently. ICAM-1 and E-selectin directed particles are distributed more uniformly over the three branches compared to VCAM-1, which exhibits a non-symmetric distribution between the two downstream branches with LCX attracting a larger portion of particles. However, under a two-receptor targeting approach where particles were coated with aVCAM-1 and aEsel ligands in equal proportions (50:50 coverage), a relatively more uniform distribution was achieved; although overall particle adhesion efficiency suffered (improved) when compared to VCAM-1 (E-selectin). The NP size influences the distribution pattern under both the single and dual targeting approaches. Larger (2 μm) particles lodge more in the downstream branches (LCD and LCX, with lower WSS), while smaller (0.1 μm) particles adhere more in the upper branch (LCA, with higher WSS).
In conclusion, the proposed computational tool-set can aid the rational design of NPs by accounting for critical patient-specific information, such as the authentic vascular geometry and the local distribution of WSS and vascular receptors thereby optimizing their in vivo targeting efficiency.
Supplementary Material
Acknowledgements
This work was supported by the Cancer Prevention Research Institute of Texas through the grant CPRIT RP110262, and through the grants from the National Institutes of Health (USA) (NIH) U54CA143837 and U54CA151668. Authors thank Benjamin Urick for his help with Figure 2.
Contributor Information
Shaolie S. Hossain, Department of Translational Imaging and Department of Nanomedicine, The Methodist Hospital Research Institute, 6670 Bertner Avenue, Houston, TX 77030, USA.
Thomas J.R. Hughes, Institute for Computational Engineering and Sciences, The University of Texas at Austin, 201 East 24th Street, Stop C0200, Austin, TX 78712, USA hughes@ices.utexas.edu; Phone: +1 512 232 7774; Fax: +1 512 232 7508
Paolo Decuzzi, Department of Translational Imaging and Department of Nanomedicine, The Methodist Hospital Research Institute, 6670 Bertner Avenue, Houston, TX 77030, USA.
References
- Adriani G, de Tullio MD, Ferrari M, Hussain F, Pascazio G, Liu X, et al. The preferential targeting of the diseased microvasculature by disk-like particles. Biomaterials. 2012;33:5504–13. doi: 10.1016/j.biomaterials.2012.04.027. [DOI] [PMC free article] [PubMed] [Google Scholar]
- Albini A, Tosetti F, Li VW, Noonan DM, Li WW. Cancer prevention by targeting angiogenesis. Nat Rev Clin Oncol. 2012;9:498–509. doi: 10.1038/nrclinonc.2012.120. [DOI] [PubMed] [Google Scholar]
- Bazilevs Y, Calo VM, Cottrell JA, Hughes TJR, Reali A, Scovazzi G. Variational multiscale residual-based turbulence modeling for large eddy simulation of incompressible flows. Computer Methods in Applied Mechanics and Engineering. 2007;197:173–201. [Google Scholar]
- Bazilevs Y, Calo VM, Zhang Y, Hughes TJR. Isogeometric Fluid–structure Interaction Analysis with Applications to Arterial Blood Flow. Computational Mechanics. 2006;38:310–22. [Google Scholar]
- Calderon AJ, Muzykantov V, Muro S, Eckmann DM. Flow dynamics, binding and detachment of spherical carriers targeted to ICAM-1 on endothelial cells. Biorheology. 2009;46:323–41. doi: 10.3233/BIR-2009-0544. [DOI] [PMC free article] [PubMed] [Google Scholar]
- Chen X, Wong R, Khalidov I, Wang AY, Leelawattanachai J, Wang Y, et al. Inflamed leukocyte-mimetic nanoparticles for molecular imaging of inflammation. Biomaterials. 2011;32:7651–61. doi: 10.1016/j.biomaterials.2011.06.030. [DOI] [PMC free article] [PubMed] [Google Scholar]
- Chiu J-J, Lee P-L, Chen C-N, Lee C-I, Chang S-F, Chen L-J, et al. Shear Stress Increases ICAM-1 and Decreases VCAM-1 and E-selectin Expressions Induced by Tumor Necrosis Factor-Œ± in Endothelial Cells. Arteriosclerosis, Thrombosis, and Vascular Biology. 2004;24:73–9. doi: 10.1161/01.ATV.0000106321.63667.24. [DOI] [PubMed] [Google Scholar]
- Chung AS, Lee J, Ferrara N. Targeting the tumour vasculature: insights from physiological angiogenesis. Nat Rev Cancer. 2010;10:505–14. doi: 10.1038/nrc2868. [DOI] [PubMed] [Google Scholar]
- Cunningham KS, Gotlieb AI. The role of shear stress in the pathogenesis of atherosclerosis. Lab Invest. 2004;85:9–23. doi: 10.1038/labinvest.3700215. [DOI] [PubMed] [Google Scholar]
- Decuzzi P, Ferrari M. The adhesive strength of non-spherical particles mediated by specific interactions. Biomaterials. 2006;27:5307–14. doi: 10.1016/j.biomaterials.2006.05.024. [DOI] [PubMed] [Google Scholar]
- Decuzzi P, Pasqualini R, Arap W, Ferrari M. Intravascular Delivery of Particulate Systems: Does Geometry Really Matter? Pharmaceutical Research. 2009;26:235–43. doi: 10.1007/s11095-008-9697-x. [DOI] [PubMed] [Google Scholar]
- Dinarello CA. Immunological and Inflammatory Functions of the Interleukin-1 Family. Annual Review of Immunology. 2009;27:519–50. doi: 10.1146/annurev.immunol.021908.132612. [DOI] [PubMed] [Google Scholar]
- Doriot PA, Dorsaz PA, Dorsaz L, De Benedetti E, Chatelain P, Delafontaine P. In-vivo measurements of wall shear stress in human coronary arteries. Coronary artery disease. 2000;11:495–502. doi: 10.1097/00019501-200009000-00008. [DOI] [PubMed] [Google Scholar]
- Hossain S, Hossainy S, Bazilevs Y, Calo V, Hughes T. Mathematical modeling of coupled drug and drug-encapsulated nanoparticle transport in patient-specific coronary artery walls. Computational Mechanics. 2012a;49:213–42. [Google Scholar]
- Hossain SS. Mathematical Modeling of Coupled Drug and Drug-encapsulated Nanoparticle Transport in Patient-specific Coronary Artery Walls[Thesis] University of Texas at Austin; Austin: 2009. Type. [Google Scholar]
- Hossain SS, Zhang Y, Liang X, Hussain F, Ferrari M, Hughes TJR, et al. In silico vascular modeling for personalized nanoparticle delivery. Nanomedicine. 2012b;8:343–57. doi: 10.2217/nnm.12.124. [DOI] [PMC free article] [PubMed] [Google Scholar]
- Jansen KE, Whiting CH, Hulbert GM. A generalized-[alpha] method for integrating the filtered Navier-Stokes equations with a stabilized finite element method. Computer Methods in Applied Mechanics and Engineering. 2000;190:305–19. [Google Scholar]
- Johnston BM, Johnston PR, Corney S, Kilpatrick D. Non-Newtonian blood flow in human right coronary arteries: Transient simulations. Journal of Biomechanics. 2006;39:1116–28. doi: 10.1016/j.jbiomech.2005.01.034. [DOI] [PubMed] [Google Scholar]
- LoGerfo FW, Crawshaw HM, Nowak M, Serrallach E, Quist WC, Valeri CR. Effect of flow split on separation and stagnation in a model vascular bifurcation. Stroke. 1981;12:660–5. doi: 10.1161/01.str.12.5.660. [DOI] [PubMed] [Google Scholar]
- Matsuo S, Tsuruta M, Hayano M, Imamura Y, Eguchi Y, Tokushima T, et al. Phasic coronary-artery flow velocity determined by doppler flowmeter catheter in aortic-stenosis and aortic regulation. American Journal of Cardiology. 1988;62:917–22. doi: 10.1016/0002-9149(88)90893-4. [DOI] [PubMed] [Google Scholar]
- McKinney VZ, Rinker KD, Truskey GA. Normal and shear stresses influence the spatial distribution of intracellular adhesion molecule-1 expression in human umbilical vein endothelial cells exposed to sudden expansion flow. Journal of Biomechanics. 2006;39:806–17. doi: 10.1016/j.jbiomech.2005.02.002. [DOI] [PubMed] [Google Scholar]
- Packard RRS, Libby P. Inflammation in Atherosclerosis: From Vascular Biology to Biomarker Discovery and Risk Prediction. Clinical Chemistry. 2008;54:24–38. doi: 10.1373/clinchem.2007.097360. [DOI] [PubMed] [Google Scholar]
- Taube A, Schlich R, Sell H, Eckardt K, Eckel J. Inflammation and metabolic dysfunction: links to cardiovascular diseases. American Journal of Physiology - Heart and Circulatory Physiology. 2012;302:H2148–H65. doi: 10.1152/ajpheart.00907.2011. [DOI] [PubMed] [Google Scholar]
- Teeguarden JG, Hinderliter PM, Orr G, Thrall BD, Pounds JG. Particokinetics In Vitro: Dosimetry Considerations for In Vitro Nanoparticle Toxicity Assessments. Toxicological Sciences. 2007;95:300–12. doi: 10.1093/toxsci/kfl165. [DOI] [PubMed] [Google Scholar]
- Torii R, Keegan J, Wood NB, Dowsey AW, Hughes AD, Yang G-Z, et al. The effect of dynamic vessel motion on haemodynamic parameters in the right coronary artery: a combined MR and CFD study. British Journal of Radiology. 2009;82:S24–S32. doi: 10.1259/bjr/62450556. [DOI] [PubMed] [Google Scholar]
- Tsou JK, Gower RM, Ting HJ, Schaff UY, Insana MF, Passerini AG, et al. Spatial Regulation of Inflammation by Human Aortic Endothelial Cells in a Linear Gradient of Shear Stress. Microcirculation. 2008;15:311–23. doi: 10.1080/10739680701724359. [DOI] [PMC free article] [PubMed] [Google Scholar]
- Zhang J, Alcaide P, Liu L, Sun J, He A, Luscinskas FW, et al. Regulation of Endothelial Cell Adhesion Molecule Expression by Mast Cells, Macrophages, and Neutrophils. PLoS ONE. 2011;6:e14525. doi: 10.1371/journal.pone.0014525. [DOI] [PMC free article] [PubMed] [Google Scholar]
- Zhang Y, Bazilevs Y, Goswami S, Bajaj CL, Hughes TJR. Patient-specific vascular NURBS modeling for isogeometric analysis of blood flow. Computer Methods in Applied Mechanics and Engineering. 2007;196:2943–59. doi: 10.1016/j.cma.2007.02.009. [DOI] [PMC free article] [PubMed] [Google Scholar]
Associated Data
This section collects any data citations, data availability statements, or supplementary materials included in this article.


