

Summary
Upon fertilization, maternal factors direct development and trigger zygotic genome activation (ZGA) at the maternal-to-zygotic transition (MZT). In zebrafish, ZGA is required for gastrulation and clearance of maternal mRNAs, which is in part regulated by the conserved microRNA miR-430. However, the factors that activate the zygotic program in vertebrates are unknown. Here, we show that Nanog, Pou5f1 and SoxB1 regulate zygotic gene activation in zebrafish. We identified several hundred genes directly activated by maternal factors, constituting the first wave of zygotic transcription. Ribosome profiling revealed that nanog, sox19b and pou5f1 are the most highly translated transcription factors pre-MZT. Combined loss of these factors resulted in developmental arrest prior to gastrulation and a failure to activate >75% of zygotic genes, including miR-430. Our results demonstrate that maternal Nanog, Pou5f1 and SoxB1 are required to initiate the zygotic developmental program and induce clearance of the maternal program by activating miR-430 expression.
In animals, maternal gene products drive early development in a transcriptionally silent embryo, and are responsible for zygotic genome activation (ZGA). ZGA occurs during the maternal-to-zygotic transition (MZT), when developmental control transfers to the embryonic nucleus. This universal transition represents a major reprogramming event that requires (i) chromatin remodeling to provide transcriptional competency, (ii) specific activation of a new transcriptional program and (iii) clearance of the previous transcriptional program. In Drosophila, maternal Zelda is required for activating the first zygotic genes through binding of TAGteam cis elements1,2. However, the maternal factors that mediate ZGA in vertebrates remain largely unknown3,4. In zebrafish, ZGA coincides with the midblastula transition (MBT) ~3 hours post fertilization (hpf), during which genome competency is established through widespread changes in chromatin5,6 and DNA methylation7,8. Bivalent chromatin marks are associated with zygotic genes thought to be ‘poised’ for activation5. Yet, many loci with active marks appear to be transcriptionally inactive5, suggesting that competent genes require induction by additional factors. ZGA is required for epiboly9, and the clearance of maternal mRNAs, a process regulated in part by the conserved microRNA (miRNA) miR-43010-12. While significant advances have taken place in understanding how vertebrate embryos acquire transcriptional competency and orchestrate the clearance of the maternal program, the factors that control activation of the specific genes during ZGA remain unknown. Here we combine loss-of-function analyses, high-throughput sequencing and ribosome footprinting to identify factors that activate the first wave of zygotic transcription to initiate nuclear control of embryonic development.
Identifying the first zygotic transcripts
To define factors that mediate transcriptional activation, we first sought to identify the earliest genes transcribed from the zygotic genome. Accurate characterization of the early transcriptome faces two main challenges: (i) zygotic transcription of a gene can be masked by a large maternal contribution, and (ii) poly(A)+ selection of mRNAs can lead to apparent increases in gene expression, reflecting delayed polyadenylation of maternal mRNAs rather than transcription. We reasoned that maternal mRNAs are spliced during oogenesis, so examining introns from total RNA would allow us to quantify de novo transcription independent of polyadenylation or maternal contribution. We performed Illumina total RNA sequencing on wild type (WT) embryos after the onset of zygotic transcription (4hpf, sphere; and 6hpf, shield) (Fig. 1a) compared to embryos before MBT (2hpf, 64-cell stage) and α-amanitin treated embryos, which lack zygotic transcription. This analysis identified 608 genes with significant increases in exon or intron expression levels > 5 RPKM (reads per kilobase, per million reads) at sphere stage (P < 0.1, Benjamini-Hochberg multiple test correction) (Fig. 1b,c, Supplementary Fig. 1a-h). Intron signal identifies an additional 6602 genes with low levels of transcription by 4hpf, and 9330 transcribed genes by 6hpf, expanding the number of zygotically expressed genes previously identified13,14 (Supplementary Fig. 1i-o). Over 74% of these are genes with maternal contributions (maternal and zygotic genes, M+Z), most of which are only identified by elevated intron signal (Fig, 1b, Supplementary Fig. 1g), reflecting the sensitivity of this method to detect de novo transcription.
Figure 1. Characterization of the zygotic transcriptome.
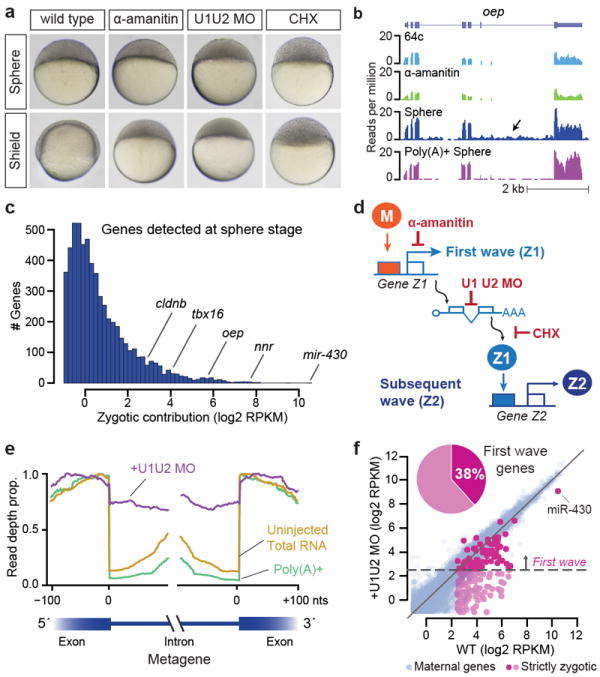
a. Embryos showing the effects of α-amanitin, U1U2 morpholino (U1U2 MO) and cycloheximide (CHX). b. Sequencing read density across oep. Intronic signal increases with zygotic expression in total RNA. c. Expression histogram of zygotic genes. d. Maternal (M) but not zygotic factors (Z1) can activate transcription upon splice or translation inhibition. e. Metagene of read density across exon-intron boundaries in first-wave genes. U1U2 MO shows enriched intron signal (purple). f. Biplot comparing expression in wild type and U1U2 MO. Points above 5 RPKM in U1U2 MO are considered first-wave genes.
Next, we examined which genes are directly triggered by the maternal program in the “first wave” of transcription by 4hpf, versus those activated by zygotic factors. We reasoned that blocking zygotic gene function while leaving maternal factors unaffected would uncouple the first from subsequent waves of zygotic transcription. To this end, we inhibited splicing of zygotic mRNAs using morpholinos complementary to U1 and U2 spliceosomal RNAs (U1U2 MO) (Fig. 1d, Supplementary Fig. 1a-d)15. U1U2 MO embryos arrest prior to epiboly (Fig. 1a), despite remaining transcriptionally active. Illumina sequencing revealed an enrichment in intron-exon boundary reads (Fig. 1e) and activation of a subset of zygotic transcripts to levels > 5 RPKM (Methods); these genes constitute the first wave of zygotic transcription (Fig. 1f). To test that these first-wave genes are indeed independent of zygotic factors, we treated embryos with cycloheximide (CHX) prior to MBT (32-cell stage) to selectively block translation of zygotic mRNAs, while allowing translation of maternal mRNAs. CHX-treated embryos also fail to reach epiboly (Fig. 1a) and have a highly correlated transcriptome profile with U1U2 MO (Pearson’s R = 0.97, Supplementary Fig. 2), confirming first-wave transcription in the absence of zygotic proteins. First-wave genes comprise both embryonic-specific and housekeeping genes ubiquitously expressed in adult tissues (Supplementary Fig. 3a) and are enriched in pattern specification, gastrulation and chromatin modifying functions (Supplementary Fig. 3b). We validated a subset of these genes by RT-PCR, including klf4b, nanor and isg15 (Supplementary Fig. 3c-k). Notably, the pri-miR-430 polycistron is highly expressed as part of this first wave (>1000 RPKM) (Fig. 1c, f). Together, these results identify 269 first-wave genes expressed by sphere stage for which maternal factors are sufficient for activation.
Nanog, SoxB1 & Pou5f1 activate the first wave
Considering the specific, widespread and steep pattern of zygotic gene activation, we hypothesized that the factors that trigger the first wave may include sequence-specific transcriptional regulators highly translated prior to ZGA. We analyzed the translation levels of all maternal mRNAs using ribosome profiling data (Fig. 2a)16. We found that Nanog, Sox19b and Pou5f1 (Oct4) are the most highly translated sequence-specific transcription factors (TFs) in the pre-MZT transcriptome (Fig. 2b). Pou5f1, the SoxB1 family (which includes Sox2 and Sox19b) and Nanog are key TFs involved in maintaining pluripotency in embryonic stem cells (ESCs) (reviewed in17,18). In zebrafish, Pou5f1 provides temporal control of gene expression19 and together with SoxB1 regulates dorsal-ventral patterning and neuronal development18,20-23, while Nanog is essential for endoderm formation through regulation of zygotic mxtx224.
Figure 2. Identification of Nanog, SoxB1 and Pou5f1 as zygotic gene regulators.
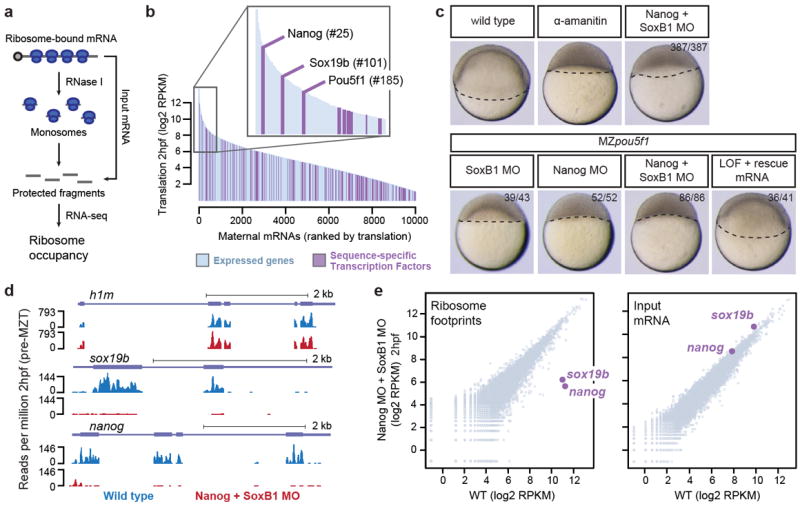
a. Schematic illustrating ribosome profiling. b. Rank plot showing translation levels pre-MZT. Sequence-specific transcription factors are highlighted. c. Embryos with combined loss of Nanog+SoxB1, Nanog+Pou5f1 or triple LOF arrest similar to α-amanitin and are rescued with mRNA injection. d. Ribosome footprints for h1m, sox19b and nanog in wild type and Nanog MO + SoxB1 MO. sox19b and nanog are highly depleted in the MO conditions. e. Biplots comparing wild type and MO ribosome footprints and input mRNA.
To examine the roles of Nanog, Sox19b and Pou5f1 in activating zygotic gene expression, we combined a maternal-zygotic loss-of-function (LOF) Pou5f1 (MZpou5f1)21 with previously published translation blocking morpholinos for Nanog24 and SoxB120 (Methods). Because Sox2, Sox3 and Sox19a have been shown to compensate for Sox19b loss, we used a combination of morpholinos targeting all four sox genes20 (Supplementary Fig. 4a). Simultaneous Nanog LOF in combination with SoxB1 or Pou5f1 resulted in complete developmental arrest prior to gastrulation, with >95% of the treated embryos failing to initiate epiboly (n=387 and n=52 respectively) (Fig. 2c, Supplementary Fig. 4b-e). This phenotype resembles that of α-amanitin injected embryos, suggesting that these factors play a role in activating zygotic genes. We used two different approaches to analyze the activity and specificity of these morpholinos. First, we performed ribosome profiling on WT and Nanog + SoxB1 MO injected embryos pre-MBT16,25. Translation efficiency for both Nanog and Sox19b was reduced >97% in the morpholino-injected embryos compared to WT (Fig. 2d, Supplementary Fig. 4f), but was largely unaffected for the rest of the transcriptome (Fig. 2e). Second, we co-injected mRNAs encoding nanog and soxB1 with the morpholinos and were able to rescue gastrulation (Fig. 2c, Supplementary Fig. 4c-e). Together, these results show that Nanog, Sox19b and Pou5f1 regulate progression through zygotic development and gastrulation.
Illumina sequencing revealed that combined loss of Nanog, SoxB1 and Pou5f1 results in widespread reduction in first-wave gene expression by 4hpf: 77% for strictly zygotic genes, 50% for M+Z genes. (Fig. 3a, b, Supplementary Fig. 5). By 6hpf, expression loss is systemic, with 86% of strictly zygotic and 79% of M+Z genes failing to be expressed to WT levels (Fig. 3a, b, Supplementary Fig. 5), an effect that was rescued by providing back the cognate mRNAs (Fig. 3c, Supplementary Fig. 5, 6). Comparing the single and double loss-of-function transcriptomes to the triple, we found that regulation is often combinatorial and redundant, with Nanog LOF having the strongest effect and SoxB1 the weakest (Fig. 3d, Supplementary Fig 7a-c). By 6hpf, affected genes include housekeeping genes, general transcription factors (e.g., gata6, otx1, irx1b, ntla) and major signaling components in gastrulation, anterior-posterior axis and dorsal-ventral axis specification (e.g., oep, fgf3, wnt11, chd, nog1, ndr2, bmp2b) (Supplementary Fig. 7d,e). Together, these results show that Nanog, Pou5f1 and SoxB1 play a fundamental role in activating the first wave, an effect that propagates to subsequent waves resulting in a global impact on zygotic gene expression.
Figure 3. Transcriptome-wide effects of loss of Nanog, SoxB1 and Pou5f1.
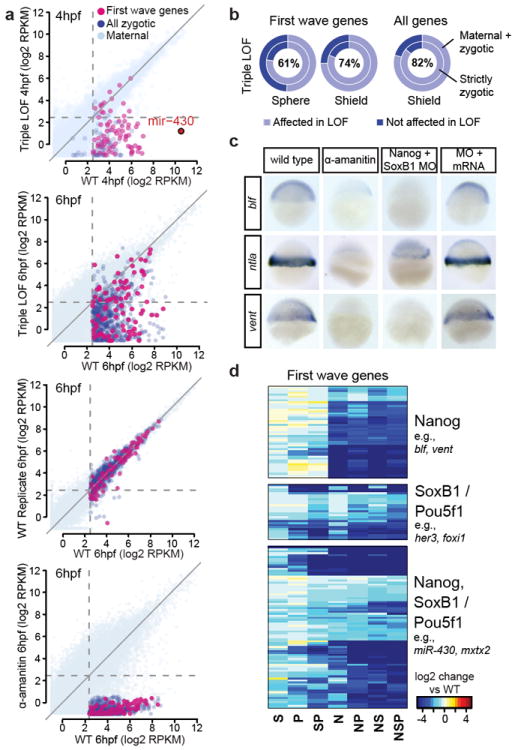
a. Biplots showing widespread gene expression loss in the triple LOF at 6hpf. b. Donut plots showing global effects of LOF. Percentages show the combined effect for strictly zygotic and maternal+zygotic (M+Z) gene groups. c. In situ hybridization shows expression defects in LOF embryos, which is rescued by mRNA injection.d. Heatmap showing first-wave zygotic genes in single and combined LOF conditions (N, Nanog MO; S, SoxB1 MO; P, MZpou5f1). Patterns shown are regulation by Nanog predominantly; SoxB1/Pou5f; or Nanog in combination with SoxB1/Pou5f1.
miR-430 is strongly activated by Nanog
Notably, among the first-wave genes co-regulated by Nanog, Pou5f1 and SoxB1 was miR-430, a miRNA that functions in the clearance of maternal mRNAs in zebrafish and Xenopus10-12. Northern analysis revealed a strong reduction of mature miR-430 levels in Nanog loss-of-function embryos (Fig. 4a). Although individual loss of SoxB1 or Pou5f1 had no detectable effect on miR-430 expression, when combined with Nanog LOF they reduced miR-430 levels even further, a phenotype that was rescued by co-injecting the respective mRNAs (Fig 4a-c). Nanog MO embryos failed to repress a GFP-reporter of endogenous miR-430 activity26, consistent with Nanog’s role in activating miR-430 (Supplementary Fig. 8a,b).
Figure 4. miR-430 expression is regulated by Nanog.
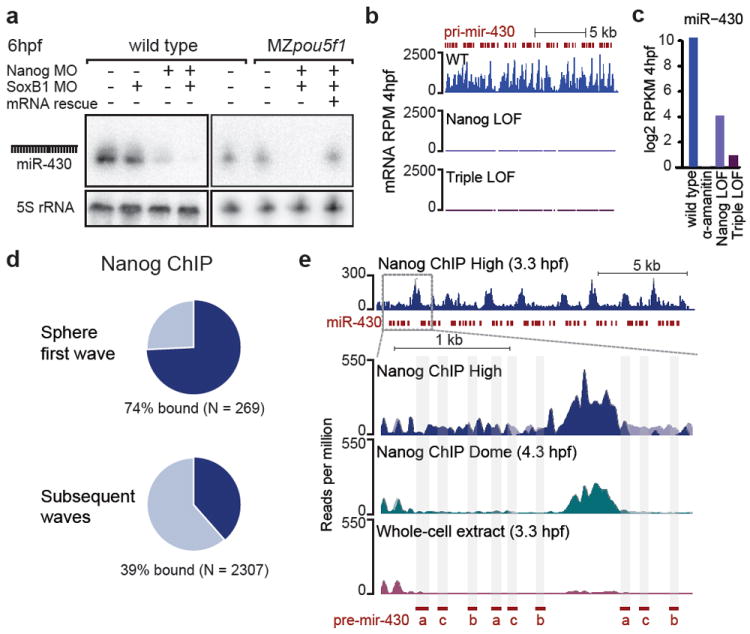
a. Northern blot shows miR-430 is severely reduced in Nanog LOF and nearly undetectable in the triple LOF b. RNA-Seq read levels of the pri-mir-430 polycistron in wild type and LOF. c. Bar plot of total miR-430 aligning reads. d. First-wave genes are highly bound by Nanog. e. Nanog binding across the miR-430 region (top panel) and a zoomed region where reads are preferentially aligned to the 5’ end. Binding profiles show a strong peak between two precursors. pre-miR-430a, b and c are marked in red.
To determine whether Nanog specifically binds the miR-430 genomic locus, we analyzed Nanog chromatin immunoprecipitation sequencing (ChIP-Seq) data at high (3.3hpf) and dome stage (4.3hpf)24. Consistent with widespread Nanog regulation, 74% of first-wave genes are bound by Nanog, a significant enrichment compared to subsequent-wave genes (Fig. 4d, Supplementary Fig. 9a). miR-430 is expressed from a 17kb genomic region on chromosome 4, which includes 55 repeated miR-430 hairpin sequences. Because this locus is repetitive, it had been excluded from previous analyses; however, the sequences are largely unique relative to the rest of the genome. Reads aligning the miR-430 locus were enriched >16-fold in the Nanog IP compared to whole cell extract (WCE), (Fig. 4e), indicating that strong Nanog binding throughout the locus correlates with strong miR-430 expression at ZGA. When the reads were aligned to the presumptive 5’ end of the polycistron, we observed a strong peak of binding in a ~600 nt region between two miR-430 precursors, which contains 3 canonical Nanog binding sites (CATT[T/G][T/G]CA)24,27.
To determine whether Nanog induces clearance of maternal mRNAs through activation of miR-430, we analyzed the expression of an endogenous miR-430 target, cd82b10. cd82b mRNA is maternally deposited and cleared in WT by 6hpf (Fig. 5a). In contrast, cd82b mRNA is stabilized in MZdicer mutants or α-amanitin treated embryos, which lack miR-430 processing and expression respectively. Similar loss of regulation is observed in Nanog+SoxB1 MO, as well as triple LOF embryos, a defect that is rescued by providing the cognate mRNAs (Fig 5b, Supplementary Fig. 8c). To determine the global effect of this regulation, we examined RNA-Seq levels of maternal mRNAs containing miR-430 target sites. Loss of Nanog alone or in combination with loss of SoxB1 and MZpou5f1, resulted miR-430 target stabilization, identical to MZdicer10,16,26 (Fig. 5c, Supplementary Fig. 8d-f) (P < 1E-51, two-sided Wilcoxon rank sum test). A significant, but weaker effect was observed in Pou5f1+SoxB1 LOF embryos (P < 1E-25) (Supplementary Fig. 8d). These results show that Nanog together with Pou5f1 and SoxB1 activate miR-430 expression, thus revealing a genetic network that links maternal regulation of zygotic gene expression to zygotic clearance of maternal mRNAs.
Figure 5. miR-430 activity is abrogated by Nanog LOF.
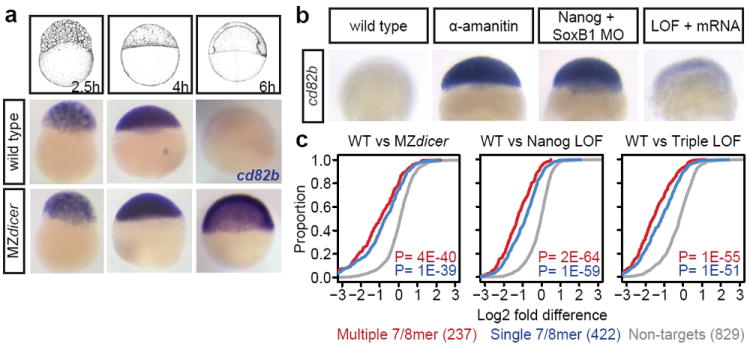
a. In situ showing degradation of miR-430 target cd82b at 6hpf in wild type, compared to stabilization in MZdicer (lacking miR-430 activity). b. cd82b is stabilized in the Nanog-SoxB1 LOF embryo, indicating loss of miR-430 activity. The effect is rescued with injection of nanog and soxB1 mRNA. c. Cumulative plots showing stabilized expression of miR-430 targets in MZdicer and LOF embryos, compared to wild type. P values are for two-sided Wilcoxon rank sum tests comparing each miR-430 target group to non-targets.
Discussion
Our transcriptome analysis during the maternal-to-zygotic transition provides three major insights. First, maternal factors directly regulate hundreds of mRNAs that constitute the first wave of zygotic transcription. These targets are activated in the absence of zygotic gene function and are enriched for genes that guide early embryonic development. Transcriptional competence coincides with changes in the chromatin and DNA methylation states of the genome4-8. Modifications to the epigenetic landscape during the MZT may be sufficient to allow basal levels of transcription; however, we show here that maternal transcription factors play a vital role in shaping transcriptional output.
Second, we observe that Nanog, SoxB1 and Pou5f1, previously implicated in the maintenance of pluripotency, contribute to widespread activation of zygotic genes during the MZT. These maternal factors enhance transcriptional activation of more than 74% of first-wave zygotic genes, and by 6hpf influence expression of >80% genes over all. Simultaneous removal of Nanog with SoxB1 and/or Pou5f1 results in complete block of gastrulation and developmental arrest, similar to global inhibition of zygotic gene expression (Fig. 2c, Supplementary Fig. 9c). Nanog binds 74% of first-wave genes during the early stages of ZGA (Fig. 4d). Additionally, while this manuscript was under review, Pou5f1 and Sox2 were also shown to associate with ~40% of early zygotic genes28. However, SoxB1+Pou5f1 LOF is insufficient to block gastrulation and zygotic development28 (Fig. 2c). This highlights the central role of Nanog, which together with Pou5f1/SoxB1 initiates the zygotic program of development, though it is likely that additional factors cooperate with them to provide genome competency and regulate the timing of ZGA4. In mouse, Oct4 and Nanog have been proposed to regulate gene expression at 2-cell stage29,30 and along with Sox2 are required for specification of the blastocyst lineages31-33. In fact, when we analyze early zygotic genes in mouse, we find that they are enriched for Nanog, Oct4 and Sox2 binding in embryonic stem cells (Supplementary Fig. 9b). Conceptually and mechanistically, many parallels exist between the MZT and the cellular reprogramming that occurs in induced pluripotent stem cells (iPSCs)3,12. Indeed, reprogramming of terminally differentiated cells was first shown in the context of the early embryo through nuclear transfer34,35. The onset of zygotic development can be viewed as a major reprogramming event that occurs upon fusion of two terminally differentiated cells (sperm and oocyte). As shown in ES cells and iPSCs, Pou5f1, Nanog and Sox2 are central players in the induction36-40 and maintenance41-43 of pluripotency in vivo and in vitro17,35. In these contexts, part of their role is to serve as “pioneering” factors, binding to silent chromatin to facilitate de novo gene expression44. This pioneering activity is likely recapitulated during the MZT, where an endogenous function of Nanog, SoxB1 and Pou5f1 is to mediate activation of the first wave of zygotic genes, establishing a transient pluripotent state.
Third, we show that Nanog together with SoxB1 and Pou5f1 directly regulates miR-430, which is responsible for clearance of maternal mRNAs during the MZT10-12, facilitating the transfer of developmental control to the zygotic program (Supplementary Fig. 9c). Members of the conserved miR-430/295/302/372 family of miRNAs stabilize self-renewal fate in ES cells and enhance reprogramming efficiency45,46. We hypothesize that in both cases, these miRNAs are ‘clearing the slate’ by accelerating the removal of mRNAs from the previous program, thus facilitating the establishment of new transitional states by reprogramming factors12. The dramatic upregulation of miR-430 expression by Nanog, SoxB1 and Pou5f1 provides a central link between the mechanisms that drive zygotic gene activation and the clearance of the previous maternal history.
Methods
Zebrafish maintenance
MZpou5f1hi349Tg/ hi349Tg 48 were generated as previously described by 21. Embryos obtained from natural crosses between homozygous MZpou5f1hi349Tg/ hi349Tg mutants were injected with 30pg of pou5f1 mRNA at the one-cell stage. MZdicerhu896/hu896 fish were generated as described in 26. Zebrafish wild type embryos were obtained from natural crosses of TU-AB and TLF strains of mixed ages (5-17 months). Selection of mating pairs was random from a pool of 60 males and 60 females allocated for a given day of the month. Fish lines were maintained in accordance with AAALAC research guidelines, under a protocol approved by Yale University IACUC.
Treatments and mRNA injection
Embryos from all wild type crosses were pooled following collection and distributed equally between experimental conditions. Unless otherwise stated, a minimum of 30 wild type embryos were subjected to each treatment in each experimental replicate. Morpholinos were obtained from Gene Tools and resuspended in nuclease-free water. Unless otherwise stated, one nanoliter of MO solution was injected into dechorionated embryos at the one-cell stage. A combination of two MOs were used to target each gene in a 1:1 ratio as described in 49, with one SoxB1 morpholino targeting a conserved region of both sox2 and sox3. Nanog and SoxB1 MOs were previously described in 24 and 49 respectively. For individual and combinatorial loss-of function, wild type and MZpou5f1 embryos were injected with 1ng of each SoxB1 MO (0.125mM) and 5ng of Nanog MO (0.6mM). For inhibition of splicing, one MO (1.25mM) complementary to U1 and two MOs (0.6mM each) complementary to isoforms of U2 spliceosomal RNAs (U1U2) were used 15,50,51. Divergence of the U2 genes in zebrafish requires the use of two different morpholinos to block activity.
Zebrafish Nanog and SoxB1 capped mRNA was generated by in vitro transcription using mMessage mMachine Sp6 Kit (Ambion) in accordance to the manufacturer’s instructions. For Nanog MO rescue, zebrafish nanog was cloned into a pCS2 vector and sense mutations introduced during PCR amplification (indicated in lowercase): 5’ATGGCaGAtTGGAAaATGCCgGTGAGTTAC. SoxB1 rescue constructs were kindly provided by Yusuke Kamachi 49. To rescue the loss-of-function phenotype, 50pg of Nanog and 20pg of SoxB1 mRNAs were injected either individually or together into morpholino injected embryos at one-cell stage. Triple loss-of-function embryos were additionally injected with 30pg of Pou5f1 mRNA.
Pol II inhibition: α-amanitin was obtained from Sigma Aldrich and resuspended in nuclease-free water. Dechorionated embryos were injected with 0.2ng of α-amanitin at one-cell stage52.
Translation inhibition: wild type embryos were collected and dechorionated at one-cell stage. To allow for translation of maternal mRNAs, at 32-cell stage, embryos were transferred to media containing Cycloheximide (50μg/mL) (Sigma Aldrich) and incubated at 28°C. Embryos were collected and frozen in liquid nitrogen at sphere and shield stage. Total RNA was extracted using Trizol (Invitrogen) and resuspended in 10μL RNase-free water.
To assay miR-430 activity, a GFP reporter was used as previously described 26. GFP and dsRed mRNAs were in vitro transcribed using mMessage mMachine Sp6 Kit (Ambion) in accordance to the manufacturer’s instructions. Embryos were injected with 150pg of GFP reporter and 100pg of dsRed loading control at the one-celled embryos.
All phenotypes were initially assayed by one experimenter and blindly confirmed and/or imaged by another. Distribution-free statistics were used to determine significance, except for calculating RNA-Seq differential expression (see below).
In situ hybridization
Template for in situ probes were amplified from shield stage cDNA and a T7-promoter sequence added for in vitro transcription. Primers are listed below. Antisense digoxigenin (DIG) RNA probes were generated by in vitro transcription in 20μL reactions consisting of 100ng purified PCR product (8μL), 2μL DIG RNA labeling mix (Roche), 2μl 10X transcription buffer (Roche), and 2μl T7 RNA polymerase (Roche) in RNAse-free water and purified using a QIAGEN RNEasy kit. In situ protocol was followed as detailed in 26. To reduce variability, the following conditions were combined in the same tube during in situ hybridization and recognized based on their morphology: 1) wild type and α-amanitin injected embryos and 2) Nanog + SoxB1 MO with and without rescue mRNA. Prior to photo documentation, embryos were cleared using a 2:1 benzyl benzoate:benzyl alcohol solution. Images were obtained using a Zeiss stereo Discovery.V12.
Northern analysis
To detect endogenous miR-430, ten wild type and MZpou5f1 embryos injected with Nanog MO and SoxB1 MO were collected at 6hpf and flash frozen in liquid nitrogen. Total RNA was extracted using Trizol (Invitrogen) and resuspended in 5μL RNase-free water and 5 μL 2X loading buffer (8M urea, 50mM EDTA, 0.2mg/ml xylene cyanol, and 0.2mg/ml bromophenol blue). Northern protocol was followed as detailed in 16.
Ribosome Profiling
Fifty wild type embryos injected with one nanoliter of Nanog MO (0.6mM) and SoxB1 MO (0.125mM) and fifty non-injected embryos were collected at 64-cell stage. Embryos were lysed using 800ul of a mammalian cell lysis buffer containing 100ug/ml Cycloheximide as per the manufacturers instruction (ARTseq Ribosome Profiling Kit, RPHMR12126, Epicentre). For nuclease treatment, 3ul of ARTseq Nuclease was used. Ribosome protected fragments were run and 28-29nt fragments were gel purified as previously described in 16 and cloned according to the manufacturers protocol (ARTseq Kit). Illumina libraries were constructed and sequence reads analyzed as in 16. Subsequent to sequencing, traces of exogenous RNA corresponding to a nanog antisense probe, and ntla sense and antisense were detected outside the expected size range. Only 28 and 29nt sense sequences were used in the analysis matching the size of the ribosome footprint.
Reverse Transcription PCR (RT-PCR)
Total RNA from ten embryos was extracted using TRIzol (Invitrogen) at sphere and shield stage for each experimental condition. RNA was treated with TURBO DNase (Ambion) for 30 minutes at 37°C and extracted using phenol chloroform. cDNA was generated by reverse transcription with random hexamers using SuperscriptII (Invitrogen). RT-PCR reactions were carried out at an annealing temperature of 60°C for 35 cycles. Primers are listed below.
Illumina Sequencing
Total RNA was extracted as above, and strand-specific TruSeq Illumina RNA sequencing libraries were constructed by the Yale Center for Genome Analysis. Prior to sequencing, samples were treated with Epicentre Ribo-Zero Gold kits according to the published protocol, in order to deplete ribosomal RNA. Samples were multiplexed on Illumina HiSeq 2000 / 2500 machines to produce single-end 76 nt reads.
Raw reads were initially filtered by aligning permissively to a ribosomal DNA index using Bowtie v0.12.9 53 with switches --seedlen 25 -n 3 -k 1 -y -e 10000. Unaligned reads were then aligned to the zebrafish Zv9 (UCSC danRer7) genome sequence using Tophat v2.0.7 54 with default parameters.
Hybrid gene models were constructed from the union of zebrafish Ensembl r70, RefSeq annotations (downloaded from genome.ucsc.edu on 2/8/2013), and Ensembl RNA-Seq gene models 55. All overlapping transcript isoforms were merged in order to produce maximal exonic annotations. To quantify exonic expression levels per gene, genome-uniquely aligning reads overlapping >= 10 nts to the exonic region of a given gene were summed. To quantify intronic expression levels per gene, an annotation mask was first created consisting of repetitive sequences as annotated by RepeatMasker in addition to any region aligned by >=2 reads in the α-amanitin samples; this is to minimize false positive introns due to annotation inconsistencies, under the assumption that the transcriptionally inhibited α-amanitin transcriptome should contain no intron-containing transcripts. Valid intron-overlapping reads aligned the intronic region uniquely and overlapped no more than 50% to the masked regions. For the purposes of RPKM normalization, we considered intron length to be the number of unmasked nucleotides. We additionally identified reads that mapped to at most two different genic loci (e.g., two closely related paralogs) and from these calculated “meta gene” expression values. Meta genes were treated as conventional genes for differential expression, but counted as two different genes in subsequent analyses.
The miR-430 locus is internally repetitive; therefore, reads were aligned to miR-430 in a separate step using Bowtie with switches -n 2 -k 1 on the genomic region chr4:27999472-28021845, which spans the presumed mir-430 polycistron. Reads overlapping any of the Ensembl annotated miR-430 hairpins in this region were counted as mir-430 cluster reads. Reads are counted only once, regardless of the number of times they overlap.
Differential gene expression analysis
Differential expression analysis was performed using the R package DESeq 47 with the parameters fit-type = local and sharingMode = fit-only. For exonic expression comparisons, raw exon-overlapping read counts were assembled for all genes with a raw read count of at least 10 in one or more of the samples. Genes annotated as Ensembl biotypes ‘IG_C_pseudogene’, ‘IG_pseudogene’, ‘IG_V_pseudogene’, ‘misc_RNA’, ‘Mt_rRNA’, ‘Mt_tRNA’, ‘non_coding’, ‘nonsense_mediated_decay’, ‘retained_intron’, ‘rRNA’, ‘sense_intronic’, ‘sense_overlapping’, ‘snoRNA’, ‘snRNA’ were excluded. Additionally, all Ensembl miR-430 annotations were excluded, and a meta “miR-430 hairpin” gene added in, based on the quantification described in the previous section. For intronic expression comparisons, since overall counts are lower, variance models for DESeq were calculated using both intronic counts and exonic counts as separate gene entries (i.e., at most 1 intronic count entry and 1 exonic count entry per gene). Differential expression proceeded as normal, except multiple test correction of p values was applied relative only to the intronic counts.
Six sets of differential expression analyses were performed separately: exons and introns for each of (Group 1) WT 64c, WT Sphere, WT Shield, α-amanitin 4hpf, and α-amanitin 6hpf, with the two α-amanitin conditions serving as pseudo replicates for DESeq for variance estimation; (Group 2) Sphere stage WT, -Nanog, -Nanog-Sox, -Pou, -Nanog-Sox-Pou, and 2 biological replicate shield stage WT samples for variance estimation; (Group 3) Shield stage WT, -Nanog, 2 -Nanog-Sox conditions treated as non replicates, -Pou, -Sox-Pou, -Nanog-Sox-Pou, and 2 additional biological replicate shield stage WT samples to parallel Group 2. For Groups 2 and 3, we applied an exonic RPKM >= 1 and intronic RPKM >= 0.5 threshold in one or more of the samples.
Zygotic transcription was determined based on significant exon and intron increases in sphere and shield stages relative to α-amanitin. 64c (pre-MBT) was used as further confirmation when no significant changes in intron level were detected or the gene was intronless (genes with <10 nts of unmasked intron sequence were considered effectively intronless). Increases in either exon signal, intron signal, or both determined positive zygotic transcription. For genes with a maternal contribution, increases in intronic signal due to zygotic transcription can be accompanied by no change or decreases in exonic signal. For genes significantly expressed, zygotic expression contribution is estimated using either intronic RPKM level; or the RPKM difference between the post-MZT condition and the maximum of 64c and α-amanitin expression levels. Expression calls are provided in Supplementary Data Table 1.
To define first-wave genes, genes that were detected as transcribed in the U1U2 MO treated embryos above an expression level of 5 RPKM were considered to be first wave, using an estimate for zygotic transcription based on intronic signal for multi-exon genes, or comparison to α-amanitin and 64c for single-exon genes as described above. Although a cut off of 5 RPKM was used for the main analyses, lower levels of transcription were observed for many genes, indicating weaker degrees of activation. Genes that were not called as transcribed in wild type sphere were removed.
Classification of loss of function expression categories
Significant changes in loss of function conditions relative to wild type were determined using either intron or exon signal, depending on the pattern of signal originally used to call the gene as zygotically expressed. For genes with no maternal contribution, decreases in either exon levels relative to wild type are considered to be loss of zygotic expression, while increases in either exon or intron levels are considered to be ectopic increases in zygotic expression. For genes with maternal contribution, we distinguish between two cases: (1) if zygotic transcription was originally detected in wild type only using intronic signal, then loss of zygotic transcription in the loss of function conditions is called only when intronic signal is lost; (2) if zygotic transcription was originally detected in wild type with both exonic and/or intronic signal, then decreases in either intronic levels or exonic levels indicate loss of zygotic expression, with intronic signal taking precedence when the directions of change disagree. For LOF embryos with the MZpou5f1 genotype, differential expression was additionally performed between uninjected and injected MZpou5f1 conditions, and expression differences between the injected conditions and wild type were required to be transitively consistent -- e.g., if a gene is called significantly lower in uninjected MZpou5f1 than wild type, and a gene is significantly lower in injected MZpou5f1 than uninjected MZpou5f1, then the gene must also be considered lower in the injected compared to wild type. To ensure that expression level differences in the MZpou5f1 background are due to zygotic contributions, in addition to relying on intron signal, we filtered out any genes that were previously reported to be differentially maternally provided in MZpou5f1 19.
ChIP-Seq analysis
Reanalysis of previously published Nanog ChIP-Seq data (GSE34683) was performed as described in 24, except using the current version of the zebrafish genome, Zv9. For miR-430 locus alignment, reads were aligned exhaustively to the region chr4:27994413-28019085 (2kb +/- the miR-430 polycistron) using Bowtie with parameters -v 1 --best --strata --all. To estimate read depth and enrichment, reads were normalized by the number of times the read aligned the genome. To focus on the maximally non-redundant region in the locus, reads were preferentially aligned closest to the presumptive 5’ boundary of the polycistron (chr4:28000732, corresponding to the 5’ end of ENSDARG000000082539).
Morpholino Oligonucleotide sequence
| sox2-MO2 | CTCGGTTTCCATCATGTTATACATT |
| sox3-MO1 | TACATTCTTAAAAGTGGTGCCAAGC |
| sox3-MO2 | GAAGTCAGTCAAAAGTTCAGAGAGC |
| sox19a-MO1 | GTACATGGCTGCCAACAGAAGTTAG |
| sox19a-MO2 | AAAACGAGAGCGAGCCGTCTGTAAC |
| sox19b-MO1 | GTACATCATGCCACTTCTCGCTTTG |
| sox19b-MO2 | ACGAGCGAGCCTAATCAGGTCAAAC |
| nanog-MO1 | CTGGCATCTTCCAGTCCGCCATTTC |
| nanog-MO2 | AGTCCGCCATTTCGCCGTTAGATAA |
| U1-MO1 | GGTATCTCCCCTGCCAGGTAAGTAT |
| U2-MO1 | TGATAAGAACAGATACTACACTTGA |
| U2-MO2 | TATCAGATATTAAACTGATAAGAAC |
In situ Primers
| ntla | TGGAAATACGTGAACGGTGA | *GTACGAACCCGAGGAGTGAA |
| isg15 | AGAAGGGCCAGGTCAAAACT | *CATCACGGCATTGAAAACAC |
| cebpb | GTATGCAAGCAGCCAGTCAA | *TGTACTCGTCGCTGTCCTTG |
| cldne | TGGTGTCTATGTGCCGAGAG | *CGGCTGGGAGTATTTCATGT |
| krt18 | ATCACCGGCCTAAGAAAGGT | *TCGTACTCCTGCGTCTGATG |
| foxa3 | CTTCAACGATTGCTTCGTCA | *CATCTTCTGCTCGTTGGAC |
| vent | ACCCAGCAAGTTCTCAGTGG | *TAGCAGCGTGTGAACAGCAT |
| nnr | CAGAGATGGACAGCGATTCA | *TTCGTTTCCTTCTGGGAGTTT |
| blf | GTCTCACAAGCGAATCCACA | *GTGTGGGTCTTCTCGTGGTT |
RT-PCR Primers
| nnr | AGCGTTTACAGCGGATCTCA | *AGTGGACGGGGAAATAAACC |
| isg15 | CGAAAGCCTCATTCAGCAAC | *GTGCAACTTCATGCCAGACTC |
| cldne | TGGTGTCTATGTGCCGAGAG | *CGGCTGGGAGTATTTCATGT |
| sox11a | CGAAACGGACAGCATGTCTA | GGAGTCGTCATCGTCGTCTT |
| grhl3 (1/2) | GAGGAGACCGGATACCAAACT | CCAAGCTCCACTGTGTTTGT |
| grhl3 (1/3) | GAGGAGACCGGATACCAAACT | TTGTAAATGCTGCTCTCACG |
| cldnb | ACTCCCCATGTGGAAAGTCA | GGGGTTGCGTTGTATTTAGC |
| krt4 | GCAACCTCCTCCACTCACTC | AATTGTGGGGTCAATTTCCA |
| hist1h2aa | CAAAGGCTAAGACTCGCTCCT | TCTGTCTTCTTGGGCAGCAG |
| tubb4b | AGGTCTGGTCCATTTGGTCA | CATCCAGAACGGAATCAACC |
| klf4b | ACAGTTGTGAATTCCCTGGATG | GTTTACATGTGCCTCTTCATGTG |
| vox | GACTGGCTTGCTCAGAGCTT | GGCCGCTTCACTCTCATAAC |
| tbx16 | AACCTTTACCTTCCCCGAGA | CAAGACTCGGGACTCAAAGC |
qRT-PCR Primers
| blf | CCCTGCTGAGCTTGCATAGT | CCCACACTGAGGACACTTGA |
| cldne | GGCTTCTTGGGAGCCATTAT | GCGAAAAAGCTGACGATGAT |
| ctcf | GTTAGCAGAGGCTTGCTTTACTG | GCAGTGAAATTTCGCCACA |
| dact1 | AGCCTCGGTTCTTCTTCACA | GGAGGATTTGTGCAAGTGGT |
| dusp1 | CTCCAGTAATGTGCGCTTCA | TGGTCGAACTTTTGACCTTCA |
| ef1a | TGATCTACAAATGCGGTGGA | CAATGGTGATACCACGCTCA |
| her5 | CCAAGCCTCTCATGGAGAAA | TAGCTCTGACGTTTGCATGG |
| mtATP6 | CTTTAGCGGCCACAAATGAG | ATGGGGGTTCCTTCTGGTAA |
| mtND5 | TTCTTATGCTCAGGGGCAAT | TTAGGGCTCAGGCGTTAAGA |
| mxtx1 | GAAATGCAAGGGTGGAAAAA | ACCCCAGTTAGGAGGCATCT |
| oep | TTCTGGAAAGCCAAAGCAAT | TCATGTCAGTGTGCAGCTTG |
| pcf11 | CCTCGCTGGAAGATCTGACT | CATGTTACAGGCCTCATGTCA |
| tdp2b | GGAGCCCACCTGCTCTATTA | ACCCTGCCAATTGTGAAGATA |
Supplementary Material
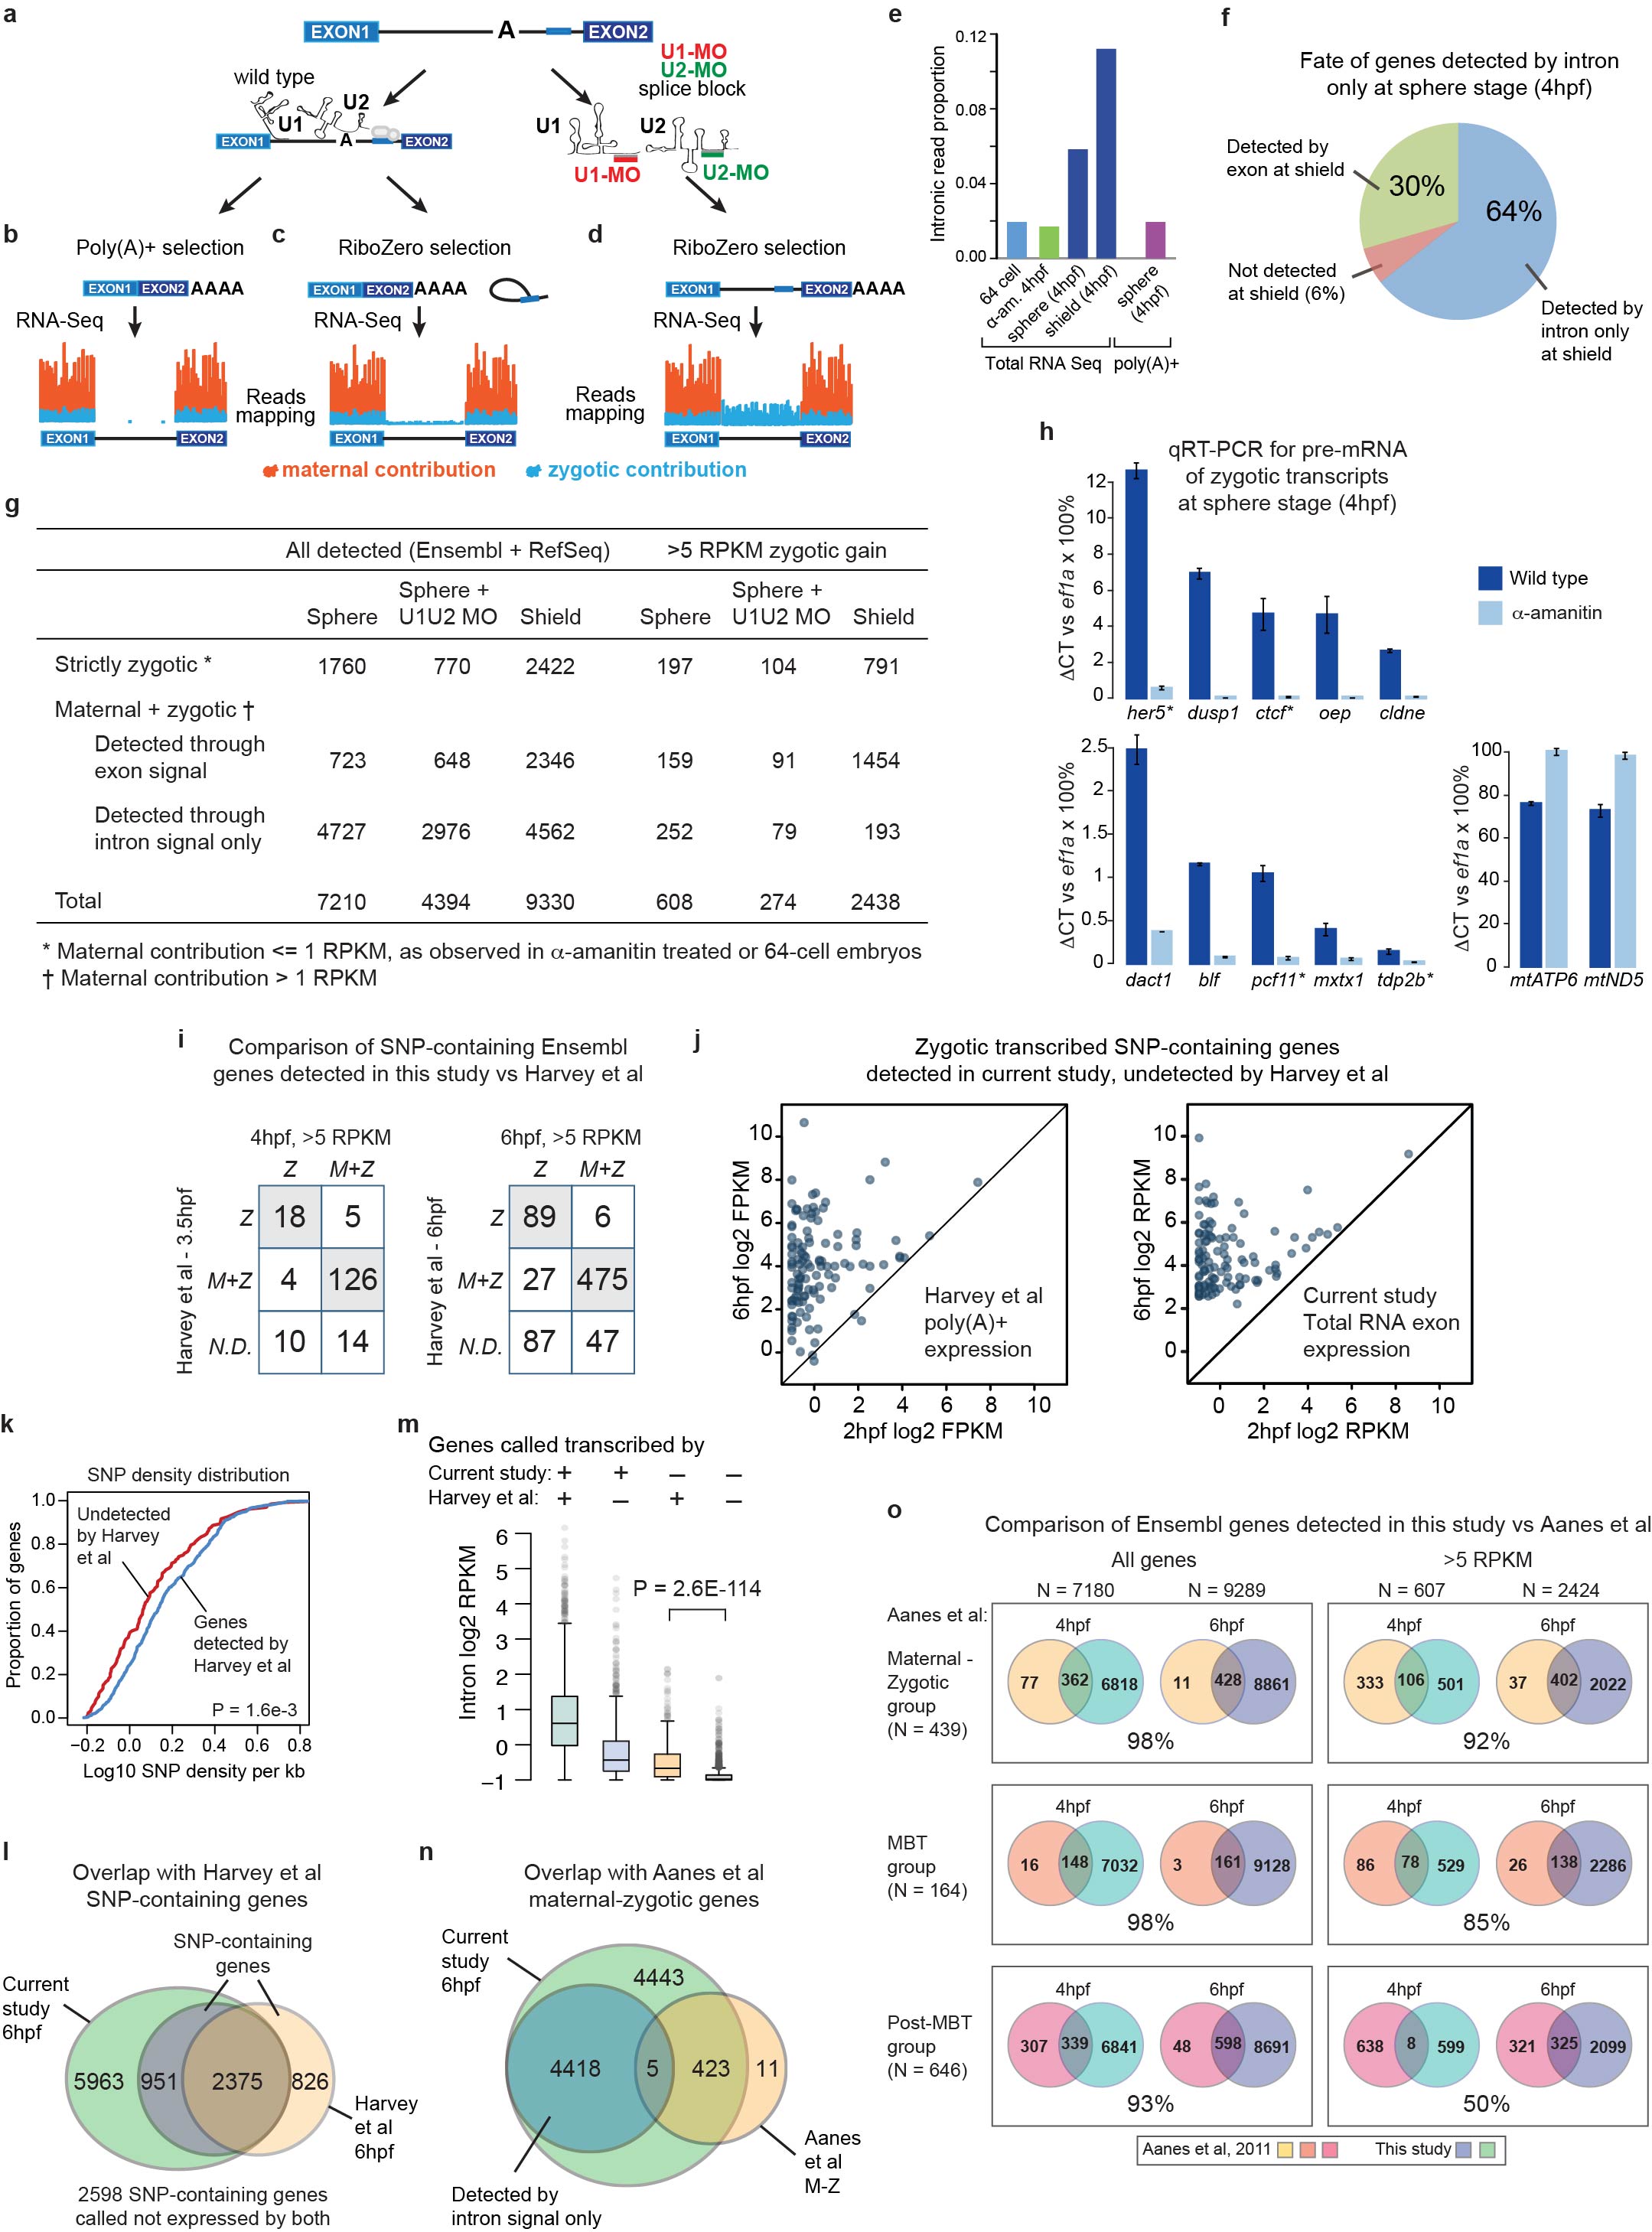
a, Schematic of the sequencing strategy used in this study. The majority of zebrafish protein-coding genes (>95%) contain introns. De novo transcription produces intronic RNA sequences, which are spliced out of pre-mRNAs by the spliceosome, consisting of several ncRNA species including U1 and U2. b, Typical mRNA-Seq applications use poly(A)+ selection to enrich for the mature mRNA population. Sequence reads thus map predominantly to exonic regions, with very few reads mapping to introns. During embryogenesis, many zygotic transcribed genes are expected to have a maternal contribution in the cytoplasm from the oocyte. Thus, the resulting signal will be a mixture of maternal-derived (orange) and zygotic-derived (blue) mRNA molecules, which cannot be deconvoluted without comparing to a reference sample to look for exon expression level change. c, mRNA-Seq applications that skip poly(A)+ selection and instead use a rRNA depletion protocol (RiboZero) will not enrich for the mature mRNA population. Thus, transcripts in all stages of biogenesis (e.g., pre-mRNA, partially spliced mRNA, spliced introns) will be sequenced, and reads are expected to map both to exons and introns. Because maternally contributed mRNAs are mature, any intron signal detected must derive from de novo zygotic transcription. To determine the background signal for each intron, α-amanitin is used as a negative control for transcription. d, Morpholinos complementary to U1 and U2 injected into one-cell embryos inhibit zygotic splicing. Thus, pre-mRNAs fail to be processed, and the entire population of zygotic mRNAs will be unspliced. There are two benefits: i) intron signal is amplified, since introns are stabilized in the pre-mRNA compared to spliced out introns; ii) protein production from zygotic mRNAs is effectively halted, since pre-mRNAs are generally not competent for normal translation. Thus, only the first wave of transcription, resulting from activation by maternal factors, is observed. Transcription that requires zygotic proteins (subsequent waves) will be largely absent. e, Bar plot showing proportion of sequencing reads aligning to gene introns. Total RNA sequencing reveals elevated intronic sequence reads, corresponding to de novo zygotic transcription. f, Pie chart showing the fate of the 5318 sphere-stage (4hpf) zygotic genes that are only detectable through significant changes in intron sequence. At shield stage (6hpf), 64% of the genes are still detected as zygotically transcribed based only on intron signal. These include genes that have simultaneous zygotic transcription with decay of the maternal contribution. 30% of the genes are detected using both exon and intron signal by shield stage, indicating that transcription levels at sphere stage were too low to detect differences in exons, but were apparent in the introns. g, Table showing number of genes detected in WT sphere stage embryos, sphere embryos injected with U1U2 MO and WT shield stage embryos, at different thresholds of detection. For both groups, a multiple test-corrected P < 0.1 threshold (Benjamin-Hochberg) was used for differential expression of exonic signal. For intronic signal, an uncorrected P < 0.1 was used for the “All detected” group, while a multiple test-corrected P < 0.1 was used for the > 5 RPKM gain group. h, Quantitative RT-PCR was performed for select genes to confirm zygotic transcription in wild type sphere-stage embryos (dark blue bars) compared to a-amanitin treated embryos (light blue bars). Primers were designed to amplify pre-mRNAs across exon-intron boundaries, except for cldne. Expression levels are reported as percentage of CT value compared to a maternally provided housekeeping gene (ef1a) (delta CT × 100%). Error bars show standard error of the mean for three technical replicates. Increased pre-mRNA levels were observed for all zygotic genes tested between wild type and a-amanitin. In contrast, maternally provided genes mtATP6 and mtND5 show no increase in wild type. Genes marked with (*) represent the bottom 10% of significant differential intron expression based on the RNA-Seq data (which quantifies both pre-mRNA and spliced introns). This shows that using intron signal is a reliable indication of zygotic transcription. i, Genes detected in this study were compared to previous annotations of zygotic transcripts. 13 used single nucleotide polymorphisms (SNPs) to identify transcripts derived from paternal alleles, to distinguish zygotic transcription from the maternal contribution. From their genomic sequencing results, we extracted 6750 genes with informative exonic SNPs, which were consistently called between the two sets of matings. 178 of the genes we call zygotically transcribed at sphere stage at levels > 5 RPKM are among the 6750 informative genes. 87% of these are also found to be transcribed by Harvey et al., with agreement between both strictly zygotic genes (Z) and maternal+zygotic genes (M+Z). 24 genes were not detected by Harvey et al (N.D.). At shield stage, 82% of the zygotic genes are also found by Harvey et al., with 134 genes not detected. j, These undetected genes nevertheless have highly increased expression pre-64c to post-MZT (Shield) using the RNA-Seq data generated by Harvey et al (left) and in the current study (right). k, Cumulative plots show that SNP density is significantly lower among Harvey et al undetected genes at shield compared to detected genes (P = 1.6E-3, two-sided Wilcoxon rank sum test), suggesting that low SNP density may account for the missed genes. l Overall, Harvey et al and the current study distinguish a similar number of zygotic vs maternal transcripts at 6hpf, among Ensembl genes with informative SNPs, with 74% agreement. However, 64% of zygotic transcripts identified in the current study do not have informative SNPs, and are thus not called transcribed by Harvey et al. m, Genes called transcribed by Harvey et al but not in the current study have significantly higher intron signal than maternal genes (P = 1.4E-95, two-sided Wilcoxon rank sum test), indicating that our significance threshold to detect zygotic transcription is conservative. n, Aanes et al 14 used a time course poly(A)+ RNA-Seq strategy to define zygotic transcripts. The comparable r70 Ensembl genes in the Aanes et al maternal+zygotic gene category are largely found in our study; however, we find thousands more transcribed genes based on intron signal -- these genes represent transcription that is masked by the maternal contribution. o. Overall, our study captures most of the zygotic genes in the three categories described by Aanes et al: maternal-zygotic genes (zygotic genes with maternal contribution, yellow), MBT genes (strictly zygotic genes detected at MBT, 3.5hpf, orange), and post-MBT genes (strictly zygotic genes detected at 5.3hpf, pink). Venn diagrams show the number of comparable r70 Ensembl genes that overlap between the two studies. Left panels include all zygotic genes detected in this study; right panels impose a zygotic expression threshold of >5RPKM. Percentages within each box are calculated as the number of genes detected in this study (at either time point) that overlap the respective Aanes group, divided by the size of the Aanes group. The overlap percentages are generally high, indicating that our study recovered genes previously annotated as zygotically transcribed as well as many additional zygotic genes based on the use of intronic reads.
* All rows represent separately collected biological samples, i.e. -- 19a, 19b and 19c; and 24a and 24b are biological replicates
† Age in hours post fertilization
‡ Reads aligning to the genome, minus rRNA-aligning reads where applicable
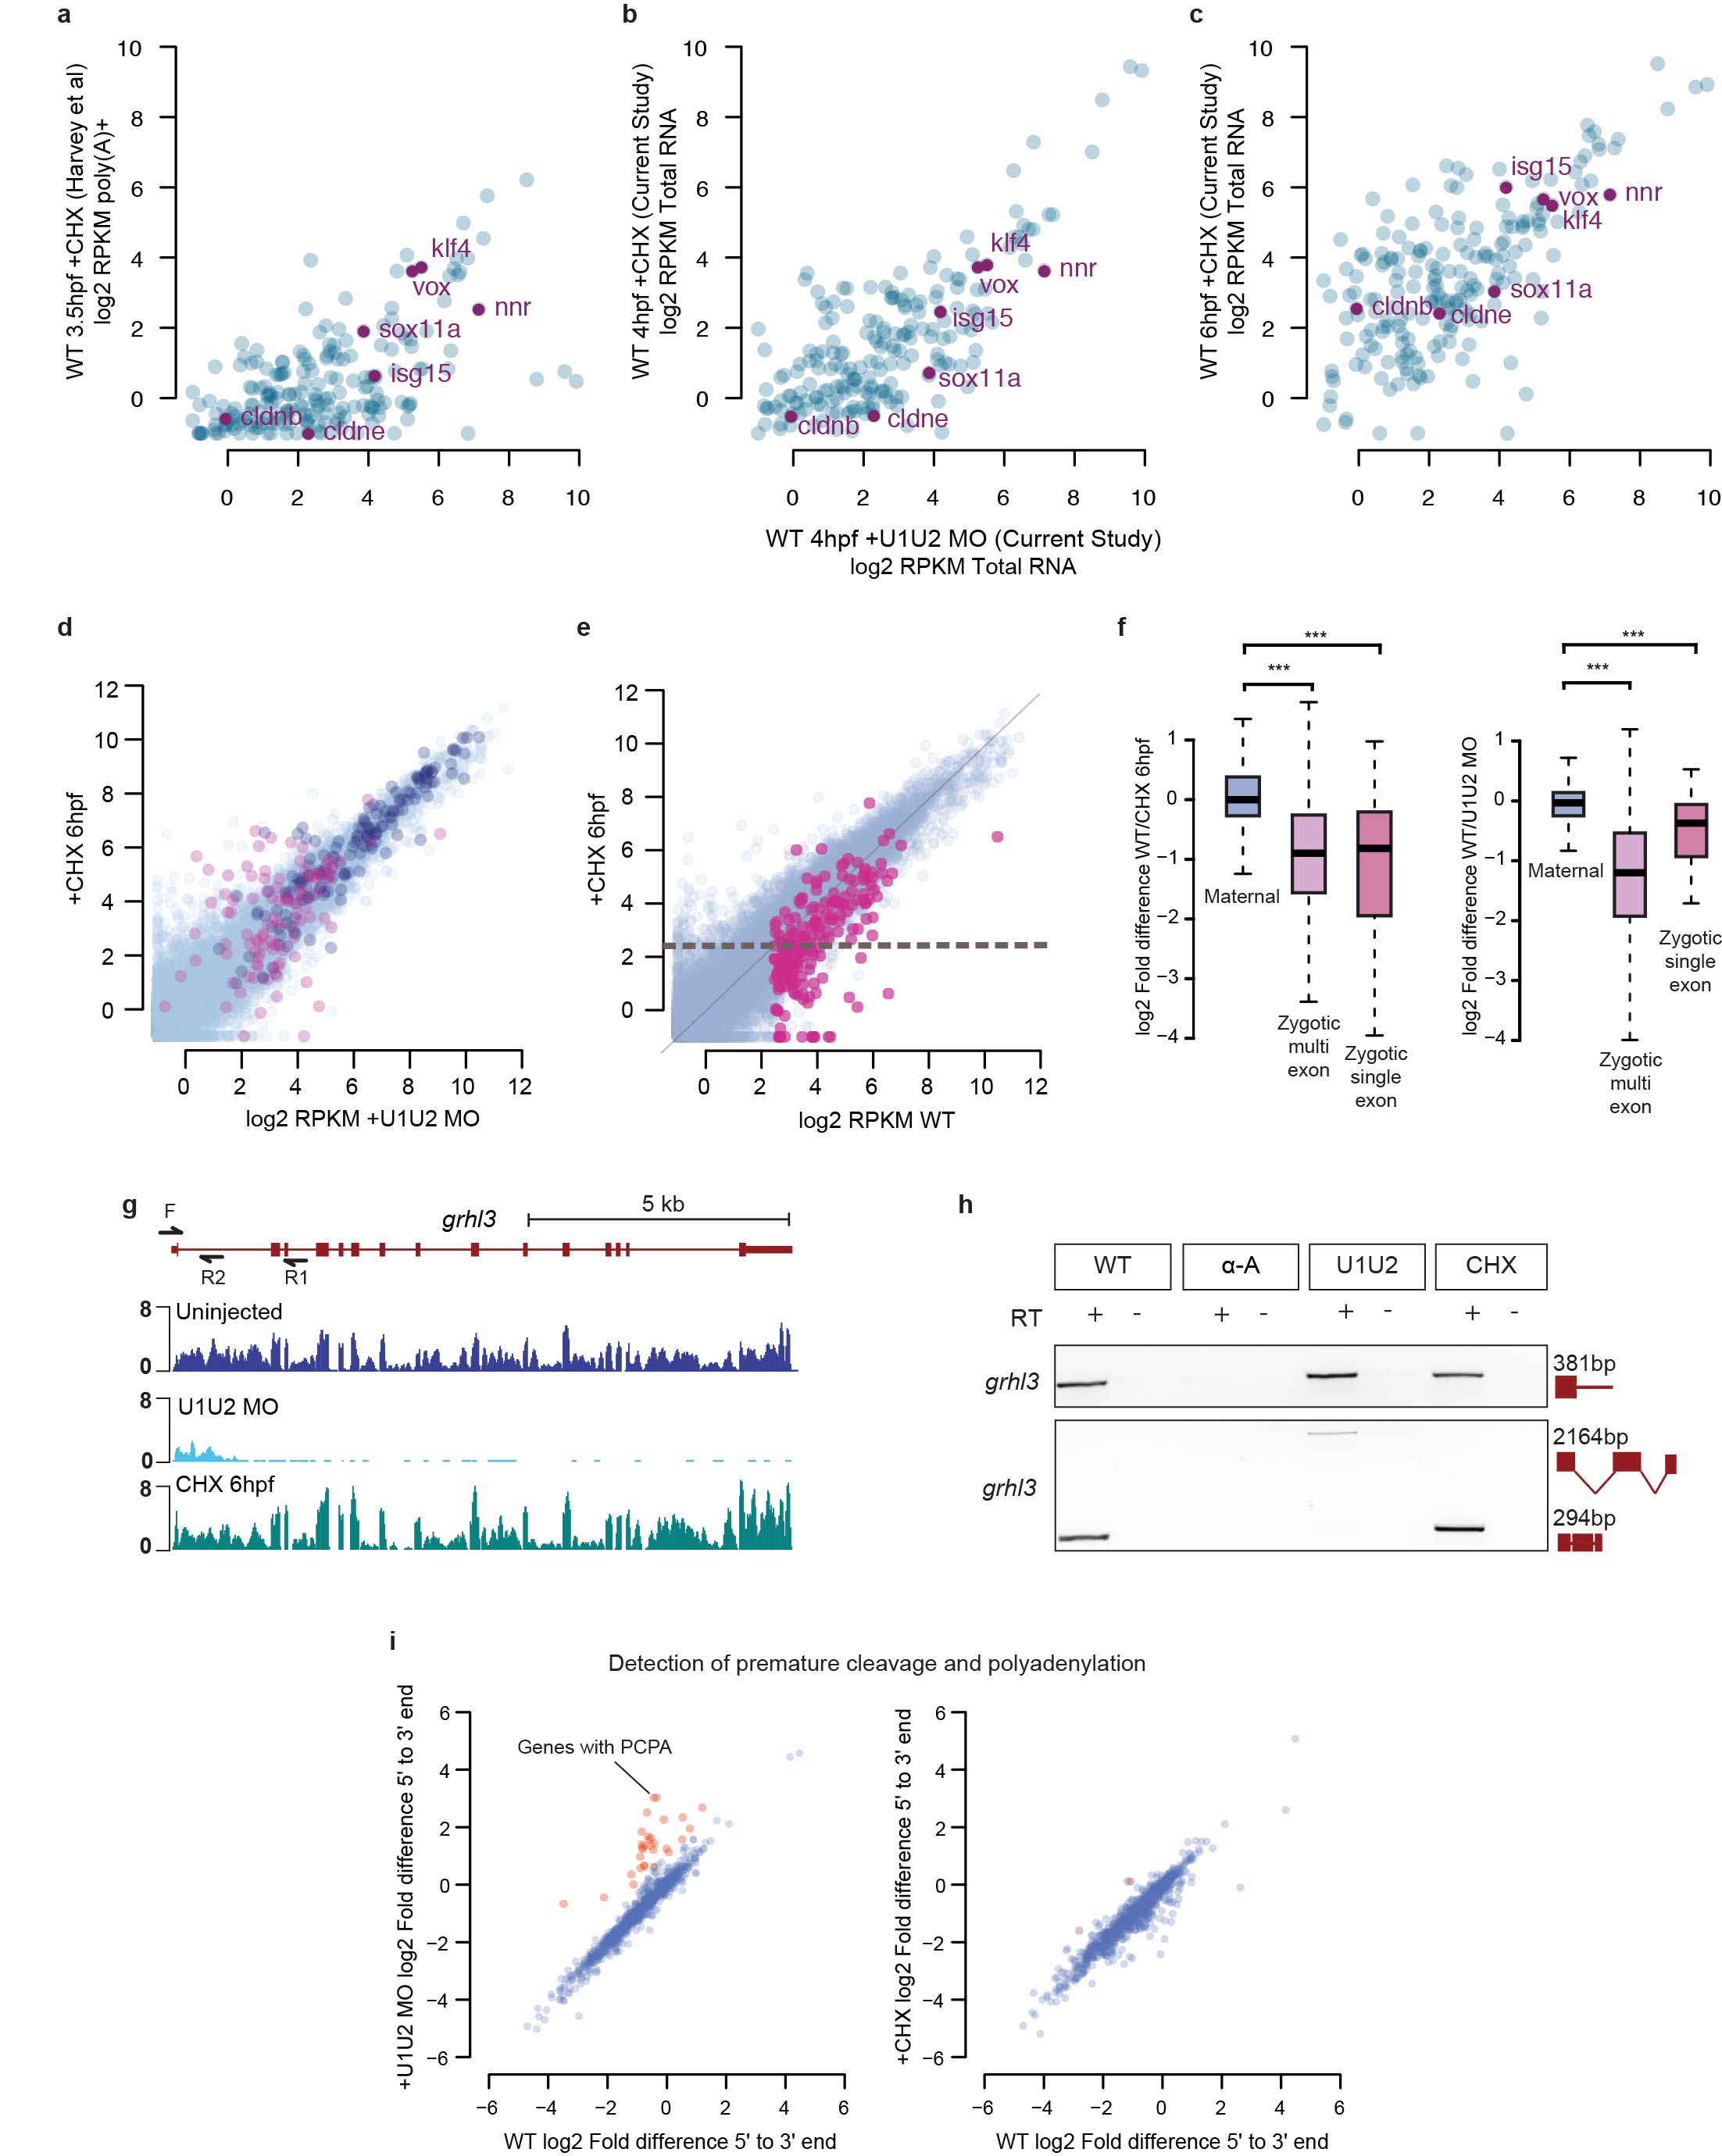
a-c, Biplots comparing strictly zygotic genes found by either the current study or Harvey et al (2013) at >5 RPKM (N = 202). Harvey et al zygotic expressed genes were identified by comparing their raw RNA-Seq data at 128c (pre-MZT) versus 3.5 hpf. In a, zygotic expression in U1U2 MO treated embryos (Total RNA, 4hpf) is compared to Harvey et al embryos treated with cycloheximide (poly(A)+, assayed at 3.5hpf), which shows lagging expression of many first-wave genes (defined as having >5 RPKM in +U1U2 MO). Genes verified by RT-PCR as first-wave (klf4, nnr, sox11a, isg15, cldne) are highlighted, in addition to cldnb, which misses the threshold for first wave in the +U1U2 MO transcriptome; and vox, which was highlighted by Harvey et al. In b-c, Embryos treated with cycloheximide and assayed in the current study at 4hpf and 6hpf (Total RNA) show gradual increases in expression of zygotic genes. Together these results suggest that expression of first-wave genes is independent of de novo zygotic factors, and that transcription overall is slower in cycloheximide-treated embryos compared to wild type or +U1U2 MO. d, Biplot showing gene expression levels (exonic) for all genes in +U1U2 MO embryos compared to cycloheximide (CHX) treated embryos assayed 6hpf. Magenta points highlight strictly zygotic genes, dark blue points highlight maternal+zygotic genes. 97% of the first-wave genes called in +U1U2 MO were expressed > 1RPKM in the cycloheximide condition. e, Biplot comparing exonic expression levels between wild type and cycloheximide treated embryos. Magenta points are strictly zygotic genes expressed > 5RPKM in wild type. A dotted line indicating 5RPKM expression in cycloheximide is shown. f, Box-and-whisker plots comparing exonic expression level differences between wild type and treated embryos in maternal genes, strictly zygotic multi-exon genes, and strictly zygotic single-exon genes. Both U1U2 MO and CHX treated embryos show loss of expression in zygotic genes compared to wild type (U1U2 MO: P = 9.4E-207 for multi-exonic, P = 4.2E-4 for single exon, Wilcoxon rank sum test comparing to Maternal; CHX: P = 4.3E-137 multi-exon, P = 1.5E-6 single exon). The box defines the first and third quartiles, with the median indicated with a thick black line. The systemic decreases in expression in the +U1U2 MO or +cycloheximide conditions compared to wild type suggest that while maternal factors can activate to a large extent expression of the first wave genes, additional zygotic contribution of transcription factors (Nanog, SoxB1 and Pou5f1, but possibly others as well) might be required to reach wild type levels of expression for many genes. This was also observed in Harvey et al 2013 for the gene vox. Alternatively, lower expression of first wave zygotic genes might be caused by reduced level of maternal encoded proteins since incubation with CHX at 32 cell stage might also decrease translation of the maternal deposited mRNAs. Indeed, we consistently observe that CHX treated embryos show lower/delayed expression compared U1U2 MO treated embryos, suggesting that premature inhibition of maternal mRNA translation has an effect on the rate of activation of the first wave genes. g, UCSC Genome Browser track showing an example of premature cleavage and polyadenylation (PCPA) for grhl3. Arrows indicate primer sites for RT-PCR. Previously, it was shown that U1 snRNA also serves to protect nascent mRNAs from PCPA, and that U1 inhibition results in 3’-truncation that may affect transcript level quantification (Berg et al., 2012; Kaida et al., 2010). h, RT-PCR for grhl3 on shield stage embryos (N=5). Wild type (WT), U1U2 MO, and CHX treated embryos all amplify a 381bp fragment from exon 1 to the beginning of intron 1. U1U2 MO injected embryos amplify an unspliced 2164bp gene product spanning exon 1 to 3, while wild type and CHX treated embryos have a 294bp spliced product, with α-amanitin as a negative control. i, Biplots comparing expression levels at the 5’ end of a transcript compared to the 3’ end, in order to detect PCPA. Read density was assayed in up to 1000 nts of 5’ and 3’ sequence per transcript. The range of asymmetry values in wild type reflects sequencing biases or transcript annotation irregularities. Several genes in U1U2 MO treated embryos show elevated asymmetry compared to wild type (orange dots, > 2-fold), reflecting a drop-off of read density moving 5’-3’ in the transcript, indicative of PCPA. These genes are included in our annotations of the zygotic first-wave of expressed genes. The minor extent of PCPA during embryogenesis may reflect the short length of many of the zygotic genes, since PCPA is associated with longer genes that are likely to harbor cryptic polyadenylation sites. Transcripts in CHX-treated embryos generally do not show this trend.
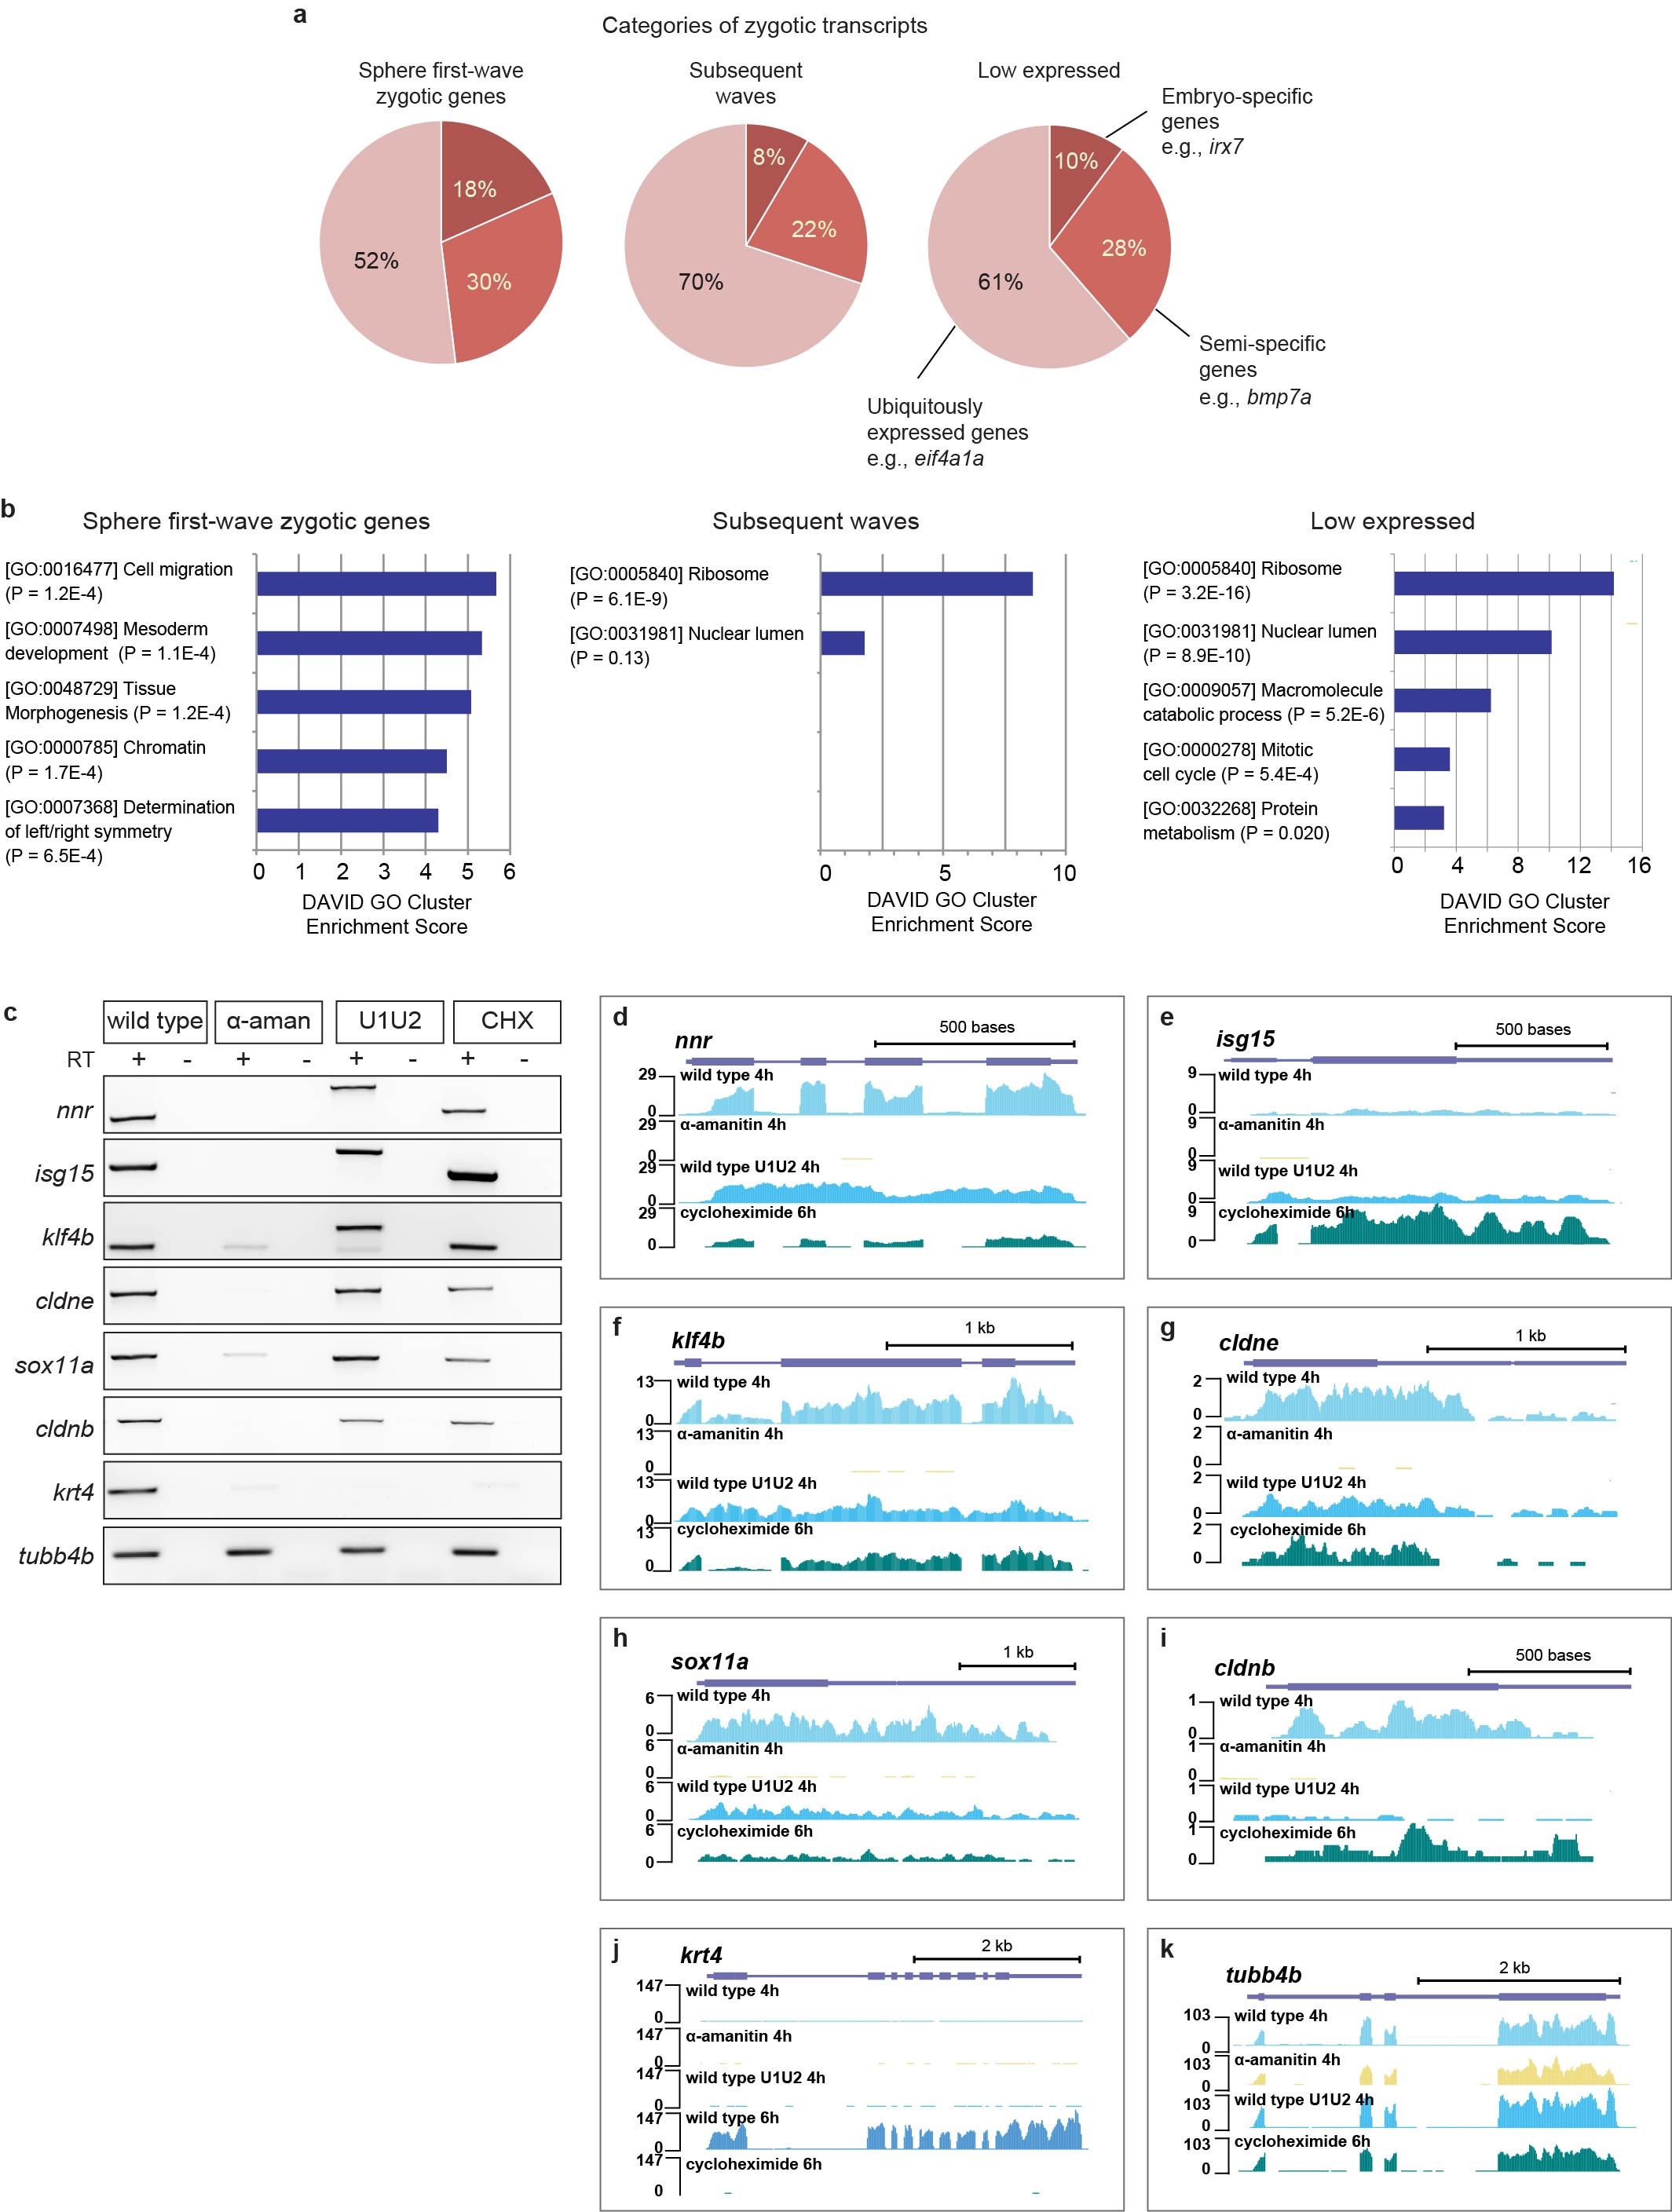
a, To assay the embryonic specificity of the first-wave genes, we used publicly available microarray data from NCBI GEO across 8 normal adult tissue types (brain - GSE11107, liver - GSE11107, heart - GSE17993, skin - GSE24528, kidney - GSE32363, digestive tract - GSE35889, ovary - GSE14979, testis - GSE14979) to classify genes as expressed specifically in the embryo (called “present” by the MAS5 algorithm in 0-2 different adult tissues), genes expressed semi-specifically (present in 3-6 different adult tissues), and genes expressed ubiquitously (present in 7-8 different adult tissues); this latter group would correspond to “housekeeping” genes. Sphere-stage first-wave genes consist of a mixture of specifically expressed and housekeeping genes. Subsequent wave genes and genes expressed at levels < 5 RPKM consist of a larger proportion of genes typically expressed ubiquitously in adult fish, suggesting a widespread activation of genes encoding general cellular processes in addition to developmentally specific ones. b, Gene Ontology enrichment analysis for first-wave, subsequent-wave and the low expressed genes with intronic RPKM > 0.5. Top 5 scoring clusters are shown for each gene set. Clusters were defined using DAVID (http://david.abcc.ncifcrf.gov) Gene Functional Annotation Clustering on GO “FAT” annotations and “high” stringency. Clusters are annotated with representative GO terms and corresponding Benjamini-Hochberg FDR corrected P values. c, To validate genes activated in the first wave versus subsequent waves, RT- PCR was performed on shield stage (6hpf) in wild type, α-amanitin, U1U2 MO, and cycloheximide (CHX) treated embryos. The unspliced product for nnr, isg15, and klf4 is detected only in U1U2 morphants, confirming that U1U2 is indeed blocking splicing. CHX treatment indicates the single-exon genes cldne, sox11a are activated in the first wave. cldnb is detected at low levels in wild type, as well as both U1U2 MO and CHX treated embryos; however, based on RNA-Seq levels at sphere stage, this gene does not pass the expression threshold to be called first wave. krt4 is significantly reduced in U1U2 MO and CHX treated embryos, indicating that zygotic factors are required for its activation. Maternal tubb4b is present in all conditions. d-h, UCSC Genome Browser tracks for first wave genes nnr, isg15, klf4, cldne and sox11a. i, UCSC Genome Browser track for cldnb, which shows low expression levels at sphere stage. j,k, UCSC Genome Browser track for a gene activated in subsequent waves (krt4) and for a maternally provided gene (tubb4b).
a, Wild type embryos were injected with Sox2, Sox3, Sox19a, and Sox19b MOs individually and in combination (0.125mM). Consistent with other reports, only quadruple LOF results in severe developmental defects (27hpf) 20. LOF phenotype is rescued by injecting soxb1 mRNA (imaged at 24hpf). b, Wild type and MZpou5f1 embryos were injected with SoxB1 MO (0.125mM each) and Nanog MO (0.6mM each) individually and in combination (Nanog + SoxB1). Loss of Nanog results in severe gastrulation defects and failure to progress past 80% epiboly, as previously reported 24. Loss of SoxB1 in both wild type and MZpou5f1 embryos showed developmental delay, while combined LOF for Nanog/SoxB1 or Pou5f1/Nanog completely arrested development prior to epiboly. Triple LOF embryos also arrested and failed to undergo gastrulation. c, Individual LOF for Nanog, SoxB1, and Pou5f1 resulted in developmental abnormalities (top panel). Embryos with Nanog loss of function did not progress past 80% epiboly. The LOF phenotypes were rescued by injecting the respective mRNAs (LOF + mRNA) (bottom panel). Embryos imaged at 23hpf. d, e, Wild type and MZpou5f1 embryos were co-injected with Nanog + SoxB1 MO. LOF embryos arrest at sphere stage and resemble α-amanitin injected embryos (+MO). Combinatorial loss-of function is rescued with co-injection of the respective mRNAs (MO + mRNA). Embryos were imaged when wild type siblings reached 75% epiboly (d) and 24hpf (e). f, Ribosome profiling was performed at 2hpf on wild type embryos and embryos injected with Nanog and SoxB1 morpholino at one-cell stage, in order to determine the specificity of the morpholinos to repress translation of nanog and soxB1 mRNA. Sequenced ribosome protected fragments were predominantly 28-29 nts long, indicative of the width of the ribosome footprint. UCSC Genome Browser tracks (sense strand) showing ribosome profiling (top 2 tracks per gene) and input mRNA (bottom 2 tracks per gene). nanog and sox19b show significant reduction in RPFs in the Nanog MO + SoxB1 MO injected embryos compared to wild type. Input mRNA is unaffected. Neither h1m, a highly expressed gene, or oep, a low expressed gene, have any change in either RPFs or input mRNA between wild type and injected embryos.
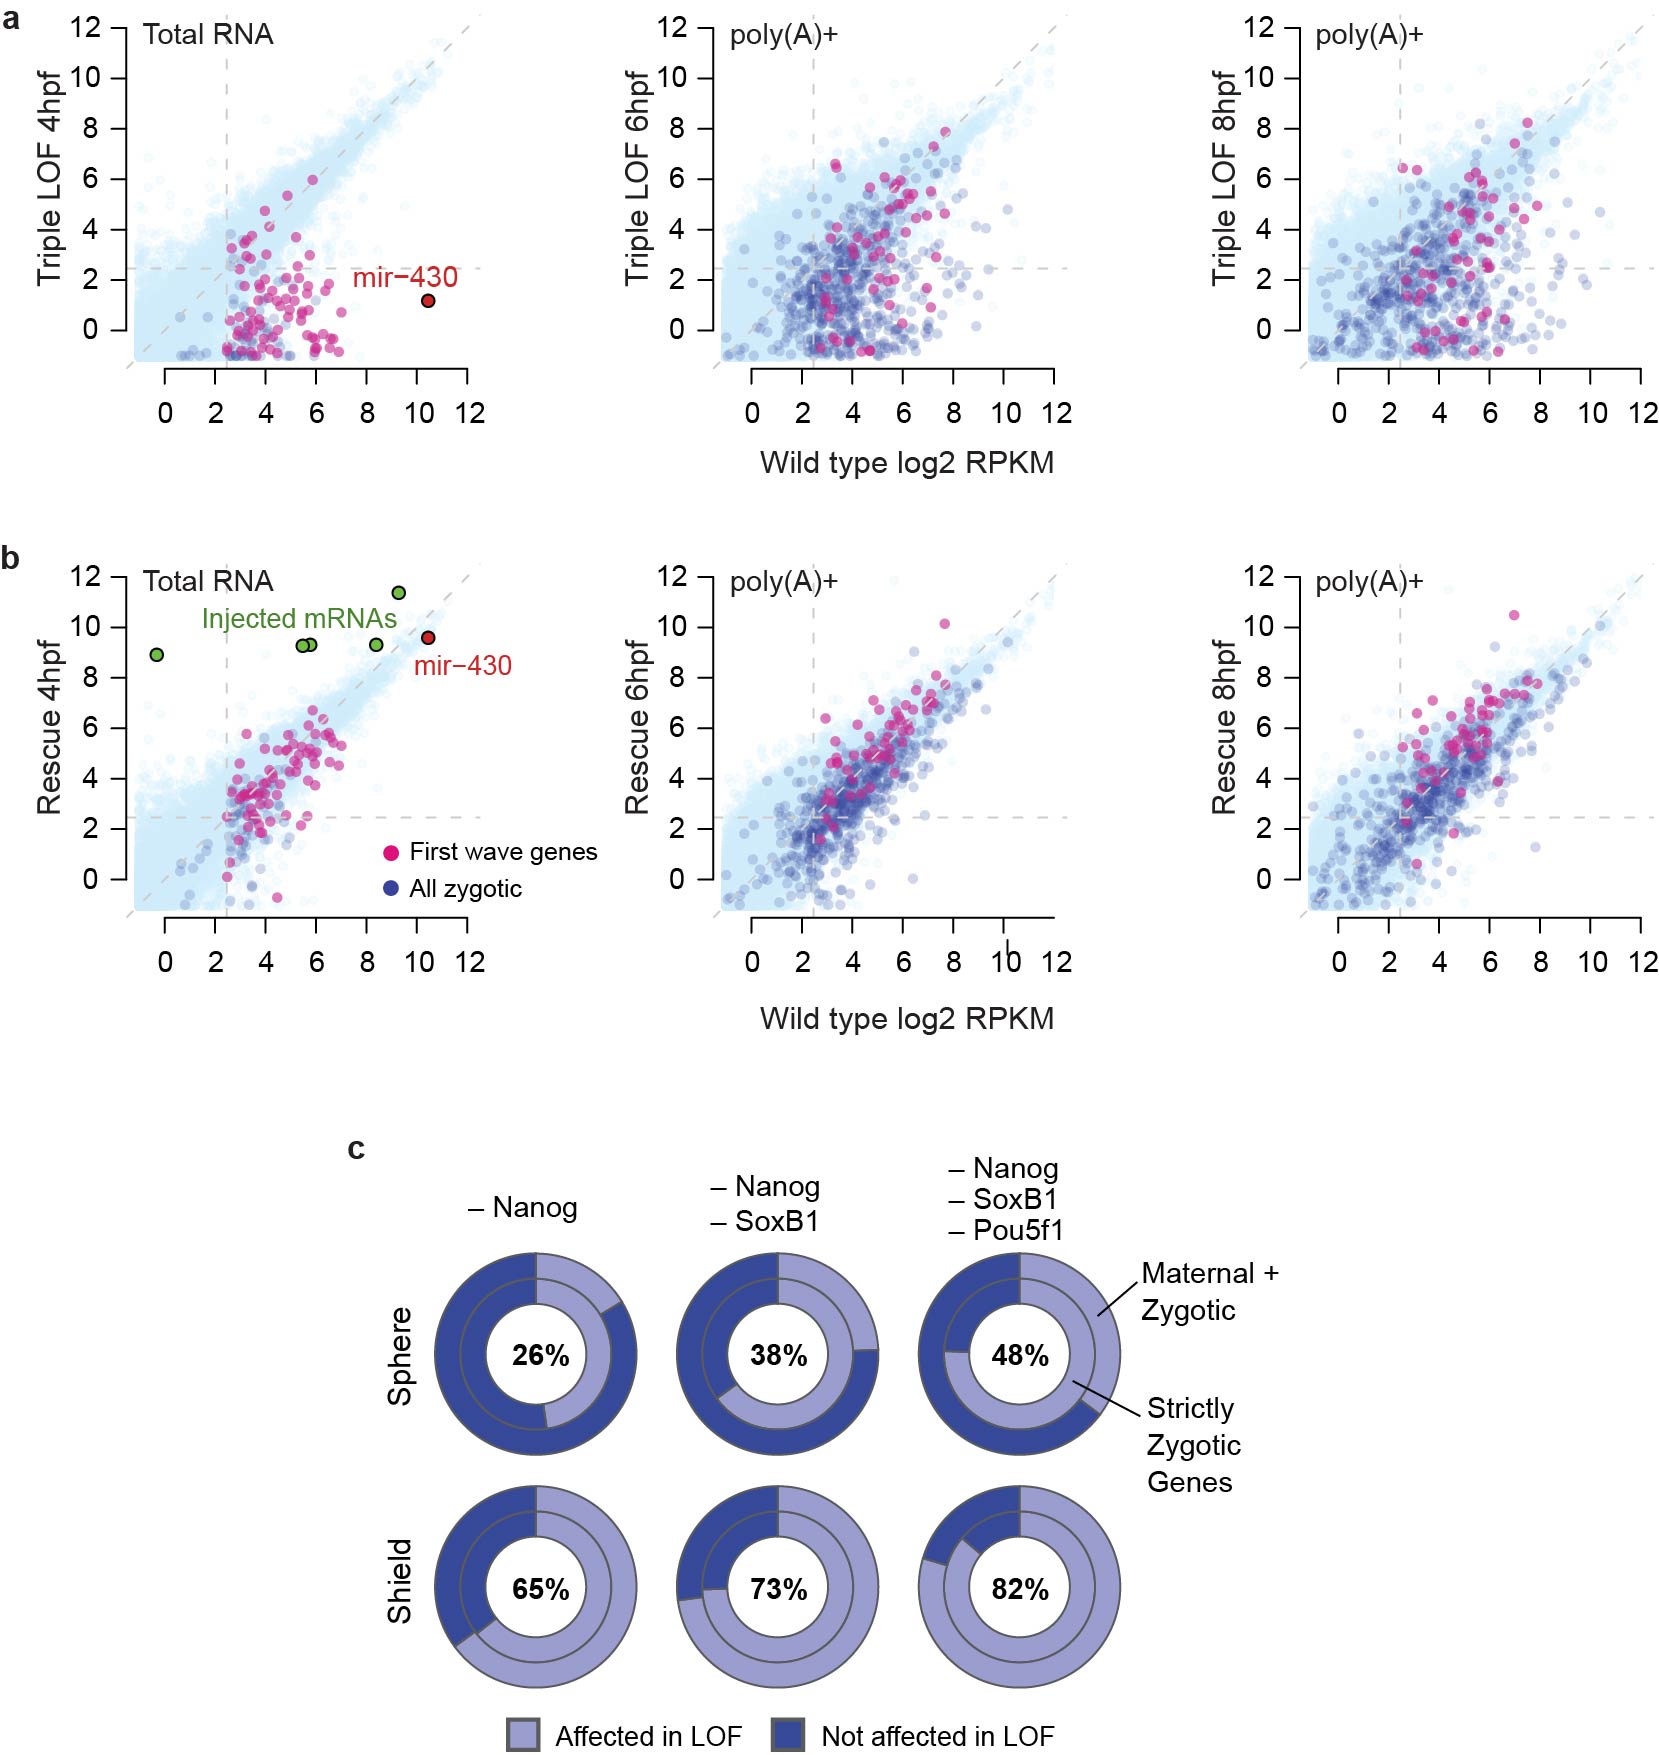
a, Biplots comparing log2 RPKM exonic expression levels between wild type and Nanog + SoxB1 + Pou5f1 loss-of-function embryos; and b, between wild type and triple loss-of-function embryos co-injected with mRNA for nanog, soxB1, and pou5f1; at 4hpf, 6hpf and 8hpf. Dark blue points highlight all strictly zygotic genes, while magenta points highlight the first-wave zygotic genes. miR-430 is highlighted at 4hpf in red, while green points indicate expression levels of (left to right) sox2, sox3, sox19a, sox19b and nanog. c, Donut plots showing proportion of the zygotic transcriptome affected (including first and subsequent waves). For sphere and shield stages and each LOF (Nanog MO, Nanog MO + SoxB1 MO, MZpou5f1 + Nanog MO + SoxB1 MO), dark blue regions represent genes with normal expression compared to wild type, light blue regions represent genes with significant loss of expression. Inner ring is comprised of zygotic genes with < 1 RPKM of maternal contribution, outer ring is comprised of zygotic genes with maternal contribution. Percentages represented total affected genes in that condition over both gene categories. At sphere stage (4hpf) the effect for maternal and zygotic (M+Z) genes is weaker than for strictly zygotic genes, which may reflect a reduced power to detect changes due to the maternal contribution (see also Fig 3b).
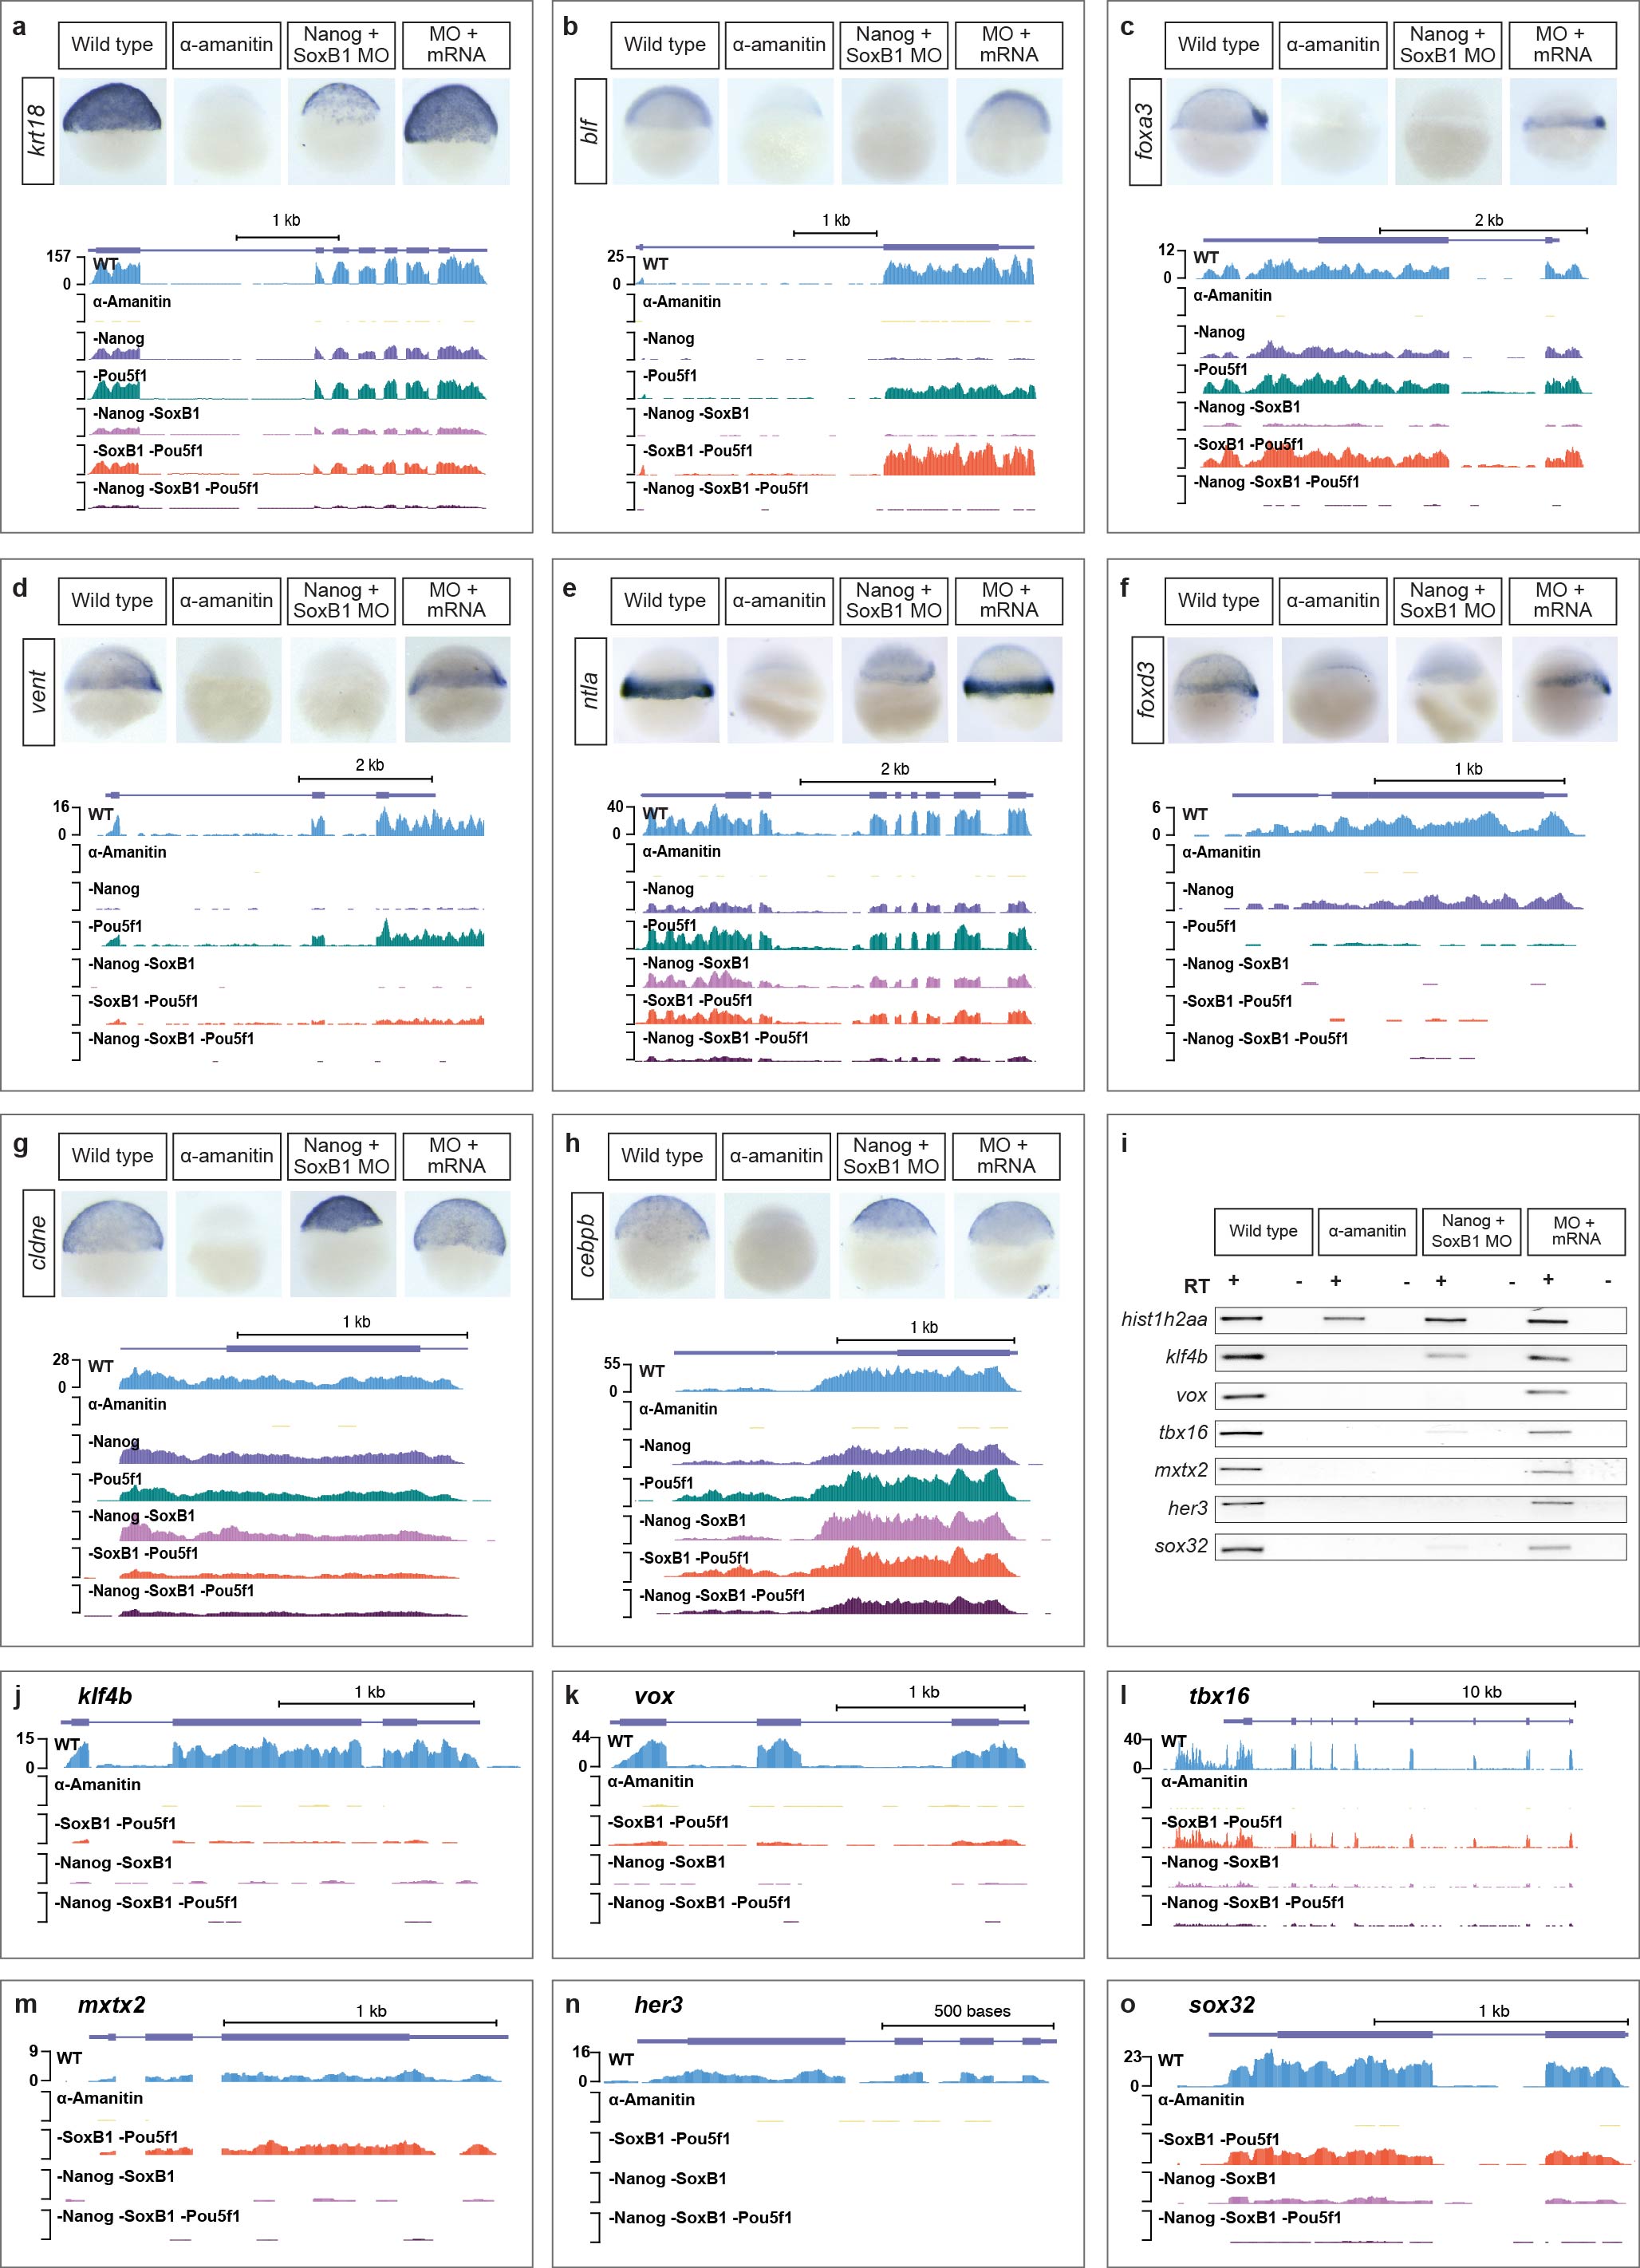
a-f, UCSC Genome Browser tracks and g, RT-PCR analysis for zygotic genes klf4b, vox, tbx16, mxtx2, her3 and sox32, showing differential expression of zygotic genes in LOF conditions. Expression levels were rescued by injecting nanog and soxb1 mRNA (MO + mRNA). Maternal hist1h2aa was present in the α-amanitin control. RT (-) indicates the absence of reverse transcriptase, to control for genomic DNA contamination. In UCSC tracks, loss of Nanog, SoxB1 and Pou5f1 in each sequenced condition is indicated by (-). h,i, In situ hybridization for zygotically transcribed cldne and cebpb show that loss of Nanog and SoxB1 (Nanog + SoxB1 MO) has minimal effect on activation of cldne and cebpb. However, triple loss of function shows a decrease in expression for both genes, as shown in the UCSC tracks. j-o, In situ images showing that loss of Nanog and SoxB1 function results in a significant reduction in zygotic foxa3, blf, vent, foxd3, krt18 and ntla expression. Loss of function embryos (Nanog + SoxB1 MO) resemble α-amanitin injected embryos by in situ, as well as in their transcriptome profiles. Loss of Nanog and SoxB1 is rescued by nanog and soxb1 mRNA (MO + mRNA), which is sufficient to restore wild type expression profiles.
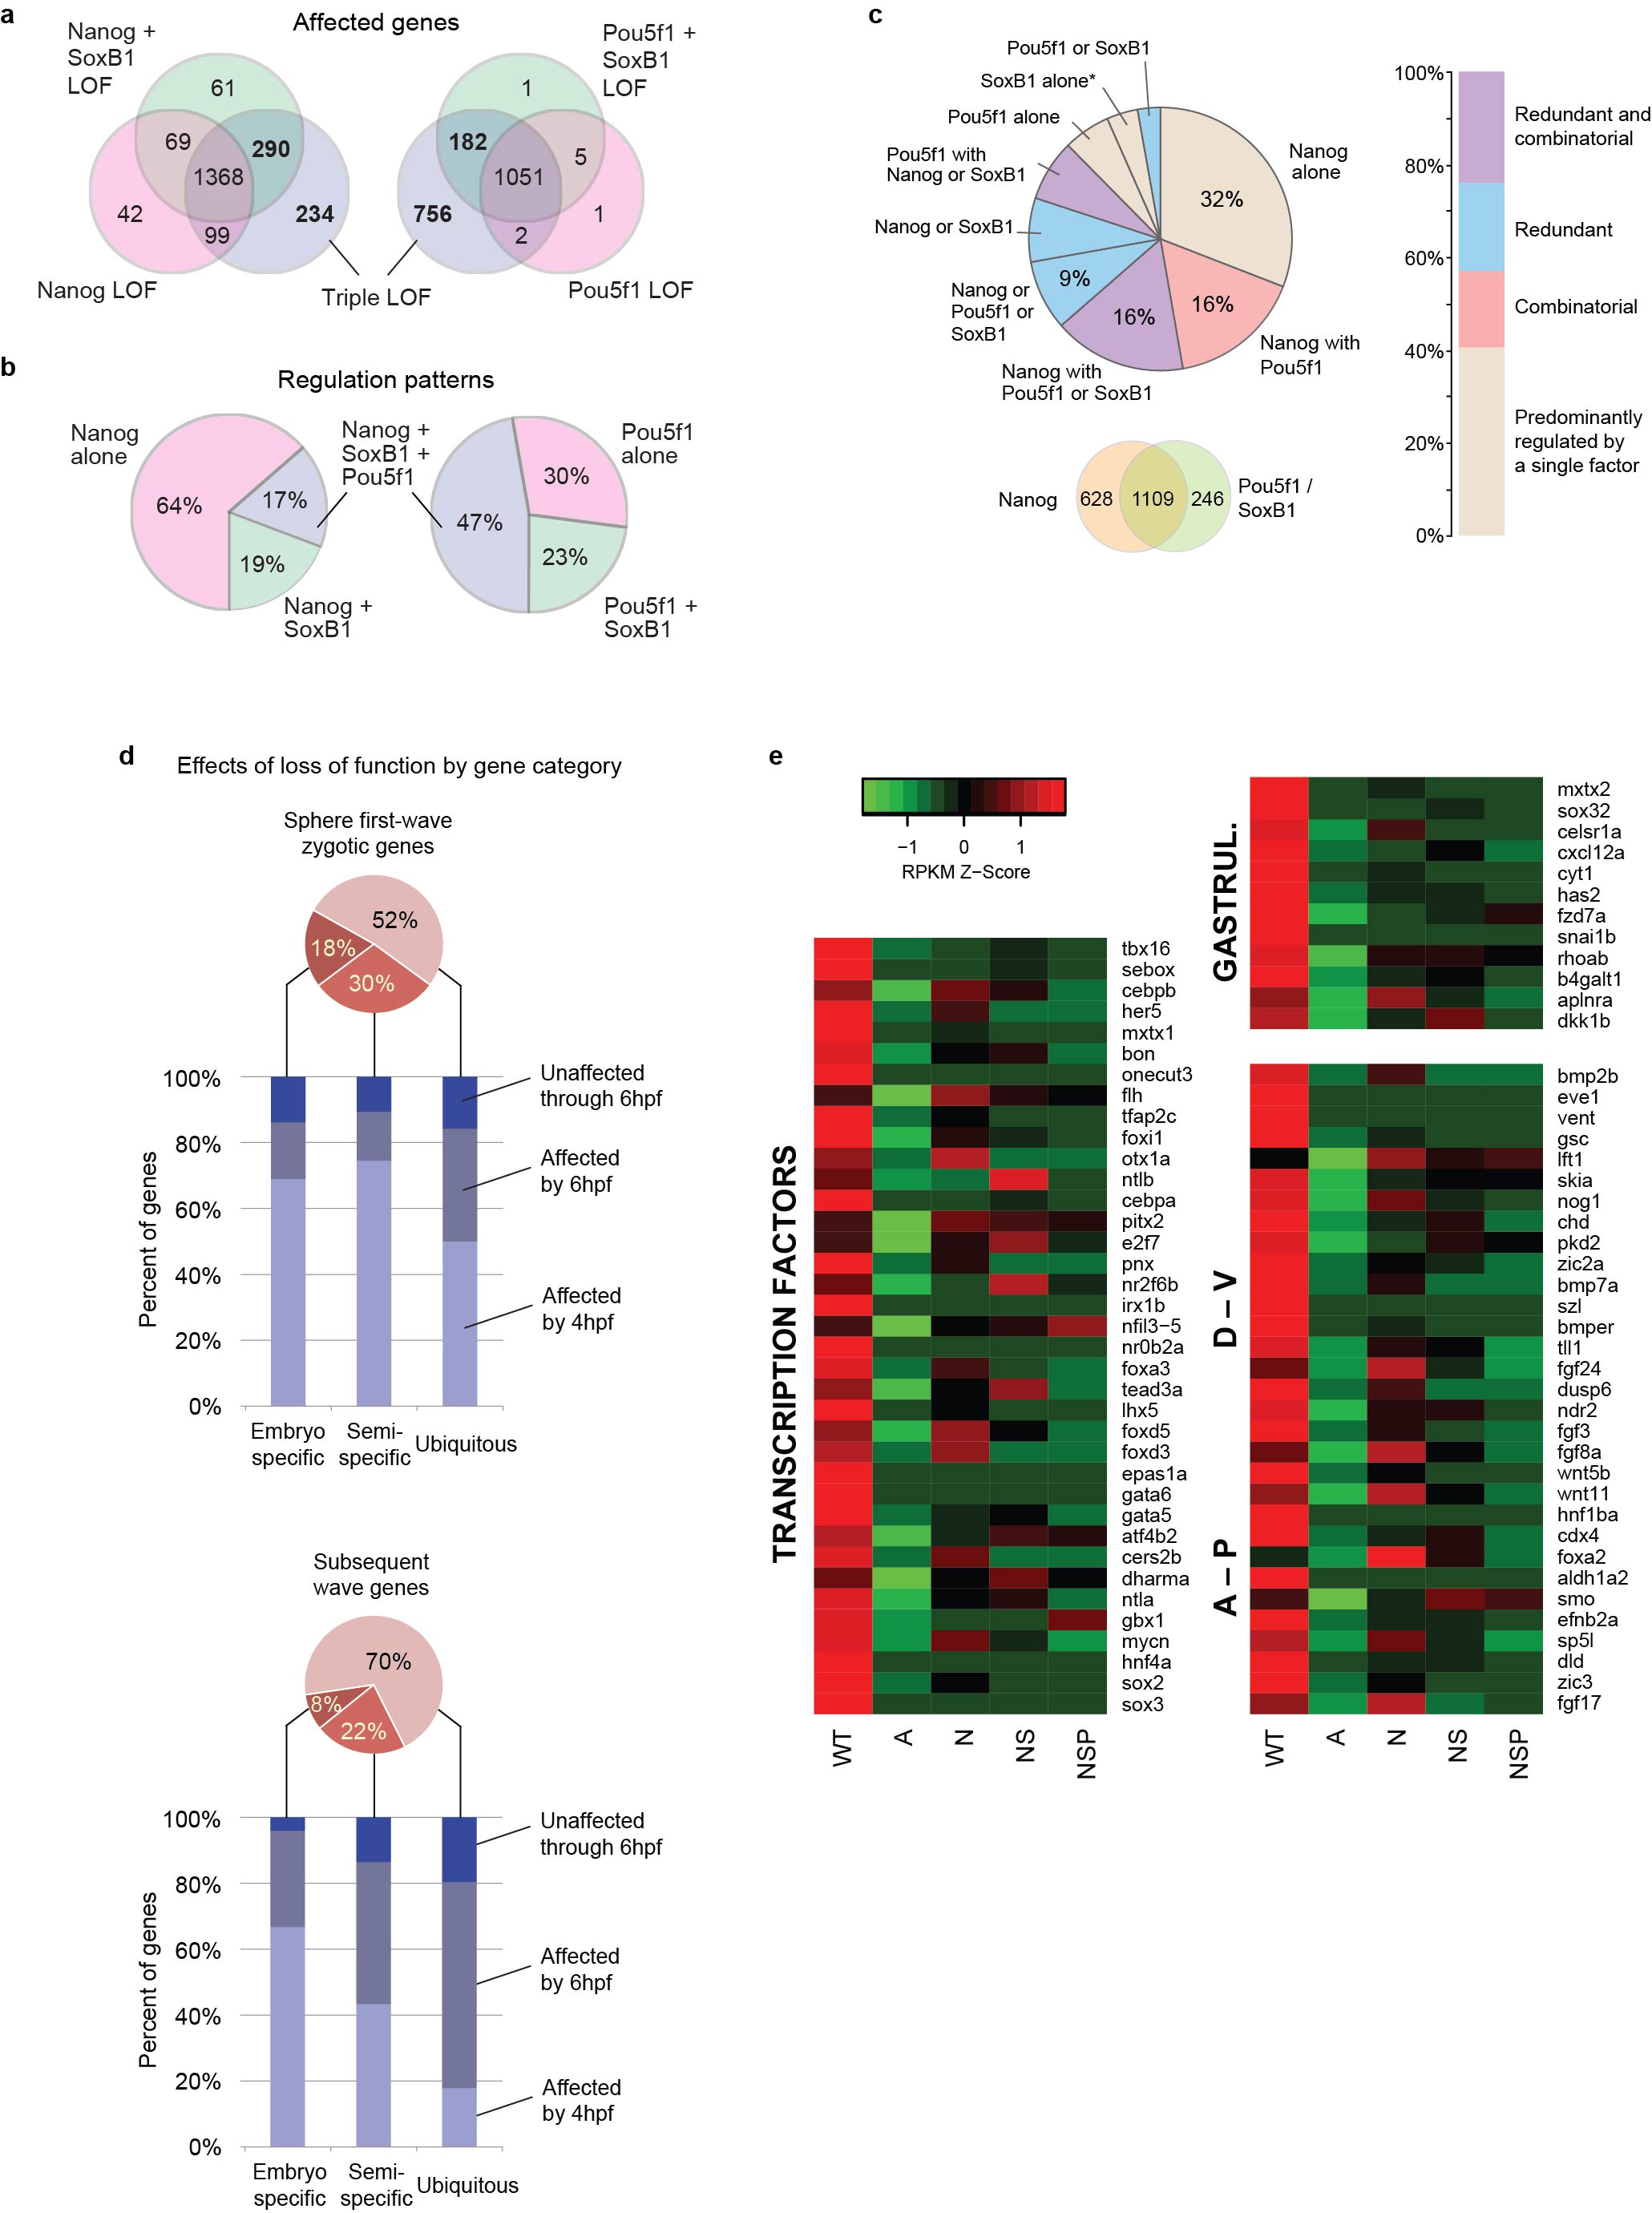
a, Comparisons of the single and double loss of function transcriptomes to the triple reveals that regulation is often combinatorial and redundant. Although all three factors appear to exert some influence on the majority of transcribed genes, the effects observed in the combined loss of function are not usually additive. Nanog appears to have the strongest individual effect of the three factors, but Pou5f1/SoxB1 can often act redundantly, or amplify the effect of Nanog alone. Venn diagrams show overlap between genes significantly down regulated at shield stage in single (pink), double (green), and triple (blue) LOF embryos. N=2172, left; N= 2027, right. b, Pie charts showing the relative influence of each factor in the triple LOF. For each pie chart, genes downregulated in the triple LOF were compared in the single and double LOF transcriptomes. If the downregulation of a gene observed in the single LOF was less than 2-fold different from that observed in the triple LOF, the gene was considered to be regulated by the single factor alone. Otherwise, if the downregulation in the double was less than 2-fold different than the triple, the gene was considered regulated by the combination of two factors. All remaining genes display the strongest downregulation in the triple LOF. Note that genes in each category may be affected by other combinations of LOF; however, the effect there is weaker. c, Breakdown of effects showing the redundancy of regulation in genes downregulated in the triple LOF. The largest category of genes appears to be regulated exclusively by Nanog (31%), since loss of Nanog function is equivalent to the triple loss of function. 16% of genes appear to be regulated by both Nanog and Pou5f1 together, since loss of either Nanog alone or loss of Pou5f1 alone is sufficient to achieve the loss of function observed in the triple. 16% of genes have equivalent effects with either Nanog loss of function or Pou5f1+SoxB1 double loss of function, suggesting that Pou5f1 and SoxB1 act redundantly for these genes to co-regulate with Nanog. 9% of genes show the strongest effect only in the triple LOF. This suggests that there is redundancy between all three factors, since these genes can still be activated when one or two factors are lost. In all, 76% of the affected genes display are subject to some form of redundant or combinatorial regulation. (*) For genes where the effect in the triple was equivalent to both the double loss of SoxB1 and Nanog; and the double loss of SoxB1 and Pou5f1, we inferred that the effect was conferred by SoxB1 alone. d, A majority of genes are affected in the double or triple loss-of-function conditions, across the gene categories defined in Supplementary Fig. 3a, including both embryo-specific genes and housekeeping (ubiquitously expressed) genes. e, Heatmap showing specific embryonic functional categories of genes downregulated in loss-of-function embryos. Three GO categories of genes expressed in wild type at shield stage are shown: general transcription factors, gastrulation and cell movement genes, and patterning genes (Anterior-Posterior axis and Dorsal-Ventral axis). Expression levels are represented as row-normalized values on a red-green color scale for wild type (WT), α-amanitin treated (A), Nanog LOF (N), Nanog+SoxB1 LOF (NS), and Nanog+SoxB1+Pou5f1 triple LOF (NSP). Widespread loss of expression is observed across these functional categories, with the triple LOF exhibiting the greatest similarity to α-amanitin.
a, Schematic representation of miR-430 activity reporter GFP-3xIPT-miR-430 containing three complementary target sites to miR-430 26. If maternal factor (M) is present, miR-430 is expressed and represses translation of the target mRNAs (no GFP expressed). Conversely, loss (X) of the maternal factor required for miR-430 activation would lead to a failure to repress miR-430 targets and GFP expression. dsRed is a control mRNA that is not subject to regulation by miR-430 and is co-injected with the target mRNA. b, GFP-reporter and dsRed (injection control) mRNAs were co-injected into embryos at one-cell stage and fluorescence assayed 7-8hpf. GFP-reporter is repressed in wild type and SoxB1 morphants by endogenous miR-430 (Giraldez et al., 2005), as shown by a decrease in GFP expression. The GFP-reporter fails to be repressed in α-amanitin (that fail to activate zygotic transcription and do not express miR-430) and Nanog MO injected embryos, indicating a loss of miR-430 activity. c, In situ hybridization for maternal miR-430 target gene cd82b. At shield stage, cd82b is cleared from wild type and MZpou5f1 embryos. Nanog, SoxB1, and Pou5f1 LOF causes a failure in clearance (MZpou5f1 +Nanog + SoxB1 MO). Injection of nanog, soxb1, and pou5f1 mRNA rescues the phenotype (MO + mRNA). d, Cumulative plots showing the effect of each LOF condition on miR-430 target repression, as in Bazzini et al (2012), using Total RNA-Seq. Plots show the distribution of log2 fold expression level difference for each condition relative to wild type in three groups of genes defined in Bazzini et al (2012): miR-430 targets with multiple 7mer or 8mer seed target sites in their 3’UTR; miR-430 targets with a single 7mer or 8mer seed in the 3’UTR; and genes lacking miR-430 seed sites in their 3’UTRs. P values are for two-sided Wilcoxon rank sum tests comparing each of the two miR-430 target groups to the non targets. MZdicer expression data is from Bazzini et al (2012). Displacement of the curve to the left (-) from the gray control line, indicates a larger fraction of genes are accumulated (fail to be degraded) in the indicated condition compared to wild type. Nanog has the strongest effect, though there is also an effect from the combined loss of Pou5f1 and SoxB1. e, Cumulative plots showing the effect of triple LOF, with and without mRNA rescue, on miR-430 target repression, using poly(A)+ selection RNA-Seq. At 6hpf, miR-430 targets fail to be degraded in the LOF condition compared to wild type, with expression levels of targets high in the LOF relative to wild type. Co-injection of nanog, soxB1, and pou5f1 mRNAs restores miR-430 activity, and the targets’ expression levels are restored to near wild type levels. f, At 8hpf, miR-430 targets are still undegraded in the LOF, but are degraded to wild type levels in the rescue. P values are for two-sided Wilcoxon rank sum tests comparing each of the two miR-430 target groups to the non targets.
a, Nanog chromatin immunoprecipitation sequencing binding data in zebrafish at 3.3 hpf (Xu et al, 2012) was reanalyzed to determine Nanog bound regions genome wide. Pie charts show percentage of genes in each category that are associated with Nanog bound regions (+/- 5kb). 74% of first-wave genes detected at sphere were associated with Nanog binding, 2-fold higher than subsequent-wave genes (P = 3.7E-29, two-sided Fisher’s Exact Test). Low expressed zygotic genes are also less associated with Nanog bound regions. For those genes that are nonetheless affected by Nanog LOF, this suggests that they are influenced by Nanog indirectly, rather than through Nanog binding at the gene locus. The enrichment of Nanog binding on the first wave genes versus subsequent waves supports a model where Nanog plays a central role in the regulation of the activation of the first wave of zygotic transcription. b, ChIP-Seq data for Nanog, Oct4 and Sox2 in mouse embryonic stem cells 19,20 was used to examine the binding profiles of genes transcribed during pre-implantation mouse embryogenesis 21, since ChIP data does not exist for early mouse embryos. Three gene groups were analyzed: α-amanitin sensitive genes expressed at early 2-cell stage (minor wave ZGA), α-amanitin sensitive genes expressed at late 2-cell stage (major wave ZGA), and genes expressed during the 4-8-cell stages (mid-preimplantation). Gene promoters (defined to be 5 Kb upstream to 50 bases downstream the annotated transcription start site of a gene) are highly enriched in binding sites among the genes comprising ZGA, as compared to the genome as a whole (P = 4.03E-07 for the minor wave, P = 6.05E-18, two-sided Fisher’s Exact Test). Genomic coordinates (mm8) for genes were defined by NIA/NIH U-cluster annotations for the microarray probes in 21. Note that not all of the genes expressed during ZGA are necessarily expressed in ES cells; thus, the binding proportions are likely to be underestimates. While these represent two different states of development, these results are consistent with a role for these factors in activating the earliest waves of zygotic gene expression also in mammals. c, Model showing maternal gene expression in red and zygotic gene expression in blue during the maternal to zygotic transition. Gene expression is depicted on the y axis and time on the x axis. During the MZT, Nanog, SoxB1 and Pou5f1 are required to activate a large fraction of zygotic genes, including miR-430, which in turn is responsible for the clearance of a significant portion of maternal mRNAs. In the loss of function of Nanog, SoxB1 and Pou5f1, there is a reduction in zygotic gene activation, causing a failure in the establishment of the zygotic developmental program, including loss of miR-430 expression and maternal mRNA clearance.
Acknowledgments
We thank Y. Kamachi, W. Driever, A.F. Schier, N. Ivanova. and I-H. Park for reagents and fish lines; S. Mane and J. Overton for outstanding sequencing support; E. Zdobnov for hosting genomics data; A. Hubaud, N. Darricarrere and M. Koziol for contribution in the early stages of this project, and all the members of the Giraldez lab for insightful discussions. Supported by NIH grants F32HD071697-02 (M.T.L.), T32GM007499 (A.R.B), F32HD061194-03 (C.M.T.), Pew Fellows Program in Biomedical Sciences (A.A.B), R01GM081602-06, R01GM103789-01, R01HD074078-02, the Pew Scholars Program in the Biomedical Sciences and the Yale Scholars Program (A.J.G.).
Footnotes
Contributions: M.T.L., A.R.B. and A.J.G. designed the project, performed experiments and data analysis. M.T.L., A.R.B., C.M.T. and A.J.G. wrote the manuscript. C.M.T. designed and performed the cycloheximide experiment and contributed to in situ hybridizations. A.B.B designed and performed ribosome profiling and U1U2 experiments. K.R.D and E.S.F. assisted with gene validation. Sequencing data are deposited in the Gene Expression Omnibus (GEO) database with accession number GSE47558.
Bibliography
- 1.ten Bosch JR, Benavides JA, Cline TW. The TAGteam DNA motif controls the timing of Drosophila pre-blastoderm transcription. Development (Cambridge, England) 2006;133:1967–1977. doi: 10.1242/dev.02373. [DOI] [PubMed] [Google Scholar]
- 2.Liang HL, et al. The zinc-finger protein Zelda is a key activator of the early zygotic genome in Drosophila. Nature. 2008;456:400–403. doi: 10.1038/nature07388. [DOI] [PMC free article] [PubMed] [Google Scholar]
- 3.Tadros W, Lipshitz HD. The maternal-to-zygotic transition: a play in two acts. Development (Cambridge, England) 2009;136:3033–3042. doi: 10.1242/dev.033183. [DOI] [PubMed] [Google Scholar]
- 4.Andersen IS, et al. Epigenetic marking of the zebrafish developmental program. Curr Top Dev Biol. 2013;104:85–112. doi: 10.1016/B978-0-12-416027-9.00003-6. [DOI] [PubMed] [Google Scholar]
- 5.Vastenhouw NL, et al. Chromatin signature of embryonic pluripotency is established during genome activation. Nature. 2010;464:922–926. doi: 10.1038/nature08866. [DOI] [PMC free article] [PubMed] [Google Scholar]
- 6.Lindeman LC, et al. Prepatterning of developmental gene expression by modified histones before zygotic genome activation. Developmental cell. 2011;21:993–1004. doi: 10.1016/j.devcel.2011.10.008. [DOI] [PubMed] [Google Scholar]
- 7.Potok ME, Nix DA, Parnell TJ, Cairns BR. Reprogramming the Maternal Zebrafish Genome after Fertilization to Match the Paternal Methylation Pattern. Cell. 2013;153:759–772. doi: 10.1016/j.cell.2013.04.030. [DOI] [PMC free article] [PubMed] [Google Scholar]
- 8.Jiang L, et al. Sperm, but Not Oocyte, DNA Methylome Is Inherited by Zebrafish Early Embryos. Cell. 2013;153:773–784. doi: 10.1016/j.cell.2013.04.041. [DOI] [PMC free article] [PubMed] [Google Scholar]
- 9.Kane DA, Kimmel CB. The zebrafish midblastula transition. Development. 1993;119:447–456. doi: 10.1242/dev.119.2.447. [DOI] [PubMed] [Google Scholar]
- 10.Giraldez AJ, et al. Zebrafish MiR-430 promotes deadenylation and clearance of maternal mRNAs. Science (New York, N Y. 2006;312:75–79. doi: 10.1126/science.1122689. [DOI] [PubMed] [Google Scholar]
- 11.Lund E, Liu M, Hartley RS, Sheets MD, Dahlberg JE. Deadenylation of maternal mRNAs mediated by miR-427 in Xenopus laevis embryos. RNA (New York, N Y. 2009;15:2351–2363. doi: 10.1261/rna.1882009. [DOI] [PMC free article] [PubMed] [Google Scholar]
- 12.Giraldez AJ. microRNAs, the cell’s Nepenthe: clearing the past during the maternal-to-zygotic transition and cellular reprogramming. Current opinion in genetics & development. 2010;20:369–375. doi: 10.1016/j.gde.2010.04.003. [DOI] [PMC free article] [PubMed] [Google Scholar]
- 13.Harvey SA, et al. Identification of the zebrafish maternal and paternal transcriptomes. Development (Cambridge, England) 2013;140:2703–2710. doi: 10.1242/dev.095091. [DOI] [PMC free article] [PubMed] [Google Scholar]
- 14.Aanes H, et al. Zebrafish mRNA sequencing deciphers novelties in transcriptome dynamics during maternal to zygotic transition. Genome research. 2011;21:1328–1338. doi: 10.1101/gr.116012.110. [DOI] [PMC free article] [PubMed] [Google Scholar]
- 15.Kaida D, et al. U1 snRNP protects pre-mRNAs from premature cleavage and polyadenylation. Nature. 2010;468:664–668. doi: 10.1038/nature09479. [DOI] [PMC free article] [PubMed] [Google Scholar]
- 16.Bazzini AA, Lee MT, Giraldez AJ. Ribosome profiling shows that miR-430 reduces translation before causing mRNA decay in zebrafish. Science. 2012;336:233–237. doi: 10.1126/science.1215704. [DOI] [PMC free article] [PubMed] [Google Scholar]
- 17.Chambers I, Tomlinson SR. The transcriptional foundation of pluripotency. Development (Cambridge, England) 2009;136:2311–2322. doi: 10.1242/dev.024398. [DOI] [PMC free article] [PubMed] [Google Scholar]
- 18.Onichtchouk D. Pou5f1/oct4 in pluripotency control: insights from zebrafish. Genesis. 2012;50:75–85. doi: 10.1002/dvg.20800. [DOI] [PubMed] [Google Scholar]
- 19.Onichtchouk D, et al. Zebrafish Pou5f1-dependent transcriptional networks in temporal control of early development. Mol Syst Biol. 2010;6:354. doi: 10.1038/msb.2010.9. [DOI] [PMC free article] [PubMed] [Google Scholar]
- 20.Okuda Y, Ogura E, Kondoh H, Kamachi Y. B1 SOX coordinate cell specification with patterning and morphogenesis in the early zebrafish embryo. PLoS genetics. 2010;6:e1000936. doi: 10.1371/journal.pgen.1000936. [DOI] [PMC free article] [PubMed] [Google Scholar]
- 21.Lunde K, Belting HG, Driever W. Zebrafish pou5f1/pou2, homolog of mammalian Oct4, functions in the endoderm specification cascade. Curr Biol. 2004;14:48–55. doi: 10.1016/j.cub.2003.11.022. [DOI] [PubMed] [Google Scholar]
- 22.Hauptmann G, et al. spiel ohne grenzen/pou2 is required for zebrafish hindbrain segmentation. Development (Cambridge, England) 2002;129:1645–1655. doi: 10.1242/dev.129.7.1645. [DOI] [PubMed] [Google Scholar]
- 23.Belting HG, et al. Pou5f1 contributes to dorsoventral patterning by positive regulation of vox and modulation of fgf8a expression. Developmental biology. 2011;356:323–336. doi: 10.1016/j.ydbio.2011.05.660. [DOI] [PubMed] [Google Scholar]
- 24.Xu C, et al. Nanog-like regulates endoderm formation through the Mxtx2-Nodal pathway. Developmental cell. 2012;22:625–638. doi: 10.1016/j.devcel.2012.01.003. [DOI] [PMC free article] [PubMed] [Google Scholar]
- 25.Ingolia NT, Ghaemmaghami S, Newman JR, Weissman JS. Genome-wide analysis in vivo of translation with nucleotide resolution using ribosome profiling. Science (New York, N Y. 2009;324:218–223. doi: 10.1126/science.1168978. [DOI] [PMC free article] [PubMed] [Google Scholar]
- 26.Giraldez AJ, et al. MicroRNAs regulate brain morphogenesis in zebrafish. Science (New York, N Y. 2005;308:833–838. doi: 10.1126/science.1109020. [DOI] [PubMed] [Google Scholar]
- 27.Loh YH, et al. The Oct4 and Nanog transcription network regulates pluripotency in mouse embryonic stem cells. Nature genetics. 2006;38:431–440. doi: 10.1038/ng1760. [DOI] [PubMed] [Google Scholar]
- 28.Leichsenring M, Maes J, Mossner R, Driever W, Onichtchouk D. Pou5f1 transcription factor controls zygotic gene activation in vertebrates. Science (New York, N Y. 2013;341:1005–1009. doi: 10.1126/science.1242527. [DOI] [PubMed] [Google Scholar]
- 29.Foygel K, et al. A novel and critical role for Oct4 as a regulator of the maternalembryonic transition. PLoS ONE. 2008;3:e4109. doi: 10.1371/journal.pone.0004109. [DOI] [PMC free article] [PubMed] [Google Scholar]
- 30.Tan MH, et al. An Oct4-Sall4-Nanog network controls developmental progression in the pre-implantation mouse embryo. Molecular systems biology. 2013;9:632. doi: 10.1038/msb.2012.65. [DOI] [PMC free article] [PubMed] [Google Scholar]
- 31.Keramari M, et al. Sox2 is essential for formation of trophectoderm in the preimplantation embryo. PLoS ONE. 2010;5:e13952. doi: 10.1371/journal.pone.0013952. [DOI] [PMC free article] [PubMed] [Google Scholar]
- 32.Frum T, et al. Oct4 cell-autonomously promotes primitive endoderm development in the mouse blastocyst. Developmental cell. 2013;25:610–622. doi: 10.1016/j.devcel.2013.05.004. [DOI] [PMC free article] [PubMed] [Google Scholar]
- 33.Messerschmidt DM, Kemler R. Nanog is required for primitive endoderm formation through a non-cell autonomous mechanism. Developmental biology. 2010;344:129–137. doi: 10.1016/j.ydbio.2010.04.020. [DOI] [PubMed] [Google Scholar]
- 34.Gurdon JB, Elsdale TR, Fischberg M. Sexually mature individuals of Xenopus laevis from the transplantation of single somatic nuclei. Nature. 1958;182:64–65. doi: 10.1038/182064a0. [DOI] [PubMed] [Google Scholar]
- 35.Gurdon JB, Melton DA. Nuclear reprogramming in cells. Science (New York, N Y. 2008;322:1811–1815. doi: 10.1126/science.1160810. [DOI] [PubMed] [Google Scholar]
- 36.Mitsui K, et al. The homeoprotein Nanog is required for maintenance of pluripotency in mouse epiblast and ES cells. Cell. 2003;113:631–642. doi: 10.1016/s0092-8674(03)00393-3. [DOI] [PubMed] [Google Scholar]
- 37.Takahashi K, Yamanaka S. Induction of pluripotent stem cells from mouse embryonic and adult fibroblast cultures by defined factors. Cell. 2006;126:663–676. doi: 10.1016/j.cell.2006.07.024. [DOI] [PubMed] [Google Scholar]
- 38.Takahashi K, et al. Induction of pluripotent stem cells from adult human fibroblasts by defined factors. Cell. 2007;131:861–872. doi: 10.1016/j.cell.2007.11.019. [DOI] [PubMed] [Google Scholar]
- 39.Wernig M, et al. In vitro reprogramming of fibroblasts into a pluripotent ES-cell-like state. Nature. 2007;448:318–324. doi: 10.1038/nature05944. [DOI] [PubMed] [Google Scholar]
- 40.Yu J, et al. Induced pluripotent stem cell lines derived from human somatic cells. Science (New York, N Y. 2007;318:1917–1920. doi: 10.1126/science.1151526. [DOI] [PubMed] [Google Scholar]
- 41.Chambers I, et al. Nanog safeguards pluripotency and mediates germline development. Nature. 2007;450:1230–1234. doi: 10.1038/nature06403. [DOI] [PubMed] [Google Scholar]
- 42.Masui S, et al. Pluripotency governed by Sox2 via regulation of Oct3/4 expression in mouse embryonic stem cells. Nat Cell Biol. 2007;9:625–635. doi: 10.1038/ncb1589. [DOI] [PubMed] [Google Scholar]
- 43.Niwa H, Miyazaki J, Smith AG. Quantitative expression of Oct-3/4 defines differentiation, dedifferentiation or self-renewal of ES cells. Nat Genet. 2000;24:372–376. doi: 10.1038/74199. [DOI] [PubMed] [Google Scholar]
- 44.Soufi A, Donahue G, Zaret KS. Facilitators and impediments of the pluripotency reprogramming factors’ initial engagement with the genome. Cell. 2012;151:994–1004. doi: 10.1016/j.cell.2012.09.045. [DOI] [PMC free article] [PubMed] [Google Scholar]
- 45.Judson RL, Babiarz JE, Venere M, Blelloch R. Embryonic stem cell-specific microRNAs promote induced pluripotency. Nature biotechnology. 2009;27:459–461. doi: 10.1038/nbt.1535. [DOI] [PMC free article] [PubMed] [Google Scholar]
- 46.Subramanyam D, et al. Multiple targets of miR-302 and miR-372 promote reprogramming of human fibroblasts to induced pluripotent stem cells. Nat Biotechnol. 2011;29:443–448. doi: 10.1038/nbt.1862. [DOI] [PMC free article] [PubMed] [Google Scholar]
- 47.Anders S, Huber W. Differential expression analysis for sequence count data. Genome biology. 2010;11:R106. doi: 10.1186/gb-2010-11-10-r106. [DOI] [PMC free article] [PubMed] [Google Scholar]
- 48.Amsterdam A, et al. Identification of 315 genes essential for early zebrafish development. Proceedings of the National Academy of Sciences of the United States of America. 2004;101:12792–12797. doi: 10.1073/pnas.0403929101. [DOI] [PMC free article] [PubMed] [Google Scholar]
- 49.Iwafuchi-Doi M, et al. The Pou5f1/Pou3f-dependent but SoxB-independent regulation of conserved enhancer N2 initiates Sox2 expression during epiblast to neural plate stages in vertebrates. Developmental biology. 2011;352:354–366. doi: 10.1016/j.ydbio.2010.12.027. [DOI] [PubMed] [Google Scholar]
- 50.Matter N, Konig H. Targeted ‘knockdown’ of spliceosome function in mammalian cells. Nucleic acids research. 2005;33:e41. doi: 10.1093/nar/gni041. [DOI] [PMC free article] [PubMed] [Google Scholar]
- 51.Amsterdam A, et al. Identification of 315 genes essential for early zebrafish development. Proceedings of the National Academy of Sciences of the United States of America. 2004;101:12792–12797. doi: 10.1073/pnas.0403929101. [DOI] [PMC free article] [PubMed] [Google Scholar]
- 52.Iwafuchi-Doi M, et al. The Pou5f1/Pou3f-dependent but SoxB-independent regulation of conserved enhancer N2 initiates Sox2 expression during epiblast to neural plate stages in vertebrates. Developmental biology. 2011;352:354–366. doi: 10.1016/j.ydbio.2010.12.027. [DOI] [PubMed] [Google Scholar]
- 53.Matter N, Konig H. Targeted ‘knockdown’ of spliceosome function in mammalian cells. Nucleic acids research. 2005;33:e41. doi: 10.1093/nar/gni041. [DOI] [PMC free article] [PubMed] [Google Scholar]
- 54.Rosel TD, et al. RNA-Seq analysis in mutant zebrafish reveals role of U1C protein in alternative splicing regulation. The EMBO journal. 2011;30:1965–1976. doi: 10.1038/emboj.2011.106. [DOI] [PMC free article] [PubMed] [Google Scholar]
- 55.Kimmel CB, Ballard WW, Kimmel SR, Ullmann B, Schilling TF. Stages of embryonic development of the zebrafish. Dev Dyn. 1995;203:253–310. doi: 10.1002/aja.1002030302. [DOI] [PubMed] [Google Scholar]
- 56.Langmead B, Trapnell C, Pop M, Salzberg SL. Ultrafast and memory-efficient alignment of short DNA sequences to the human genome. Genome biology. 2009;10:R25. doi: 10.1186/gb-2009-10-3-r25. [DOI] [PMC free article] [PubMed] [Google Scholar]
- 57.Trapnell C, Pachter L, Salzberg SL. TopHat: discovering splice junctions with RNA-Seq. Bioinformatics (Oxford, England) 2009;25:1105–1111. doi: 10.1093/bioinformatics/btp120. [DOI] [PMC free article] [PubMed] [Google Scholar]
- 58.Collins JE, White S, Searle SM, Stemple DL. Incorporating RNA-seq data into the zebrafish Ensembl genebuild. Genome Res. 2012;22:2067–2078. doi: 10.1101/gr.137901.112. [DOI] [PMC free article] [PubMed] [Google Scholar]
Associated Data
This section collects any data citations, data availability statements, or supplementary materials included in this article.
Supplementary Materials
a, Schematic of the sequencing strategy used in this study. The majority of zebrafish protein-coding genes (>95%) contain introns. De novo transcription produces intronic RNA sequences, which are spliced out of pre-mRNAs by the spliceosome, consisting of several ncRNA species including U1 and U2. b, Typical mRNA-Seq applications use poly(A)+ selection to enrich for the mature mRNA population. Sequence reads thus map predominantly to exonic regions, with very few reads mapping to introns. During embryogenesis, many zygotic transcribed genes are expected to have a maternal contribution in the cytoplasm from the oocyte. Thus, the resulting signal will be a mixture of maternal-derived (orange) and zygotic-derived (blue) mRNA molecules, which cannot be deconvoluted without comparing to a reference sample to look for exon expression level change. c, mRNA-Seq applications that skip poly(A)+ selection and instead use a rRNA depletion protocol (RiboZero) will not enrich for the mature mRNA population. Thus, transcripts in all stages of biogenesis (e.g., pre-mRNA, partially spliced mRNA, spliced introns) will be sequenced, and reads are expected to map both to exons and introns. Because maternally contributed mRNAs are mature, any intron signal detected must derive from de novo zygotic transcription. To determine the background signal for each intron, α-amanitin is used as a negative control for transcription. d, Morpholinos complementary to U1 and U2 injected into one-cell embryos inhibit zygotic splicing. Thus, pre-mRNAs fail to be processed, and the entire population of zygotic mRNAs will be unspliced. There are two benefits: i) intron signal is amplified, since introns are stabilized in the pre-mRNA compared to spliced out introns; ii) protein production from zygotic mRNAs is effectively halted, since pre-mRNAs are generally not competent for normal translation. Thus, only the first wave of transcription, resulting from activation by maternal factors, is observed. Transcription that requires zygotic proteins (subsequent waves) will be largely absent. e, Bar plot showing proportion of sequencing reads aligning to gene introns. Total RNA sequencing reveals elevated intronic sequence reads, corresponding to de novo zygotic transcription. f, Pie chart showing the fate of the 5318 sphere-stage (4hpf) zygotic genes that are only detectable through significant changes in intron sequence. At shield stage (6hpf), 64% of the genes are still detected as zygotically transcribed based only on intron signal. These include genes that have simultaneous zygotic transcription with decay of the maternal contribution. 30% of the genes are detected using both exon and intron signal by shield stage, indicating that transcription levels at sphere stage were too low to detect differences in exons, but were apparent in the introns. g, Table showing number of genes detected in WT sphere stage embryos, sphere embryos injected with U1U2 MO and WT shield stage embryos, at different thresholds of detection. For both groups, a multiple test-corrected P < 0.1 threshold (Benjamin-Hochberg) was used for differential expression of exonic signal. For intronic signal, an uncorrected P < 0.1 was used for the “All detected” group, while a multiple test-corrected P < 0.1 was used for the > 5 RPKM gain group. h, Quantitative RT-PCR was performed for select genes to confirm zygotic transcription in wild type sphere-stage embryos (dark blue bars) compared to a-amanitin treated embryos (light blue bars). Primers were designed to amplify pre-mRNAs across exon-intron boundaries, except for cldne. Expression levels are reported as percentage of CT value compared to a maternally provided housekeeping gene (ef1a) (delta CT × 100%). Error bars show standard error of the mean for three technical replicates. Increased pre-mRNA levels were observed for all zygotic genes tested between wild type and a-amanitin. In contrast, maternally provided genes mtATP6 and mtND5 show no increase in wild type. Genes marked with (*) represent the bottom 10% of significant differential intron expression based on the RNA-Seq data (which quantifies both pre-mRNA and spliced introns). This shows that using intron signal is a reliable indication of zygotic transcription. i, Genes detected in this study were compared to previous annotations of zygotic transcripts. 13 used single nucleotide polymorphisms (SNPs) to identify transcripts derived from paternal alleles, to distinguish zygotic transcription from the maternal contribution. From their genomic sequencing results, we extracted 6750 genes with informative exonic SNPs, which were consistently called between the two sets of matings. 178 of the genes we call zygotically transcribed at sphere stage at levels > 5 RPKM are among the 6750 informative genes. 87% of these are also found to be transcribed by Harvey et al., with agreement between both strictly zygotic genes (Z) and maternal+zygotic genes (M+Z). 24 genes were not detected by Harvey et al (N.D.). At shield stage, 82% of the zygotic genes are also found by Harvey et al., with 134 genes not detected. j, These undetected genes nevertheless have highly increased expression pre-64c to post-MZT (Shield) using the RNA-Seq data generated by Harvey et al (left) and in the current study (right). k, Cumulative plots show that SNP density is significantly lower among Harvey et al undetected genes at shield compared to detected genes (P = 1.6E-3, two-sided Wilcoxon rank sum test), suggesting that low SNP density may account for the missed genes. l Overall, Harvey et al and the current study distinguish a similar number of zygotic vs maternal transcripts at 6hpf, among Ensembl genes with informative SNPs, with 74% agreement. However, 64% of zygotic transcripts identified in the current study do not have informative SNPs, and are thus not called transcribed by Harvey et al. m, Genes called transcribed by Harvey et al but not in the current study have significantly higher intron signal than maternal genes (P = 1.4E-95, two-sided Wilcoxon rank sum test), indicating that our significance threshold to detect zygotic transcription is conservative. n, Aanes et al 14 used a time course poly(A)+ RNA-Seq strategy to define zygotic transcripts. The comparable r70 Ensembl genes in the Aanes et al maternal+zygotic gene category are largely found in our study; however, we find thousands more transcribed genes based on intron signal -- these genes represent transcription that is masked by the maternal contribution. o. Overall, our study captures most of the zygotic genes in the three categories described by Aanes et al: maternal-zygotic genes (zygotic genes with maternal contribution, yellow), MBT genes (strictly zygotic genes detected at MBT, 3.5hpf, orange), and post-MBT genes (strictly zygotic genes detected at 5.3hpf, pink). Venn diagrams show the number of comparable r70 Ensembl genes that overlap between the two studies. Left panels include all zygotic genes detected in this study; right panels impose a zygotic expression threshold of >5RPKM. Percentages within each box are calculated as the number of genes detected in this study (at either time point) that overlap the respective Aanes group, divided by the size of the Aanes group. The overlap percentages are generally high, indicating that our study recovered genes previously annotated as zygotically transcribed as well as many additional zygotic genes based on the use of intronic reads.
* All rows represent separately collected biological samples, i.e. -- 19a, 19b and 19c; and 24a and 24b are biological replicates
† Age in hours post fertilization
‡ Reads aligning to the genome, minus rRNA-aligning reads where applicable
a-c, Biplots comparing strictly zygotic genes found by either the current study or Harvey et al (2013) at >5 RPKM (N = 202). Harvey et al zygotic expressed genes were identified by comparing their raw RNA-Seq data at 128c (pre-MZT) versus 3.5 hpf. In a, zygotic expression in U1U2 MO treated embryos (Total RNA, 4hpf) is compared to Harvey et al embryos treated with cycloheximide (poly(A)+, assayed at 3.5hpf), which shows lagging expression of many first-wave genes (defined as having >5 RPKM in +U1U2 MO). Genes verified by RT-PCR as first-wave (klf4, nnr, sox11a, isg15, cldne) are highlighted, in addition to cldnb, which misses the threshold for first wave in the +U1U2 MO transcriptome; and vox, which was highlighted by Harvey et al. In b-c, Embryos treated with cycloheximide and assayed in the current study at 4hpf and 6hpf (Total RNA) show gradual increases in expression of zygotic genes. Together these results suggest that expression of first-wave genes is independent of de novo zygotic factors, and that transcription overall is slower in cycloheximide-treated embryos compared to wild type or +U1U2 MO. d, Biplot showing gene expression levels (exonic) for all genes in +U1U2 MO embryos compared to cycloheximide (CHX) treated embryos assayed 6hpf. Magenta points highlight strictly zygotic genes, dark blue points highlight maternal+zygotic genes. 97% of the first-wave genes called in +U1U2 MO were expressed > 1RPKM in the cycloheximide condition. e, Biplot comparing exonic expression levels between wild type and cycloheximide treated embryos. Magenta points are strictly zygotic genes expressed > 5RPKM in wild type. A dotted line indicating 5RPKM expression in cycloheximide is shown. f, Box-and-whisker plots comparing exonic expression level differences between wild type and treated embryos in maternal genes, strictly zygotic multi-exon genes, and strictly zygotic single-exon genes. Both U1U2 MO and CHX treated embryos show loss of expression in zygotic genes compared to wild type (U1U2 MO: P = 9.4E-207 for multi-exonic, P = 4.2E-4 for single exon, Wilcoxon rank sum test comparing to Maternal; CHX: P = 4.3E-137 multi-exon, P = 1.5E-6 single exon). The box defines the first and third quartiles, with the median indicated with a thick black line. The systemic decreases in expression in the +U1U2 MO or +cycloheximide conditions compared to wild type suggest that while maternal factors can activate to a large extent expression of the first wave genes, additional zygotic contribution of transcription factors (Nanog, SoxB1 and Pou5f1, but possibly others as well) might be required to reach wild type levels of expression for many genes. This was also observed in Harvey et al 2013 for the gene vox. Alternatively, lower expression of first wave zygotic genes might be caused by reduced level of maternal encoded proteins since incubation with CHX at 32 cell stage might also decrease translation of the maternal deposited mRNAs. Indeed, we consistently observe that CHX treated embryos show lower/delayed expression compared U1U2 MO treated embryos, suggesting that premature inhibition of maternal mRNA translation has an effect on the rate of activation of the first wave genes. g, UCSC Genome Browser track showing an example of premature cleavage and polyadenylation (PCPA) for grhl3. Arrows indicate primer sites for RT-PCR. Previously, it was shown that U1 snRNA also serves to protect nascent mRNAs from PCPA, and that U1 inhibition results in 3’-truncation that may affect transcript level quantification (Berg et al., 2012; Kaida et al., 2010). h, RT-PCR for grhl3 on shield stage embryos (N=5). Wild type (WT), U1U2 MO, and CHX treated embryos all amplify a 381bp fragment from exon 1 to the beginning of intron 1. U1U2 MO injected embryos amplify an unspliced 2164bp gene product spanning exon 1 to 3, while wild type and CHX treated embryos have a 294bp spliced product, with α-amanitin as a negative control. i, Biplots comparing expression levels at the 5’ end of a transcript compared to the 3’ end, in order to detect PCPA. Read density was assayed in up to 1000 nts of 5’ and 3’ sequence per transcript. The range of asymmetry values in wild type reflects sequencing biases or transcript annotation irregularities. Several genes in U1U2 MO treated embryos show elevated asymmetry compared to wild type (orange dots, > 2-fold), reflecting a drop-off of read density moving 5’-3’ in the transcript, indicative of PCPA. These genes are included in our annotations of the zygotic first-wave of expressed genes. The minor extent of PCPA during embryogenesis may reflect the short length of many of the zygotic genes, since PCPA is associated with longer genes that are likely to harbor cryptic polyadenylation sites. Transcripts in CHX-treated embryos generally do not show this trend.
a, To assay the embryonic specificity of the first-wave genes, we used publicly available microarray data from NCBI GEO across 8 normal adult tissue types (brain - GSE11107, liver - GSE11107, heart - GSE17993, skin - GSE24528, kidney - GSE32363, digestive tract - GSE35889, ovary - GSE14979, testis - GSE14979) to classify genes as expressed specifically in the embryo (called “present” by the MAS5 algorithm in 0-2 different adult tissues), genes expressed semi-specifically (present in 3-6 different adult tissues), and genes expressed ubiquitously (present in 7-8 different adult tissues); this latter group would correspond to “housekeeping” genes. Sphere-stage first-wave genes consist of a mixture of specifically expressed and housekeeping genes. Subsequent wave genes and genes expressed at levels < 5 RPKM consist of a larger proportion of genes typically expressed ubiquitously in adult fish, suggesting a widespread activation of genes encoding general cellular processes in addition to developmentally specific ones. b, Gene Ontology enrichment analysis for first-wave, subsequent-wave and the low expressed genes with intronic RPKM > 0.5. Top 5 scoring clusters are shown for each gene set. Clusters were defined using DAVID (http://david.abcc.ncifcrf.gov) Gene Functional Annotation Clustering on GO “FAT” annotations and “high” stringency. Clusters are annotated with representative GO terms and corresponding Benjamini-Hochberg FDR corrected P values. c, To validate genes activated in the first wave versus subsequent waves, RT- PCR was performed on shield stage (6hpf) in wild type, α-amanitin, U1U2 MO, and cycloheximide (CHX) treated embryos. The unspliced product for nnr, isg15, and klf4 is detected only in U1U2 morphants, confirming that U1U2 is indeed blocking splicing. CHX treatment indicates the single-exon genes cldne, sox11a are activated in the first wave. cldnb is detected at low levels in wild type, as well as both U1U2 MO and CHX treated embryos; however, based on RNA-Seq levels at sphere stage, this gene does not pass the expression threshold to be called first wave. krt4 is significantly reduced in U1U2 MO and CHX treated embryos, indicating that zygotic factors are required for its activation. Maternal tubb4b is present in all conditions. d-h, UCSC Genome Browser tracks for first wave genes nnr, isg15, klf4, cldne and sox11a. i, UCSC Genome Browser track for cldnb, which shows low expression levels at sphere stage. j,k, UCSC Genome Browser track for a gene activated in subsequent waves (krt4) and for a maternally provided gene (tubb4b).
a, Wild type embryos were injected with Sox2, Sox3, Sox19a, and Sox19b MOs individually and in combination (0.125mM). Consistent with other reports, only quadruple LOF results in severe developmental defects (27hpf) 20. LOF phenotype is rescued by injecting soxb1 mRNA (imaged at 24hpf). b, Wild type and MZpou5f1 embryos were injected with SoxB1 MO (0.125mM each) and Nanog MO (0.6mM each) individually and in combination (Nanog + SoxB1). Loss of Nanog results in severe gastrulation defects and failure to progress past 80% epiboly, as previously reported 24. Loss of SoxB1 in both wild type and MZpou5f1 embryos showed developmental delay, while combined LOF for Nanog/SoxB1 or Pou5f1/Nanog completely arrested development prior to epiboly. Triple LOF embryos also arrested and failed to undergo gastrulation. c, Individual LOF for Nanog, SoxB1, and Pou5f1 resulted in developmental abnormalities (top panel). Embryos with Nanog loss of function did not progress past 80% epiboly. The LOF phenotypes were rescued by injecting the respective mRNAs (LOF + mRNA) (bottom panel). Embryos imaged at 23hpf. d, e, Wild type and MZpou5f1 embryos were co-injected with Nanog + SoxB1 MO. LOF embryos arrest at sphere stage and resemble α-amanitin injected embryos (+MO). Combinatorial loss-of function is rescued with co-injection of the respective mRNAs (MO + mRNA). Embryos were imaged when wild type siblings reached 75% epiboly (d) and 24hpf (e). f, Ribosome profiling was performed at 2hpf on wild type embryos and embryos injected with Nanog and SoxB1 morpholino at one-cell stage, in order to determine the specificity of the morpholinos to repress translation of nanog and soxB1 mRNA. Sequenced ribosome protected fragments were predominantly 28-29 nts long, indicative of the width of the ribosome footprint. UCSC Genome Browser tracks (sense strand) showing ribosome profiling (top 2 tracks per gene) and input mRNA (bottom 2 tracks per gene). nanog and sox19b show significant reduction in RPFs in the Nanog MO + SoxB1 MO injected embryos compared to wild type. Input mRNA is unaffected. Neither h1m, a highly expressed gene, or oep, a low expressed gene, have any change in either RPFs or input mRNA between wild type and injected embryos.
a, Biplots comparing log2 RPKM exonic expression levels between wild type and Nanog + SoxB1 + Pou5f1 loss-of-function embryos; and b, between wild type and triple loss-of-function embryos co-injected with mRNA for nanog, soxB1, and pou5f1; at 4hpf, 6hpf and 8hpf. Dark blue points highlight all strictly zygotic genes, while magenta points highlight the first-wave zygotic genes. miR-430 is highlighted at 4hpf in red, while green points indicate expression levels of (left to right) sox2, sox3, sox19a, sox19b and nanog. c, Donut plots showing proportion of the zygotic transcriptome affected (including first and subsequent waves). For sphere and shield stages and each LOF (Nanog MO, Nanog MO + SoxB1 MO, MZpou5f1 + Nanog MO + SoxB1 MO), dark blue regions represent genes with normal expression compared to wild type, light blue regions represent genes with significant loss of expression. Inner ring is comprised of zygotic genes with < 1 RPKM of maternal contribution, outer ring is comprised of zygotic genes with maternal contribution. Percentages represented total affected genes in that condition over both gene categories. At sphere stage (4hpf) the effect for maternal and zygotic (M+Z) genes is weaker than for strictly zygotic genes, which may reflect a reduced power to detect changes due to the maternal contribution (see also Fig 3b).
a-f, UCSC Genome Browser tracks and g, RT-PCR analysis for zygotic genes klf4b, vox, tbx16, mxtx2, her3 and sox32, showing differential expression of zygotic genes in LOF conditions. Expression levels were rescued by injecting nanog and soxb1 mRNA (MO + mRNA). Maternal hist1h2aa was present in the α-amanitin control. RT (-) indicates the absence of reverse transcriptase, to control for genomic DNA contamination. In UCSC tracks, loss of Nanog, SoxB1 and Pou5f1 in each sequenced condition is indicated by (-). h,i, In situ hybridization for zygotically transcribed cldne and cebpb show that loss of Nanog and SoxB1 (Nanog + SoxB1 MO) has minimal effect on activation of cldne and cebpb. However, triple loss of function shows a decrease in expression for both genes, as shown in the UCSC tracks. j-o, In situ images showing that loss of Nanog and SoxB1 function results in a significant reduction in zygotic foxa3, blf, vent, foxd3, krt18 and ntla expression. Loss of function embryos (Nanog + SoxB1 MO) resemble α-amanitin injected embryos by in situ, as well as in their transcriptome profiles. Loss of Nanog and SoxB1 is rescued by nanog and soxb1 mRNA (MO + mRNA), which is sufficient to restore wild type expression profiles.
a, Comparisons of the single and double loss of function transcriptomes to the triple reveals that regulation is often combinatorial and redundant. Although all three factors appear to exert some influence on the majority of transcribed genes, the effects observed in the combined loss of function are not usually additive. Nanog appears to have the strongest individual effect of the three factors, but Pou5f1/SoxB1 can often act redundantly, or amplify the effect of Nanog alone. Venn diagrams show overlap between genes significantly down regulated at shield stage in single (pink), double (green), and triple (blue) LOF embryos. N=2172, left; N= 2027, right. b, Pie charts showing the relative influence of each factor in the triple LOF. For each pie chart, genes downregulated in the triple LOF were compared in the single and double LOF transcriptomes. If the downregulation of a gene observed in the single LOF was less than 2-fold different from that observed in the triple LOF, the gene was considered to be regulated by the single factor alone. Otherwise, if the downregulation in the double was less than 2-fold different than the triple, the gene was considered regulated by the combination of two factors. All remaining genes display the strongest downregulation in the triple LOF. Note that genes in each category may be affected by other combinations of LOF; however, the effect there is weaker. c, Breakdown of effects showing the redundancy of regulation in genes downregulated in the triple LOF. The largest category of genes appears to be regulated exclusively by Nanog (31%), since loss of Nanog function is equivalent to the triple loss of function. 16% of genes appear to be regulated by both Nanog and Pou5f1 together, since loss of either Nanog alone or loss of Pou5f1 alone is sufficient to achieve the loss of function observed in the triple. 16% of genes have equivalent effects with either Nanog loss of function or Pou5f1+SoxB1 double loss of function, suggesting that Pou5f1 and SoxB1 act redundantly for these genes to co-regulate with Nanog. 9% of genes show the strongest effect only in the triple LOF. This suggests that there is redundancy between all three factors, since these genes can still be activated when one or two factors are lost. In all, 76% of the affected genes display are subject to some form of redundant or combinatorial regulation. (*) For genes where the effect in the triple was equivalent to both the double loss of SoxB1 and Nanog; and the double loss of SoxB1 and Pou5f1, we inferred that the effect was conferred by SoxB1 alone. d, A majority of genes are affected in the double or triple loss-of-function conditions, across the gene categories defined in Supplementary Fig. 3a, including both embryo-specific genes and housekeeping (ubiquitously expressed) genes. e, Heatmap showing specific embryonic functional categories of genes downregulated in loss-of-function embryos. Three GO categories of genes expressed in wild type at shield stage are shown: general transcription factors, gastrulation and cell movement genes, and patterning genes (Anterior-Posterior axis and Dorsal-Ventral axis). Expression levels are represented as row-normalized values on a red-green color scale for wild type (WT), α-amanitin treated (A), Nanog LOF (N), Nanog+SoxB1 LOF (NS), and Nanog+SoxB1+Pou5f1 triple LOF (NSP). Widespread loss of expression is observed across these functional categories, with the triple LOF exhibiting the greatest similarity to α-amanitin.
a, Schematic representation of miR-430 activity reporter GFP-3xIPT-miR-430 containing three complementary target sites to miR-430 26. If maternal factor (M) is present, miR-430 is expressed and represses translation of the target mRNAs (no GFP expressed). Conversely, loss (X) of the maternal factor required for miR-430 activation would lead to a failure to repress miR-430 targets and GFP expression. dsRed is a control mRNA that is not subject to regulation by miR-430 and is co-injected with the target mRNA. b, GFP-reporter and dsRed (injection control) mRNAs were co-injected into embryos at one-cell stage and fluorescence assayed 7-8hpf. GFP-reporter is repressed in wild type and SoxB1 morphants by endogenous miR-430 (Giraldez et al., 2005), as shown by a decrease in GFP expression. The GFP-reporter fails to be repressed in α-amanitin (that fail to activate zygotic transcription and do not express miR-430) and Nanog MO injected embryos, indicating a loss of miR-430 activity. c, In situ hybridization for maternal miR-430 target gene cd82b. At shield stage, cd82b is cleared from wild type and MZpou5f1 embryos. Nanog, SoxB1, and Pou5f1 LOF causes a failure in clearance (MZpou5f1 +Nanog + SoxB1 MO). Injection of nanog, soxb1, and pou5f1 mRNA rescues the phenotype (MO + mRNA). d, Cumulative plots showing the effect of each LOF condition on miR-430 target repression, as in Bazzini et al (2012), using Total RNA-Seq. Plots show the distribution of log2 fold expression level difference for each condition relative to wild type in three groups of genes defined in Bazzini et al (2012): miR-430 targets with multiple 7mer or 8mer seed target sites in their 3’UTR; miR-430 targets with a single 7mer or 8mer seed in the 3’UTR; and genes lacking miR-430 seed sites in their 3’UTRs. P values are for two-sided Wilcoxon rank sum tests comparing each of the two miR-430 target groups to the non targets. MZdicer expression data is from Bazzini et al (2012). Displacement of the curve to the left (-) from the gray control line, indicates a larger fraction of genes are accumulated (fail to be degraded) in the indicated condition compared to wild type. Nanog has the strongest effect, though there is also an effect from the combined loss of Pou5f1 and SoxB1. e, Cumulative plots showing the effect of triple LOF, with and without mRNA rescue, on miR-430 target repression, using poly(A)+ selection RNA-Seq. At 6hpf, miR-430 targets fail to be degraded in the LOF condition compared to wild type, with expression levels of targets high in the LOF relative to wild type. Co-injection of nanog, soxB1, and pou5f1 mRNAs restores miR-430 activity, and the targets’ expression levels are restored to near wild type levels. f, At 8hpf, miR-430 targets are still undegraded in the LOF, but are degraded to wild type levels in the rescue. P values are for two-sided Wilcoxon rank sum tests comparing each of the two miR-430 target groups to the non targets.
a, Nanog chromatin immunoprecipitation sequencing binding data in zebrafish at 3.3 hpf (Xu et al, 2012) was reanalyzed to determine Nanog bound regions genome wide. Pie charts show percentage of genes in each category that are associated with Nanog bound regions (+/- 5kb). 74% of first-wave genes detected at sphere were associated with Nanog binding, 2-fold higher than subsequent-wave genes (P = 3.7E-29, two-sided Fisher’s Exact Test). Low expressed zygotic genes are also less associated with Nanog bound regions. For those genes that are nonetheless affected by Nanog LOF, this suggests that they are influenced by Nanog indirectly, rather than through Nanog binding at the gene locus. The enrichment of Nanog binding on the first wave genes versus subsequent waves supports a model where Nanog plays a central role in the regulation of the activation of the first wave of zygotic transcription. b, ChIP-Seq data for Nanog, Oct4 and Sox2 in mouse embryonic stem cells 19,20 was used to examine the binding profiles of genes transcribed during pre-implantation mouse embryogenesis 21, since ChIP data does not exist for early mouse embryos. Three gene groups were analyzed: α-amanitin sensitive genes expressed at early 2-cell stage (minor wave ZGA), α-amanitin sensitive genes expressed at late 2-cell stage (major wave ZGA), and genes expressed during the 4-8-cell stages (mid-preimplantation). Gene promoters (defined to be 5 Kb upstream to 50 bases downstream the annotated transcription start site of a gene) are highly enriched in binding sites among the genes comprising ZGA, as compared to the genome as a whole (P = 4.03E-07 for the minor wave, P = 6.05E-18, two-sided Fisher’s Exact Test). Genomic coordinates (mm8) for genes were defined by NIA/NIH U-cluster annotations for the microarray probes in 21. Note that not all of the genes expressed during ZGA are necessarily expressed in ES cells; thus, the binding proportions are likely to be underestimates. While these represent two different states of development, these results are consistent with a role for these factors in activating the earliest waves of zygotic gene expression also in mammals. c, Model showing maternal gene expression in red and zygotic gene expression in blue during the maternal to zygotic transition. Gene expression is depicted on the y axis and time on the x axis. During the MZT, Nanog, SoxB1 and Pou5f1 are required to activate a large fraction of zygotic genes, including miR-430, which in turn is responsible for the clearance of a significant portion of maternal mRNAs. In the loss of function of Nanog, SoxB1 and Pou5f1, there is a reduction in zygotic gene activation, causing a failure in the establishment of the zygotic developmental program, including loss of miR-430 expression and maternal mRNA clearance.