Abstract
Body temperature homoeostasis in mammals is governed centrally through the regulation of shivering and non-shivering thermogenesis and cutaneous vasomotion. Non-shivering thermogenesis in brown adipose tissue (BAT) is mediated by sympathetic activation, followed by PGC-1α induction, which drives UCP1. Here we identify nardilysin (Nrd1 and NRDc) as a critical regulator of body temperature homoeostasis. Nrd1−/− mice show increased energy expenditure owing to enhanced BAT thermogenesis and hyperactivity. Despite these findings, Nrd1−/− mice show hypothermia and cold intolerance that are attributed to the lowered set point of body temperature, poor insulation and impaired cold-induced thermogenesis. Induction of β3-adrenergic receptor, PGC-1α and UCP1 in response to cold is severely impaired in the absence of NRDc. At the molecular level, NRDc and PGC-1α interact and co-localize at the UCP1 enhancer, where NRDc represses PGC-1α activity. These findings reveal a novel nuclear function of NRDc and provide important insights into the mechanism of thermoregulation.
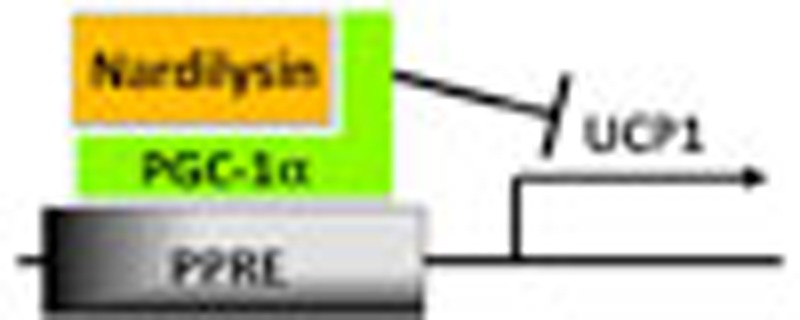 The precise regulation of mammalian body temperature is important for survival. Here the authors show that the peptidase nardilysin represses the transcription factor PGC-1α, and identify nardilysin as a regulator of basal body temperature, cold-induced thermogenesis and body insulation.
Thermoregulation is one of the most precisely regulated homoeostatic functions in mammals, as hyperthermia or hypothermia beyond the normal range can rapidly turn into a life or death situation. Under cold stress, mammals maintain their euthermic body temperature by preventing heat loss and producing extra heat through shivering and non-shivering (adaptive) thermogenesis. Brown adipose tissue (BAT) is a specific organ for adaptive thermogenesis and its principal function is to generate heat through an oxidative process not coupled to ATP synthase, but mediated by the mitochondrial uncoupling protein 1 (UCP1)1,2,3. The sympathetic nervous system (SNS) regulates lipolysis and UCP1 expression in BAT, and vasoconstriction in skin, both of which are critical factors for balancing heat production and heat loss1,4. The SNS also modulates the expression of peroxisome proliferator-activated receptor γ co-activator-1α (ppargc1α and PGC-1α), which is an indispensable regulator for cold-induced upregulation of UCP1 (refs 5, 6). Although essential roles of the SNS and PGC-1α/UCP1 pathway have been confirmed by the cold intolerance phenotype of knockout mice lacking the gene for dopamine β-hydroxylase7, β-adrenergic receptors (β-ARs)8, PGC-1α6 or UCP1 (ref. 2), the molecular mechanisms of how this pathway is regulated in vivo have not been precisely defined.
Adaptive thermogenesis is a major component of energy expenditure. As obesity occurs when energy intake exceeds energy expenditure, increasing the expenditure by enhancing adaptive thermogenesis could lead to the prevention of obesity9. While the physiological relevance of BAT in human adults was controversial, recent studies by positron emission tomography have clearly shown its presence and metabolic function10,11,12,13. Regulatory factors of adaptive thermogenesis in BAT, thus, might be a potential therapeutic target for obesity9,14.
Nardilysin (N-arginine dibasic convertase; Nrd1 and NRDc) is a zinc peptidase of the M16 family, which selectively cleaves dibasic sites15,16. Enzymatic activity of NRDc appears to be required for antigen processing and the generation of cytotoxic T-lymphocyte epitopes17. NRDc is mainly localized in the cytoplasm as it has no apparent signal sequence, but a significant proportion is secreted through an unconventional secretory pathway and distributed on the cell surface18. We identified NRDc on the cell surface as a specific binding partner of heparin-binding epidermal growth factor (EGF)-like growth factor (HB-EGF), and demonstrated that NRDc enhances the ectodomain shedding of HB-EGF and other membrane proteins through the activation of A disintegrin and metalloproteinase (ADAMs)19,20,21,22. Furthermore, critical roles of NRDc as an enhancer of shedding have been implicated in nervous system development23, Alzheimer’s disease24 and cancer biology25. Interestingly, NRDc has been demonstrated to shuttle between the cytosol and nucleus26,27 and NRDc has been recently identified as a dimethyl-H3K4-binding protein, suggesting a novel role of NRDc in transcriptional regulation28.
Here we demonstrate that NRDc-deficient (Nrd1−/−) mice show hypothermia and severe cold intolerance, which are attributed to lowered set point of body temperature, poor thermal insulation and impaired cold-induced BAT thermogenesis. Our studies also revealed that NRDc and PGC-1α interact and co-localize in the UCP1 enhancer where NRDc regulates PGC-1α activity and UCP1 transcription. These results indicate that NRDc critically regulates body temperature homoeostasis, in part, through the modulation of PGC-1α activity.
Results
Hypothermia and severe cold intolerance in Nrd1 −/− mice
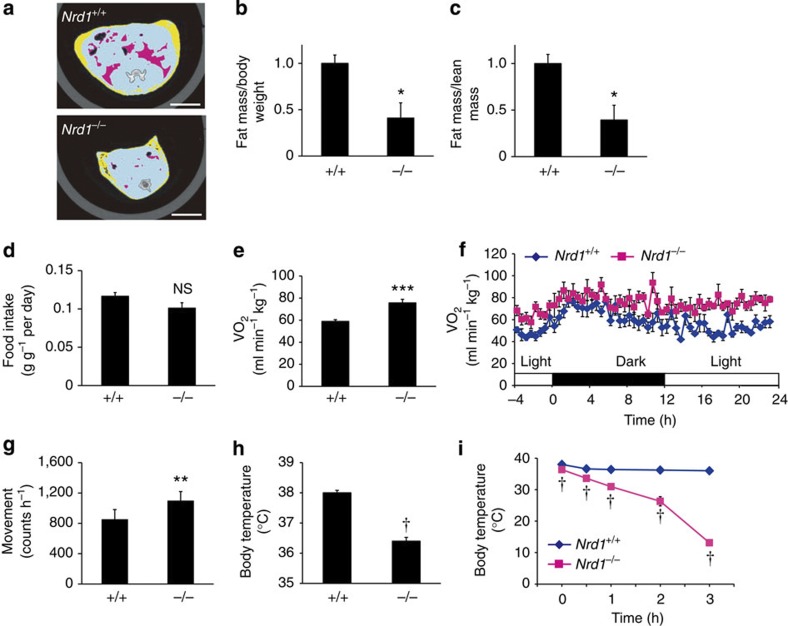
We previously reported that Nrd1−/− mice show growth retardation23. Analysis of body composition of Nrd1−/− mice by cross-sectional computed tomography (CT) revealed a lean phenotype of Nrd1−/− mice (Fig. 1a). The ratios of body fat mass to total body weight (BW) and to lean mass were significantly reduced in Nrd1−/− mice compared with Nrd1+/+ littermates (Fig. 1b,c). As these results suggested a negative energy balance in Nrd1−/− mice, we examined food intake and energy expenditure. While both Nrd1+/+ and Nrd1−/− mice showed similar ad libitum food intake per BW (Fig. 1d), average energy expenditure, measured as oxygen consumption (VO2), was 28.5% higher in Nrd1−/− mice (Fig. 1e). During a whole day ad libitum feeding, VO2 per total BW of Nrd1−/− mice was consistently higher than that of Nrd1+/+ mice (Fig. 1f). Two major components of energy expenditure are physical activity and adaptive thermogenesis4. Monitoring of animal movement showed that Nrd1−/− mice are more active than Nrd1+/+ mice (Fig. 1g), partially explaining the enhanced energy expenditure of Nrd1−/− mice. To determine whether increased adaptive thermogenesis contributes to the enhanced energy expenditure, we examined the resting core body temperature and cold tolerance of Nrd1−/− mice. Unexpectedly, even at room temperature (23 °C), the core body temperature of Nrd1−/− mice was significantly lower than that of Nrd1+/+ mice (Nrd1+/+: 38.0±0.08 °C, Nrd1−/−: 36.4±0.14 °C, the mean±s.e.m., measured in light period, n=6, P<0.0001, two-tailed Student’s t-test; Fig. 1h).
Figure 1. Increased energy expenditure, hypothermia and cold intolerance of Nrd1−/− mice.
(a) Representative CT sections of abdominal regions of 3-month-old Nrd1+/+ and Nrd1−/− mice. Scale bars, 10 mm. (b,c) Ratio of total fat to BW (b) or to lean mass (c) was calculated from CT scan data. Pink areas show visceral fat, while yellow areas show subcutaneous fat. n=3 per genotype. (d) Food intake was measured daily for 7 days and normalized to BW. n=5 per genotype. (e,f) VO2 of 3-month-old Nrd1+/+ and Nrd1−/− mice was monitored in 10 min intervals for 24 h (f) and the average VO2 for 24 h is shown (e). n=6 per genotype. (g) Physical activity was monitored for 7 days. The average movement counts are shown. n=6 per genotype. (h,i) Body temperature of 3-month-old Nrd1+/+ and Nrd1−/− mice at room temperature (h) and after cold (4 °C) exposure (i). n=6 per genotype. All data represent means±s.e.m. *P<0.05, **P<0.005, ***P<0.001, †P<0.0001, NS, not significant (two-tailed Student’s t-test).
We next exposed 3-month-old Nrd1+/+ and Nrd1−/− mice to 4 °C. Mice on both genotypes responded to cold exposure by shivering, indicating that Nrd1−/− mice could sense the cold temperature. Nrd1−/− mice showed severe and prolonged shivering at 1.5 h after the initiation of cold exposure (Supplementary Movie 1), whereas Nrd1+/+ mice showed minimal shivering (Supplementary Movie 2). These observations suggested that adaptive thermogenesis in Nrd1−/− mice is impaired. Whereas Nrd1+/+ mice kept their body temperature at around 36.5 °C by the end of 3 h cold exposure after an initial drop of ~1.5 °C, Nrd1−/− mice were surprisingly intolerant to cold exposure as their body temperature dropped below 30 °C within 2 h and below 15 °C within 3 h (Fig. 1i). As a control, we exposed younger Nrd1+/+ mice that had similar BW similar to 3-month-old Nrd1−/− mice to 4 °C. As expected, younger Nrd1+/+ mice were able to maintain their body temperature at around 36.5 °C by the end of 3 h cold exposure, indicating that cold intolerance of Nrd1−/− mice is not merely because of their smaller body mass (Supplementary Fig. 1).
Cold-induced thermogenesis is impaired in Nrd1 −/− mice
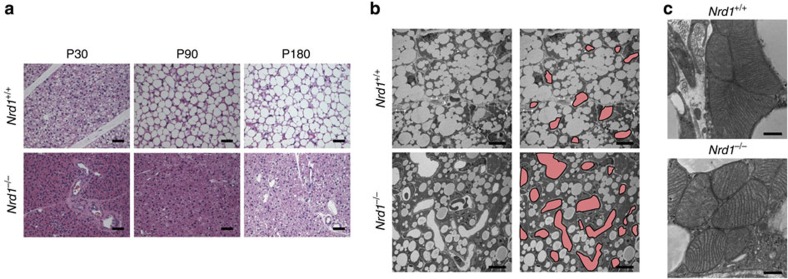
To clarify the underlying mechanism of hypothermia and cold intolerance in Nrd1−/− mice, we first examined the histopathology of BAT, which generates heat mainly through the mitochondrial uncoupler, UCP1. Unexpectedly, we found that lipid accumulation in BAT was substantially lower in Nrd1−/− than Nrd1+/+ mice at postnatal day 30 (P30), P90 and even at P180 (Fig. 2a). Electron microscopy at P14 showed that the size of lipid vacuoles was much smaller in Nrd1−/− BAT, which resulted in the reduced cell size and relative increase of the mitochondrial density in Nrd1−/− adipocytes (Fig. 2b). Electron micrograph images at a higher magnification revealed no structural abnormality in the mitochondria of Nrd1−/− BATs (Fig. 2c). Notably, much more capillary vessels with larger diameters were found in Nrd1−/− BAT (Fig. 2b), indicating that Nrd1−/− BAT is supplied with more blood flow compared with Nrd1+/+ BAT. The vascular-rich phenotype was not observed in other tissues such as the liver and skin, implying an increased oxygen requirement specifically for BAT. In spite of the hypothermic phenotype of Nrd1−/−, these histological features indicate that Nrd1−/− BAT is metabolically more active, producing more heat than Nrd1+/+ BAT. To examine whether NRDc is involved in adipogenic differentiation, primary culture of preadipocytes was prepared from Nrd1+/+ and Nrd1−/− BAT and differentiated into adipocytes. Cellular morphology was similar and oil red O staining revealed no clear differences in lipid accumulation between the two genotypes, indicating that NRDc is not involved in adipogenic differentiation (Supplementary Fig. 2a,b).
Figure 2. Decreased lipid accumulation and increased blood vessels in Nrd1−/− BAT.
(a) Haematoxylin and eosin-stained sections of BAT of Nrd1+/+ and Nrd1−/− mice at P30, P90 and P180. Scale bars, 100 μm. (b) Electron micrographs of BAT at P14. The same set of pictures, in which blood vessels are painted in red, are shown in the right panel. Scale bars, 10 μm. (c) Electron micrographs of BAT at P14 at a high magnification. Scale bars, 500 nm.
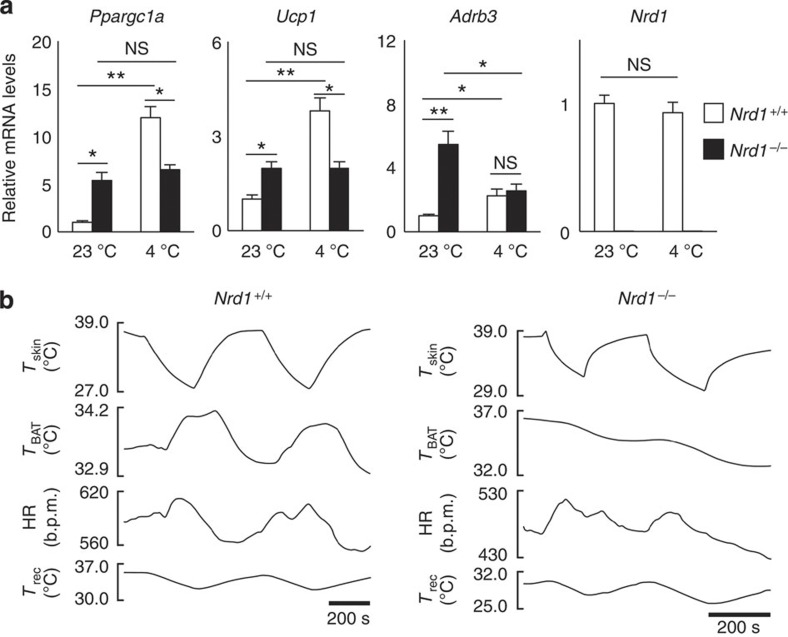
Cold-induced thermogenesis is mediated through the sympathetic activation of β3-AR (Adrb3) on brown adipocytes, which is followed by induction of a transcriptional co-activator PGC-1α, resulting in increased expression of UCP1 (refs 1, 4). In PGC-1α-deficient BAT, cold-induced upregulation of UCP1 is markedly reduced, indicating that the PGC-1α/UCP1 pathway is essential for adaptive thermogenesis6. Consistent with the histological findings, messenger RNA (mRNA) levels of PGC-1α, UCP1 and β3-AR at room temperature were significantly higher in Nrd1−/− BAT (Fig. 3a). However, while Ppargc1α, Ucp1 and Adrb3 in Nrd1+/+ BAT were dramatically induced by cold exposure, Ppargc1α and Ucp1 were not induced and Adrb3 was significantly decreased in Nrd1−/− BAT (Fig. 3a). As the blunted induction suggested that cold-induced adaptive thermogenesis is impaired in Nrd1−/− mice, we measured BAT temperature (TBAT) in vivo under cold exposure. Repeated skin cooling consistently increased TBAT in Nrd1+/+ mice, but not in Nrd1−/− mice, confirming that adaptive thermogenesis is severely impaired in Nrd1−/− BATs in vivo (Fig. 3b; Supplementary Table 1). However, the tachycardic response to cooling was intact in Nrd1−/− mice, indicating that cutaneous temperature sensation is normal in Nrd1−/− mice (Fig. 3b; Supplementary Table 1).
Figure 3. Impaired cold-induced thermogenesis in Nrd1−/− mice.
(a) Quantitative reverse transcription–PCR analysis for genes involved in adaptive thermogenesis in BAT before (23 °C) and after 3 h cold exposure (4 °C). The mRNA level is normalized by β-actin mRNA, and the level is arbitrarily set at 1 in Nrd1+/+ BAT at room temperature. n=6 per genotype. (b) Representative trunk skin cooling (Tskin)-evoked changes in TBAT, heart rate (HR) and Trec. All data represent means±s.e.m. *P<0.05, **P<0.005, NS, not significant (two-tailed Student’s t-test).
Poor insulation and lowered set point in Nrd1 −/− mice
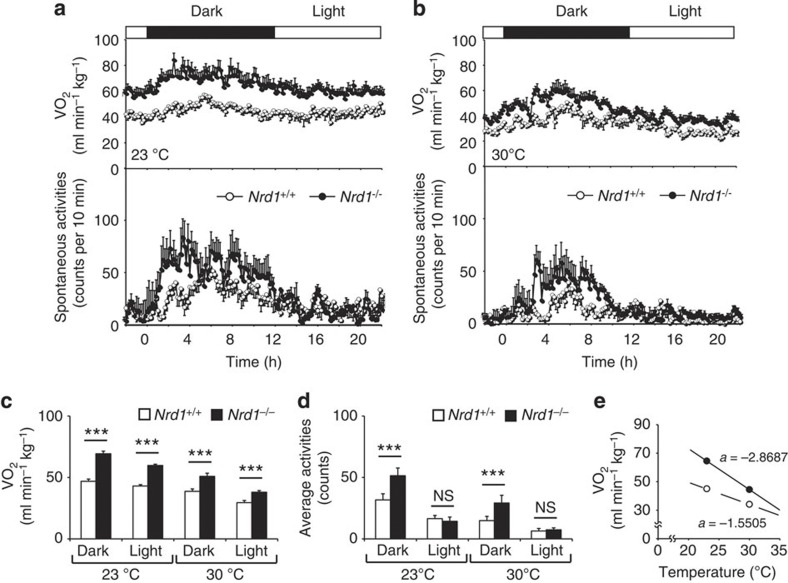
As the thermoneutral zone for mice is around 30 °C, mice have to generate heat at room temperature (23 °C) to maintain their body temperature29. The lean phenotype of Nrd1−/− mice suggest that they are poorly insulated, which may cause enhanced adaptive thermogenesis to compensate lost heat. To explore this possibility, we measured VO2 of 6-month-old Nrd1−/− mice at 23 and 30 °C. Similar to 3-month-old mice (Fig. 1f), VO2 of 6-month-old Nrd1−/− mice was significantly higher than that of Nrd1+/+ mice at 23 °C. Notably, Nrd1−/− mice showed hypermetabolism even at 30 °C, albeit the difference in energy expenditure between Nrd1+/+ and Nrd1−/− mice was smaller at 30 °C (Fig. 4a–c). As the slope of increasing metabolism with decreasing ambient temperature shows the level of insulation29, these results indicate that Nrd1−/− mice are less insulated than Nrd1+/+ mice (Fig. 4e). Simultaneous monitoring of physical activities demonstrated that Nrd1−/− mice are more active than Nrd1+/+ mice at night, but not at daytime (Fig. 4a,b,d). Therefore, the higher VO2 of Nrd1−/− mice, at least at daytime, is due to increased thermogenesis. Consistent with these results, BAT mRNA levels of UCP1 and β3-AR in Nrd1−/− mice showed clear tendencies to be higher than Nrd1+/+ mice even after 10 days housing at 30 °C, although no difference in PGC-1α was observed under this condition (Supplementary Fig. 3). These findings indicated that BAT thermogenesis is primarily enhanced in the mutant mouse, and further enhanced to compensate poor insulation at room temperature.
Figure 4. VO2 at different ambient temperature indicates poor insulation of Nrd1−/− mice.
(a,b) VO2 (upper) and physical activities (lower) of Nrd1+/+ and Nrd1−/− mice were monitored at 23 °C (a) or 30 °C (b). n=6 per genotype and temperature. (c,d) The average VO2 (c) and activities (d) during dark and light period of Nrd1+/+ and Nrd1−/− mice housed at 23 or 30 °C. n=6 per genotype and temperature. (e) Relationship between metabolic rates and ambient temperature. The average VO2 of Nrd1+/+ (white) and Nrd1−/− (black) mice was plotted against ambient temperature (at 23 and 30 °C). All data represent means±s.e.m. ***P<0.001, NS, not significant (two-tailed Student’s t-test).
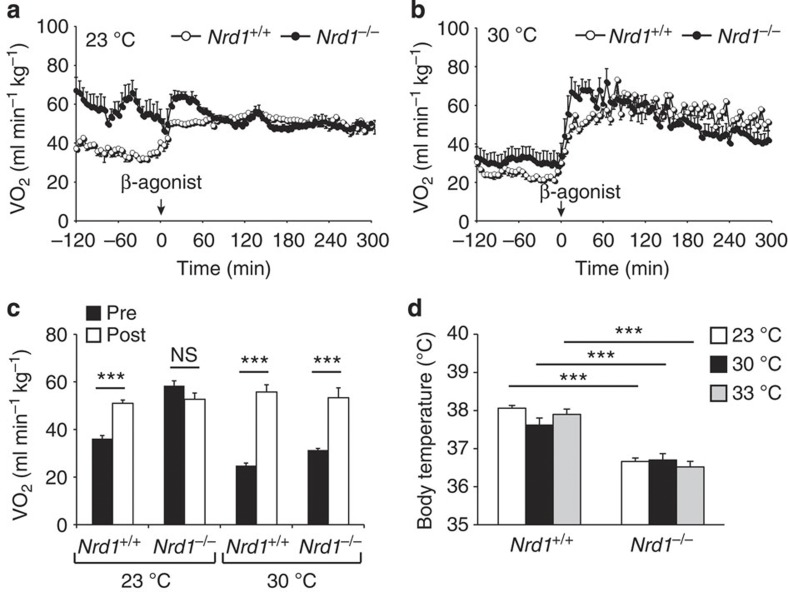
To test the capacity of BAT thermogenesis at thermoneutrality, we next examined the effect of β3 agonist on the metabolism at 23 and 30 °C. At 23 °C, Nrd1+/+ mice responded to β3 agonist injection with a sharp increase of VO2, whereas Nrd1−/− mice showed high basal metabolism and did not respond to β3 agonist injection (Fig. 5a,c). In contrast, at 30 °C, Nrd1−/− mice responded to β3 agonist from the decreased basal level (Fig. 5b,c). These results indicated that Nrd1−/− mice can induce BAT thermogenesis, at least, in the narrow range of higher ambient temperature around 30 °C.
Figure 5. β3 agonist-induced VO2 and body temperature of Nrd1−/− mice.
(a,b) VO2 induced by β3 agonist (BRL-37344: 5 mg kg−1) in Nrd1+/+ and Nrd1−/− mice housed at 23 °C (a) or 30 °C (b). n=6 per genotype and temperature. (c) The average VO2 of Nrd1+/+ and Nrd1−/− mice before (Pre) and after (Post) β3-agonist injection at 23 or 30 °C. n=6 per genotype and temperature. (d) Body temperature of Nrd1+/+ and Nrd1−/− mice housed at 23, 30 or 33 °C. n=5 per genotype and temperature. All data represent means±s.e.m. ***P<0.001, NS, not significant (two-tailed Student’s t-test).
If hypothermia of Nrd1−/− mice at 23 °C is merely due to impaired BAT thermogenesis, their body temperature may rise when they are in the thermoneutral zone. However, the 1.5 °C difference in body temperature between Nrd1+/+ and Nrd1−/− mice was still evident at 30 °C and even at 33 °C (Fig. 5d). These results suggest that the hypothermia of Nrd1−/− mice is caused by lowered set point of body temperature.
To rule out the possibility that impaired cold-induced thermogenesis is due to the reduced lipid substrate in Nrd1−/− BAT, we fed mice with a high-fat diet (HFD). After being fed with HFD for 3 months, Nrd1−/− mice showed a dramatic increase in BAT lipid accumulation similar to Nrd1+/+ mice (Supplementary Fig. 4). Nrd1−/− mice, however, were unable to increase their body temperature even when the fuel source for heat production was overloaded by HFD. These results further suggest the lowered set point of body temperature in Nrd1−/− mice.
NRDc regulates PGC-1α and its downstream target genes
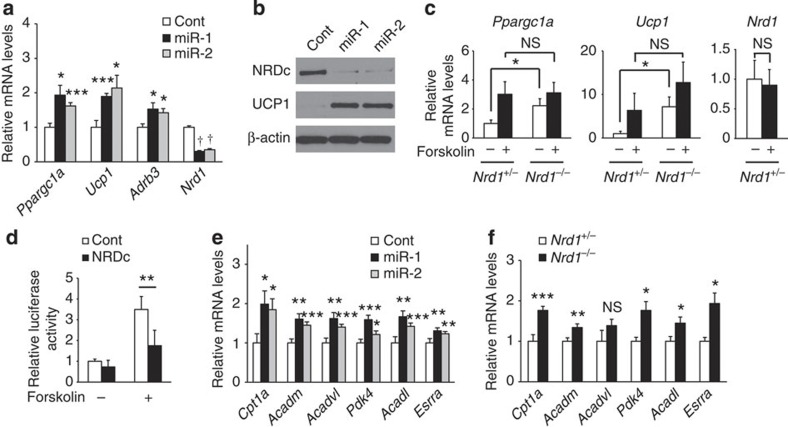
While in vivo analysis at the thermoneutrality suggested that BAT thermogenesis is primarily upregulated in Nrd1−/− mice, NRDc ablation in neural or hormonal systems might have indirectly affected thermogenesis. To assess the direct effects of NRDc on BAT thermogenesis, we measured the expression level of PGC-1α, UCP1 and β3-AR in brown adipocyte primary cultures treated with microRNA (miR) targeting NRDc. Similar to the expression pattern in Nrd1−/− BAT in vivo at room temperature, NRDc-knocked down cells showed increased mRNA levels of PGC-1α, UCP1 and β3-AR (Fig. 6a) and increased protein levels of UCP1 (Fig. 6b), indicating the cell autonomous repressive effect of NRDc on the expression of these thermogenic factors. Next, we examined the effect of forskolin, an activator of PKA, on ppargc1α and Ucp1 induction in immortalized brown adipocytes derived from Nrd1+/− and Nrd1−/− BAT. The basal mRNA levels of PGC-1α and UCP1 were significantly higher in Nrd1−/− cells compared with Nrd1+/− cells, whereas levels induced by forskolin were similar in Nrd1+/− and Nrd1−/− brown adipocytes (Fig. 6c). These results indicate that the regulation of ppargc1α and Ucp1 is impaired in Nrd1−/− BAT both in vivo and in vitro.
Figure 6. NRDc regulates transcription of PGC-1α and its downstream target genes.
(a) mRNA levels of thermogenic genes in primary brown adipocytes transduced with lentivirus vector expressing either a control miR or miRs targeted to Nrd1. n=6. (b) Protein levels of NRDc and UCP1 in primary brown adipocytes described in a. Full blots are presented in Supplementary Fig. 9. (c) mRNA levels of PGC-1α and UCP1 in mature immortalized brown adipocytes derived from Nrd1+/− and Nrd1−/− BAT in the presence or absence of forskolin treatment for 2 h. n=6. (d) Transcriptional activity of ppargc1α promoter-driven reporter gene in response to NRDc expression in the presence or absence of forskolin treatment in COS7 cells. n=5. (e) mRNA levels of PGC-1α target genes in primary brown adipocytes transduced with lentivirus vector as described in a. n=6. (f) mRNA levels of PGC-1α target genes in BAT of 12-week-old Nrd1+/+ and Nrd1−/− mice. n=6. All data represent means±s.e.m. *P<0.05, **P<0.005, ***P<0.001, NS, not significant (two-tailed Student’s t-test).
We next examined the direct effect of NRDc on the transcriptional activity of ppargc1α. Luciferase reporter assay using a 2-kb mouse ppargc1aα promoter30 showed that NRDc overexpression significantly inhibits the forskolin-induced transcriptional activity of ppargc1α, confirming that NRDc negatively regulates ppargc1α transcription (Fig. 6d). As PGC-1α is a transcriptional co-activator that functions as a master regulator of oxidative metabolism31, we next asked whether gene knockdown of NRDc affects target genes of PGC-1α other than Ucp1. mRNA levels of multiple genes involved in the mitochondrial oxidative metabolism were increased by gene knockdown of NRDc in a primary culture of brown adipocytes (Fig. 6e). Notably, the same set of oxidative genes was also upregulated in Nrd1−/− BAT in vivo (Fig. 6f). Results from these gain and loss of function studies establish that NRDc is an important upstream regulator of PGC-1α.
NRDc in the UCP1 enhancer negatively regulates PGC-1α activity
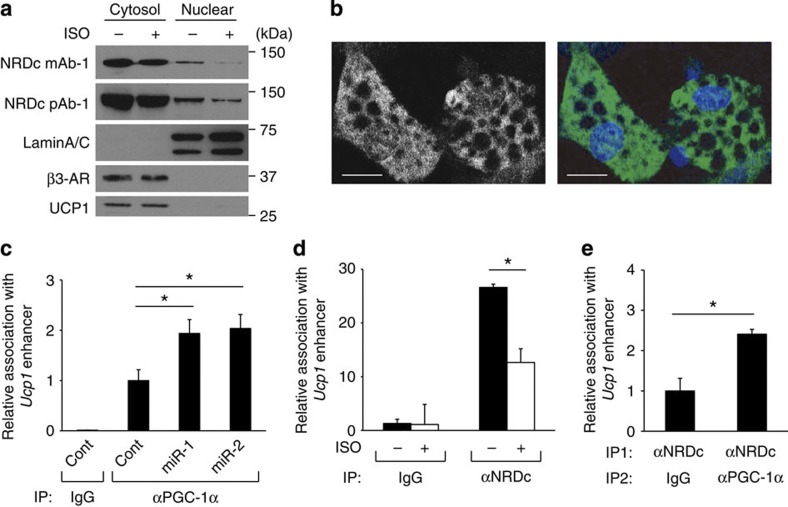
NRDc shuttles between the cytosol and nucleus26,27. Recent data have also demonstrated that NRDc is a dimethyl-H3K4-binding protein with transcriptional repressor activity28. Thus, we examined whether nuclear NRDc is directly involved in the transcriptional regulation of PGC-1α. We confirmed the nuclear expression of NRDc in brown adipocytes by western blotting of nuclear fractions (Fig. 7a) and immunocytochemical analysis (Fig. 7b). The specificity of the anti-mouse NRDc monoclonal antibody used in these experiments was validated using cells derived from Nrd1−/− mouse (Supplementary Fig. 5a). Nuclear expression of NRDc was also detected in BAT of wild-type mice (Supplementary Fig. 5b). Furthermore, nuclear NRDc was quickly reduced by isoproterenol treatment for 2 h (Fig. 7a). The decrease of nuclear NRDc probably occurred at the post-translational level, because mRNA level of NRDc was not affected either by forskolin treatment in brown adipocytes or by cold exposure in mice (Figs 6c and 3a). On the other hand, protein levels of β3-AR and UCP1 did not change by the treatment (Fig. 7a), although mRNA levels were upregulated by forskolin (Fig. 6c).
Figure 7. NRDc coexists with PGC-1α at the UCP1 enhancer.
(a) Western blot analysis of cytosolic and nuclear fraction of mature brown adipocytes treated for 2 h with or without isoproterenol (ISO) by indicated antibodies. Full blots are presented in Supplementary Fig. 9. (b) Mature brown adipocytes stained with anti-NRDc antibody and 4',6-diamidino-2-phenylindole were visualized by confocal microscopy. Scale bars, 20 μm. (c) ChIP with anti-PGC-1α antibody followed by qPCR demonstrates that Nrd1 knockdown in mature brown adipocytes increases PGC-1α recruitment to PPRE of the UCP1 enhancer. Results were normalized with input DNA, and are shown as the ratio to that in the control miR-treated cells (IP: αPGC-1α). n=5. (d) ChIP with anti-NRDc antibody followed by qPCR demonstrates that ISO treatment decreases NRDc binding to PPRE of the UCP1 enhancer. Results are shown as the fold induction relative to that in cells without ISO treatment (IP: Control IgG). n=4. (e) ChIP/re-ChIP analysis was performed with anti-NRDc and PGC-1α antibodies followed by qPCR targeting the PPRE of the UCP1 enhancer. n=3. All data represent means±s.e.m. *P<0.05, (two-tailed Student’s t-test).
The recruitment of PGC-1α to the peroxisome proliferator-activated receptor-responsive element (PPRE) in the promoter has been shown to be critical for transcriptional activation of Ucp1 (refs 32, 33, 34). Chromatin immunoprecipitation (ChIP) assay using anti-PGC-1α monoclonal antibodies showed that the association of PGC-1α with Ucp1 promoter is clearly increased by gene knockdown of NRDc in brown adipocytes (Fig. 7c). These results indicated that NRDc not only controls the transcription of PGC-1α, but also its recruitment to the promoter region of Ucp1. ChIP analysis also showed that NRDc binds to the PPRE in the Ucp1 promoter, which was significantly decreased by β-agonist treatment (Fig. 7d). These results demonstrated that the transcriptional activation of Ucp1 is accompanied with the removal of NRDc from its enhancer region. As ChIP analysis indicated that both NRDc and PGC-1α exist in the PPRE of Ucp1 promoter, we performed sequential ChIP–re-ChIP experiments to determine the in vivo co-localization of NRDc and PGC-1α. Sequential immunoprecipitation by antibodies against NRDc and PGC-1α demonstrated that the two factors co-localize in the PPRE of Ucp1 enhancer (Fig. 7e).
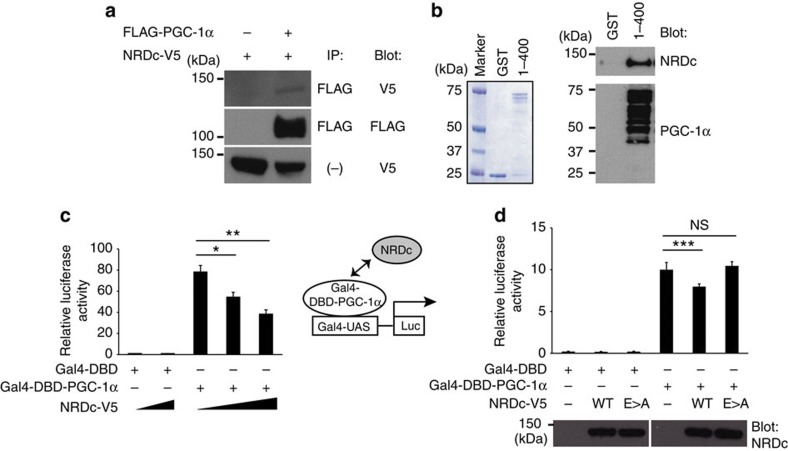
We next assessed whether NRDc and PGC-1α physically interact by two methods. First, immunoprecipitation with either anti-FLAG (FLAG-PGC-1α) or anti-V5 (NRDc-V5) demonstrated that NRDc and PGC-1α co-immunoprecipitate from co-transfected cell lysates (Fig. 8a; Supplementary Fig. 6). Second, pull-down assays demonstrated that recombinant NRDc binds to PGC-1α protein containing the first 400 amino acids (Fig. 8b). Finally, the effect of NRDc on the transcriptional co-activator function of PGC-1α was assessed by the reporter activity driven by Gal4-PGC-1α (ref. 5). NRDc repressed the transcriptional activity of Gal4-PGC-1α in a dose-dependent manner when introduced into COS7 cells with Gal4-PGC-1α (Fig. 8c). To assess whether enzymatic activity of NRDc is required for the repressor function, mouse embryonic fibroblast (MEF) cells isolated from Nrd1−/− mice were used for the reporter assay. Re-introduction of wild-type NRDc, but not an enzymatically inactive mutant, repressed Gal4-PGC-1α-induced transcriptional activity. Altogether, these findings establish that NRDc binds to PGC-1α and negatively regulates PGC-1α activity through its metalloendopeptidase activity.
Figure 8. NRDc binds to PGC-1α and negatively regulates its transcriptional activity.
(a) COS7 cells were transfected with the indicated expression vectors, followed by immunoprecipitation of the co-transfected cell lysates with anti-FLAG (PGC-1α) antibody. Twenty percent of input was blotted with anti-V5 (NRDc) in the bottom lane. Full blots are presented in Supplementary Fig. 9. (b) Pull-down assay using recombinant mouse NRDc and GST fusion proteins containing the first 400 amino acids of PGC-1α immobilized on glutathione-Sepharose beads. After the incubation, the beads were boiled and the eluted proteins were stained with Coomassie (left panel) and blotted with anti-NRDc (right upper panel) or anti-PGC-1α (right lower panel) antibody. Full blots are presented in Supplementary Fig. 9. (c) Luciferase reporter assay using COS7 cells transfected with Gal4-PGC-1α and different dose of NRDc. n=5. (d) Luciferase reporter assay using MEF−/− cells transfected with Gal4-PGC-1α and wild-type NRDc (WT) or enzymatically inactive NRDc (E>A). Protein expression of WT and E>A in cell lysates was confirmed by western blot with anti-NRDc antibody (bottom panel). Full blots are presented in Supplementary Fig. 9. n=5. All data represent means±s.e.m. *P<0.05, **P<0.01, ***P<0.001, NS, not significant (two-tailed Student’s t-test).
Discussion
In this study, we demonstrate that Nrd1−/− mice show hypothermia and severe cold intolerance. At room temperature (23 °C), Nrd1−/− mice showed increased energy expenditure. The histological features and upregulated expression of UCP1 in Nrd1−/− BAT indicated that Nrd1−/− BAT produces more heat at room temperature than Nrd1+/+ BAT. Enhanced energy expenditure of Nrd1−/− mice is, thus, due to increased thermogenesis and hyperactivity. Despite these features, Nrd1−/− mice were severely intolerant to cold. Several independent criteria suggested that this is due to impaired cold-induced BAT thermogenesis and poor thermal insulation in Nrd1−/− mice. We found that cold induction of PGC-1α and UCP1 was almost completely lost in Nrd1−/− BAT. Our data also indicated that skin cooling- and β3 agonist-induced heat production in BAT are markedly reduced in Nrd1−/− mice. Furthermore, Nrd1−/− mice showed severe and prolonged shivering even at 1.5 h after the initiation of cold exposure, which may be an attempt to compensate for the impaired BAT thermogenesis. These results suggested that thermogenesis in Nrd1−/− BAT reaches a plateau at room temperature and cannot be further induced by cold exposure. This interpretation was also supported by the observation that VO2 of Nrd1−/− mice at 23 °C was as high as that of Nrd1+/+ mice after β3 agonist injection. The metabolism of Nrd1−/− mice, however, was markedly reduced in the thermoneutral zone (30 °C). The difference of VO2 between Nrd1+/+ and Nrd1−/− mice was narrowed by raising the ambient temperature, although metabolism of Nrd1−/− mice was still significantly higher than that of Nrd1+/+ mice at 30 °C. These results indicate that BAT thermogenesis is primarily enhanced in the mutant mouse, and further enhanced to compensate for the poor insulation at room temperature. It is not clear at present why Nrd1−/− mice are poorly insulated because the appearance and microstructure of skin appear normal in Nrd1−/− mice (data not shown). Although Nrd1−/− mice respond normally to cold by shivering and increasing their heart rate, cold-induced cutaneous vasoconstriction and/or pilomotor reflex might be impaired, which are subjects of future studies.
Notably, in the thermoneutral zone, β3 agonist-induced thermogenesis was rescued in Nrd1−/− mice. These results indicate that Nrd1−/− mice can normally produce heat, at least, at the limited range of high ambient temperature around 30 °C. In spite of the normal thermogenic capacity, body temperature of Nrd1−/− mice stayed 1.5 °C lower than that of Nrd1+/+ mice at 30 °C, and even at 33 °C. These results indicate that hypothermia of Nrd1−/− mice is not due to the impaired thermogenesis, but probably due to the downregulation of the central set point of body temperature. In addition, body temperature of Nrd1−/− mice remained the same after high fat feeding, which induced a remarkable increase of BAT lipid accumulation, further supporting the lowered set point of body temperature in Nrd1−/− mice. As NRDc is expressed in neurons and regulates axonal maturation and myelination23, neuronal abnormalities of Nrd1−/− mice may contribute to the central setting of body temperature. To the best of our knowledge, among genetically modified mice, only thyroid hormone receptor α-deficient (TRα−/−) mice have been reported to have a lower set point of body temperature35. Given that PGC-1α was shown to interact with TRβ and activate its transcriptional activity5,36, NRDc might cooperate with TR for the central regulation of body temperature.
One of the most debated issues on the analysis of energy expenditure is how to normalize VO2 for differences in BW29. The BW of Nrd1−/− mice is approximately half as much as that of Nrd1+/+ mice owing to the severe growth retardation (Supplementary Fig. 7a). Since there is no complete method for comparing metabolism of animals with such different BW, we had to draw conclusion by unifying several results of different experimental approaches. Nrd1−/− mice showed hyperactivity, enhanced BAT thermogenesis and decreased body fat, whereas their food intake per BW was similar to that of Nrd1+/+ mice. Considering the energy balance, these results certainly indicate that energy expenditure is increased in Nrd1−/− mice. While VO2 per BW was reasonably higher in Nrd1−/− mice, VO2 per animal was consistently lower in Nrd1−/− mice relative to Nrd1+/+ mice owing to the small body size of Nrd1−/− mice (Supplementary Fig. 7b–d). These observations justify the usage of VO2 per BW for this specific case. Furthermore, VO2 per BW of Nrd1+/+ mice at 23 °C reached the very same level as that of Nrd1−/− mice after β3-agonist injection. VO2 per BW of Nrd1+/+ and Nrd1−/− mice at 30 °C was also similar after β3-agonist injection. Since the excess amount of β3 agonist should induce the maximum level of thermogenesis, these results indicated that Nrd1+/+ and Nrd1−/− mice have a similar maximum capacity of metabolism per BW. On the other hand, VO2 per animal in Nrd1−/− mice was lower than that in Nrd1+/+ mice both before and after β3-agonist injection because of the small body size (Supplementary Fig. 7e–g). These observations also support the use of VO2 per BW for the metabolism index.
In addition to the in vivo analysis demonstrating the primary effect of NRDc on BAT thermogenesis, our in vitro studies also established the cell autonomous effect of NRDc on the expression of thermogenic genes in the primary culture of BAT. NRDc regulates the PGC-1α/UCP1 pathway by two distinct mechanisms: regulation of ppargc1α transcription and PGC-1α recruitment to the promoter of Ucp1. Although a direct interaction of endogenous NRDc with endogenous PGC-1α remains to be demonstrated, our data suggest that NRDc represses PGC-1α activity and Ucp1 transcription by binding to PGC-1α. On activation, removal of NRDc from the complex derepresses the co-activator function of PGC-1α, allowing it to activate Ucp1 transcription (upper panel: Supplementary Fig. 8). In the absence of NRDc, the basal levels of PGC-1α and UCP1 activation are upregulated. However, further activation of PGC-1α and UCP1 by β-stimulant is impaired in the absence of NRDc (lower panel: Supplementary Fig. 8). How β-stimulant regulates the interaction of NRDc and PGC-1α remains to be determined.
The stability and activity of PGC-1α are known to be regulated by post-translational mechanisms, such as acetylation and phosphorylation37,38,39. Thus, removal of NRDc might facilitate PGC-1α modification by enzymes, such as kinases, followed by PGC-1α activation possibly through the recruitment of the histone acetyltransferase complex40. Alternatively or concurrently, NRDc may inhibit PGC1α activity by modulating the co-repressor function of the NCoR/SMRT complex. We found that the three subunits of NCoR/SMRT complex: SMRT, NCoR and HDAC3 are associated with NRDc28. Although the precise functions of NCoR and HDAC3 in BAT biology have yet to be fully defined, these observations suggest that NRDc may control thermogenesis by modulating the activity of the co-activator and co-repressor complex on the UCP1 promoter.
We identified NRDc as a cell surface-binding partner of HB-EGF19. Our subsequent studies demonstrated that NRDc enhances the ectodomain shedding of not only HB-EGF but also of amyloid precursor protein, tumour necrosis factor-α and neuregulin-1 (refs 20, 21, 22, 23). Critical roles of NRDc as an enhancer of shedding have been implicated in nervous system development23, Alzheimer’s disease24 and cancer biology25. While the metalloendopeptidase activity of NRDc is dispensable for the enhancement of ectodomain shedding20, NRDc was shown to be required for antigen processing and the generation of cytotoxic T-lymphocyte epitopes through its enzymatic activity17. On the other hand, NRDc has been identified as a novel histone-binding protein, specifically recognizing dimethyl-H3K4 (ref. 28). It remains to be determined whether the regulatory role of NRDc on PGC-1α, described in the present study, is related to the dimethyl-H3K4-binding capacity. Although we show here that the metalloendopeptidase activity of NRDc is required for its repressing effect on PGC-1α activity, there is no experimental evidence for the cleavage of PGC-1α by NRDc. The enzymatic activity might alter, for example, the nuclear uptake of NRDc. Future studies addressing the exact mechanism by which the enzymatic activity regulates transcription are needed. Given the observed localization-dependent multiple functions of NRDc, it will be important to clarify the trafficking mechanism of NRDc in future.
Methods
Animal experiments
Nrd1−/− mice (accession number CDB0466K, http://www.cdb.riken.jp/arg/mutant%20mice%20list.html) were generated by gene targeting in TT2 (ref. 41) embryonic stem cells. The targeting vector was designed to replace exon 1 with DT-A/lox71/LacZ-pA/frt/PGK-Neo/frt/loxP/pA cassette ( http://www.cdb.riken.jp/arg/cassette.html)23. Twelve-week-old Nrd1+/+ and Nrd1−/− mice (both male and female) were used unless otherwise indicated. All animal experiments were performed according to procedures approved by the Institute of Laboratory Animals, the Kyoto University. Mice were maintained on a diet of standard rodent chow or a high-fat/high-sucrose diet (Oriental yeast, F2HFHSD) in environmentally controlled rooms.
Body fat composition analysis
For CT analysis of body fat composition, Nrd1+/+ and Nrd1−/− mice were anaesthetized and scanned by LaTheta experimental animal CT system (LCT-100M, Aloka). Body fat mass was analysed quantitatively using LaTheta software (version 1.00) according to the manufacturer’s protocol42.
Respiratory gas analysis
Nrd1+/+ and Nrd1−/− mice were held individually in a chamber at 23 or 30 °C for a week so that they could attain a constant respiratory exchange ratio. Gas analysis was performed using an open-circuit metabolic gas analysis system connected directly to a mass spectrometer (Model Arco2000; ArcoSystem)43. The VO2 was calculated using the following equations: VO2=[(FEN2/FIN2) × FIO2−FEO2] × VT × 10 where FEN2 is the concentration of nitrogen in the exhaust air, FIN2 is the concentration of nitrogen in the room air, FEO2 is the concentration of oxygen in the exhaust air, FIO2 is the concentration of oxygen in the room air and VT is the air flow through the chamber corrected to standard temperature pressure dry. To measure β-agonist-induced thermogenesis, the β3-adrenergic agonist BRL-37344 (Sigma) was injected intraperitoneally at 5 mg kg−1, and VO2 was measured for another 300 min.
Cold tolerance test
For cold exposure, 12-week-old Nrd1+/+ and Nrd1−/− female mice and 3-week-old Nrd1+/+ female mice were individually housed in cages at 4 °C for 3 h. Core body temperature was monitored by a rectal temperature (Trec) probe (Physitemp). After cold exposure, BAT was dissected and collected immediately.
Skin cooling experiment
The procedures for rats described elsewhere44 were modified to mice. Female mice, 8–12-month old, were anaesthetized with intraperitoneal urethane (1.3 g kg−1) following introductory gas anaesthesia with 3% isoflurane. To monitor skin temperature, the trunk was shaved and a copper-constantan thermocouple was taped onto the abdominal skin. The trunk was placed on a plastic water jacket and the abdominal skin was cooled by perfusing the water jacket with ice-cold water and then rewarmed by switching to perfusion with warm water. Trec was monitored using a thermocouple inserted into the rectum. Trec was maintained by perfusing the water jacket with warm or cold water. TBAT was monitored with a needle-type thermocouple inserted into the interscapular BAT pad.
Cell culture and viral infection
COS7 cells were grown in DMEM (4.5 g l−1 glucose) supplemented with 10% fetal bovine serum (FBS) and antibiotics (culture medium). Brown preadipocytes were prepared from neonatal C57BL/6J mice as reported elsewhere45. In brief, interscapular BATs were minced and digested with 2 mg ml−1 collagenase for 1 h at 37 °C. Digested tissues were filtered through a 100-μm cell strainer to remove undigested tissues. The flow-through was then centrifuged at 800 g for 10 min to pellet the stromal vascular cells (preadipocytes). The cells were then resuspended and plated onto a culture dish. To knock down Nrd1 in brown preadipocytes, cells were infected with a lentivirus expressing miR-targeting Nrd1 (BLOCK-iT miR RNAi Select; Life Technologies). Brown preadipocytes were also established from neonatal Nrd1+/+, Nrd1+/− and Nrd1−/− mice. These preadipocytes were immortalized by infection of retrovirus expressing SV40 T antigen followed by selection with G418. Adipogenic differentiation was performed as described elsewhere46. In brief, cells were grown to confluence in DMEM (4.5 g l−1 glucose) supplemented with 10% FBS, antibiotics and 17 μM pantothenic acid, 33 μM biotin, 100 μM ascorbic acid, 1 μM octanoic acid and 50 nM 3,3′,5-triiodo-L-thyronine (adipocyte culture medium). Differentiation was induced by treating confluent cells for 48 h in adipocyte culture medium supplemented with 10 mg ml−1 insulin and 2.5 μM dexamethasone. After induction, the culture medium was changed to adipocyte culture medium supplemented only with 10 mg ml−1 insulin and cells were cultured for following 96 h. All experiments with the brown fat cells were performed after differentiation, unless otherwise indicated. MEF cells were isolated from Nrd1−/− embryos at embryonic day 14.5 (E14.5), and were maintained in DMEM containing 5% FBS, 100 U ml−1 of penicillin, 100 mg ml−1 of streptomycin and 2 mM L-glutamine. MEF were passed according to the 3T3 protocol and immortalized23.
Antibodies and immunoblot analysis
Rat anti-mouse NRDc monoclonal antibodies (clone #1 and #135) and rabbit anti-mouse NRDc polyclonal antibody were raised against recombinant mouse NRDc in our laboratory. Recombinant mouse NRDc (full length) was synthesized using silkworm protein expression system (Sysmex). Mouse anti-PGC-1α monoclonal antibodies (clone #3 and #16) were raised against recombinant mouse PGC-1α (1-400) fused with glutathione S-transferase (GST) in our laboratory. PGC-1α (1-400) fused with GST was prepared in BL21 strain and synthesized according to the manufacturer’s instruction (Amersham Biosciences). Other antibodies were from the following sources; UCP1 (Sigma, U6382), Lamin A/C (Santa Cruz, sc-6215), β3-adrenergic receptor (Chemicon, AB5124) and β-actin (Santa Cruz, sc47778). For immunoblot analysis, primary antibodies were used at the following dilutions: rat anti-mouse NRDc monoclonal antibody (clone #1) at 1:2,000; rabbit anti-mouse NRDc polyclonal antibody at 1:2,500; anti-PGC-1α monoclonal antibody (clone #16) at 1:2,000; UCP1 at 1:1,000; Lamin A/C at 1:1,000; β3-adrenergic receptor at 1:1,000; β-actin at 1:2,500. Preparation of total cell extract and immunoblot analysis were carried out as described previously20. In brief, cells were lysed in lysis buffer containing 10 mM Tris–HCl pH 7.4, 150 mM NaCl, 1% NP-40 and protease inhibitor cocktail (Roche). Cell lysates were separated by SDS–polyacrylamide gel electrophoresis and transferred to nitrocellulose filters. After blocking, filters were incubated with primary antibodies, followed by horseradish peroxidase-conjugated secondary antibodies. The immobilized peroxidase activity was detected with the enhanced chemiluminescence system (Amersham Biosciences). For isolation of nuclei, brown adipocytes were suspended in hypotonic buffer (10 mM HEPES (pH 7.9), 1.5 mM MgCl2, 10 mM KCl, 0.1 mM EDTA, 0.1% NP-40, 1 mM dithiothreitol, protease inhibitor cocktail (Complete Mini; Roche) and phosphatase inhibitor cocktail (Sigma)), followed by homogenization and centrifugation (2,500 r.p.m., 5 min, 4 °C). Extraction of nuclear fraction was carried out by resuspension of collected nuclei in high salt buffer (20 mM HEPES (pH 7.9), 1.5 mM MgCl2, 400 mM NaCl, 0.1 mM EDTA, 10% glycerol, 0.1% NP-40, 1 mM dithiothreitol, protease inhibitor cocktail (Complete Mini; Roche) and phosphatase inhibitor cocktail (Sigma), followed by centrifugation (20,400g, 5 min, 4 °C).
Immunostaining and oil red O staining
Immunocytochemistry was performed as described previously20. In brief, fixed differentiated brown adipocytes were immunostained with rat anti-mouse NRDc (clone #135 at 1:200 dilution) and Alexa Fluor 488-conjugated goat anti-rat IgG antibodies (A-11006 at 1:500 dilution), followed by the counterstaining with 4',6-diamidino-2-phenylindole. Stained cells were observed with a Zeiss LSM510 META laser scanning confocal microscope. Immunohistochemistry was performed with deparaffinized sections as described previously23. In brief, mice were anaesthetized and transcardially perfused with 4% paraformaldehyde (PFA) in PBS. Tissues were post-fixed in 4% PFA for 16 h and embedded in paraffin and sectioned at 6 μm thickness on a microtome. For oil red O staining, differentiated brown fat cells were fixed with 3.7% formaldehyde and stained with 0.3% (w/v) oil red O solution in 60% isopropyl alcohol.
Electron microscopy
Mice were anaesthetized and fixed via transcardial perfusion with 4% PFA and 2% glutaraldehyde in 0.1 M phosphate buffer. A block of ~2 mm3 of BAT was removed from interscapular area, incubated for 2 h at 4 °C in the same fixative and contrasted with 1% osmic acid in PBS. Tissues were dehydrated in an ethanol gradient from 50–100% and embedded in epon. Semi-thin sections (0.9 μm) were stained with toluidine blue for survey by light microscopy. Ultra-thin sections (80 nm) were cut and stained with 2% uranyl acetate (Watson’s modified method) and Reynolds lead citrate, and analysed with HITACHI H-7650 transmission electron microscope.
Quantitative real-time PCR analysis
Total RNA was purified from snap-frozen BAT and from differentiated brown adipocytes using Trizol reagent (Life Technologies) according to the manufacturer’s protocol. First-strand complementary DNA was synthesized from total RNA using the Transcriptor First Strand cDNA Synthesis Kit (Roche). Quantitative reverse transcription–PCR was carried out using the ABI Prism 7700 Sequence Detection System and SYBR Green MASTER (Roche) following the manufacturer’s directions (Applied Biosystems). The results were standardized for comparison by measuring levels of Actb mRNA in each sample. The primers used in these studies are shown in Supplementary Table 2.
Luciferase reporter assays
PGC-1α promoter 2 kb luciferase30 and Gal4-PGC-1α (ref. 5) are generous gifts from B.M. Spiegelman. (UAS)x3-TK/luciferase and Gal4-DBD are generous gifts from D. Moore. A cDNA encoding full length of mouse NRDc was cloned into pcDNA3.1/V5-His to generate pcDNA3.1-mNRDc-V5. A cDNA encoding an enzymatically inactive mutant of mouse NRDc was obtained by substituting the Glu237 codon (GAG) with an Ala codon (GCG) using the PCR technique (pcDNA3.1-mNRDc-E>A-V5). For luciferase assays, COS7 or MEF cells were transiently transfected with various combinations of expression and reporter plasmids using HilyMax (Dojindo). Forty eight hours after transfection, cells were lysed and analysed by using the Dual-Luciferase Reporter Assay Kit (Promega) according to the manufacturer’s protocol.
ChIP and Re-ChIP assay
Mature brown adipocytes were treated with or without 10 μM isoproterenol for 2 h and crosslinked with 1% formaldehyde in culture medium for 10 min. Cells were collected and resuspended in hypotonic solution, followed by isolation of nuclei, which were lysed in nuclear lysis buffer (50 mM Tris–Cl, pH 7.5, 150 mM NaCl, 0.1% SDS, 1% Triton X-100, 1 mM EDTA, 0.1% sodium deoxycholate and protease inhibitors). ChIP assays were performed using ChIP-IT Express Chromatin Immunoprecipitation Kits (Active Motif). In brief, chromatin-bound proteins were immunoprecipitated with antibodies against NRDc (rabbit polyclonal anti-mouse NRDc), PGC-1α (clone #3) or control IgG (Abcam). One-twentieth of the purified DNA after ChIP was subjected to qPCR analysis using following primers targeting the PPRE of the UCP1 enhancer: forward 5′-TCACCCTTGACCACACTGAA-3′, reverse 5′-GTGAGGCTGATATCCCCAGA-3′. Results were normalized with qPCR results using 1% of the total chromatin subject to ChIP. For re-ChIP assay, immunoprecipitates were eluted after the first ChIP. The eluate was diluted and subjected to the second ChIP.
GST pull-down assay
Plasmids, pGEX-PGC-1α (1-400), were a kind gift from B.M. Spiegelman40. GST fusion proteins were prepared in BL21 strain and purified on glutathione-Sepharose 4B (Amersham Biosciences). In pull-down assay, 15 μl of a 50% slurry of GST fusion proteins bound to the beads were incubated with 500 ng of recombinant mouse NRDc in 200 μl PBS containing 0.1 mg ml−1 BSA for overnight at 4 °C. The beads were washed and eluted proteins were analysed by SDS–polyacrylamide gel electrophoresis followed by Coomassie blue staining and immunoblotting.
Statistical analysis
All results are presented as the mean±s.e.m. Statistical analyses were done by two-tailed Student’s t-test for comparisons of two groups. Analysis of variance and appropriate post hoc analysis were used for comparisons of more than three groups.
Author contributions
Y.H., T.M and E.N. designed experiments and wrote the manuscript. Y.H., T.M., M.O., S.S., K.Nishi, J.S, P.C. and E.N. performed experiments. K.Nakamura performed skin cooling experiment and provided data for Fig. 3b and Supplementary Table 1. S.M., K.I. and T.F. performed respiratory gas analysis and provided data for Figs 1f, 4 and 5. T.Kimura and T.Kita supervised the work.
Additional information
How to cite this article: Hiraoka, Y. et al. Critical roles of nardilysin in the maintenance of body temperature homoeostasis. Nat. Commun. 5:3224 doi: 10.1038/ncomms4224 (2014).
Supplementary Material
Supplementary Figures 1-9 and Supplementary Tables 1-2
Nrd1-/- mouse under cold-exposure. This movie shows a Nrd1-/- mouse at 1.5 h after the initiation of cold-exposure
Nrd1+/+ mouse under cold-exposure. This movie shows a Nrd1+/+ mouse at 1.5 h after the initiation of cold-exposure
Acknowledgments
We are grateful to N. Nishimoto, K. Matsumoto, E. Kimura, Y. Abe for technical assistance, H. Ariyasu for help with mouse CT system, K. Takao and T. Miyakawa for help with measurement of physical activity, and B.M. Spiegelman and D. Moore for materials. We thank P.W. Park, H. Kitagawa, J. Wong and M. Klagsbrun for discussions and critical reading of the manuscript. This study was supported by Research Grants (23300117, 23117519, 23659154, 23122510, 24113713, 25670118 and 25113710) and a research programme of the Project for Development of Innovative Research on Cancer Therapeutics (P-Direct) from the Ministry of Education, Culture, Sports, Science and Technology of Japan. It was also supported by the Inamori Foundation, the Senri Life Science Foundation, the Takeda Science Foundation, the Ono Medical Research Foundation, the Kowa Life Science Foundation, the Mitsui Sumitomo Insurance Welfare Foundation, the Fujiwara Memorial Foundation and the Daiichi Sankyo Sponsored Research Program.
References
- Cannon B. & Nedergaard J. Brown adipose tissue: function and physiological significance. Physiol. Rev. 84, 277–359 (2004). [DOI] [PubMed] [Google Scholar]
- Enerback S. et al. Mice lacking mitochondrial uncoupling protein are cold-sensitive but not obese. Nature 387, 90–94 (1997). [DOI] [PubMed] [Google Scholar]
- Kozak L. P. & Anunciado-Koza R. UCP1: its involvement and utility in obesity. Int. J. Obes. (Lond.) 32, S32–S38 (2008). [DOI] [PMC free article] [PubMed] [Google Scholar]
- Lowell B. B. & Spiegelman B. M. Towards a molecular understanding of adaptive thermogenesis. Nature 404, 652–660 (2000). [DOI] [PubMed] [Google Scholar]
- Puigserver P. et al. A cold-inducible coactivator of nuclear receptors linked to adaptive thermogenesis. Cell 92, 829–839 (1998). [DOI] [PubMed] [Google Scholar]
- Lin J. et al. Defects in adaptive energy metabolism with CNS-linked hyperactivity in PGC-1alpha null mice. Cell 119, 121–135 (2004). [DOI] [PubMed] [Google Scholar]
- Thomas S. A. & Palmiter R. D. Thermoregulatory and metabolic phenotypes of mice lacking noradrenaline and adrenaline. Nature 387, 94–97 (1997). [DOI] [PubMed] [Google Scholar]
- Bachman E. S. et al. BetaAR signaling required for diet-induced thermogenesis and obesity resistance. Science 297, 843–845 (2002). [DOI] [PubMed] [Google Scholar]
- Tseng Y. H., Cypess A. M. & Kahn C. R. Cellular bioenergetics as a target for obesity therapy. Nat. Rev. Drug Discov. 9, 465–482 (2010). [DOI] [PMC free article] [PubMed] [Google Scholar]
- van Marken Lichtenbelt W. D. et al. Cold-activated brown adipose tissue in healthy men. New Engl. J. Med. 360, 1500–1508 (2009). [DOI] [PubMed] [Google Scholar]
- Cypess A. M. et al. Identification and importance of brown adipose tissue in adult humans. New Engl. J. Med. 360, 1509–1517 (2009). [DOI] [PMC free article] [PubMed] [Google Scholar]
- Virtanen K. A. et al. Functional brown adipose tissue in healthy adults. New Engl. J. Med. 360, 1518–1525 (2009). [DOI] [PubMed] [Google Scholar]
- Saito M. et al. High incidence of metabolically active brown adipose tissue in healthy adult humans: effects of cold exposure and adiposity. Diabetes 58, 1526–1531 (2009). [DOI] [PMC free article] [PubMed] [Google Scholar]
- Feldmann HM, Golozoubova V, Cannon B & Nedergaard J. UCP1 ablation induces obesity and abolishes diet-induced thermogenesis in mice exempt from thermal stress by living at thermoneutrality. Cell Metab. 9, 203–209 (2009). [DOI] [PubMed] [Google Scholar]
- Chesneau V. et al. Isolation and characterization of a dibasic selective metalloendopeptidase from rat testes that cleaves at the amino terminus of arginine residues. J. Biol. Chem. 269, 2056–2061 (1994). [PubMed] [Google Scholar]
- Pierotti A. R. et al. N-arginine dibasic convertase, a metalloendopeptidase as a prototype of a class of processing enzymes. Proc. Natl Acad. Sci. USA 91, 6078–6082 (1994). [DOI] [PMC free article] [PubMed] [Google Scholar]
- Kessler J. H. et al. Antigen processing by nardilysin and thimet oligopeptidase generates cytotoxic T cell epitopes. Nat. Immunol. 12, 45–53 (2011). [DOI] [PubMed] [Google Scholar]
- Hospital V. et al. N-arginine dibasic convertase (nardilysin) isoforms are soluble dibasic-specific metalloendopeptidases that localize in the cytoplasm and at the cell surface. Biochem. J. 349, 587–597 (2000). [DOI] [PMC free article] [PubMed] [Google Scholar]
- Nishi E., Prat A., Hospital V., Elenius K. & Klagsbrun M. N-arginine dibasic convertase is a specific receptor for heparin-binding EGF-like growth factor that mediates cell migration. EMBO J. 20, 3342–3350 (2001). [DOI] [PMC free article] [PubMed] [Google Scholar]
- Nishi E., Hiraoka Y., Yoshida K., Okawa K. & Kita T. Nardilysin enhances ectodomain shedding of heparin-binding epidermal growth factor-like growth factor through activation of tumor necrosis factor-alpha-converting enzyme. J. Biol. Chem. 281, 31164–31172 (2006). [DOI] [PubMed] [Google Scholar]
- Hiraoka Y. et al. Enhancement of alpha-secretase cleavage of amyloid precursor protein by a metalloendopeptidase nardilysin. J. Neurochem. 102, 1595–1605 (2007). [DOI] [PubMed] [Google Scholar]
- Hiraoka Y. et al. Ectodomain shedding of TNF-alpha is enhanced by nardilysin via activation of ADAM proteases. Biochem. Biophys. Res. Commun. 370, 154–158 (2008). [DOI] [PubMed] [Google Scholar]
- Ohno M. et al. Nardilysin regulates axonal maturation and myelination in the central and peripheral nervous system. Nat. Neurosci. 12, 1506–1513 (2009). [DOI] [PubMed] [Google Scholar]
- Ohno M. et al. Nardilysin prevents amyloid plaque formation by enhancing α-secretase activity in an Alzheimer's disease mouse model. Neurobiol. Aging 35, 213–222 (2014). [DOI] [PubMed] [Google Scholar]
- Kanda K. et al. Nardilysin and ADAM proteases promote gastric cancer cell growth by activating intrinsic cytokine signaling via enhanced ectodomain shedding of TNF-alpha. EMBO Mol. Med. 5, 396–411 (2012). [DOI] [PMC free article] [PubMed] [Google Scholar]
- Ma Z., Chow K. M., Yao J. & Hersh L. B. Nuclear shuttling of the peptidase nardilysin. Arch. Biochem. Biophys. 422, 153–160 (2004). [DOI] [PubMed] [Google Scholar]
- Ma Z., Wang X., Hockman S., Snow E. C. & Hersh L. B. Subcellular localization of nardilysin during mouse oocyte maturation. Arch. Biochem. Biophys. 434, 187–194 (2005). [DOI] [PubMed] [Google Scholar]
- Li J. et al. Identification and characteriation of nardilysin as a novel dimethyl H3K4 binding protein involved in transcriptional regulation. J. Biol. Chem. 287, 10089–10098 (2012). [DOI] [PMC free article] [PubMed] [Google Scholar]
- Cannon B. & Nedergaard J. Nonshivering thermogenesis and its adequate measurement in metabolic studies. J. Exp. Biol. 214, 242–253 (2011). [DOI] [PubMed] [Google Scholar]
- Handschin C., Rhee J., Lin J., Tarr P. T. & Spiegelman B. M. An autoregulatory loop controls peroxisome proliferator-activated receptor gamma coactivator 1alpha expression in muscle. Proc. Natl Acad. Sci. USA 100, 7111–7116 (2003). [DOI] [PMC free article] [PubMed] [Google Scholar]
- Handschin C. & Spiegelman B. M. Peroxisome proliferator-activated receptor gamma coactivator 1 coactivators, energy homeostasis, and metabolism. Endocr. Rev. 27, 728–735 (2006). [DOI] [PubMed] [Google Scholar]
- Sears I. B., MacGinnitie M. A., Kovacs L. G. & Graves R. A. Differentiation-dependent expression of the brown adipocyte uncoupling protein gene: regulation by peroxisome proliferator-activated receptor gamma. Mol. Cell. Biol. 16, 3410–3419 (1996). [DOI] [PMC free article] [PubMed] [Google Scholar]
- Pan D., Fujimoto M., Lopes A. & Wang Y. X. Twist-1 is a PPARdelta-inducible, negative-feedback regulator of PGC-1alpha in brown fat metabolism. Cell 137, 73–86 (2009). [DOI] [PMC free article] [PubMed] [Google Scholar]
- Tateishi K., Okada Y., Kallin E. M. & Zhang Y. Role of Jhdm2a in regulating metabolic gene expression and obesity resistance. Nature 458, 757–761 (2009). [DOI] [PMC free article] [PubMed] [Google Scholar]
- Golozoubova V. et al. Depressed thermogenesis but competent brown adipose tissue recruitment in mice devoid of all hormone-binding thyroid hormone receptors. Mol. Endocrinol. 18, 384–401 (2004). [DOI] [PubMed] [Google Scholar]
- Wu Y., Delerive P., Chin W. W. & Burris T. P. Requirement of helix 1 and the AF-2 domain of the thyroid hormone receptor for coactivation by PGC-1. J. Biol. Chem. 277, 8898–8905 (2002). [DOI] [PubMed] [Google Scholar]
- Lerin C. et al. GCN5 acetyltransferase complex controls glucose metabolism through transcriptional repression of PGC-1alpha. Cell Metab. 3, 429–438 (2006). [DOI] [PubMed] [Google Scholar]
- Rodgers J. T. et al. Nutrient control of glucose homeostasis through a complex of PGC-1alpha and SIRT1. Nature 434, 113–118 (2005). [DOI] [PubMed] [Google Scholar]
- Jager S., Handschin C., St-Pierre J. & Spiegelman B. M. AMP-activated protein kinase (AMPK) action in skeletal muscle via direct phosphorylation of PGC-1alpha. Proc. Natl Acad. Sci. USA 104, 12017–12022 (2007). [DOI] [PMC free article] [PubMed] [Google Scholar]
- Puigserver P. et al. Activation of PPARgamma coactivator-1 through transcription factor docking. Science 286, 1368–1371 (1999). [DOI] [PubMed] [Google Scholar]
- Yagi T. et al. A novel ES cell line, TT2, with high germline-differentiating potency. Anal. Biochem. 214, 70–76 (1993). [DOI] [PubMed] [Google Scholar]
- Sugimoto M. et al. Mulberry leaf ameliorates the expression profile of adipocytokines by inhibiting oxidative stress in white adipose tissue in db/db mice. Atherosclerosis 204, 388–394 (2009). [DOI] [PubMed] [Google Scholar]
- Ishihara K., Oyaizu S., Onuki K., Lim K. & Fushiki T. Chronic (-)-hydroxycitrate administration spares carbohydrate utilization and promotes lipid oxidation during exercise in mice. J. Nutr. 130, 2990–2995 (2000). [DOI] [PubMed] [Google Scholar]
- Nakamura K. & Morrison S. F. A thermosensory pathway that controls body temperature. Nat. Neurosci. 11, 62–71 (2008). [DOI] [PMC free article] [PubMed] [Google Scholar]
- Bronnikov G., Houstek J. & Nedergaard J. Beta-adrenergic, cAMP-mediated stimulation of proliferation of brown fat cells in primary culture. Mediation via beta 1 but not via beta 3 adrenoceptors. J. Biol. Chem. 267, 2006–2013 (1992). [PubMed] [Google Scholar]
- Ross S. R. et al. Hibernoma formation in transgenic mice and isolation of a brown adipocyte cell line expressing the uncoupling protein gene. Proc. Natl Acad. Sci. USA 89, 7561–7565 (1992). [DOI] [PMC free article] [PubMed] [Google Scholar]
Associated Data
This section collects any data citations, data availability statements, or supplementary materials included in this article.
Supplementary Materials
Supplementary Figures 1-9 and Supplementary Tables 1-2
Nrd1-/- mouse under cold-exposure. This movie shows a Nrd1-/- mouse at 1.5 h after the initiation of cold-exposure
Nrd1+/+ mouse under cold-exposure. This movie shows a Nrd1+/+ mouse at 1.5 h after the initiation of cold-exposure


