

Abstract
To colonize surfaces, the bacterium Caulobacter crescentus employs a polar polysaccharide, the holdfast, located at the end of a thin, long stalk protruding from the cell body. Unlike many other bacteria which adhere through an extended extracellular polymeric network, the holdfast footprint area is tens of thousands times smaller than that of the total bacterium cross-sectional surface, making for some very demanding adhesion requirements. At present, the mechanism of holdfast adhesion remains poorly understood. We explore it here along three lines of investigation: a) the impact of environmental conditions on holdfast binding affinity, b) adhesion kinetics by dynamic force spectroscopy, and c) kinetic modeling of the attachment process to interpret the observed time-dependence of the adhesion force at short and long time scales. A picture emerged in which discrete molecular units called adhesins are responsible for initial holdfast adhesion, by acting in a cooperative manner.
Keywords: Caulobacter crescentus, bacterial bioadhesive, atomic force microscopy, dynamic force spectrometry, adhesion kinetics
INTRODUCTION
Biological adhesives found in the bacterial world are an abundant, yet mostly untapped, source of adhesives with varied composition and properties. They hold promise for industrial and medical applications, offering impressive performance in their natural context: they enable attachment to a broad variety of surfaces, share desirable properties, such as sustainability, biodegradability and biocompatibily, and yield a much-reduced impact on the environment compared to their synthetic counterparts 1.
Most bacteria are found attached to surfaces where they form large groups of cells, called biofilms. A critical step in biofilm formation is the initial single cell attachment, which proceeds from a reversible stage, often mediated by proteinaceous appendages like flagella and pili, to an irreversible stage mediated by polysaccharide adhesins 2,3. After biofilm maturation, a dense extracellular matrix mainly composed of polysaccharides usually encloses the cells and helps to maintain adhesive properties in a broad range of aqueous environments and on a variety of surfaces 4. Earlier studies attempted to describe the viscoelastic properties of biofilms in terms of phenomenological parameters 5,6 and have shed some light on the mechanisms that mediate the transition from the reversible to the irreversible stage of bacterial adhesion 7–11. Other studies have used flow displacement systems 12, bacterial cells immobilized on atomic force microscopy (AFM) tips 13, or quartz crystal microbalances 14 to study the development of bacterial adhesion forces on different surfaces. Additionally, single-molecule force microscopy has enabled direct measurement of the elasticity of single biomacromolecules, including bacterial polysaccharides involved in adhesion 15,16. Most of these studies were done on bacterial species which having a mixture of polysaccharides of different composition and structure and appendages such as pili and flagella distributed around the cell surface. However, a few bacterial species of the Alphaproteobacteria group adhere to surfaces using a discrete, microscopic patch of polysaccharide-based adhesive 17,18.
Such localized anchor points have received much less attention in the past probably mainly due to the difficulty of adhesion measurements at sub-micron scale. Nevertheless, their study is timely because it is reasonable to believe that they must be coping with mechanical stress differently than extended adhesive films. In this work, we quantitatively explore the physiochemical properties responsible for adhesion in a member of this group, Caulobacter crescentus.
C. crescentus synthesizes its holdfast adhesin during the differentiation of the motile swarmer cell into a sessile stalked cell (Figure 1A). The holdfast patch (~100 nm diameter) responsible for permanent adhesion to surfaces is found at the tip of a thin cylindrical stalk-like extension (~ 1 μm long) of the cell envelope 19–23. The holdfast has mechanical properties characteristic of an elastic gel 24 and outperforms the strongest biological and commercial glues, with a force of adhesion exceeding 68 N/mm2, sufficient to resist to a variety of stresses including fluid flow and capillary forces 25. The holdfast elastic modulus was estimated at approximately 2.5 × 10⁴ Pa 26, comparable to other biological gels such as collagen or gelatin matrices 26,27.
Figure 1.

(A) Caulobacter crescentus cell cycle. This dimorphic bacterium starts its life as a motile swarmer cell with a single polar flagellum and pili at the same pole. The swarmer cell is unable to initiate DNA replication and eventually differentiates into a replication-competent stalked cell by shedding its flagellum, retracting pili, and synthesizing the holdfast followed by a stalk at the same pole. The stalked cell initiates DNA replication, and divides to give rise to a new swarmer cell. (B) AFM picture of a C. crescentus stalked cell. (C) AFM picture of shed holdfasts attached to a mica surface.
Specific binding of wheat germ agglutinin lectin to the holdfast and its sensitivity to lysozyme indicate that holdfast contains ß-1,4 N-acetylglucosamine polymers 24,28. However, its detailed composition and structure remain largely unknown, due to its strong adhesiveness and inherent insolubility. While oligomers of ß-1,4 N-acetylglucosamine confer gel-like properties on holdfasts 24 and may play a major role in holdfast elastic properties, available data strongly suggest the existence of additional adhesive components in the holdfast 24,28.
In this study, we report the first analysis of the development of adhesive forces in a microscopic holdfast anchor through measurements of the time-dependence of holdfast rupture forces on a variety of substrates. Having access to a Caulobacter mutant which sheds holdfast free of cellular components 29, we were able to determine that holdfast morphology is dependent on the surface to which it is bound and that holdfast affinity for a substrate is modulated by hydrophobic interactions and depends on buffer ionic strength and pH. In addition, we evaluated the maximum tensile strength of pure holdfast, free of interference from cellular components, in relation to the nature of the substrate to which it was attached. To this end, we employed Dynamic Force Spectroscopy (DFS) to measure rupture forces between the holdfast and the substrate. This method provides both the spatial and temporal resolution required for bridging the molecular and mesoscopic scales at which crucial phenomena take place. We found that holdfast adhesion is strongly time-dependent, involving transformations on multiple time scales. We further demonstrate that the observed time-dependence is well described by a kinetic rate model of adhesin-surface interaction coupled to diffusion of molecular adhesins within the bulk of the holdfast. Our DFS results also show that the initial adhesion of holdfast to surfaces is dependent on the substrate hydrophobicity and roughness. Finally, our data suggest that the GlcNac polymers present in the holdfast and the holdfast anchor proteins are not likely to be major players in the adhesion mechanism, and that cooperative contributions from discrete adhesive units within the holdfast are dominantly responsible for initial adhesion. These findings provide a framework for future molecular mechanistic studies and for comparison of bacterial holdfast properties with the more extensively studied case of adhesive extracellular matrices.
EXPERIMENTAL SECTION
Bacterial strains and growth conditions
The main strain used in this study was Caulobacter crescentus CB15 ΔhfaB (YB4251) 29, a mutant strain from C. crescentus CB15 wild-type (YB135). This mutant has a clean deletion of the hfaB gene and therefore does not synthesize HfaB, one of the holdfast anchor proteins. This strain still produces a holdfast, but is unable to anchor it to the cell envelope. As a consequence, the newly synthesized holdfast is shed in the culture medium and on surfaces 29.
Another C. crescentus CB15 mutant, ΔhfsH (YB2198), was used to study the role of deacethylation in adhesion efficiency. Indeed, this mutant is lacking the gene hfsH, encoding a deacetylase that affects both cohesive and adhesive properties of the holdfast 30. C. crescentus ΔhfsH produces smaller holdfasts compared to the wild-type and the ΔhfaB strains. These fully acetylated holdfasts are not anchored properly to the cell envelope and are shed in the medium 30.
C. crescentus strains were grown at 30°C in minimal M2 medium supplemented with 0.2% glucose (M2G) 31 or in low phosphate HIGG medium 32 containing 120 μM phosphate (for stalk sample preparations).
Escherichia coli TRMG (MG1655 csrA::kan), a strain that overproduces the polysaccharide PGA (poly-ß-1,6- N-acetylglucosamine polymer) and releases it in the culture medium 2 was grown in LB medium at 37°C with constant shaking (150 rpm), to maximize PGA production and release 2.
PGA purification
PGA was purified from E. coli TRMG stationary phase cultures (24 h at 37°C), as described previously 2. Cells were harvested by centrifugation and the supernatant (8 ml) was concentrated using MWCO 3,000 Centricon units (Millipore) to 500 μl final.
Glass treatment
A hydrophobic treatment was performed on 12 mm glass coverslips (#26020, Ted Pella Inc.). Coverslips were incubated with a 1:1 3-trimethoxysilyl propyl methacrylate (3-TMSM, Acros Organics): anhydrous dimethylformamide (Acros Organics) mixture for 2 h, rinsed twice using 100% acetone and then air-dried. Hydrophobic coverslips were used within a day of treatment.
Purified holdfast affinity assay
Purified holdfast affinity assays were performed as described previously 33, with few modifications. C. crescentus ΔhfaB cells were grown to late exponential phase (OD600 of 0.6 – 0.8) and cells were pelleted by centrifugation (30 min at 4,000 g). The supernatant contains free holdfasts shed by the cells. 100 μl of purified holdfasts in solution were spotted on a 12 mm borosilicate glass coverslip (#26020, Ted Pella Inc.), previously glued to a microscope glass slide, and incubated for 4 h at room temperature in a saturated humidity chamber. After incubation, the slides were rinsed with dH2O to remove unbound material. Holdfasts were visualized by labeling using AlexaFluor 488 (AF488) conjugated Wheat Germ Agglutinin (WGA) (Molecular Probes). WGA binds specifically to the N-acetylglucosamine residues of the holdfast 28. AF488-labeled WGA (50 μl at 5 μg/ml) was added to the rinsed coverslips and incubated in the dark for 20 min at room temperature. Slides were then rinsed with dH2O, toped with a large glass coverslip (24 × 50 mm) and sealed with nail polish. Holdfast attachment to the coverslips was visualized by epifluorescence microscopy using a Nikon Eclipse 90i and a Photometrics Cascade 1K EMCCD camera. Fluorescent holdfasts were quantified using ImageJ analysis software 34: microscopy 16-bit pictures were manually thresholded using the B/W default setting and fluorescent particles were automatically analyzed with the ImageJ built in function.
pH sensitivity assays
Purified holdfast binding assays under different pH conditions were performed in 100 mM citrate-phosphate or sodium-acetate buffers (from pH 2.6 to pH 6), 100 mM phosphate or Tris buffers (from pH 6 to pH 8) and N-cyclohexyl-3-aminopropanesulfonic acid (CAPS) buffers (from pH 8 to pH 12). 50 μl of purified holdfasts in suspension were mixed with 50 μl 100 mM buffer and incubated on glass coverslips for 4 h at room temperature in a humid chamber, as described above. Bound holdfast labeling, imaging and quantification were performed as described above. PGA binding assays were run under the same conditions, but incubated for 24 h instead of 4 h, to maximize binding.
To determine if the low binding efficiency of holdfasts at low pH (< 6) or high pH (> 8) was due to a physical or a chemical modification of the holdfasts, 50 μl purified holdfasts were incubated in suspension with 25 μl of 100 mM buffers at different pH for 2 h at room temperature (1st incubation). 50 μl of new buffer were added to the samples to modify their pH, and the samples were allowed to bind to coverslips for 2 h, as described above (2nd incubation). Bound holdfast labeling, imaging and quantification were performed as described above.
Sample preparation for Atomic Force Microscopy analysis
Early exponential phase grown C. crescentus ΔhfaB cells (OD600 of 0.3 – 0.4) were diluted to an OD of 0.1 in M2G and spotted on a 10 × 10 mm piece of freshly cleaved mica. Samples were incubated at room temperature in a humid chamber. After overnight incubation, the mica was thoroughly rinsed with sterile dH2O to remove all cells and debris. A 100 μl aliquot of sterile dH2O was placed on the surface for DFS experiments.
Typically, an AFM image was taken from the holdfast-covered mica surface prior to the experiment. To cover the AFM silicon nitrite tip with holdfast, the tip was placed in contact with a holdfast present on the mica surface for 90 s. Using a trigger force of 5 nN insured maximal tip penetration (down to the substrate). This procedure was repeated several times, until a part of the holdfast present on the mica had been transferred to the AFM tip. A second AFM image was then taken to ensure that part of the holdfast was missing from the surface and was therefore attached to the tip. To confirm holdfast attachment to the tip, the holdfast-loaded tip was moved above a clean mica surface while maintained in dH2O, and a force-displacement curve was recorded to ensure a significant force due to the holdfast coating the tip.
The same procedure was followed to coat the AFM tip using purified PGA previously immobilized on a clean mica surface.
Scanning Electron Microscopy (SEM)
The typical area occupied by and the thickness of holdfast attached to the AFM tip were determined using a FEG environmental SEM (Quanta 600F, FEI). Samples were first fixed with 2.5% (v/v) electron microscopy grade glutaraldehyde (Ted Pella, Inc.) in 10 mM phosphate buffer pH 7 for 1.5 h. The samples were then treated with a series of ethanol dehydration steps (30%, 50%, 70%, 90% and 100% (v/v), 15 minutes each) and dried using a critical point dryer (Blazers CPD 030). Uncoated samples were affixed to a metal stub with double-stick conductive carbon tape (Electron Microscopy Sciences) and then visualized under secondary electron mode.
AFM analysis
AFM AC mode images and force-displacement curves were obtained using a Cypher AFM (Asylum Research). Measurements were performed in sterile dH2O at room temperature using gold-coated silicon nitride Biolever cantilevers (Frequency f0 = 13 kHz, spring constant k = 0.006 N/m, Olympus Inc.). Spring constants were measured from the thermal noise spectrum of the cantilevers. Force measurements were performed using tips previously coated with holdfasts as described above, using a trigger force of 500 pN if not stated otherwise.
RESULTS AND DISCUSSION
Holdfast on polar and non-polar surfaces
Previous biophysical studies on holdfast adhesion have been performed using only one type of surface: borosilicate glass 24,25. To determine if capillary forces may influence significantly initial adhesion, we investigated the morphology of holdfasts bound to two surfaces of different polar character: hydrophilic mica and hydrophobic highly-ordered pyrolitic graphite. We used AFM to image holdfasts at 16 h after attachment (Figure 2A). Height, diameter and contact angles were thus determined for ~200 particles (Figure 2). Holdfast height varied from 5 to 100 nm on both surfaces, with a few holdfasts reaching up to 160 nm (Figure 2B). The average height was 30.6 ± 2.4 nm and 21.5 ± 0.9 on mica and graphite, respectively. The average holdfast footprint diameter was also substrate dependent (Figure 2C). Holdfasts attached to mica had diameters from 30 to 280 nm, with an average of 90.2 ± 2.7 nm, while holdfasts attached to graphite ranged from 45 to 440 nm, with an average of 119.2 ± 4.1 nm. The average contact angles were 52.6 ± 1.3 ° and 38.9 ± 2 ° on mica and graphite, respectively (Figure 2 D–F). Since contact angles reflect the relative strength of holdfast-liquid, substrate-liquid, and holdfast-substrate interaction, results in Figure 2 suggest that the graphite-holdfast interaction is stronger than mica-holdfast interaction. Note that both graphite and mica substrate preparations yield atomically-flat surfaces, thus minimizing a possible role played by roughness.
Figure 2.
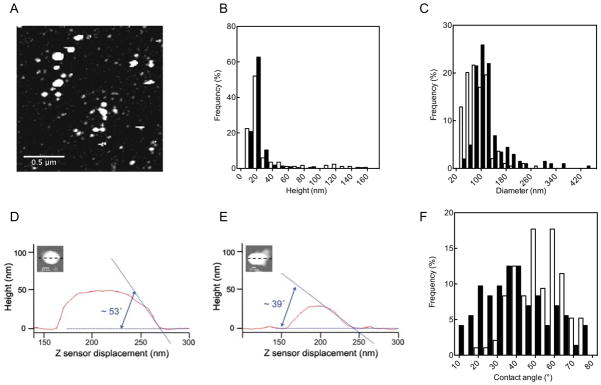
(A–C) Holdfast size distribution. (A) AFM picture of purified holdfasts attached on a mica surface. Height (B) and diameter (C) distribution of holdfasts. on mica (white bars) and graphite (black bars). n = 191 and 212 for mica and graphite samples respectively. (D–F) Contact angle of holdfast on mica (D) and graphite (E). (F) Relative contact angle distributions on mica (white bars) and graphite (black bars) as described in the experimental section. n = 96 for mica and 72 for graphite.
Another substrate of interest is glass. Having established that the holdfast contact angle showed marked differences between graphite and mica, we measured the binding affinity of holdfasts to clean and non-polar adsorbate (3-TMSM) coated glass surfaces. In these experiments, purified holdfasts in suspension were allowed to bind to the two types of surfaces, and the amount of surface-deposited holdfasts were quantified using fluorescently-labeled wheat germ agglutinin (WGA), a lectin specific for N-acetylglucosamine residues present in the holdfast 28 (Figure 3A). Figure 3C shows that the binding affinity to hydrophobic 3-TMSM-treated glass seems somewhat smaller (~ 55 %) than that of clean glass, which seems to disagree with the finding above that attractive capillary forces are stronger on hydrophobic substrates. One explanation that would reconcile these apparently contradictory results is the possibility of a time-dependent curing process, which occurs at slower time scales than those characteristic of capillary interactions. Indeed, we will discuss later in the paper the independent evidence for such processes.
Figure 3.
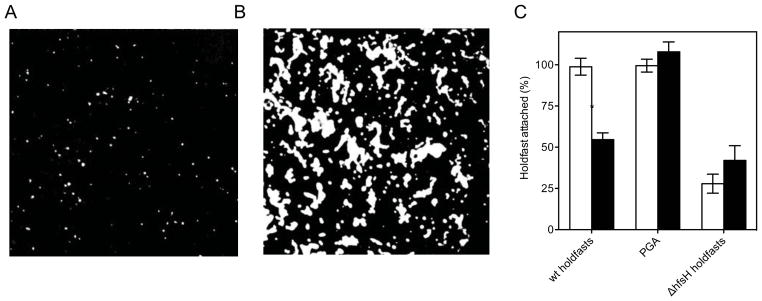
B/W thresholded image from AF488-WGA labeled WT holdfasts (A), and PGA (B). (C) Surface attachment to clean (white bars) and 3-TMSM treated (black bars) glass. Results are expressed as percent of WT holdfasts attached to clean glass (for all holdfasts experiments) or as percent of surface coverage of PGA on clean glass. The bars represent the average of at least 10 fields of view for four indepedent replicates and the error bars represent the standard error.
To determine if the only identified component, N-acetylglucosamine plays a role in the dependence of adhesion efficiency on substrate polarity, we measured the affinity of PGA (a poly-ß-1,6- N-acetylglucosamine polymer purified from E. coli TRMG 2) for the two types of glass substrates (Figure 3B). Due to very low binding affinity, PGA samples had to be incubated for 16 h to provide measurable coatings (instead of 4 h for holdfast samples). PGA affinity assays exhibited no significant variation as a function of substrate (Figure 3C). These results suggest that the holdfast adhesion mechanism is not dominated by the N-acetylglucosamine adhesive properties and is likely to involve additional components. This hypothesis is also supported by the fact that we had to incubate the PGA samples four times longer than the holdfast ones to obtain measurable coverages.
Nevertheless, as we are showing in the following, N-acetylglucosamine plays an important albeit indirect role. Thus, a recent study showed that, in C. crescentus, a mutation in the hfsH gene encoding a deacetylase acting on the holdfast, affects both cohesive and adhesive properties of the holdfast 30. Partial deacetylation of N-acetylglucosamine in holdfast should leave free amine residues in place of acetyl groups, thereby changing the charge of the polysaccharide. Biologically, the free amine group could be useful to covalently link an adhesin or for crosslinking. Indeed, binding affinity of holdfasts produced by the ΔhfsH deacetylase mutant is drastically decreased with around 30–40% of holdfasts attached compared to deacetylated ΔhfaB holdfasts (Figure 3C). This result is in agreement with previous studies 30 and strongly suggests that N-acetylglucosamine deacetylation is crucial for holdfast adhesive properties. The phenomenon is reminiscent of the effect of deacetylation of chitin, a long chain polymer of N-acetylglucosamine, to produce adhesive chitosan 35,36. Note that binding affinity of ΔhfsH holdfasts is not significantly different on the hydrophobic and hydrophilic glass (Figure 3C), similarly to PGA.
In summary, these results suggest that (i) N-acetylglucosamine is not solely responsible for holdfast adhesion; rather, active components, here referred to as adhesins, dispersed in the holdfast bulk, generate the stronger adhesion and may be responsible for the observed differential surface response, and (ii) N-acetylglucosamine deacetylation mediated by HfsH is important for establishing a cohesive network, and possibly interconnecting adhesins. Further experiments should focus on elucidating the nature of the putative adhesins described in this work; one possibility would be for the adhesin to be a protein or peptide, comparable to bacterial fimbriae protein subunits 37 , the mussel Mytilus edulis foot proteins 38, or gingipain adhesin peptides 39.
Ionic strength and pH affect holdfast affinity
In order to further identify characteristics of adhesin-surface interaction, we investigated the possible role of electrostatics interactions between substrate and holdfast. Thus, purified holdfast binding to glass at different NaCl concentrations was quantified using fluorescence labeling (Figure 4A). PGA binding affinity was found to be insensitive to added salt (Figure 4B), indicating that the adhesive properties of the N-acetylglucosamine molecules were not affected by ionic strength. Similarly, the adhesive properties of fully acetylated holdfasts from the C. crescentus ΔhfsH mutant holdfasts were not affected by ionic strength (Figure 4C).
Figure 4.
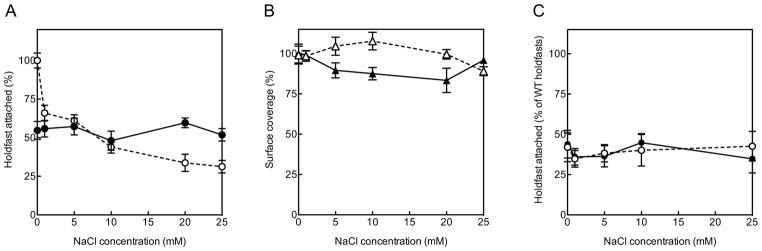
Surface attachment to clean (white symbols, dashed lines) and 3-TMSM-treated (black symbols, solid lines) glass, using different concentrations of NaCl, as described in the experimental section. (A) Purified holdfasts, (B) PGA and (C) ΔhfsH holdfasts.
In stark contrast to PGA and holdfasts produced by the ΔhfsH mutant, binding affinity on hydrophilic clean glass of deacetylated holdfasts decreased visibly with increasing the NaCl concentration. On 3-TMSM-treated glass, surface coverage was insensitive to salt concentration. This behavior points to the occurrence of attractive interactions between charged or polar groups of deacetylated holdfast and the polar glass surface. Since the principal mechanism by which glass and silica surfaces acquire a charge in contact with water is the dissociation of silanol groups, glass is negatively charged at close to neutral pH. At the same time amines in the deacetylated holdfast are positively charged. Silanols can be gradually deprotonated in aqueous solution by adjusting pH. Thus, to further confirm the origin of the electrostatic interaction, holdfast binding assays were next performed in solutions at different pH (Figure 5A).
Figure 5.

Surface attachment to clean (white symbols, dashed lines) and 3-TMSM-treated (black symbols, solid lines) glass, using different pH. (A) WT holdfasts, (B) PGA and (C) ΔhfsH holdfasts. (D) Surface attachment of purified holdfasts to clean (white bars) and 3-TMSM-treated (black bars) glass, using sequential different pH, as described in the experimental section.
For clean glass, binding affinity rapidly increased from acidic to neutral pH, with roughly 15% and 40% of surface binding at pH 2 and pH 5 respectively, to reach 100% at pH 6.5 to 7.5. Under the same conditions, the binding affinity for 3-TMSM treated glass remained approximately constant (55 to 75% for pH ranging from 2 to 7.5). This observation supports the hypothesis that ionization of silanol groups, which is at least partly suppressed on the 3-TMSM treated glass surface, is responsible for the observed electrostatic interaction. At the same time, PGA binding is insensitive to ionic strength (Figure 4B), therefore other moieties than N-acetylglucosamine and carrying positive charges must be involved from the holdfast side.
At pHs higher than 8 and for both types of surfaces, holdfast binding affinity dropped steeply and at the same rate (Figure 5A). PGA binding is greater at acidic pH and the maximal binding affinity of PGA on clean glass occurred around pH 5–6 (Figure 5B), whereas neutral pH (6.5 to 7.5) was optimal for holdfast binding efficiency (Figure 5A). At basic pH, PGA binding efficiency decreased drastically, being completely abolished at pH higher than 8 (Figure 5B). For fully acetylated ΔhfsH holdfasts, maximal binding was achieved at pH 4–5 and decreased steadily with increasing pH (Figure 5C). When purified holdfasts were incubated on clean glass at pH 5 for 2 h and subsequently adjusted the pH at 7 for an additional 2 h, binding affinity was partially restored (75%, compared to 40% if the total incubation was performed at pH 5, Figure 5A). In contrast, the effects of basic pH were irreversible (Figure 5D). Since the drop of affinity at basic pH occurs for both holdfast and PGA on both surfaces and is irreversible (Figure 5D) we hypothesize that the decrease in affinity at basic pH may involve degradation of the N-acetylglucosamine matrix, likely through base hydrolysis 40.
Time-dependent adhesion studies by dynamic force spectroscopy
The smaller angle of contact on hydrophobic surfaces (Figure 2 D–E) suggested stronger holdfast/surface interactions on this type of substrate and therefore the possibility of hydrophobic interactions between adhesins and substrate. However, affinity results indicated more frequent binding to clean glass than to TMSM-coated glass. A hypothesis that could reconcile these facts is the existence of a curing process that may occur after adsorption. This hypothesis is supported by previous work, which indicated that the individual holdfast footprint on the surface increases with time as it is synthesized after initial surface contact 7, suggesting that the holdfast is initially in a fluid state and stops spreading after reaching a 60–200 nm footprint 41. Moreover, surface-holdfast bonds are extremely strong for samples incubated overnight (~ 68 N nm−2) 25, but possibly much weaker initially, thus allowing the organism to explore its environment before binding irreversibly.
Since prior to this work it was not known what the initial adhesion forces may be, we measured rupture forces after initial holdfast adhesion, taken within seconds of contact by gradually increasing incubation (dwell) times by liquid-cell dynamic force spectrometry (DFS) 42. In these experiments, AFM tips were coated with a layer of holdfast, as described in the experimental section (Figure 6A). The surface area of the AFM tip covered with holdfast was analyzed by SEM (Figure 6B) and estimated at ~10−8 mm2.
Figure 6.

(A) Schematics for holdfast adhesion to the AFM tip as described in the main text. (B) Scanning electron micrographs of a pristine tip and the tip after holdfast attachment (top row). Close up of the pristine tip (bottom left) and the difference image between a tip before and after holdfast loading (bottom right). The holdfast-covered area is in white (bottom right). (C–D) Representative force-displacement curves collected from mica at 0.5 nN trigger force and 2 s dwell time (red: extension. blue: retraction curve). Single-peak retraction curve (C), (multi-peak retraction curve (D). The light gray area represents the work of adhesion. T=trigger point, C = contact point, R = rupture point.
The types of surfaces studied were different in terms of both hydrophobic character and microscopic roughness: 1) mica (hydrophilic, atomically smooth, homogeneous surface chemistry), 2) non treated clean glass (hydrophilic, microscopically rough, heterogeneous surface chemistry), 3) 3-TMSM-treated borosilicate glass (hydrophobic, microscopically rough, heterogeneous surface chemistry) and 4) graphite (hydrophobic, atomically smooth, homogeneous surface chemistry). Figures 6C and 6D represent typical force-displacement curves recorded by DFS. Retraction curves exhibit a negative deflection dip, resulting from the adhesion interaction as the tip is pulled back. The lowest point on the retraction curve corresponds to the rupture force. Two kinds of curves were observed: curves with a single adhesion event (Figure 6C) and curves with numerous local minima corresponding to multiple partial rupture events (Figure 6D). In each case, the area enclosed between the negative deflection curve and abscissa represents the work of adhesion. Retraction and extension curves (red and blue respectively, Figure 6C–D) overlap completely between the trigger and the contact point. Thus, holdfast behaved as an elastic medium for the force loading rate (~ 1μm s−1) and magnitude range (0.1 – 1 nN) used in this study.
It is important to note that separation at rupture occurs at the contact interface between holdfast and the substrate. Several lines of evidence support this idea: First, direct SEM inspection of the AFM tip after DFS experiments show no visible loss of holdfast material. Second, the cantilever resonance (in air, where quality factor is high) did not change significantly before and after adhesion, indicating that the total mass remained constant within the measurement error (~ 10−15 g) 43. Third, as shown in the following section, the bond strength is much smaller initially than that after long contact times (as in the case of tip/holdfast interface) making it much more likely that rupture will occur at the substrate/holdfast interface. Finally, no significant loss of adhesion could be detected after subsequent measurements using the same coated tip under similar conditions.
The work of adhesion corresponding to the initial phases of interaction for the four tested substrates is presented in Figure 7A. Clearly, the work of adhesion increased with the hydrophobic character of the substrate. Graphite stands out with almost two orders of magnitude greater work of adhesion than the other substrates. On graphite, the time to onset of the rapidly increasing phase is shorter than the minimum measurable time of 0.01 s. Long dwelling time adhesion to 3-TMSM treated glass is also significantly stronger than adhesion to untreated glass. However, the time to onset of the rapidly increasing phase is longer on 3-TMSM-treated glass than on graphite. Substrate roughness does not seem to play a major role in initial adhesion. Mica, which is hydrophilic and flat (0.2 nm rms), has a similar work of adhesion with glass, which is also hydrophilic but microscopically rough (4.0 nm rms).
Figure 7.
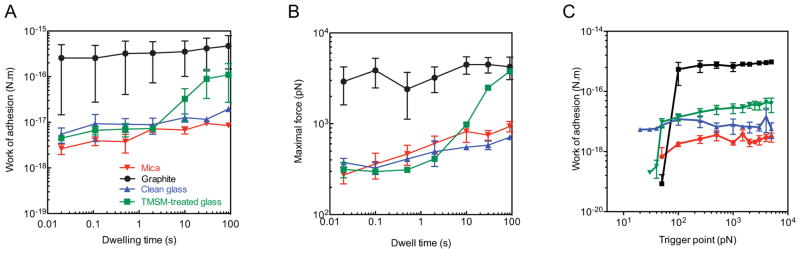
Experimental data for work of adhesion (A) and maximal force (B) for four different surfaces as a function of dwell time (fixed trigger point = 500 pN). (C) Work of adhesion as a function of the trigger point (fixed dwell time = 2 s). Data are expressed as an average of 4-16 independent replicates and the error bars represent the standard error. Mica is shown in red, graphite in black, clean glass in blue and 3-TMSM treated glass in green.
If we compare the work of adhesion, using the entire data set of force-displacement curves (single and multi peak curves), with the maximal rupture force data (Figure 7B), we observe the same trend for strength of adhesion as a function of different surfaces. This trend indicates that adhesion strength increases with time on all surfaces but the kinetics are different. Table 1 shows the maximum adhesion force per unit area on various surfaces. To find these estimates we have used the maximal force determined at 90 seconds of dwell time by DFS (Figure 7B) and an average contact area between the holdfast-covered AFM tip and the surface of 10−8 mm2 (Figure 6B). As for the work of adhesion, the maximal adhesion force depended on the surface: the more hydrophobic the substrate, the higher the adhesion force.
Table 1.
Maximal adhesion forces per unit area on the surfaces
| Surface | Maximal calculated adhesion force (N/mm2) | |
|---|---|---|
| Mica | 0.05 | |
| Clean glass | 0.08 | |
| 3-TSMS treated glass | 0.13 | |
| graphite | 0.66 | |
Contact area can be varied in principle by adjusting the maximal compression force (the trigger point) acting on the tip/holdfast complex (Figure 7C). However, for all surfaces and for trigger forces between 250 pN and 5 nN, the work of adhesion and maximal force measurements remained constant within experimental error, which means contact area was constant, the tip likely being in contact with the substrate. However, on both hydrophobic surfaces, the work of adhesion increased with the trigger point force above a threshold value of about 50 pN and then remained relatively unchanged. For hydrophilic surfaces (clean glass and mica) the work of adhesion no such trigger force threshold was observed. Note that the existence of a threshold force may prompt a cooperative interaction between hypothetical adhesins since if the adhesins were interacting with surface sites in a non-correlated manner we would expect in all cases a gradual increase of the work of adhesion as a function of trigger force (due to contact area expansion).
Qualitative examination of the force-extension curves revealed that roughly 60% of them contained multiple rupture events. The existence of both single and multiple rupture events highlights the underlying complexity of adhesion through multiple surface bonds. A statistical analysis of the magnitudes of rupture forces and extensions in the DFS force displacement curves was performed (Figure 8). Figure 8A shows the distribution of rupture events by visual identification, while the histogram in Figure 8B was derived from algorithms designed to extract these automatically (Supporting Information). The distribution was fitted with a function consisting of six Gaussian peaks each with a mean corresponding to a particular integer (n = 1–6) multiple of a characteristic rupture force, and with identical widths, plus a constant “background", thus 3 fit parameters. The data are well-described by the fit function for a characteristic rupture force parameter of 29.7 ± 0.6 pN. The first three peaks are present at high significance while the others are present at roughly 1.5 – 2 standard deviation level. Therefore, assuming that the high significance peaks in Figure 8A–B are associated with one, two, and three adhesins, we deduce that the initial adhesion occurs through discrete interactions, each carrying approximately 30 pN force. These values are within the range of those found for some small proteins, like ankyrin 44 or dystrophin 45 for example, or polymers, such as polystyrene 46 or polyethylene oxide 47. In contrast, overall single bond rupture force measurements performed on various polysaccharides are an order of magnitude higher than the value obtained here 48,49.
Figure 8.
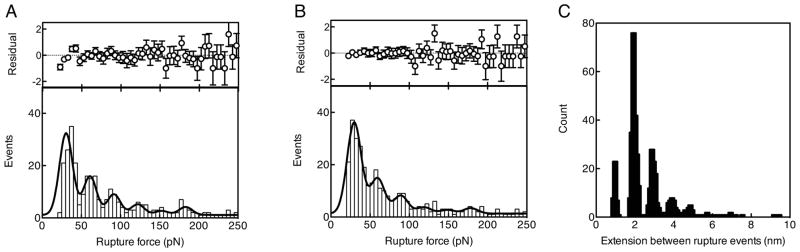
(A–B) Rupture event histograms analysis. The lower panel of each image displays the histogram of rupture-event forces, corresponding to the visual (A) and algorithmic (20 pN threshold) (B) identification of rupture events in the AFM force-displacement data. The corresponding best-fit function comprising six Gaussians plus uniform background is overlaid. The fits were performed over the range 25 to 250 pN. The upper panel of each image displays the normalized residuals, computed as (data-fit)/fit. (C) Distribution of the extension between rupture events for the AFM force-extension curves containing multiple rupture events. The multiple broad peaks are due to the finite step size during tip retraction.
In addition, the distribution of extension values corresponding to the rupture events shown above is illustrated in Figure 8C. The most probable extension between rupture events is observed to be approximately 2 nm. This is well above the z-noise of the AFM (~ 0.3 nm) within detection bandwidth. Based upon these data, we suggest that main initial adhesion is likely to occur through adhesin/surface interactions, each contact being capable of 2 nm extension before rupturing. It is worth noting here that in DFS experiments, rupture occurs via thermally assisted escape across an activation barrier that diminishes with applied force. Hence, measured forces are not a sole property of the bound complex but also depend on the loading rate 50. Here, however, the loading rate was held fixed, and we expect that the distribution of forces will vary somewhat for different pulling velocities.
The smallest average number of rupture events per force-displacement curve is approximately 1 and occurs on atomically flat graphite (Figure 9). The largest average number of rupture events per force-displacement curve occurs for glass (both clean and hydrophobic). One possible explanation is that cooperativity of adhesion postulated for graphite in relation with the results of Figure 7C may be manifesting here as well. Thus, in a cooperative bonding scenario, rupture of one adhesion-surface bond is quickly followed by neighboring adhesins as in a zipper. On a morphologically heterogeneous surface such as glass, other interactions (such as rapid spatial variations of interfacial tension) may interrupt adhesin linkage and cooperativity. In this case, the result would be a multiplication of rupture events per contact area.
Figure 9.

Frequency of number of single rupture events in force displacement curves exhibiting multiple rupture events. n = 24 for all surfaces (mica in red, graphite in black, clean glass in blue and 3-TMSM treated glass in green).
We now return to the question of why in Figure 7 the non-polar character of 3-TMSM glass manifests itself ~10 s after contact with the substrate while it is practically instantaneous for graphite? A possible explanation that correlates well with the idea of relatively sparse, mobile adhesins that organize in cooperative units is illustrated in Figure 10. For a given initial distribution of nonpolar adhesins on the surface of the holdfast proximal to the substrate, these adhesin molecules are able to bind immediately to the homogeneous non-polar graphite. In contrast, a period of time may be required for their rearrangement into domains, allowing effective binding to corresponding patches on a heterogeneous glass surface. Enhancement of overlapping between glass (fixed) and holdfast adhesin (mobile) non-polar patches would occur by diffusion and refolding of the latter. Future experiments performed on surfaces with controlled heterogeneity would be able to further substantiate this description. At this point, we provide a coupled reaction-diffusion model of adhesin diffusion within the holdfast matrix and its reaction with the substrate (see below), which reproduces well the observations.
Figure 10.
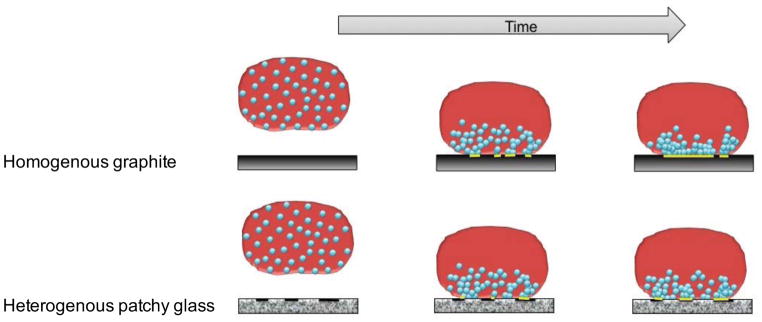
Proposed mechanism relying on the diffusion of sparse adhesion molecules towards the contact interface and their binding to surface hydrophobic domains. On graphite, the entire substrate is hydrophobic. In this case, reaching the interface is sufficient to create a bond. On chemically heterogeneous substrates such as 3-TMSM-treated glass, the additional step of interfacial diffusion of adhesins towards surface-bound hydrophobic domains adds a lag time to adhesion.
The maximum adhesion force per unit area reported in this study (Table 1) was three orders of magnitude lower than the force reported in previous work 25. We hypothesize that the main reason for this difference is due to difference in the amount of time the holdfast has adhered to the surface. In the Tsang et al. work, the holdfast was in contact with the substrate for days before the pulling measurements were made 25. In our DFS experiments, the holdfast spent approximately one hour on the tip after application compared to an instrument-limited maximum measurement time of 90 s on the surface. Indeed, examination of the force dependence on the dwell time (Figure 7) clearly indicates that holdfast adhesion is strongly time-dependent.
A parsimonious reaction-diffusion model given by coupled diffusion of adhesin within the holdfast matrix and its multi-step surface attachment kinetics (Supplemental Information) can indeed describe the dependence of the adhesion force on dwell time in the current DFS experiments as well as reconcile these results with those of Tsang et al. 25 (Figure 11A). Within the framework of this model, for short dwell times, the magnitude of the rupture force is determined by surface-adsorbed adhesins, which have not yet undergone the irreversible transition to the surface bound form. The time to onset of weak adhesion is determined by the rates of diffusion of adhesin within the holdfast mass and its reversible association with the substrate, in contrast with the time to onset of the strong adhesion at later times determined by the relatively slower rate of irreversible association with the surface.
Figure 11.

(A) The rupture force on mica as a function of dwell time, as measured by DFS (solid squares), and in the model (line). The parameter values of the fit are: h = 60 nm, k = 7.2 × 10⁻⁶ nm2 s−1, ka = 120 nm s−1, kd = 2.0 × 10⁻⁴ s−1, S0 = 1.0 nm−2, P0 = 4.6 × 10⁻³ nm−3, τ = 5000 s , Δf1 = 7 pN , Δf2 = 134 pN. The mean force as measured by Tsang et al. 25 is shown as a red triangle (reduced by a factor of 4, which corresponds to hs/h = 2). (B–C). Schematic diagram of holdfast surface attachment. (B) In modeling the total adhesion force, attachment occurs via multiple parallel bonds, each assumed to be a Hookean spring with spring constant, Kp. The number of initial bonds with the surface, N0, depends on the dwell time, and the load is assumed to be distributed (approximately) uniformly among them. The holdfast is modeled as an elastic element with spring constant Kh, which is coupled to the AFM cantilever arm with spring constant Kc, pulled at constant speed ν. (C) Cross-linking of the holdfast matrix, achieved by the putative adhesin or through chemical modification of N-acetylglucosamine, leads to stiffening of the holdfast and increase in the rupture force.
Following previous works 51,52, we model the rupture geometry as shown in Figure 11B, with parallel surface bonds, coupled through the holdfast to the AFM tip. The dependence of the rupture force on the number of surface-associated adhesin species is assumed to be linear in the scaling regime of loading rate relevant for the experiments reported here 51,52. Within the general framework of this model, for short dwell times, the magnitude of the rupture force is determined by the number of surface-adsorbed adhesins that have not yet undergone an irreversible transition to the surface bound form. The time to onset of weak adhesion is determined by the rates of diffusion of adhesin within the holdfast mass and its reversible association with the substrate, in contrast with the longer time to onset of strong adhesion determined by the relatively slower rate of irreversible association with the surface.
While this model represents a possible biophysical mechanism with plausible parameter values leading to the separation of time scales for weak and strong adhesion, we additionally consider two related, alternative mechanisms (Supporting Information). i) First, we have quantitatively analyzed the slow diffusion limit of the current reaction-diffusion model with a modified, single-step surface kinetic scheme, where the short and long time scales for adhesion are given by the rates of surface adsorption and bulk diffusion, respectively. A small rate of diffusion of the adhesin could result from rescaling of the bare diffusion constant due to strong adhesin binding to the holdfast polysaccharide matrix. ii) Second, we considered the possibility of cross-linking of the holdfast matrix over time, either by the putative adhesin or side chains of the N-acetylglucosamine polymer matrix itself. This is shown schematically in Figure 11C, leading to stiffening of the holdfast and resulting in a more uniform distribution of an externally applied load on surface bonds. Given the load dependence of the dissociation constant for adhesin-surface binding 53,54, where the unbinding rate increases exponentially with applied load, we hypothesize that when the holdfast is less stiff, an applied load is more likely to be concentrated on a few bonds leading to a greater probability of their rupture. Consequently, a larger load is distributed among the remaining surface bonds, resulting in a cascade of multiple ruptures with shorter rupture time and therefore smaller rupture force. In contrast, with a stiffer holdfast, the applied load transferred to each surface bond and hence the load-dependent dissociation rate is smaller. The rate of holdfast stiffening in the natural environment is expected to be slow to provide sufficient time for the cell to detach from an inhospitable surface, consistent with the onset of strong adhesion at longer times. While these models suggest different mechanisms by which holdfast adhesion strength could evolve from its initial values to considerably higher values over time, they all rely on multiple step kinetics, in absence of which data could not be fit. Further experiments seeking to identify the underlying mechanisms for the observed kinetics will be the scope of future studies.
CONCLUSION
In conclusion, an expanded ensemble of biophysical characteristics of bonding development in an isolated microscopic bioadhesive was investigated. We found that: (i) holdfast binding affinity is modified by environmental conditions and the nature of the substrate; (ii) holdfast adhesion varies on multiple time scales; and (iii) a kinetic model can describe the observation of time-dependence of the adhesion force on short and long time scales.
Together, our results suggest adhesion is initiated through discrete, cooperative events, with a magnitude of force suggestive of single molecules. The number of these initial surface interactions is enhanced on non-polar substrates. We propose that that the initial adhesive properties of the C. crescentus holdfast are dominated by a yet to be identified adhesin molecule acting in concert and present within a polysaccharide matrix composed of N-acetylglucosamine multimers.
Biologically, being able to modulate the strength and the timing of the adhesion process as a function of environmental cues is vital for bacteria. Indeed it has been suggested that permanent adhesion of newborn cells is prevented when environmental conditions deteriorate, allowing their dispersion and the formation of a new colony where the growth conditions are more favorable 33. Uncovering the chemical nature of adhesins as well as mechanisms underlying interactions of the adhesins within the holdfast matrix in response to environment will be critical not only for understanding the remarkable biology of adhesion, but also to modulate its properties for various applications. Indeed, Caulobacter holdfast has all the desired properties for a valuable bioadhesive: it adheres to a wide variety of surfaces under aqueous conditions and its adhesion is time-dependent, probably involving a natural curing mechanism, leading to a currently unequalled adhesion strength of 68 N /mm2.
Supplementary Material
Acknowledgments
We thank members of the Brun laboratory for comments on the manuscript. We thank Prof. T. Romeo (Department of Microbiology and Cell Science, University of Florida) for providing the E. coli TRMG strain and C. Dufort who participated in the preliminary stages of this study. This work was supported by National Institutes of Health Grant GM102841 and by a grant from the Indiana METACyt Initiative of Indiana University (funded in part through a major grant from the Lilly Endowment, Inc.) to YVB and BD, and by a National Science Foundation Grant PHY-0645652 to SS. BRAN acknowledges financial support from CNPq, Brazil.
Footnotes
Theoretical Methods; Supplementary data about (i) Quantitative Analysis of the Dependence of the Rupture Force on Dwell Time: Reaction-diffusion model of adhesin-surface association and (ii) Analysis of Rupture Event Force Distributions; Supplementary Tables S1 and S2; Supplementary Figures S1 to S7; Supplementary References. This information is available free of charge via the Internet at http://pubs.acs.org
References
- 1.Rehm BH. Bacterial Polymers: Biosynthesis, Modifications and Applications. Nat Rev Microbiol. 2010;8:578–592. doi: 10.1038/nrmicro2354. [DOI] [PubMed] [Google Scholar]
- 2.Itoh Y, Rice JD, Goller C, Pannuri A, Taylor J, Meisner J, Beveridge TJ, Preston JF, 3rd, Romeo T. Roles of Pgaabcd Genes in Synthesis, Modification, and Export of the Escherichia Coli Biofilm Adhesin Poly-Beta-1,6-N-Acetyl-D-Glucosamine. J Bacteriol. 2008;190:3670–3680. doi: 10.1128/JB.01920-07. [DOI] [PMC free article] [PubMed] [Google Scholar]
- 3.Beloin C, Roux A, Ghigo JM. Escherichia Coli Biofilms. Curr Top Microbiol Immunol. 2008;322:249–289. doi: 10.1007/978-3-540-75418-3_12. [DOI] [PMC free article] [PubMed] [Google Scholar]
- 4.Flemming HC, Wingender J. The Biofilm Matrix. Nat Rev Microbiol. 2010;8:623–633. doi: 10.1038/nrmicro2415. [DOI] [PubMed] [Google Scholar]
- 5.Galy O, Latour-Lambert P, Zrelli K, Ghigo JM, Beloin C, Henry N. Mapping of Bacterial Biofilm Local Mechanics by Magnetic Microparticle Actuation. Biophys J. 2012;103:1400–1408. doi: 10.1016/j.bpj.2012.07.001. [DOI] [PMC free article] [PubMed] [Google Scholar]
- 6.Shaw T, Winston M, Rupp CJ, Klapper I, Stoodley P. Commonality of Elastic Relaxation Times in Biofilms. Phys Rev Lett. 2004;93:098102. doi: 10.1103/PhysRevLett.93.098102. [DOI] [PubMed] [Google Scholar]
- 7.Li G, Brown PJB, Tang JX, Xu J, Quardokus EM, Fuqua C, Brun YV. Surface Contact Stimulates the Just-in-Time Deployment of Bacterial Adhesins. Mol Microbiol. 2012;83:41–51. doi: 10.1111/j.1365-2958.2011.07909.x. [DOI] [PMC free article] [PubMed] [Google Scholar]
- 8.O'Toole GA, Kolter R. Flagellar and Twitching Motility Are Necessary for Pseudomonas Aeruginosa Biofilm Development. Mol Microbiol. 1998;30:295–304. doi: 10.1046/j.1365-2958.1998.01062.x. [DOI] [PubMed] [Google Scholar]
- 9.Pratt LA, Kolter R. Genetic Analysis of Escherichia Coli Biofilm Formation: Roles of Flagella, Motility, Chemotaxis and Type I Pili. Mol Microbiol. 1998;30:285–293. doi: 10.1046/j.1365-2958.1998.01061.x. [DOI] [PubMed] [Google Scholar]
- 10.Watnick PI, Kolter R. Steps in the Development of a Vibrio Cholerae El Tor Biofilm. Mol Microbiol. 1999;34:586–595. doi: 10.1046/j.1365-2958.1999.01624.x. [DOI] [PMC free article] [PubMed] [Google Scholar]
- 11.Yildiz FH, Visick KL. Vibrio Biofilms: So Much the Same yet So Different. Trends Microbiol. 2009;17:109–118. doi: 10.1016/j.tim.2008.12.004. [DOI] [PMC free article] [PubMed] [Google Scholar]
- 12.Vadillo-Rodriguez V, Busscher HJ, Norde W, de Vries J, van der Mei HC. Atomic Force Microscopic Corroboration of Bond Aging for Adhesion of Streptococcus Thermophilus to Solid Substrata. J Colloid Interface Sci. 2004;278:251–254. doi: 10.1016/j.jcis.2004.05.045. [DOI] [PubMed] [Google Scholar]
- 13.Boks NP, Busscher HJ, van der Mei HC, Norde W. Bond-Strengthening in Staphylococcal Adhesion to Hydrophilic and Hydrophobic Surfaces Using Atomic Force Microscopy. Langmuir. 2008;24:12990–12994. doi: 10.1021/la801824c. [DOI] [PubMed] [Google Scholar]
- 14.Olsson AL, van der Mei HC, Busscher HJ, Sharma PK. Novel Analysis of Bacterium-Substratum Bond Maturation Measured Using a Quartz Crystal Microbalance. Langmuir. 2010;26:11113–11117. doi: 10.1021/la100896a. [DOI] [PubMed] [Google Scholar]
- 15.Francius G, Alsteens D, Dupres V, Lebeer S, De Keersmaecker S, Vanderleyden J, Gruber HJ, Dufrene YF. Stretching Polysaccharides on Live Cells Using Single Molecule Force Spectroscopy. Nat Protoc. 2009;4:939–946. doi: 10.1038/nprot.2009.65. [DOI] [PubMed] [Google Scholar]
- 16.Marszalek PE, Dufrene YF. Stretching Single Polysaccharides and Proteins Using Atomic Force Microscopy. Chem Soc Rev. 2012;41:3523–3534. doi: 10.1039/c2cs15329g. [DOI] [PubMed] [Google Scholar]
- 17.Brown PJ, Hardy GG, Trimble MJ, Brun YV. Complex Regulatory Pathways Coordinate Cell-Cycle Progression and Development in Caulobacter Crescentus. Adv Microb Physiol. 2009;54:1–101. doi: 10.1016/S0065-2911(08)00001-5. [DOI] [PMC free article] [PubMed] [Google Scholar]
- 18.Tomlinson AD, Fuqua C. Mechanisms and Regulation of Polar Surface Attachment in Agrobacterium Tumefaciens. Curr Opin Microbiol. 2009;12:708–714. doi: 10.1016/j.mib.2009.09.014. [DOI] [PMC free article] [PubMed] [Google Scholar]
- 19.Poindexter JS. The Role of Calcium in Stalk Development and in Phosphate Acquisition in Caulobacter Crescentus. Arch Microbiol. 1984;138:140–152. doi: 10.1007/BF00413014. [DOI] [PubMed] [Google Scholar]
- 20.Gonin M, Quardokus EM, O'Donnol D, Maddock J, Brun YV. Regulation of Stalk Elongation by Phosphate in Caulobacter Crescentus. J Bacteriol. 2000;182:337–347. doi: 10.1128/jb.182.2.337-347.2000. [DOI] [PMC free article] [PubMed] [Google Scholar]
- 21.Wagner JK, Setayeshgar S, Sharon LA, Reilly JP, Brun YV. A Nutrient Uptake Role for Bacterial Cell Envelope Extensions. Proc Natl Acad Sci U S A. 2006;103:11772–11777. doi: 10.1073/pnas.0602047103. [DOI] [PMC free article] [PubMed] [Google Scholar]
- 22.Bodenmiller D, Toh E, Brun YV. Development of Surface Adhesion in Caulobacter Crescentus. J Bacteriol. 2004;186:1438–1447. doi: 10.1128/JB.186.5.1438-1447.2004. [DOI] [PMC free article] [PubMed] [Google Scholar]
- 23.Entcheva-Dimitrov P, Spormann AM. Dynamics and Control of Biofilms of the Oligotrophic Bacterium Caulobacter Crescentus. J Bacteriol. 2004;186:8254–8266. doi: 10.1128/JB.186.24.8254-8266.2004. [DOI] [PMC free article] [PubMed] [Google Scholar]
- 24.Li G, Smith CS, Brun YV, Tang JX. The Elastic Properties of the Caulobacter Crescentus Adhesive Holdfast Are Dependent on Oligomers of N-Acetylglucosamine. J Bacteriol. 2005;187:257–265. doi: 10.1128/JB.187.1.257-265.2005. [DOI] [PMC free article] [PubMed] [Google Scholar]
- 25.Tsang PH, Li G, Brun YV, Freund LB, Tang JX. Adhesion of Single Bacterial Cells in the Micronewton Range. Proc Natl Acad Sci U S A. 2006;103:5764–5768. doi: 10.1073/pnas.0601705103. [DOI] [PMC free article] [PubMed] [Google Scholar]
- 26.Alipour-Assiabi E, Li G, Powers TR, Tang JX. Fluctuation Analysis of Caulobacter Crescentus Adhesion. Biophys J. 2006;90:2206–2212. doi: 10.1529/biophysj.105.064592. [DOI] [PMC free article] [PubMed] [Google Scholar]
- 27.Sato H, Kataoka N, Kajiya F, Katano M, Takigawa T, Masuda T. Kinetic Study on the Elastic Change of Vascular Endothelial Cells on Collagen Matrices by Atomic Force Microscopy. Colloids Surf B Biointerfaces. 2004;34:141–146. doi: 10.1016/j.colsurfb.2003.12.013. [DOI] [PubMed] [Google Scholar]
- 28.Merker RI, Smit J. Characterization of the Adhesive Holdfast of Marine and Freshwater Caulobacters. Appl Environ Microbiol. 1988;54:2078–2085. doi: 10.1128/aem.54.8.2078-2085.1988. [DOI] [PMC free article] [PubMed] [Google Scholar]
- 29.Hardy GG, Allen RC, Toh E, Long M, Brown PJ, Cole-Tobian JL, Brun YV. A Localized Multimeric Anchor Attaches the Caulobacter Holdfast to the Cell Pole. Mol Microbiol. 2010;76:409–427. doi: 10.1111/j.1365-2958.2010.07106.x. [DOI] [PMC free article] [PubMed] [Google Scholar]
- 30.Wan Z, Brown PJ, Elliott EN, Brun YV. The Adhesive and Cohesive Properties of a Bacterial Polysaccharide Adhesin Are Modulated by a Deacetylase. Mol Microbiol. 2013 doi: 10.1111/mmi.12199. [DOI] [PMC free article] [PubMed] [Google Scholar]
- 31.Johnson RC, Ely B. Isolation of Spontaneously Derived Mutants of Caulobacter Crescentus. Genetics. 1977;86:25–32. doi: 10.1093/genetics/86.1.25. [DOI] [PMC free article] [PubMed] [Google Scholar]
- 32.Poindexter JS, Hagenzieker JG. Novel Peptidoglycans in Caulobacter and Asticcacaulis Spp. Journal of bacteriology. 1982;150:332–347. doi: 10.1128/jb.150.1.332-347.1982. [DOI] [PMC free article] [PubMed] [Google Scholar]
- 33.Berne C, Kysela DT, Brun YV. A Bacterial Extracellular DNA Inhibits Settling of Motile Progeny Cells within a Biofilm. Mol Microbiol. 2010 doi: 10.1111/j.1365-2958.2010.07267.x. [DOI] [PMC free article] [PubMed] [Google Scholar]
- 34.Abramoff MD, Magelhaes PJ, Ram SJ. Image Processing with ImageJ. Biophotonics International. 1994;11:36–42. [Google Scholar]
- 35.Singla AK, Chawla M. Chitosan: Some Pharmaceutical and Biological Aspects - an Update. J Pharm Pharmacol. 2001;53:1047–1067. doi: 10.1211/0022357011776441. [DOI] [PubMed] [Google Scholar]
- 36.Sorlier P, Denuziere A, Viton C, Domard A. Relation between the Degree of Acetylation and the Electrostatic Properties of Chitin and Chitosan. Biomacromolecules. 2001;2:765–772. doi: 10.1021/bm015531+. [DOI] [PubMed] [Google Scholar]
- 37.Kline KA, Fälker S, Dahlberg S, Normark S, Henriques-Normark B. Bacterial Adhesins in Host-Microbe Interactions. Cell Host & Microbe. 2009;5:580–592. doi: 10.1016/j.chom.2009.05.011. [DOI] [PubMed] [Google Scholar]
- 38.Silverman HG, Roberto FF. Understanding Marine Mussel Adhesion. Mar Biotechnol (NY) 2007;9:661–681. doi: 10.1007/s10126-007-9053-x. [DOI] [PMC free article] [PubMed] [Google Scholar]
- 39.Boisvert H, Duncan MJ. Translocation of Porphyromonas Gingivalis Gingipain Adhesin Peptide A44 to Host Mitochondria Prevents Apoptosis. Infect Immun. 2010;78:3616–3624. doi: 10.1128/IAI.00187-10. [DOI] [PMC free article] [PubMed] [Google Scholar]
- 40.Chebotok EN, Novikov VY, Konovalova IN. Depolymerization of Chitin and Chitosan in the Course of Base Deacetylation. Russian Journal of Applied Chemistry. 2006;79:1162–1166. [Google Scholar]
- 41.Li G, Brun YV, Tang JX. Holdfast Spreading and Thickening During Caulobacter Crescentus Attachment to Surfaces. BMC Microbiol. 2013;13:139. doi: 10.1186/1471-2180-13-139. [DOI] [PMC free article] [PubMed] [Google Scholar]
- 42.Hinterdorfer P, Garcia-Parajo MF, Dufrene YF. Single-Molecule Imaging of Cell Surfaces Using near-Field Nanoscopy. Acc Chem Res. 2012;45:327–336. doi: 10.1021/ar2001167. [DOI] [PubMed] [Google Scholar]
- 43.Ilic B, Craighead HG, Krylov S, Senaratne W, Ober C, Neuzil P. Attogram Detection Using Nanoelectromechanical Oscillators. Journal of Applied Physics. 2004;95:3694–3703. [Google Scholar]
- 44.Lee G, Abdi K, Jiang Y, Michaely P, Bennett V, Marszalek PE. Nanospring Behaviour of Ankyrin Repeats. Nature. 2006;440:246–249. doi: 10.1038/nature04437. [DOI] [PubMed] [Google Scholar]
- 45.Bhasin N, Law R, Liao G, Safer D, Ellmer J, Discher BM, Sweeney HL, Discher DE. Molecular Extensibility of Mini-Dystrophins and a Dystrophin Rod Construct. J Mol Biol. 2005;352:795–806. doi: 10.1016/j.jmb.2005.07.064. [DOI] [PubMed] [Google Scholar]
- 46.Li IT, Walker GC. Single Polymer Studies of Hydrophobic Hydration. Acc Chem Res. 2012 doi: 10.1021/ar200285h. [DOI] [PubMed] [Google Scholar]
- 47.Liu K, Song Y, Feng W, Liu N, Zhang W, Zhang X. Extracting a Single Polyethylene Oxide Chain from a Single Crystal by a Combination of Atomic Force Microscopy Imaging and Single-Molecule Force Spectroscopy: Toward the Investigation of Molecular Interactions in Their Condensed States. J Am Chem Soc. 2011;133:3226–3229. doi: 10.1021/ja108022h. [DOI] [PubMed] [Google Scholar]
- 48.Rief M, Oesterhelt F, Heymann B, Gaub HE. Single Molecule Force Spectroscopy on Polysaccharides by Atomic Force Microscopy. Science. 1997;275:1295–1297. doi: 10.1126/science.275.5304.1295. [DOI] [PubMed] [Google Scholar]
- 49.Marszalek PE, Oberhauser AF, Pang YP, Fernandez JM. Polysaccharide Elasticity Governed by Chair-Boat Transitions of the Glucopyranose Ring. Nature. 1998;396:661–664. doi: 10.1038/25322. [DOI] [PubMed] [Google Scholar]
- 50.Dudko OK, Filippov AE, Klafter J, Urbakh M. Beyond the Conventional Description of Dynamic Force Spectroscopy of Adhesion Bonds. Proc Natl Acad Sci U S A. 2003;100:11378–11381. doi: 10.1073/pnas.1534554100. [DOI] [PMC free article] [PubMed] [Google Scholar]
- 51.Seifert U. Rupture of Multiple Parallel Molecular Bonds under Dynamic Loading. Physical Review Letters. 2000;84:2750–2753. doi: 10.1103/PhysRevLett.84.2750. [DOI] [PubMed] [Google Scholar]
- 52.Seifert U. Dynamic Strength of Adhesion Molecules: Role of Rebinding and Self-Consistent Rates. Europhys Lett. 2002;58:792. [Google Scholar]
- 53.Bell GI. Models for the Specific Adhesion of Cells to Cells. Science. 1978;200:618–627. doi: 10.1126/science.347575. [DOI] [PubMed] [Google Scholar]
- 54.Evans E, Ritchie K. Dynamic Strength of Molecular Adhesion Bonds. Biophys J. 1997;72:1541–1555. doi: 10.1016/S0006-3495(97)78802-7. [DOI] [PMC free article] [PubMed] [Google Scholar]
Associated Data
This section collects any data citations, data availability statements, or supplementary materials included in this article.