Abstract
Molybdenum enzymes contain at least one pyranopterin dithiolate (molybdopterin, MPT) moiety that coordinates Mo through two dithiolate (dithiolene) sulfur atoms. For sulfite oxidase (SO), hyperfine interactions (hfi) and nuclear quadrupole interactions (nqi) of magnetic nuclei (I ≠ 0) near the Mo(V) (d1) center have been measured using high-resolution pulsed electron paramagnetic resonance (EPR) methods and interpreted with the help of the density functional theory (DFT) calculations. These have provided important insights about the active site structure and the reaction mechanism of the enzyme. However, it has not been possible to use EPR to probe the dithiolene sulfurs directly since naturally abundant 32S has no nuclear spin (I = 0). Here we describe direct incorporation of 33S (I = 3/2), the only stable magnetic sulfur isotope, into MPT using controlled in vitro synthesis with purified proteins. The electron spin echo envelope modulation (ESEEM) spectra from 33S-labeled MPT in this catalytically active SO variant are dominated by the ‘inter-doublet’ transition arising from the strong nuclear quadrupole interaction, as also occurs for the 33S-labeled exchangeable equatorial sulfite ligand [Klein, E. L., et al., Inorg. Chem. 2012, 51, 1408 – 1418]. The estimated experimental hfi and nqi parameters for 33S (aiso = 3 MHz and e2Qq/h = 25 MHz) are in good agreement with those predicted by DFT. In addition, the DFT calculations show that the two 33S atoms are indistinguishable by EPR and reveal a strong intermixing between their out-of-plane pz orbitals and the dxy orbital of Mo(V).
Introduction
All known molybdenum-containing enzymes, with the exception of nitrogenase, contain either one or two pyranopterin dithiolate (molybdopterin; MPT) cofactors (Figure 1) that coordinate to the metal through the two sulfur atoms of the ene-dithiolate (dithiolene)1 functionality. The pyranopterin dithiolate cofactor is unusual in that both the pyranopterin and the dithiolene portions can have multiple redox forms. Alternative redox forms to the tetrahydropyranopterin (the form shown in Figure 1) may play significant roles in specific enzymes.2 Indeed, a recent analysis of the conformations of 319 pyranopterins in 102 protein structures by Rothery et al. demonstrated that enzymes in the xanthine dehydrogenase (XDH) family adopt the tetrahydro form, whereas those in the sulfite oxidase (SO) family occur in a dihydro form,3 which is two electrons more oxidized.
Figure 1.
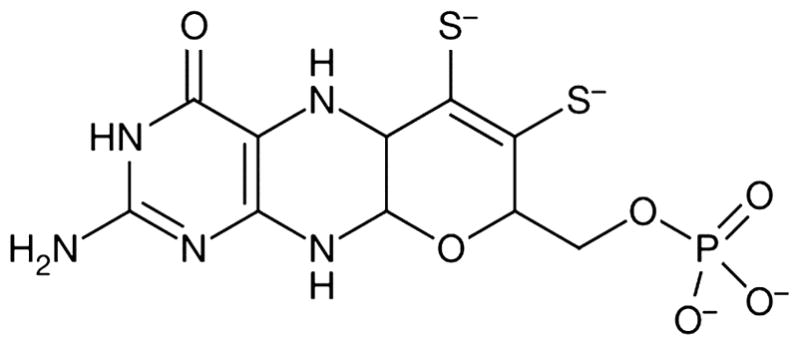
Molybdopterin (MPT) shown in the tetrahydropyranopterin dithiolate form.
The ability of dithiolene ligands to stabilize multiple formal oxidation states of metals in coordination compounds was initially established in the early 1960s from studies of square planar [M(dithiolene)2]n systems.4–7 Dithiolene ligands were described as ‘redox non-innocent’,8 and oxidation of dithiolate, via a radical anion, to dithione was proposed to contribute to the overall multiple redox states of their metal complexes. The electron paramagnetic resonance (EPR) spectra of several of these square planar complexes with S = ½ supported the idea that the unpaired electron was in an orbital with substantial dithiolene sulfur character.9,10 However, it was not possible to observe this delocalization directly through a hyperfine interaction (hfi) since naturally abundant 32S has no nuclear spin (I = 0).
The chemical and physical properties of dithiolene compounds continue to be of interest, especially because of the occurrence of the pyranopterin dithiolate cofactor (Figure 1) in Mo and W enzymes.11 At least three roles have been proposed for the pyranopterin dithiolate cofactor: 1) modulating the redox potential of the metal center;12 2) providing for effective coupling into protein mediated superexchange pathways for efficient electron transfer during catalysis;12 3) facilitating the oxygen atom transfer reactions that occur in the catalytic cycle.12 Recent studies of model compounds have indicated that metal-dithiolene interactions are highly covalent and that the energies of the Mo 4d and S 3p orbitals are very similar to one another. These studies include: X-ray absorption spectroscopy at the S K-edge and density functional theory (DFT) calculations;13–19 gas phase X-ray and UV photoelectron spectroscopy;20 X-ray crystal structures as a function of formal oxidation state;18 resonance Raman,12 electronic absorption,12,21 and magnetic circular dichroism (MCD)12,21 spectroscopy.
During catalysis, molybdenum enzymes pass through the paramagnetic Mo(V) (d1) state, and high resolution pulsed electron paramagnetic resonance (EPR) measurements of the hyperfine and nuclear quadrupole interactions with nearby magnetic nuclei (I ≠ 0) provide important information about the structures of the enzyme active sites during this step of their catalytic reactions.22,23 Pulsed EPR investigations of sulfite oxidase (SO) with naturally abundant nuclei (1H, 14N, 31P) and with isotopically enriched reagents (2H2O, H217O, 35Cl−, 37Cl−, [33SO3]2−, [S17O3]2− ), in parallel with DFT calculations and direct spectroscopic comparisons using structurally defined model compounds, have provided important insights into the structure of the active site and the reaction mechanism of the enzyme.24
Extension of pulsed EPR methods to evaluation of the spin population on a dithiolene S atom presents major challenges. Naturally abundant 32S has no nuclear spin (I = 0) and consequently is silent in EPR experiments. Therefore, isotopic labeling of the dithiolene unit with 33S (I = 3/2) is required for experimental measurements. Such labeling has not been practical for model Mo-ditholene compounds, due in large part to the expense of 33S and the difficulty of carrying out multi-step syntheses with small amounts of material. The elucidation of the biosynthetic pathways of the molybdenum cofactor in bacteria25 and higher organisms,26,27 however, has opened up the possibility of direct incorporation of 33S-labeled sulfide into MPT itself using an entire controlled in vitro synthesis with purified proteins.28 Here we present the biosynthetic reactions for preparing 33S-labeled molybdenum cofactor in a catalytically active SO variant. The 33S hfi and nuclear quadrupole interaction (nqi) constants for the Mo(V) state of the construct are determined experimentally by pulsed EPR methods and compared with results from DFT calculations performed using the latest computational methods. To our knowledge, this is the first determination of the hfi and nqi parameters for a 33S atom in a dithiolene group.
Materials and Methods
Preparation of 33S-labeled ammonium sulfide
Aluminum metal shavings (30 mg, 1.11 mmol, ~ 10% molar excess) were weighed into a quartz reaction vessel constructed of a 3 cm long x 3 cm diameter cylinder with hemispherical caps, each cap having a radius of 1.5 cm and where one of the caps was opened to a cylindrical neck of 3.5 cm x 0.5 cm. To this was added 50.0 mg of 33S8 (0.190 mmol, 99 atom %, Cambridge Isotope Laboratories). Air was evacuated from the reaction vessel (10−4 mbar), and the neck was flame sealed. The sealed reaction vessel was heated to 1200 °C for 10 minutes in a preheated tube furnace, forming Al233S3 as a white powder. The reaction vessel was removed from the furnace, allowed to cool to room temperature, and then opened by etching and cracking the neck. A rubber septum was immediately attached to the open neck, and the vessel was cooled to −78 °C in an ethanol/CO2(s) bath. A solution of aqueous ammonia, prepared by adding 225 μL of 25% ammonium hydroxide to 2.80 mL of degassed water, was added drop-wise by syringe into the vessel containing the Al233S3. When the addition was complete, the frozen solution was allowed to slowly melt, resulting in the complete hydrolysis of Al233S3. The mixture was rapidly shaken at room temperature for 10 minutes. Finally, insoluble Al(OH)3 and excess Al were filtered from the solution. Gravimetric characterization of the resulting ammonium sulfide solution was performed by titrating an aliquot with excess FeSO4 (aq), giving 96% isolated yield of insoluble FeS powder. The 500 mM (NH4)2S solution was stored at −80 °C prior to use to prevent decomposition. A control solution of ammonium sulfide having the natural abundance of sulfur isotopes was also prepared in an identical manner using non-enriched S8.
Protein expression and purification
The E. coli MPT-synthase subunit MoaE and Gephyrin C4 splice variant were expressed in E. coli BL21 (DE3) strain as previously described.28,29 Human apoSO molybdenum domain (apoSOMO) was expressed in the E. coli moaC strain RK5245.30 Expression was induced with 0.1 mM isopropyl β-thiogalactoside at OD600 = 0.5 and continued for 15 h at 30 °C. All three proteins were expressed as His-tagged protein and purified by nickel nitrilotriacetic acid (Ni-NTA) affinity, as recommended (QIAGEN). For gephyrin C4, an additional purification step consisting of anion exchange chromatography was used. The E. coli MPT-synthase subunit MoaD was expressed and purified in its thiocarboxylated form, as previously described,29 with the following modification. MoaD was eluted from the chitin matrix with commercially available ammonium sulfide (for sample 1) or with ammonium sulfide prepared from either elemental 32S (for sample 2) or from elemental 33S (for samples 3 and 4). All purified proteins were exchanged into the same buffer (20 mM Tris/HCl pH 8.0, 50 mM NaCl) and stored at −80 °C until further analysis.
Moco in vitro synthesis and sulfite oxidase reconstitution
All reactions were performed at room temperature in 100 mM HEPES buffer pH 7.5. Two different measurements were performed. For sample 1, a preparative reaction mixture (8 ml) containing MoaD (160 nmol), MoaE (10 nmol), and 5 mM molybdate was prepared, and the reaction was started by the addition of cPMP (50 nmol), which was purified as previously described.31 Following an incubation time (t1) of 30 min, in vitro synthesized Moco was incubated with 50 nmol apoSOMO followed by an incubation time (t2) of 30 min to allow enzyme reconstitution. Next, the reaction mixture was concentrated to 200 μL using 30 kDa ultra concentrators (Millipore) and stored at −80 °C until further analysis. The activity of reconstituted SOMO was determined by sulfite:ferricyanide assay. An aliquot of the reaction mixture (5 μl) was added to a mixture containing ferricyanide (20 μM) and 100 mM Tris/Hcl pH 8, and the reaction was started by the addition of sodium sulfite (300 μM). SO activity was quantified by monitoring the reduction of ferricyanide at 420 nm using a 96 well-plate reader (BioTeK). This assay was used to prepare sample 1 (Figure 2a).
Figure 2.
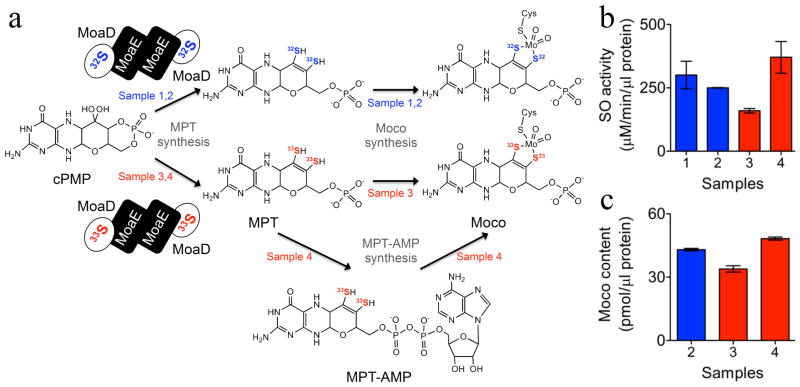
Moco in vitro synthesis and activation of sulfite oxidase molybdenum domain. (a) MoaD proteins thiolated with 32S or 33S were used to synthesize MPT from purified cPMP (samples 1 – 4). Moco was synthesized either non-enzymatically (samples 1 – 3) or in the presence of gephyrin protein (sample 4). (b) Sulfite oxidase activity of reconstituted apo SOMo (Samples 1 – 4) using the sulfite:ferricynide assay. (c) Moco content of reconstituted SOMo (Samples 2 – 4), as determined by HPLC Form A dephospho analysis (oxidation product of Moco). All data shown in (b) and (c) are average values of three independent experiments, with error bars indicating the standard deviation.
For the preparation of samples 2, 3, and 4, the following modifications were introduced. First, different amounts of the corresponding MoaD proteins were used in an analytical assay (200 μl) to determine the amounts of MoaD that lead to maximal MPT synthesis. Following this, 50 nmol MoaE and the determined effective amounts of MoaD were used in the preparative reactions: sample 2 (500 nmol), sample 3 (850 nmol), and sample 4 (850 nmol). The molybdate concentration was reduced to 1 mM, and 500 nmol of purified gephyrin C428 was also added to the reaction mixture of sample 4. After the incubation times t1 and t2, all buffers were exchanged to 20 mM Tris/HCl pH 8.0, 50 mM NaCl to eliminate excess molybdate. Finally, the samples were concentrated to 300 μl and stored at −80 °C until further analysis.
Determination of Moco content by FormA analysis
For determination of Moco content in the reconstitution samples, aliquots (5 μl) were first oxidized to the stable oxidation product, FormA-dephospho, and then further quantified using HPLC reverse phase chromatography, as previously described.32
EPR sample preparation
Each sample was exchanged into Tris buffer at pH 6.4 containing 100 mM NaCl and concentrated to 40 μL. The samples were reduced with a 30-fold excess of sodium sulfite and then reoxidized with 0.5 molar equivalents of ferricyanide. After transfer to 2.0 mm id quartz EPR tubes, the samples (~25 μL) were immediately frozen in liquid nitrogen.
EPR Instrumentation
X-band (~9 GHz) continuous wave (CW) EPR experiments were performed at 77 K using a Bruker ESP500 spectrometer. Electron spin echo (ESE) envelope modulation (ESEEM) measurements were performed at 35.12 GHz on a home-built Ka-band (26 – 40 GHz) pulsed EPR spectrometer.33 Details of the pulse sequences are given in the figure legends. The measurement temperature was ~21 K.
DFT Calculations
The ORCA computational package (version 2.9.0) was used for all quantum-chemical calculations.34 BP8635,36 (using the RI-J approximation37,38) and B3LYP39,40 functionals were used in conjunction with Ahlrich’s all-electron TZVP basis set41–43 for the geometry optimization (along with the TZV/J auxiliary basis set) and property calculations, respectively. Relativistic effects were treated at the level of the zeroth order regular approximation (ZORA)44 in one-component form using the model potential of van Wüllen45 (as implemented in ORCA) for all properties calculations. The protein environment was modeled with a dielectric continuum (conductor like screening model, COSMO)46 using a dielectric constant, ε, of four.47 Dispersion effects were accounted for using a semi-empirical van der Waals correction (keyword “VDW10” in ORCA 2.9.0).48 Additional details relating specifically to the properties calculations, including a complete description of the electronic structure of the optimized Mo(V) center (shown in Figures S1 and S2), are provided in the SI.
Starting coordinates for each of the SO active site DFT models were prepared from the cSO crystal structure (pbd 1SOX).49 Nearby amino acid residues (Cys185 and Tyr322) and a backbone fragment (Ala186, which forms a hydrogen bond to the axial oxo ligand) that define important H-bonding interactions were included in each model so that the geometry optimization steps could be performed with as few biased geometric constraints as possible. The relative atom coordinates of all amino acid alpha carbons and the beta carbon of the Tyr residue, as well as the guanidinium carbon atom of MPT in one of the models, were constrained to simulate the spatial limits that would be imposed by the protein itself. The specific constraints are shown in Figure S3. In the case of the model with the constrained guanidinium carbon, the dihedral angle formed by the Mo-S and S-MPT planes was allowed to optimize freely. Five other models were also prepared in which the dihedral angle was explicitly defined at 120, 150, 180, 210, or 240 degrees. For these models, realistic steric interactions from the protein around the MPT cofactor were ignored in order to allow the effect(s) of extreme dihedral angles on the electronic structure and spectroscopic parameters to be calculated. The optimized coordinates of each model, from which all properties calculations were performed, are included in the SI.
Results and Discussion
Biological activity of 33S-labeled molybdenum cofactor
Using an in vitro synthesis approach, which covered the last three steps of Moco synthesis, we previously demonstrated gephyrin-mediated molybdenum insertion into molybdopterin (MPT) under near-physiological conditions.28 Aiming to synthesize and characterize a cofactor in which molybdenum is coordinated by two 33S atoms, we modified our previously reported protocol at the level of MPT-synthase enzyme preparation to transfer 33S sulfide to cPMP, yielding a 33S-labeled MPT that could be converted to Moco and subsequently inserted into Moco-free SO (Figure 2a). First, we used commercially available ammonium sulfide (32S) to prepare thiocarboxylated MoaD (Figure 2a, sample 1) and performed a preparative synthesis of MPT followed by a non-enzymatic (in the absence of gephyrin) in vitro molybdenum insertion to produce Moco, which was inserted into apo SOMO. Reconstitution of SO was demonstrated by the sulfite:ferricyanide activity of reconstituted SOMO (Figure 2b). Next, we performed in vitro Moco synthesis under similar experimental conditions using thiocarboxylated MoaD, which was either loaded with 32S (Figure 2a, sample 2) or 33S (Figure 2a, sample 3). Specific details of the procedures are provided in the Materials and Methods section. Knowing that use of ammonium sulfide prepared from either 32S or 33S might result in different thiolation levels of the corresponding MoaDs, we first analyzed 32S and 33S thiocarboxylated MoaDs for their abilities to synthesize MPT using HPLC FormA analysis (data not shown). Next, the determined effective MoaD concentrations were used for preparative in vitro Moco synthesis and SO reconstitution using 32S and 33S thiolated MoaD, respectively (Figure 2a, samples 2 and 3). In order to increase the efficacy of molybdenum insertion, gephyrin was added in an additional reconstitution reaction using 33S-labeled MoaD (Figure 2a, sample 4).
Moco-free SO was reconstituted in all four samples, demonstrating that 32S and 33S were incorporated into MPT, thus forming active Moco that was able to catalyze sulfite oxidation (Figure 2b). Furthermore, sample 4, which was labeled with 33S, resulted in the highest SO reconstitution level, attesting for an efficient Moco synthesis rate using gephyrin in comparison to non-enzymatic molybdenum insertion (Figure 2b). Moco quantification by HPLC FormA analysis corroborated the differences observed in SO activities of the different samples, as the highest Moco saturation was again measured for sample 4 (Figure 2c). In summary, given the similar levels of Moco saturation in the different samples, we conclude that the enzymatic activities of 32S- and 33S-labeled SO are comparable and, therefore, that the incorporation of the labeled atoms in no way affects the structure or function of Moco in the active site of SO.
EPR spectroscopy of the 33S-labeled molybdenum cofactor
Figure 3 shows the Mo(V) CW EPR spectra of samples 1 – 4 of Figure 2. Even though the specific preparation of each sample varied, the CW EPR spectra of the samples with naturally abundant 32S (I = 0) and isotopically labeled with 33S (I = 3/2) display only very minor differences. The shape of the collected spectra corresponds to the low pH (lpH) form of SO, for which a proton-related splitting at gz (the low-field turning point) is a characteristic feature.24 The g-values found from analyzing the CW EPR spectra were {g1: 1.965; g2: 1.971; g3: 2.003}, which are standard for the lpH form of SO. The minor differences between spectra are apparently due to minor (and slightly different for each sample) admixtures of the high pH (hpH) form (which commonly occurs and is difficult to control).
Figure 3.
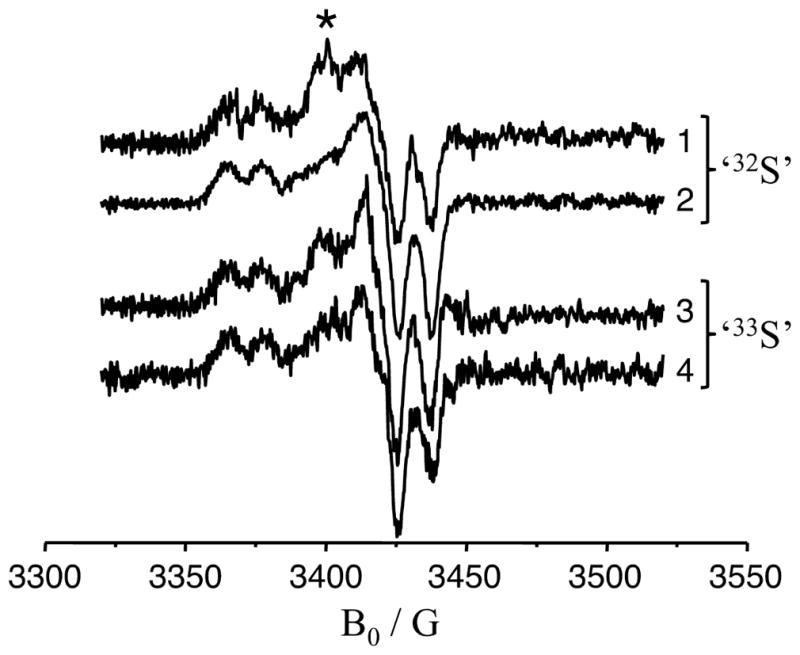
X-band CW EPR spectra of different preparations of lpH SO. Traces 1 – 4 correspond to samples 1 – 4 of Figure 2, respectively. The asterisk indicates the position of a feature that apparently arises due to a small amount of the hpH form, as discussed in the text. Experimental conditions: temperature, 77 K; mw frequency, 9.4586 GHz; modulation amplitude, 2 G; mw power, 2 mW.
Comparison of the spectra shown in Figure 3 reveals that there are no significant differences between samples prepared with 32S- and 33S-labeled MPT. This could be interpreted as an indication that the hfi of both 33S nuclei in the labeled MPT is smaller than the ‘intrinsic’ EPR line width of the Mo(V) center (~5 G (14 MHz) at the microwave (mw) X band for the samples in acidic buffer) due to unresolved hfi with the nuclei of amino acid residues and buffer. The Ka-band (~35 GHz) ESE-detected field-sweep spectra of the 32S- and 33S-labeled samples are also nearly identical (see Figure 4), which confirms the results obtained by the X-band CW EPR.
Figure 4.
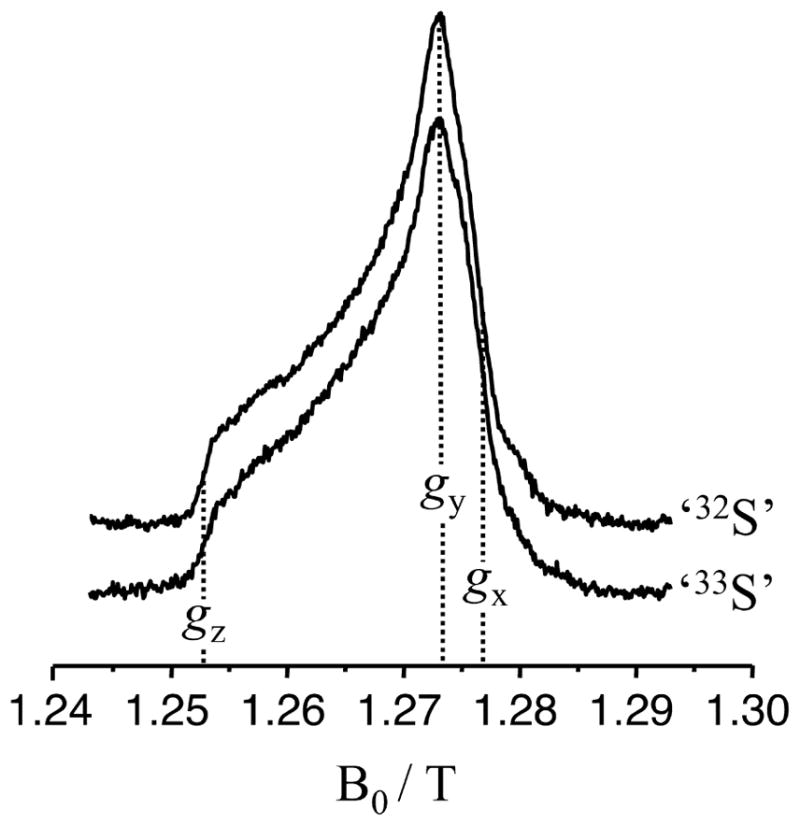
Ka-band ESE detected field-sweep spectra (primary echo) of the ‘33S’ and ‘32S’ samples. Experimental conditions: temperature, 21 K; mw pulse durations, 20 ns; time interval between pulses, 150 ns; mw frequency, 35.12 GHz.
To obtain more specific information on the 33S hfi and nqi parameters, ESEEM spectroscopy was employed. The concentration of Mo(V) in the samples, as prepared, was less than 100 μM, which resulted in a quite low signal-to-noise ratio (S/N).50 The need to maintain reasonable data acquisition times (hours) has limited our choice of practical ESEEM techniques. Only the pulse sequences that could provide a maximum amount of information while also maximizing the ESE signal could be employed. Therefore, the two-pulse (primary) ESEEM spectroscopy for 1D measurements and the refocused primary (RP) ESEEM51 for 2D measurements were chosen for our experiments. The application of the RP ESEEM technique to determine the hfi and nqi parameters of various nuclei has been described elsewhere.52,53 Similar to the more popular hyperfine sublevel correlation (HYSCORE) technique, RP ESEEM facilitates the interpretation of the spectral features by revealing their correlations in a 2D spectrum. The advantages of RP ESEEM over HYSCORE are the greater (about twice) amplitude of the ESE signal and the fact that it is a true 2D technique (as it is based on three mw pulses with two intervals between them), whereas HYSCORE is only effectively 2D (out of the three available time intervals the last two are varied to obtain a 2D spectrum, while the first interval is used as a fixed parameter). Since the amplitudes of the HYSCORE spectral lines depend on the first time interval, multiple experiments have to be performed to recover the whole spectrum of the nuclear transitions. These advantages of RP ESEEM are important in the present investigation in view of the low S/N ratio mentioned above.
The high operational mw frequency (~35 GHz) for the ESEEM experiments was selected to maximize the ESE signal (that increases with frequency as ν to ν2),54 and to ensure unobstructed direct observation of the 33S lines in the ESEEM spectra by moving the matrix proton lines to outside the target frequency range where the 33S lines are expected (approximately 0 – 30 MHz).22,33,55–57
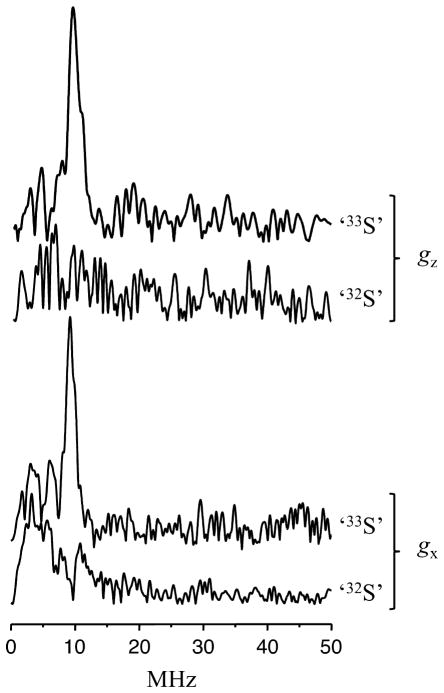
Examples of the spectra obtained by the Fourier transformation (FT) of the primary ESEEM time domain traces collected at the gz and gx EPR positions are presented in Figure 5. The spectra of ‘33S’ and ‘32S’ are distinctly different from one another (Figure 5). While the ESEEM spectrum of ‘32S’ is either indistinguishable from noise (at gz) or shows some broad lines in the low frequency region (at gx), the ESEEM spectrum of ‘33S’ displays a prominent narrow line situated at ~9.5 MHz. The amplitude of this line is about 1 – 1.5% of that of the ESE signal, and its frequency position varies only slightly with the magnetic field. The cosine FT spectra (not shown) reveal that this is a fundamental line, i.e. it corresponds to one of the transitions of 33S nuclear spin rather than to a linear combination of the transition frequencies. Thus, the interaction between the Mo(V) and the 33S nuclei of the labeled MPT within the SO active site has indeed been detected, but the extraction of the hfi and nqi parameters from a single transition in the 1D spectra is rather challenging. Therefore, we performed 2D experiments, which are generally more informative since they usually reveal correlations between spectral lines, thereby simplifying the interpretation and evaluation of the hfi and nqi parameters.
Figure 5.
Primary ESEEM spectra (amplitude FT) of ‘32S’ and ‘33S’ at the gz and gx positions, as designated in Figure 4. Experimental conditions: mw pulse durations, 12 ns; all other parameters are the same as in Figure 4.
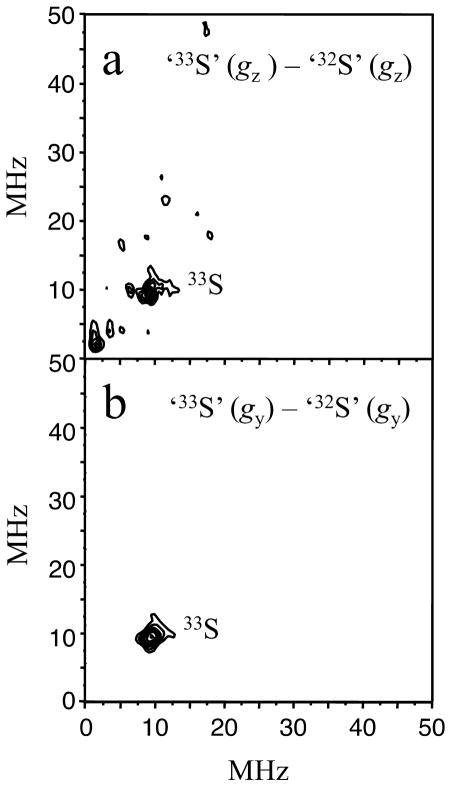
Examples of the 2D RP ESEEM spectra obtained for the ‘32S’ and ‘33S’ samples at the gx position, are presented in Figure 6. Taking the ‘32S’ spectrum (a) as a background and subtracting it from spectrum (b) of ‘33S’ gives the difference spectrum (c), containing only the Mo(V)-33S(MPT) magnetic interaction. The difference spectrum eliminates contributions from matrix protons, seen at ~47 MHz in (a) and (b), and from the associated Cl− (I = 3/2) ions, which are expected to occur at ~5.3 MHz in lpH SO.58 Figure 6c shows only one line that is observable above the noise level in the difference spectrum, and this line is situated on the main diagonal of the (++) quadrant at ~(9.5, 9.5) MHz. Similar spectra were obtained at the other two positions, gz and gy, as shown in Figure 7.
Figure 6.
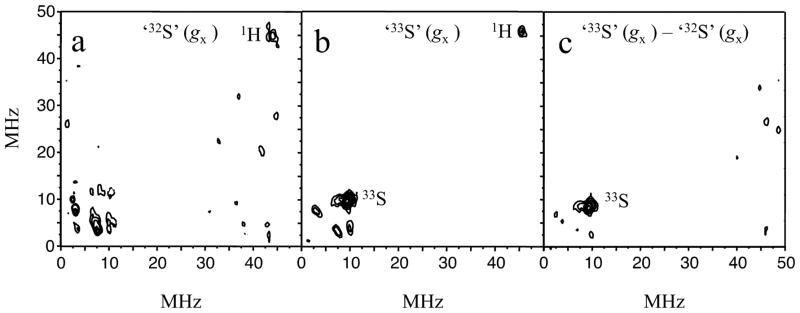
RP ESEEM spectra (amplitude FT) of ‘32S’ (a) and ‘33S’ (b) obtained at gx. The difference spectrum (c) clearly shows the feature at ~(10, 10) MHz originating from 33S. Experimental conditions: temperature, 21 K; π-pulse duration, 12 ns; mw frequency, 35.12 GHz.
Figure 7.
33S – 32S difference RP ESEEM spectra obtained at gz (a) and gy (b). The experimental conditions are the same as in Figure 6.
The 2D experiments confirmed the results of the 1D experiment and have also shown that the observed line is situated on the main diagonal of the (++) quadrant, with its position varying only slightly over the EPR spectrum. These observations allow a straightforward interpretation of the origin of this line and a subsequent evaluation of the 33S hfi and nqi parameters.
In accordance with the expressions derived by us for the energies and nuclear transition frequencies for I = 3/2 and strong nqi (as in the case of 33S),59 the spectral line having such properties can be assigned to the so-called inter-doublet transition. The ‘doublet’ designation here refers to a particular arrangement of the four eigenstates of the nuclear spin I = 3/2, which is realized in the case of strong nqi. Briefly, the eigenstates of the quadrupolar part of the spin Hamiltonian form two doublets, |±1/2〉 and |±3/2〉. The states within each doublet are degenerate. The energy difference between the doublets is approximately equal to χ/2 (where χ = e2qQ/h is the nuclear quadrupole coupling constant), and it corresponds to the inter-doublet transition frequency, νid. If the Zeeman and hyperfine interactions are taken into account, this energy diagram still remains approximately valid as long as the energy splittings within the doublets are much smaller than the inter-doublet splitting: 3(νI ± A/2) ≪ χ/2, where A is the hfi constant, and the factor of 3 on the left side of the inequality corresponds to the largest intra-doublet splitting, that within the |±3/2〉 doublet. Such a situation can be realized for both electron spin manifolds simultaneously if χ ≫ (νI, A). However, even if the latter condition is not satisfied, the strong nqi situation can still take place as a result of Zeeman – hfi cancellation in one of the electron spin manifolds, i.e. if |νI| ~ |A/2| (in which case either the 3(νI - A/2) ≪ χ/2 or 3(νI + A/2) ≪ χ/2 condition will be satisfied depending on the relative signs of νI and A).
Therefore, as a starting point, the quadrupole coupling constant of 33S in MPT can be estimated as χ ≈ 2νid ≈ 19 MHz. The Zeeman frequency of 33S at the magnetic field where the experiments were performed (Bo ~ 1.27 T) is νI ≈ 4.15 MHz, and thus the Zeeman – hfi cancellation condition is satisfied for A ≈ 2νI ≈ 8 MHz. The minimal anisotropic hfi (T⊥) can be evaluated as the ‘through space’ dipolar interaction between the electron spin centered on Mo(V) and the nuclear spin of 33S. The distance between Mo(V) and the sulfur of MPT is ~2.43 Å. Approximating the spin density on Mo(V) as ~80%, one can immediately estimate T⊥ as −0.34 MHz. This set of data, χ = 19 MHz, A ≈ 8 MHz, and T⊥ = −0.34 MHz can serve as a starting set for comprehensive numerical simulations to refine the hfi and nqi parameters.
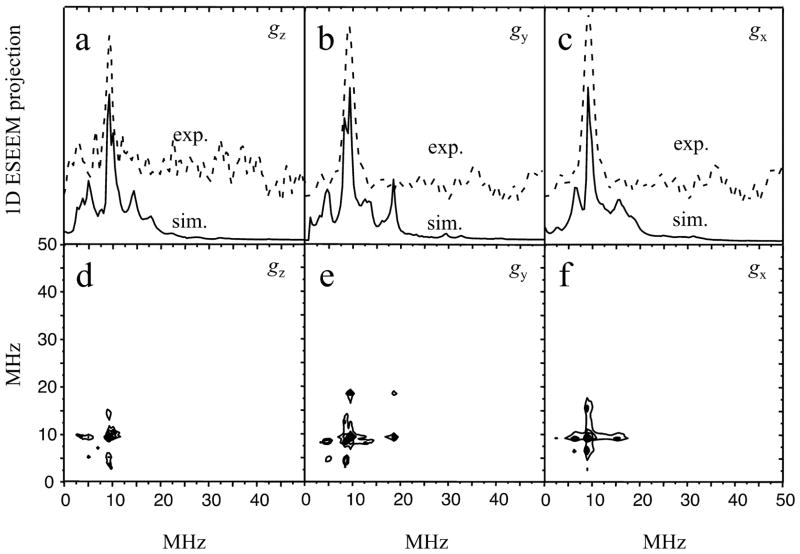
The simulations were performed using the program SimBud.60 Reasonable agreement between experimental and simulated spectra was achieved assuming that the hfi and nqi parameters of both 33S atoms of MPT are identical: aiso ≈ 3 MHz; rhombic tensor of anisotropic interaction T = (0, –1, 1) MHz with the axes aligned with those of the g-tensor; χ = 25 MHz; η (the asymmetry parameter of the nqi tensor) equal to 0.5; and Euler angles of the quadrupolar tensor in the g-frame, θ ≈ 40°; ϕ = ψ = 0° (Table 1). While these parameters are hardly unique, it should be noted that a departure from any of them in the simulations resulted in the following: (i) a large difference between the simulated and experimental positions of the νid line; (ii) a significant variation of νid as a function of the EPR for position; (iii) appearance of additional lines of comparable intensity. Some examples of the simulations of the RP ESEEM spectra are presented in Figure 8. In the contour plots, however, it is very difficult to observe differences between the experimental and simulated spectra due to the overlap. To facilitate comparisons, 1D projections of these spectra are also presented in Figure 8. They clearly show that the positions of the inter-doublet transition line in the simulated and experimental spectra are in good agreement with each other. The simulations also show additional lines of substantially lower intensities, which would be indistinguishable from noise under the experimental conditions.
Table 1.
Measured and calculated magnetic resonance parameters for SO with 33S-labeled MPT.
|
g-values
|
33S hfi / MHz
|
33S nqi
|
||||||||
|---|---|---|---|---|---|---|---|---|---|---|
| Species | gx | gy | gz | giso | (Axx, Ayy, Azz)b | aiso | e2Qq/h / MHz | η | ||
| 33S-labeled lpH wt SO | 1.965 | 1.971 | 2.003 | 1.980 | (0,−1,1) | 3 | 25 | 0.5 | ||
| DFT models |
|
θ = 120 | 1.950 | 1.968 | 1.988 | 1.969 | (−7.5, −3.2, 10.7) | 5.6 | 25.2 | 0.6 |
| θ = 150 | 1.962 | 1.975 | 2.008 | 1.982 | (−3.7, 0.1, 3.6) | 5.4 | 24.9 | 0.4 | ||
| aθ = 152 | 1.963 | 1.974 | 2.009 | 1.982 | (−3.5, 0.2, 3.3) | 4.3 | 24.9 | 0.4 | ||
| θ = 180 | 1.967 | 1.977 | 2.012 | 1.985 | (−2.8, −0.3, 3.1) | 5.7 | 24.6 | 0.5 | ||
| θ = 210 | 1.955 | 1.980 | 2.010 | 1.982 | (−9.6, −6.6, 16.2) | 7.4 | 24.4 | 0.6 | ||
| θ = 240 | 1.950 | 1.973 | 2.001 | 1.975 | (−13.8, −10.5, 24.4) | 6.3 | 25.6 | 0.8 | ||
Figure 8.
Panels a – c, 1D projections of the simulated (solid traces) and experimental (dashed traces) RP ESEEM spectra at gz, gy, and gx, respectively (the experimental 2D spectra are in Figures 6c and 7). The respective simulated RP ESEEM spectra are shown in plots d, e, and f. The simulation parameters are discussed in the text.
Analysis of the hfi and nqi parameters evaluated from the ESEEM simulations
From aiso ≈ 3 MHz (evaluated above), and taking the atomic isotropic hfi constant for an unpaired electron in a 3s orbital of 33S to be equal to 3,465 MHz,61 one can estimate the spin population of the sp2 hybrid orbital of the MPT sulfurs to be about 0.3%. With the atomic anisotropic hfi constant for the 3p orbital of T⊥3p ~ 100 MHz,61 such a spin population would result in T⊥ ≈ -0.23 MHz. Taking the “through-space” dipole interaction between Mo(V) and the nuclear spin of 33S into account (T⊥ ≈ −0.34 MHz), one can obtain the total T⊥ as large as ~ −0.6 MHz, which is quite comparable with the experimental data. However, our previous experience has shown that such simplistic evaluations, despite the lack of any obvious internal contradictions, are often not sufficiently complete to provide the information needed to describe either the molecular geometry of a system or details of spin population transfer from metal to ligand. Therefore, to complement the experimental results, while also providing a means for their interpretation, we employed modern DFT computational methods, specifically allowing the hfi and nqi parameters of 33S-labeled Moco in SO to be estimated as a function of structure, as described in the following section.
DFT analysis of the geometry and hfi and nqi parameters of the SO active site
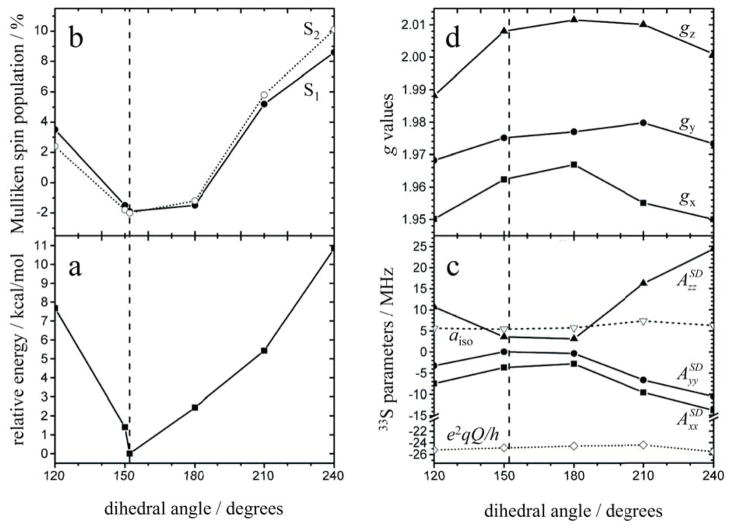
Single-point DFT calculations were carried out on a series of geometry-optimized models, prepared as described in the Materials and Methods section, in order to estimate relevant spectroscopic parameters of the labeled Mo(V) center for comparison with the experimentally obtained values. Figure 9 shows an overlay view of the computational models. The ball-and-stick structure represents the model that most closely corresponds to the cSO active site, and the other models are each shown as line structures. For the ball-and-stick structure in Figure 9, the MPT was constrained to its general position within the protein environment, but the geometry was otherwise relaxed. There is excellent agreement of the structural parameters of this model with those of the Moco within the SO protein (see Figure S3). This structure (θ = 152°) also represents the lowest-energy conformation of all of the models investigated within this work, as shown in Figure 10a. The five other models of Figure 9 (line structures) were prepared with the MPT dihedral angle artificially constrained to specific values between 120 – 240 degrees, thereby allowing the spectroscopic parameters of the active site (particularly for the 33S-labeled dithiolene S atoms) to be calculated as a function of the dihedral angle (Figure 10). It should be noted that the primary purpose of this effort was to predict the effect(s) of extreme structural changes on the relevant hfi and nqi parameters and that we are in no way implying that such conformations have any biological relevance.
Figure 9.
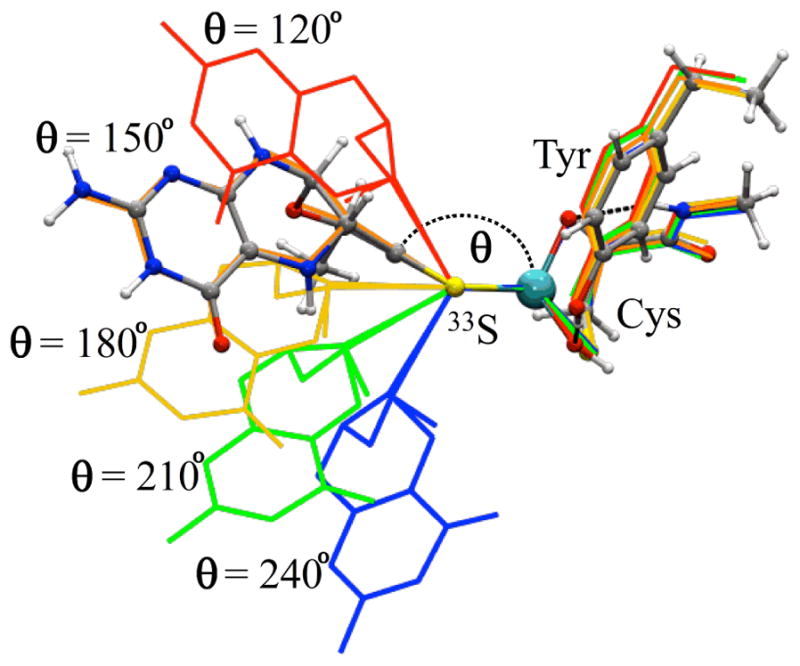
Overlay of the geometry-optimized models used for properties calculations (see Figures 10 – 11). The line figures show the structures where the MPT dihedral angle (θ ), defined in this work as the angle between Mo (cyan), a centroid between the dithiolene 33S atoms, and a centroid between the dithiolene C atoms, is constrained to exactly 120, 150, 180, 210, and 240 degrees (red, orange, yellow, green, and blue, respectively). The ball-and-stick model represents the minimum-energy active site structure (θ = ~152°). The relative single-point energy profile of the models and the atom coordinates of each are provided in Figure 10a and in the SI, respectively.
Figure 10.
Calculated (a) relative single-point energies of each of the computational models, (b) (Mulliken) spin populations of each of the MPT 33S atoms (33S1 and 33S2; see Figure S3), (c) 33S magnetic resonance parameters (aiso, hyperfine spin-dipole (SD) components, and the e2qQ/h values), and (d) g-values as a function of the dihedral angle (defined in Figure 9). The vertical dashed line indicates the dihedral angle corresponding to the minimum-energy structure (θ = 152°), which most closely represents the geometry of Moco within the native enzyme.
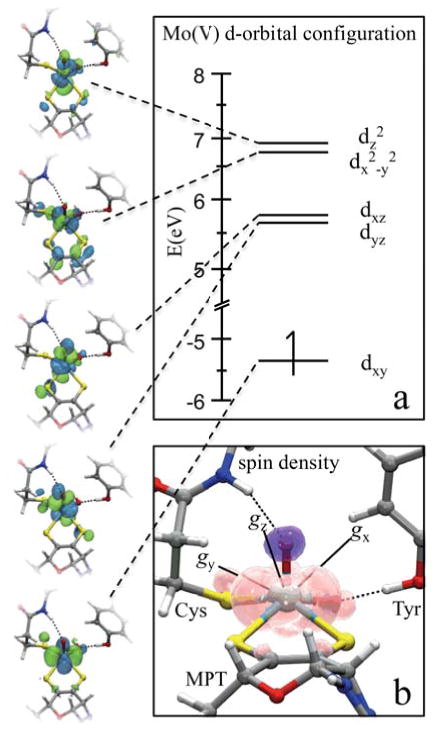
The electronic structures of Moco with the metal formally in the +4, +5, or +6 oxidation state have been reported previously within the context of the spectroscopy of model complexes relevant to various Mo and W enzymes,20,62–70 including work specifically addressing the MPT “fold angle”.20,67,69,71,72 Our calculations for Moco in the Mo(V) oxidation state are consistent with the results of those reports, which establish that oxo-Mo(V) centers have a doublet (S = 1/2) electronic ground state with the unpaired electron occupying the metal dxy orbital (Figure 11a).
Figure 11.
(a) The simplified d-orbital configuration and (b) the Mulliken spin density calculated for the optimized SO Mo(V) center. The orbital isosurfaces are displayed in green and blue, and the pink and purple surfaces in (b) represent areas of positive and negative spin density, respectively. The orientation of the g-axes is displayed with the origin placed at the center of the Mo(V).
A more detailed description of the electronic structure from the DFT calculations is provided in the SI. Figure S1 depicts the canonical Kohn-Sham (KS) orbitals for the optimized structure of the SO active site model. The overall orbital scheme is typical for a Mo(V) center with d1 configuration, and spin polarization effects are shown to stabilize the majority spin orbitals such that the singly-occupied molecular orbital (SOMO, 168α) is shifted below the highest occupied orbitals of mainly ligand character. As a result of strong intermixing between metal- and ligand-based orbitals, the dxy-character (in the chosen coordinate system) is spread over orbitals 168α and 169α (~26% Mo character in each orbital, see Table S1). KS orbital 168α mixes dxy character with the out-of-plane pz orbitals of the MPT S atoms, thereby providing a mechanism for the significant calculated 33S hfi anisotropy (Table 1). KS orbital 169α mixes dxy orbital character with the SV orbital of the coordinated cysteine. Previous DFT calculations have found similar Mo-S orbital interactions for the model [MoO(SCH3)(dithiolene)OH]− (dithiolene = SCHCHS), which features the same inner-sphere coordination environment as SO.70 However, we emphasize that the present work is the first report pertaining specifically to the hfi and nqi parameters of the dithiolene S atoms because labeling of these atoms had not been achieved prior to this work.73
Figure 11b shows significant spin density on the SCys atom from KS orbital 169α mixing dxy orbital character with the SV orbital of the coordinated cysteine. However, since the coordinated cysteine has naturally abundant sulfur, 32S (I = 0), it is not observed experimentally. Isotopic labeling of the coordinated Cys with 33S is not chemically or economically feasible, but for the optimized structure of Figure 9, 33SCys has a calculated aiso(33S) of ~3.7 MHz and e2qQ/h = −24.6 MHz. Previous spectroscopic and DFT studies of model oxo-Mo(V) thiolate compounds have shown the Mo-SR bond has significant covalency that is dependent upon the torsional angle of the coordinated SR group.63–66 However, it has not been feasible to label any of these model systems with 33S to obtain hfi and nqi parameters.
As described in the EPR results section above, 33S labeling of MPT allows the dithiolene S hyperfine coupling to be measured by EPR techniques, providing a direct estimate of the spin population on the S atoms. Figure 11b graphically shows the calculated (Mulliken) spin population and relative orientation of the g-axes at the SO active site (the lowest-energy model), and Figure 10b shows the spin population for each of the dithiolene 33S atoms as a function of the dihedral angle for all of the models investigated in this work. The spin populations calculated for each of the dithiolene 33S atoms in each model are essentially identical to one another, reflecting the near chemical equivalency of the sulfurs.74 Furthermore, in agreement with previous reports,20,72 our calculations predict a strong dependence of the spin population on the dihedral angle, which is due to an increase or decrease in the amount of overlap between the Mo d and S p orbitals. Here, we predict minimum spin population on the dithiolene sulfurs at dihedral angles between 150° – 180°. Within the maximum realistic range (based on the relative energies of the models and ignoring any protein interactions not explicitly mentioned above; θ ~ 140° – 200°), the spin population on the sulfurs can vary from about −2% to +3%. Thus, even modest structural differences around the sulfurs may result in measurable differences in the 33S hfi parameters.
Figure 10c shows the dependence of the calculated hfi and nqi parameters on the MPT dihedral angle. The 33S aiso value is only weakly dependent on the dihedral angle, and ranges from ~ 4 – 7 MHz for the models investigated, which is slightly larger than the experimental value of 3 MHz (Table 1) used in the simulations to fit the experimental data. The magnitudes of the calculated anisotropic hfi values for the 33S atoms are directly related to the calculated spin populations on the dithiolene sulfurs (Figure 10b) and the calculated spin-dipole (SD) components of the anisotropic hfi (Figure 10c). Between θ ~ 150° to 180°, neither of these contributors to the anisotropic 33S hfi vary significantly. However, outside this angular range, both contributors change substantially. For the optimized structure (θ = 152°, Table 1) and structures within the range of θ ~ 150° to 180°, the calculated 33S hfi values are similar to the 33S hfi estimated from the experimental data, although the magnitude of the calculated hfi appears to be overestimated.
The high sensitivity of the hfi results to the exact structure of the computational models or of the enzyme itself makes these parameters very difficult to predict with high accuracy. However, the 33S nqi parameter is a function the electric field gradient created by the local environment near the 33S nuclei. In our experience, this parameter has proven to be much easier to accurately model since it is less sensitive to minor structural variations. For each of the models investigated in this work, the 33S nqi is calculated to be on the order of ~25 MHz, which agrees well with the measured value of 25 MHz. Finally, there is excellent agreement between the calculated and measured g-values, especially for the θ = 152° model (Figure 10d and Table 1).
Conclusions
The elucidation of the biosynthetic pathway of the molybdenum cofactor has enabled direct incorporation of 33S-labeled sulfide into MPT itself using controlled in vitro synthesis with purified proteins to produce a catalytically active SO variant. The Mo(V) state of this variant at low pH has a typical lpH EPR spectrum. Although the CW and ESE detected EPR spectra for 33S (I = 3/2) and 32S (I = 0) samples are indistinguishable from one another, 1D and 2D ESEEM spectra at Ka band clearly reveal a coupling in the 33S-enriched SO variant that is absent in the 32S sample. These pulsed EPR data are the first direct measurements of the interaction of an unpaired electron on a metal center with the coordinating S atoms of a dithiolene ligand. Numerical simulations show that the 33S ESEEM spectra are dominated by the ‘inter-doublet’ transition arising from strong nqi, as has been observed previously for 33S-labeled sulfite bound to SO.59 The estimated experimental values for the 33S spectroscopic parameters found here are aiso = 3 MHz and e2Qq/h = 25 MHz.
Previous investigations of ESEEM spectra of quadrupolar nuclei in molybdenum enzymes have demonstrated the value of extended DFT calculations in which the surroundings of the Mo center extend significantly beyond the immediate coordination sphere of the metal. Such calculations enable preferred geometries and electronic structures of the Mo center to be explored and correlated with the calculated hfi and nqi parameters of the quadrupolar nuclei. The correlation of DFT results with experimental EPR results for enzymes is especially important for systems where isotopically labeled model compounds of known structure are not available for direct experimental comparison to biological systems, as in the present case of the dithiolene fragment of the MPT unit. The DFT calculations on the SO variant showed that the 33S quadrupole coupling constant, e2Qq/h, was essentially independent of the dihedral angle of the dithiolene unit, and the values (24 – 26 MHz) are in good agreement with experiment. The calculated values of the 33S hfi are indistinguishable for the two S atoms of the dithiolene fragment and vary little with the dihedral angle of the dithiolene unit (4.3 – 7.4 MHz). However, the calculated values are overestimated compared to the experimental ones. The DFT calculations also show spin polarization effects and strong intermixing between orbitals with Mo dxy character and the out-of-plane pz orbitals of the MPT S atoms, providing a possible mechanism for significant 33S hfi anisotropy. Additionally, this intermixing may be an important factor in the proposed role of the dithiolene unit of MPT in effective coupling into protein-mediated superexchange pathways for efficient electron transfer during catalysis.12,75
In summary, multi-dimensional, variable frequency pulsed EPR experiments are now routine for quadrupolar nuclei (I > ½). Correlation of the experimental EPR results with extended DFT calculations on structures that include surroundings and interactions of the active site can provide unique structural information pertinent to understanding the catalytic reaction. However, for less abundant magnetic nuclei, development of efficient methods for labeling specific atoms is a critical prerequisite for the pulsed EPR experiments. In this work, direct incorporation of 33S-labeled sulfide into MPT using an entire controlled in vitro synthesis with purified proteins provided an elegant method for isotopic labeling.
Supplementary Material
Acknowledgments
We gratefully acknowledge financial support of this research by the NIH (GM-37773 to J.H.E.), the Max Planck Society (to F.N.), the German Science Foundation (DFG) as well as Fonds der Chemischen Industrie (to G.S.). We thank the NSF (DBI-0139459, DBI-9604939, BIR-9224431) and the NIH (S10RR020959, S10RR026416-01) for grants for the development of the pulsed EPR facility at the University of Arizona. We thank Maurice van Gastel for helpful discussions.
References
- 1.Locke J, McCleverty JA, Wharton EJ, Winscom CJ. Chem Commun. 1966:677. [Google Scholar]
- 2.Basu P, Burgmayer SJN. Coord Chem Rev. 2011;255:1016. doi: 10.1016/j.ccr.2011.02.010. [DOI] [PMC free article] [PubMed] [Google Scholar]
- 3.Rothery RA, Stein B, Solomonson M, Kirk ML, Weiner JH. Proc Natl Acad Sci USA. 2012;109:14773. doi: 10.1073/pnas.1200671109. [DOI] [PMC free article] [PubMed] [Google Scholar]
- 4.Schrauzer GN, Mayweg V. J Am Chem Soc. 1962;84:3221. [Google Scholar]
- 5.Gray HB, Billig E. J Am Chem Soc. 1963;85:2019. [Google Scholar]
- 6.Davison A, Maki AH, Edelstein N, Holm RH. J Am Chem Soc. 1963;85:2029. [Google Scholar]
- 7.Eisenberg R, Gray HB. Inorg Chem. 2011;50:9741. doi: 10.1021/ic2011748. [DOI] [PubMed] [Google Scholar]
- 8.McCleverty JA. Progr Inorg Chem. 1968;10:49. [Google Scholar]
- 9.Shupack SI, Williams R, Gray HB, Billig E, Clark RJH. J Am Chem Soc. 1964;86:4594. [Google Scholar]
- 10.Davison A, Holm RH, Maki AH, Edelstein N. J Am Chem Soc. 1964;86:2799. [Google Scholar]
- 11.See for example, Kirk ML, McNaughton RL, Helton ME. Prog Inorg Chem. 2004;52:111. and references therein.
- 12.Inscore FE, McNaughton R, Westcott BL, Helton ME, Jones R, Dhawan IK, Enemark JH, Kirk ML. Inorg Chem. 1999;38:1401. [Google Scholar]
- 13.Izumi Y, Glaser T, Rose K, McMaster J, Basu P, Enemark JH, Hedman B, Hodgson KO, Solomon EI. J Am Chem Soc. 1999;121:10035. [Google Scholar]
- 14.Glaser T, Hedman B, Hodgson KO, Solomon EI. Accounts Chem Res. 2000;33:859. doi: 10.1021/ar990125c. [DOI] [PubMed] [Google Scholar]
- 15.Szilagyi RK, Lim BS, Glaser T, Holm RH, Hedman B, Hodgson KO, Solomon EI. J Am Chem Soc. 2003;125:9158. doi: 10.1021/ja029806k. [DOI] [PubMed] [Google Scholar]
- 16.Ray K, DeBeer-George S, Solomon EI, Wieghardt K, Neese F. Chem - Eur J. 2007;13:2783. doi: 10.1002/chem.200601425. [DOI] [PubMed] [Google Scholar]
- 17.Tenderholt AL, Szilagyi RK, Holm RH, Hodgson KO, Hedman B, Solomon EI. Inorg Chem. 2008;47:6382. doi: 10.1021/ic800494h. [DOI] [PMC free article] [PubMed] [Google Scholar]
- 18.Sproules S, Weyhermüller T, DeBeer S, Wieghardt K. Inorg Chem. 2010;49:5241. doi: 10.1021/ic100344f. [DOI] [PubMed] [Google Scholar]
- 19.Tenderholt AL, Wang JJ, Szilagyi RK, Holm RH, Hodgson KO, Hedman B, Solomon EI. J Am Chem Soc. 2010;132:8359. doi: 10.1021/ja910369c. [DOI] [PMC free article] [PubMed] [Google Scholar]
- 20.Wiebelhaus NJ, Cranswick MA, Klein EL, Lockett LT, Lichtenberger DL, Enemark JH. Inorg Chem. 2011;50:11021. doi: 10.1021/ic201566n. [DOI] [PMC free article] [PubMed] [Google Scholar]
- 21.Carducci MD, Brown C, Solomon EI, Enemark JH. J Am Chem Soc. 1994;116:11856. [Google Scholar]
- 22.Enemark JH, Astashkin AV, Raitsimring AM. In: Biological Magnetic Resonance. Hanson G, Berliner LJ, editors. Vol. 29. Springer; New York: 2010. p. 122. [DOI] [PMC free article] [PubMed] [Google Scholar]
- 23.Enemark JH, Astashkin AV, Raitsimring AM. Dalton Trans. 2006:3501. doi: 10.1039/b602919a. [DOI] [PubMed] [Google Scholar]
- 24.Klein EL, Astashkin AV, Raitsimring AM, Enemark JH. Coord Chem Rev. 2013;257:110. doi: 10.1016/j.ccr.2012.05.038. [DOI] [PMC free article] [PubMed] [Google Scholar]
- 25.Leimkühler S, Wuebbens MM, Rajagopalan KV. Coord Chem Rev. 2011;255:1129. doi: 10.1016/j.ccr.2010.12.003. [DOI] [PMC free article] [PubMed] [Google Scholar]
- 26.Schwarz G, Mendel RR, Ribbe MW. Nature. 2009;460:839. doi: 10.1038/nature08302. [DOI] [PubMed] [Google Scholar]
- 27.Mendel RR. J Biol Chem. 2013;288:13165. doi: 10.1074/jbc.R113.455311. [DOI] [PMC free article] [PubMed] [Google Scholar]
- 28.Belaidi AA, Schwarz G. Biochem J. 2013;450:149. doi: 10.1042/BJ20121078. [DOI] [PubMed] [Google Scholar]
- 29.Gutzke G, Fischer B, Mendel RR, Schwarz G. J Biol Chem. 2001;276:36268. doi: 10.1074/jbc.M105321200. [DOI] [PubMed] [Google Scholar]
- 30.Rivers SL, Mcnairn E, Blasco F, Giordano G, Boxer DH. Mol Microbiol. 1993;8:1071. doi: 10.1111/j.1365-2958.1993.tb01652.x. [DOI] [PubMed] [Google Scholar]
- 31.Santamaria-Araujo JA, Fischer B, Otte T, Nimtz M, Mendel RR, Wray V, Schwarz G. J Biol Chem. 2004;279:15994. doi: 10.1074/jbc.M311815200. [DOI] [PubMed] [Google Scholar]
- 32.Llamas A, Otte T, Multhaup G, Mendel RR, Schwarz G. J Biol Chem. 2006;281:18343. doi: 10.1074/jbc.M601415200. [DOI] [PubMed] [Google Scholar]
- 33.Astashkin AV, Enemark JH, Raitsimring AM. Concepts Magn Reson Part B (Magn Reson Engineering) 2006;29B:125. [Google Scholar]
- 34.Neese F. WIREs Comput Mol Sci. 2012;2:73. [Google Scholar]
- 35.Becke AD. Phys Rev A. 1988;38:3098. doi: 10.1103/physreva.38.3098. [DOI] [PubMed] [Google Scholar]
- 36.Perdew JP. Phys Rev B. 1986;33:8822. doi: 10.1103/physrevb.33.8822. [DOI] [PubMed] [Google Scholar]
- 37.Baerends EJ, Ellis DE, Ros P. Chem Phys. 1973;2:41. [Google Scholar]
- 38.Dunlap BI, Connolly JWD, Sabin JR. J Chem Phys. 1979;71:3396. [Google Scholar]
- 39.Becke AD. J Chem Phys. 1993;98:5648. [Google Scholar]
- 40.Lee C, Yang W, Parr RP. Phys Rev B. 1988;37:785. doi: 10.1103/physrevb.37.785. [DOI] [PubMed] [Google Scholar]
- 41.Schäfer A, Huber C, Ahlrichs R. J Chem Phys. 1994;100:5829. [Google Scholar]
- 42.Schäfer A, Horn H, Ahlrichs R. J Chem Phys. 1992;97:2571. [Google Scholar]
- 43.Weigend F, Haeser M, Patzelt H, Ahlrichs R. Universität Karlsruhe; Karlsruhe: 2006. [Google Scholar]
- 44.van Lenthe E, Baerends EJ, Snijders JG. J Chem Phys. 1993;99:4597. [Google Scholar]
- 45.van Wüllen C. J Chem Phys. 1998;109:392. [Google Scholar]
- 46.Klamt A, Schüürmann G. J Chem Soc, Perkin Trans 2. 1993;799 [Google Scholar]
- 47.Sinnecker S, Neese F. J Comput Chem. 2006;27:1463. doi: 10.1002/jcc.20426. [DOI] [PubMed] [Google Scholar]
- 48.Grimme S, Antony J, Ehrlich S, Krieg H. J Chem Phys. 2010;132 doi: 10.1063/1.3382344. [DOI] [PubMed] [Google Scholar]
- 49.Kisker C, Schindelin H, Pacheco A, Wehbi WA, Garrett RM, Rajagopalan KV, Enemark JH, Rees DC. Cell. 1997;91:973. doi: 10.1016/s0092-8674(00)80488-2. [DOI] [PubMed] [Google Scholar]
- 50.Figure 2 shows that the variant samples are all catalytically active; however, generation of the Mo(V) form involves reduction with excess sulfite followed by reoxidation with 0.5 equivalents of ferricyanide, as employed previously for plant SO [ Biochemistry. 2005;44:13274.]. The limited amounts of protein in the variant samples precluded optimization of the procedure to obtain the maximum Mo(V) EPR signal.
- 51.Astashkin AV, Raitsimring AM. J Magn Reson. 2000;143:280. doi: 10.1006/jmre.1999.1988. [DOI] [PubMed] [Google Scholar]
- 52.Astashkin AV, Mader ML, Pacheco A, Enemark JH, Raitsimring AM. J Am Chem Soc. 2000;122:5294. [Google Scholar]
- 53.Astashkin AV, Raitsimring AM, Kennedy AR, Shokhireva TK, Walker FA. J Phys Chem A. 2002;106:74. [Google Scholar]
- 54.Davoust CE, Doan PE, Hoffman BM. J Magn Reson A. 1996;119:38. [Google Scholar]
- 55.Astashkin AV, Johnson-Winters K, Klein EL, Byrne RS, Hille R, Raitsimring AM, Enemark JH. J Am Chem Soc. 2007;129:14800. doi: 10.1021/ja0704885. [DOI] [PMC free article] [PubMed] [Google Scholar]
- 56.Astashkin AV, Johnson-Winters K, Klein EL, Feng CJ, Wilson HL, Rajagopalan KV, Raitsimring AK, Enemark JH. J Am Chem Soc. 2008;130:8471. doi: 10.1021/ja801406f. [DOI] [PMC free article] [PubMed] [Google Scholar]
- 57.Klein EL, Raitsimring AM, Astashkin AV, Rajapakshe A, Johnson-Winters K, Arnold AR, Potapov A, Goldfarb D, Enemark JH. Inorg Chem. 2012;51:1408. doi: 10.1021/ic201643t. [DOI] [PMC free article] [PubMed] [Google Scholar]
- 58.Klein EL, Astashkin AV, Ganyushin D, Riplinger C, Johnson-Winters K, Neese F, Enemark JH. Inorg Chem. 2009;48:4743. doi: 10.1021/ic801787s. [DOI] [PMC free article] [PubMed] [Google Scholar]
- 59.Astashkin AV, Johnson-Winters K, Klein EL, Byrne RS, Hille R, Raitsimring AM, Enemark JH. J Am Chem Soc. 2007;129:14800. doi: 10.1021/ja0704885. [DOI] [PMC free article] [PubMed] [Google Scholar]
- 60.Astashkin AV. SimBud. A simple program to simulate various pulsed EPR experiments for systems with S = 1/2 and I = 0 through 9/2. http://www.cbc.arizona.edu/facilities/epr_facility_software.
- 61.Mabbs FE, Collison D. Electron paramagnetic resonance of d transition metal compounds. Elsevier; Amsterdam ; New York: 1992. [Google Scholar]
- 62.Sabel DM, Gewirth AA. Inorg Chem. 1994;33:148. [Google Scholar]
- 63.McNaughton RL, Tipton AA, Rubie ND, Conry RR, Kirk ML. Inorg Chem. 2000;39:5697. doi: 10.1021/ic0003729. [DOI] [PubMed] [Google Scholar]
- 64.McNaughton RL, Helton ME, Cosper MM, Enemark JH, Kirk ML. Inorg Chem. 2004;43:1625. doi: 10.1021/ic034206n. [DOI] [PubMed] [Google Scholar]
- 65.McNaughton RL, Mondal S, Nemykin VN, Basu P, Kirk ML. Inorg Chem. 2005;44:8216. doi: 10.1021/ic0482281. [DOI] [PubMed] [Google Scholar]
- 66.Peariso K, Helton ME, Duesler EN, Shadle SE, Kirk ML. Inorg Chem. 2007;46:1259. doi: 10.1021/ic061150z. [DOI] [PubMed] [Google Scholar]
- 67.Ryde U, Schulzke C, Starke K. J Biol Inorg Chem. 2009;14:1053. doi: 10.1007/s00775-009-0548-y. [DOI] [PMC free article] [PubMed] [Google Scholar]
- 68.Sempombe J, Stein B, Kirk ML. Inorg Chem. 2011;50:10919. doi: 10.1021/ic201477n. [DOI] [PMC free article] [PubMed] [Google Scholar]
- 69.Cranswick MA, Dawson A, Cooney JJA, Gruhn NE, Lichtenberger DL, Enemark JH. Inorg Chem. 2007;46:10639. doi: 10.1021/ic701338s. [DOI] [PMC free article] [PubMed] [Google Scholar]
- 70.Hernandez-Marin E, Seth M, Ziegler T. Inorg Chem. 2009;48:2880. doi: 10.1021/ic801875u. [DOI] [PubMed] [Google Scholar]
- 71.Drew SC, Young CG, Hanson GR. Inorg Chem. 2007;46:2388. doi: 10.1021/ic060586b. [DOI] [PubMed] [Google Scholar]
- 72.Lauher JW, Hoffmann R. J Am Chem Soc. 1976;98:1729. [Google Scholar]
- 73.Although only indirectly relevant to the present work, in the 1980s Bray and coworkers reported 33S hfi for the Mo(V) centers of xanthine oxidase (XO), obtained by replacing the labile sulfur atom with 33S-enriched sulfide [ Biochemistry. 1988;27:3603. doi: 10.1021/bi00410a011.Biochem J. 1984;218:961.Biochem J. 1980;191:265.Biochem J. 1981;199:629.]. Subsequently, Wedd and coworkers obtained 33S hfi parameters for Mo(V)=S and Mo(V)-SH units in model compounds [ J Am Chem Soc. 1991;113:6803.]. Furthermore, pulsed EPR at X- and Q-band with 33S labeling of the thiol of methyl-coenzyme M has shown Ni-S coordination in cofactor F430 [ J Am Chem Soc. 2003;125:4988.J Am Chem Soc. 2005;127:17744.].
- 74.This trend was also reflected in all of the other calculated parameters, and consequently the results for only one of the atoms (specifically that of 33S2; see Figure S3) will be presented henceforth.
- 75.Holm RH, Kennepohl P, Solomon EI. Chem Rev. 1996;96:2239. doi: 10.1021/cr9500390. [DOI] [PubMed] [Google Scholar]
Associated Data
This section collects any data citations, data availability statements, or supplementary materials included in this article.


