Abstract
Compound I from cytochrome P450 119 prepared by the photooxidation method involving peroxynitrite oxidation of the resting enzyme to Compound II followed by photooxidation to Compound I was compared to Compound I generated by m-chloroperoxybenzoic acid (MCPBA) oxidation of the resting enzyme. The two methods gave the same UV-visible spectra, the same products from oxidations of lauric acid and palmitic acid and their (ω-2,ω-2,ω-3,ω-3)-tetradeuterated analogues, and the same kinetics for oxidations of lauric acid and caprylic acid. The experimental identities between the transients produced by the two methods leave no doubt that the same Compound I speices is formed by the two methods.
Keywords: cytochrome P450, Compound I, spectra, oxidation, kinetics
Introduction
The cytochrome P450 enzymes (CYPs or P450s) are heme-containing enzymes with protein cysteine as the fifth ligand to iron. P450s are known in all types of organisms and catalyze a variety of reactions and most notably oxidations including energetically demanding hydroxylations of unactivated C-H bonds.[1] The reaction sequence of most P450s begins with reduction of the ferric resting enzyme, reaction of the ferrous form with oxygen, a second reduction, and a protonation to give a hydroperoxy-iron species. Subsequent reactions are fast such that no transient beyond the hydroperoxy-iron species has been detected under turnover conditions, but the active oxidant is widely believed to be an oxoiron(IV) porphyrin radical cation similar to the Compound I transients formed by reactions of peroxidase enzymes with hydrogen peroxide.[2]
Early model studies demonstrated that P450 models were activated by reactions with chemical oxidants.[3] Similarly, formation of P450 Compound I transients by chemical oxidation of P450s with hydroperoxy compounds, most notably m-chloroperoxybenzoic acid (MCPBA), was implicated soon after the discovery of P450s. For example hydroperoxide-dependent hydroxylations were observed for liver microsomal P450 in 1976.[4] UV-visible spectroscopic detection of transients ascribed to P450 Compounds I were reported from reactions of hydroperoxy compounds with CYP101 (P450cam),[5], CYP119,[6], and a CYP102 (P450BM-3) mutant.[7] More recently, Compound I from MCPBA oxidation of CYP119 was characterized by EPR and Mössbauer spectroscopies,[8] and this is the most well characterized P450 Compound I.[9]
An alternative approach to production of Compounds I involves one-electron photooxidation of the oxoiron(IV) neutral porphyrin species, the so-called Compound II transients of peroxidase chemistry. Known Compounds I and Compound I models were produced by photooxidations of Compound II from horseradish peroxidase, a Compound II analog from myoglobin, and a tetraarylporphyrinoxoiron(IV) species.[10] The method was extended to production of CYP119 Compound I[11] when Compound II was formed by the known method of reaction of the resting enzyme with peroxynitrite (PN).[12] Subsequently, Green and co-workers claimed that PN oxidized the P450 to a nitrosyl complex instead of Compound II,[13] but their claim was not consistent with the known stability of heme nitrosyl complexes. More specifically, their purported nitrosyl complex from CYP102, which was claimed to decompose in a few seconds,[13] was already known to be a very stable species that was isolated by chromatography, is indefinitely stable in anaerobic conditions, and decomposes over hours in aerobic conditions.[14] Based on the questionable conclusion that PN does not react with a P450 enzyme to give Compound II, Green and co-workers hypothesized that the photooxidation entry to P450 Compound I was not successful,[13, 15] but they did not perform experiments to test this hypothesis. In this work, we performed experiments that test the hypothesis and found that CYP119 Compound I formed by the photo-oxidation route is identical to Compound I formed by MCPBA oxidation in terms of the spectra, oxidation products, and kinetics of reactions.
Results and Discussion
UV-visible Spectra of CYP119 Compound I
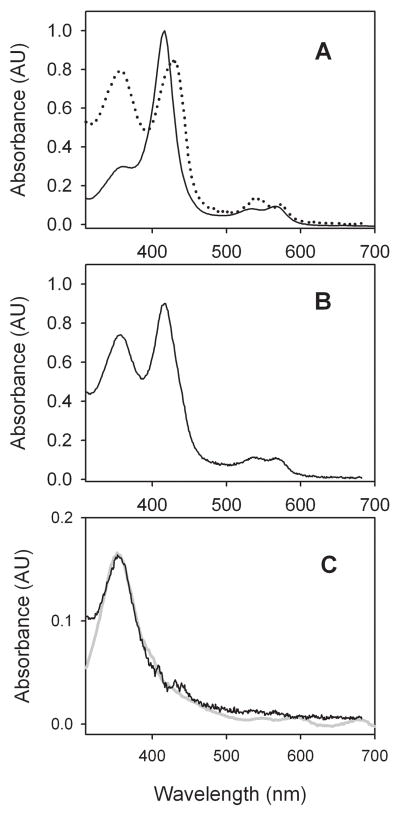
Compound I from CYP119 oxidation by MCPBA is the best documented P450 Compound I species. The UV-visible spectrum of the ferric enzyme is shown in Figure 1A. The purity of CYP119 can be evaluated by Rz value, which is the absorbance at λmax of the Soret band compared to the absorbance at 280 nm. For the studies in this work, the Rz value was 1.6–1.7 indicating high purity of the enzyme.[16]
Figure 1.
Spectra from CYP119 in 100 mM phosphate buffer (pH 7) solutions containing 50% glycerol. (A) Ferric enzyme (solid line) and Compound II (dotted line) from PN oxidation at −10 °C. (B) First-formed spectrum following irradiation of Compound II at ca. −40 °C. (C) Residual spectrum after subtraction of ferric enzyme and Compound II spectra from the first-formed spectrum in B (black line) and spectrum of CYP119 Compound I obtained by deconvolution of the time-resolved spectra from reaction of ferric CYP119 with MCPBA (grey line).
Reaction of CYP119 with PN gave the spectrum shown in Figure 1A as a dotted line. This spectrum has a λmax for the Soret band that is the same as that reported by Ullrich and co-workers for the Compound II complex of CYP102.[12] It is noteworthy that the UV-visible spectrum for the CYP102 nitrosyl complex reported by Quaroni et al. is not the same as that for the Compound II transient.[14]
Irradiation of the Compound II transient under bulk photolysis conditions was accomplished with a commercial spot lamp that delivered a calibrated light pulse through an optical gel waveguide, and the photolysis mixture was analyzed with a fiber-optics UV-visible spectrometer. Light from the spot lamp was filtered with either a 355 nm band-pass filter or a 400–500 nm band-pass filter with similar results. The bulk irradiations required 1–2 Joules to convert most of Compound II, which was accomplished in ca. 1–2 seconds. In order to limit decay of Compound I during the irradiation period for the spectral study, the photolysis was performed at ca. −40 °C, and the first-formed spectrum is shown in Figure 1B. This spectrum is similar to that previously reported for the first-formed species.[17]
The first-formed spectrum converts with time to the spectrum of the ferric protein,[17] and Green and co-workers have noted that the spectrum from the photolysis is most likely that of a mixture of species containing the ferric enzyme.[15] In fact, the spectrum in Figure 1B is a composite that can be simulated by combination of the spectra of resting enzyme (35%), Compound II (15%), and Compound I (50%). This is illustrated in Figure 1C where the spectra of resting enzyme and Compound II were subtracted from the spectrum in Figure 1B to give the spectrum of Compound I. The spectrum of CYP119 Compound I obtained by deconvolution of the time-resolved spectra from reaction of CYP119 with MCPBA as described previously[8] is also shown in Figure 1C (grey line). The estimate that the photolysis gives ca. 50% conversion to Compound I obtained from the spectrum is consistent with the product yield studies in this work (see below) and those previously reported for oxidations of styrene and benzyl alcohol.[17]
Products from oxidations by CYP119 Compound I
The yields of oxidation products from reactions of lauric acid and palmitc acid with CYP119 Compound I prepared by the two methods were compared. CYP119 oxidizes these fatty acids primarily at the ω-1, ω-2, and ω-3 positions at pH 7.0,[18] although the regioselectivity is pH dependent as we recently demonstrated.[19] In these comparison studies, we generated Compound I at 4 °C in the presence of the substrates in 100 mM phosphate buffer at pH 7.0, and the product mixtures were treated with diazomethane to give the methyl esters that were analyzed by GC for quantification. For identification purposes, the methyl esters of the hydroxylated products were further functionalized by conversion to the O-trimethylsilyl derivatives that were analyzed by GC-mass spectrometry.
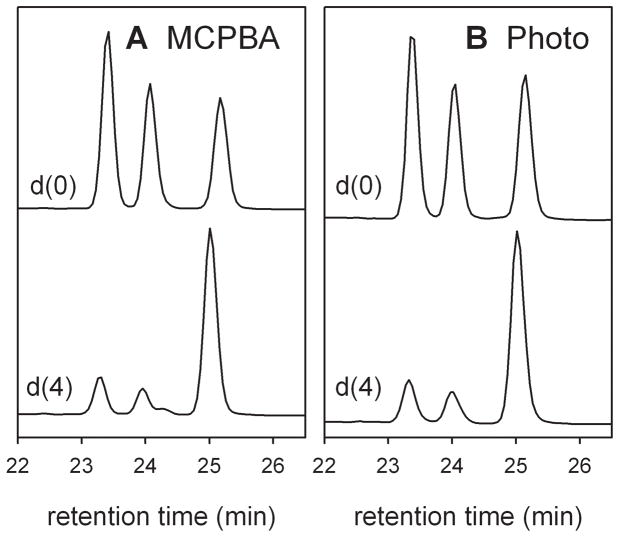
Oxidations of lauric acid by CYP119 Compound I generated by both methods gave 9-hydroxy-, 10-hydroxy-, and 11-hydroxydodecanoic acid in comparable amounts (Figure 2) and in comparable yields of 41% for the photooxidation reaction and 44% for the MCPBA mixing reaction. A more subtle comparison of the methods was provided by oxidation of 9,9,10,10-tetradeuteriododecanoic acid (lauric acid-d4). Formations of the C9 and C10 alcohol products were suppressed by intramolecular kinetic isotope effects (KIEs), and the C11-hydroxylated product dominated (Figure 2). The average intramolecular KIEs were determined by the comparing the sum of the C9 and C10 alcohol products relative to the C11 product for lauric acid-d0 and lauric acid-d4 according to Equation 1 where the alcohol products are represented by the carbon number of the hydroxy group and the substrate is identified by the subscript. For Compound I generated by MCPBA oxidation, the intramolecular KIE determined by this method was 6.4, and, for Compound I generated by photooxidation, the intramolecular KIE was 6.6. These values are consistent with classical primary H-D KIEs at 4 °C.[20]
Figure 2.
GC traces of methyl esters of oxidation products from lauric acid-d0 and −d4. A. CYP119 Compound I produced by MCPBA oxidation of the ferric enzyme. B. CYP119 Compound I prepared by photo-oxidation. The order of elution for the methyl esters is 9-hydroxy, 10-hydroxy, 11-hydroxy.
| (1) |
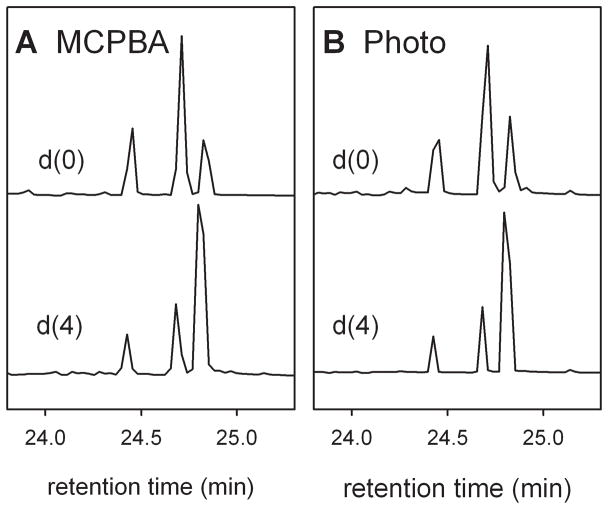
Oxidations of palmitic acid by Compounds I produced by the two methods at 4 °C in 100 mM phosphate buffer (pH 7.0) also were similar. Figure 3 shows results for oxidations of hexadecanoic acid (palmitic acid-d0) and 13,13,14,14-tetradeuteriohexadecanoic acid (palmitic acid-d4). The results in Figure 3 are for the methyl esters of the O-trimethylsilylated alcohol products analyzed on a low polarity GC column with mass spectroscopic detection. For palmitic acid-d0, the ω-2 product was formed in about twice the yield of the ω-1 and ω-3 products, and the total yield was 43% for Compound I generated by MCPBA oxidation and 47% for Compound I generated by photooxidation. As with lauric acid, production of the ω-2 and ω-3 products was suppressed in oxidations of the tetradeuterated substrate. The average intramolecular KIEs calculated from Eq 1 were 5.9 for Compound I produced by MCPBA oxidation and 5.6 for Compound I produced by photooxidation.
Figure 3.
GC-mass spectral traces of methyl ester O-trimethylsilylated alcohol products from oxidations of palmitc acid-d0 and −d4. A. Oxidations with Compound I from MCPBA oxidation of the resting enzyme. B. Oxidations with Compound I from photooxidation. The elution order is 13-hydroxy-, 14-hydroxy-, 15-hydroxy-.
The regioselectivity of lauric acid oxidation by CYP119 varies with reaction conditions. Ortiz de Montellano and co-workers reported that an enzyme mixture containing CYP119 and putidaredoxin and putidaredoxin reductase (the supporting reductase and electron transfer enzymes for P450cam) in 50 mM Tris buffer (pH 7.0) gave predominantly the ω-1 (70%) and ω-2 (22%) alcohol products.[16] Green and co-worker reported that MCPBA-generated Compound I from CYP119 in 100 mM phosphate buffer (pH 7) gave mainly the ω-1 and ω-2 alcohol products in approximately equal amounts.[8] Our results for MCPBA-generated Compound I from CYP119 in 100 mM phosphate buffer (pH 7.0) were formation of approximately equal amounts of the ω-1, ω-2, and ω-3 alcohols (Figure 2). When we changed the reaction conditions to 100 mM phosphate buffer at pH = 7.4, however, we obtaining the ω-1 and ω-2 alcohols in a 2:1 ratio along with a trace of the ω-3 alcohol.[19] The pH dependence of the regioselectivity correlates with a pH dependence of kinetics[19] as discussed briefly below.
Kinetic Studies
In our view, the key physical property for comparison of the Compounds I generated by the two methods is reactivity of the transient or, more correctly, rate constants for reactions. The two methods are not well suited for direct kinetic comparisons, however. Compound I produced by photooxidation must be long-lived enough such that a substantial amount remains present after the photolysis reaction, which in our apparatus for bulk photolysis requires 1–2 seconds. In practice, this requires low temperatures, but very low temperatures cannot be studied readily in the stopped-flow mixing apparatus due to differences in the coefficients of expansion of the glass syringe barrels and the Teflon plungers. Despite these limitations, we found that we can obtain kinetics from Compound I generated by both methods at ca. −5 °C as long as relatively slow reaction conditions of Compound I are studied.
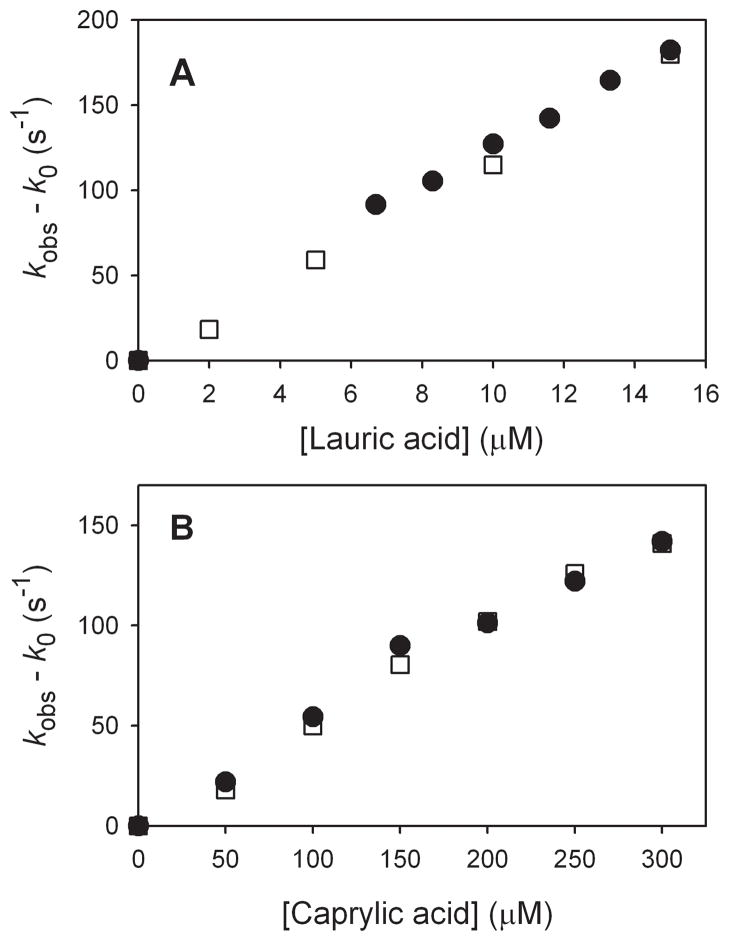
In order to demonstrate that our stopped-flow kinetic methods are the same as those used by Green and co-worker,[8] we studied two of the same reactions, oxidations of lauric acid and caprylic acid. As discussed previously,[8, 18] reactions of CYP119 Compound I with fatty acids are described by Scheme 1. The initially formed ensemble of substrate with activated enzyme, [E*Sub]1, isomerizes to a reactive ensemble, [E*Sub]2, as indicated by the absence of intermolecular kinetic isotope effects (KIEs) for oxidations of fatty acids with 12 or more carbon atoms.[8, 18–19] Under conditions where the reactions are adequately slow, saturation kinetics is observed for these reactions, [18–19] but apparent second-order kinetics are found when reactions are so fast that only a small concentration range of substrates can be studied.[8, 19] We recently demonstrated that the rate constants for reactions of CYP119 Compound I with fatty acids are pH-dependent with the rate constants increasing as the pH is raised with a greater than third-order dependence on the concentration of hydroxide.[19] Rittle and Green reported rate constants for reactions of caprylic acid and lauric acid at low substrate concentration,[8] and we matched their results.[19] Figure 4 shows the results of the two studies plotted together. For lauric acid, the apparent second-order rate constants were kapp = (1.21 ± 0.06) × 107 M−1 s−1 and kapp = (1.20 ± 0.05) × 107 M−1 s−1 (this work), where errors are at 2σ. For caprylic acid, the apparent second-order rate constants were kapp = (4.8 ± 0.6) × 105 M−1 s−1 and kapp = (4.9 ± 0.6) × 105 M−1 s−1 (this work). The results are experimentally indistinguishable and demonstrate that the MCPBA kinetic methods are the same in the two works.
Scheme 1.
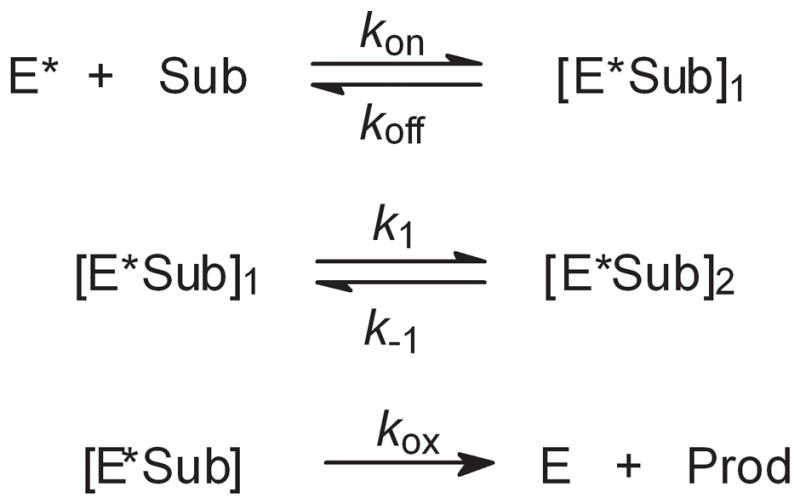
Figure 4.
Observed rate constants for reactions of CYP119 Compound I in 100 mM phosphate buffer at low substrate concentrations of lauric acid (top) and caprylic acid (bottom). The values reported by Rittle and Green (ref [8]) are shown as solid circles, and the values obtained in our laboratory (ref [18]) are shown as open squares.
In order to compare kinetic results of MCPBA oxidations directly with those from photooxidations, we were required to work at the “slow” end of the kinetic range because the photolysis requires 1–2 seconds. This was accomplished by reducing the reaction temperature to −5 °C, working at a pH of 7.0, and using a solvent that is 50% glycerol to prevent freezing.[19] Under these conditions, saturation kinetics could be observed in some cases, and the results for saturation kinetics were analyzed in terms of Eq 2 where kobs is the observed rate constant, k0 is the rate constant for the background reaction in the absence of substrate, Kbind is the apparent binding constant, kexp is the experimental first-order rate constant, and [Sub] is the concentration of substrate. Note that Kbind = kon/(koff + kexp).
| (2) |
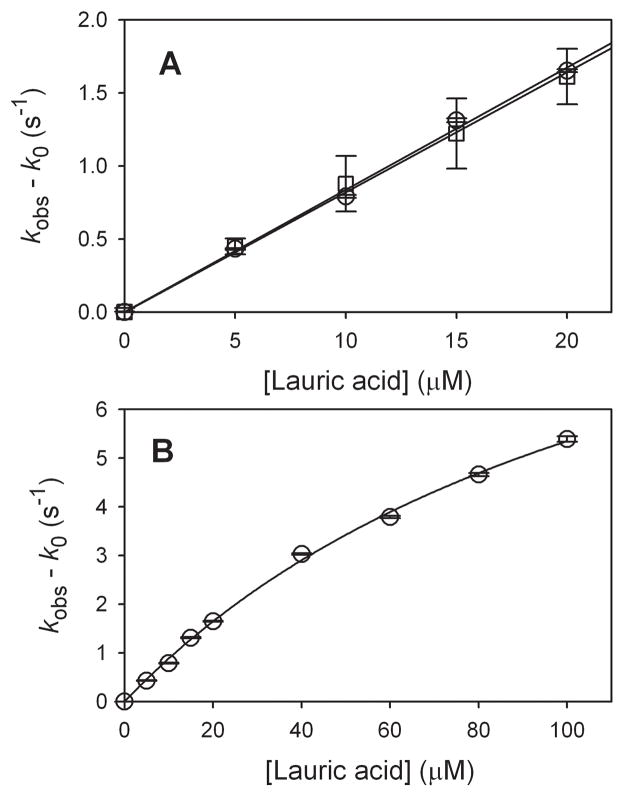
The results of studies of oxidations of lauric acid at −5 °C in 100 mM phosphate buffer (pH 7.0) with 50% glycerol are shown in Figure 5. At low substrate concentrations (≤ 20 μM, Figure 5A), the data fit a linear function well. The MCPBA oxidation data gave an apparent second-order rate constant of kapp = (8.4 ± 0.6) × 104 M−1 s−1, and the photooxidation data gave kapp = (8.0 ± 0.5) × 104 M−1 s−1 (errors at 2σ). Thus, there is no experimental difference for the two methods of generation of Compound I. At higher concentrations of lauric acid (Figure 5B), the data shows the curvature from saturation kinetics, and this data was solved by Eq 2 to give Kbind = (7.8 ± 1.4) × 103 M−1 and kexp = (12.2 ± 1.6) s−1.
Figure 5.
Kinetic results at for oxidations of lauric acid at −5 °C in 100 mM phosphate buffer (pH 7.0) containing 50% glycerol. (A) Comparison of MCPBA oxidations (circles) and photooxidations (squares) at low lauric acid concentrations. (B) Results from MCPBA oxidations at high concentrations. Error bars are at 1σ. The lines are the fits for apparent second-order rate constants in A or for the saturateion kinetic parameters in the text in B.
Caprylic acid reactions with CYP119 Compound I are slower than lauric acid reactions,[8, 18] and we were able to study both MCPBA and photooxidation conditions with up to 300 μM substrate in 100 mM phosphate buffer (pH 7.0) with 50% glycerol at −5 °C. Saturation kinetics were apparent for both methods as shown in Figure 6. For Compound I from MCPBA oxidations, the results give Kbind = (1.5 ± 0.4) × 103 M−1 and kexp = (2.6 ± 0.6) s−1. For reactions of Compound I from the photooxidations, the results give Kbind = (1.3 ± 0.3) × 103 M−1 and kexp = (2.8 ± 0.6) s−1. Once again, there is no experimental difference for generation of Compound I by the two methods.
Figure 6.
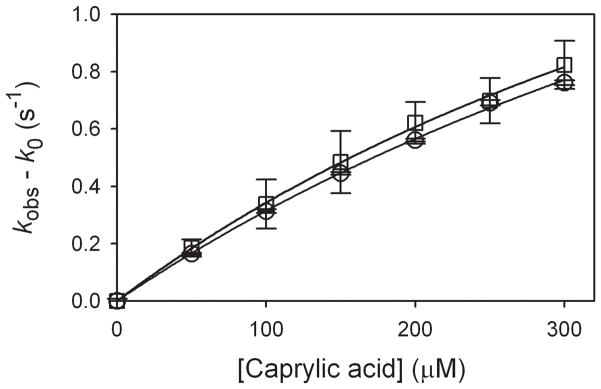
Results from oxidations of caprylic acid at −5 °C in 100 mM phosphate buffer (pH 7.0) containing 50% glycerol. The circles are for Compound I generated by MCPBA oxidation, and the squares are for Compound I generated by photooxidation. The lines show the fits for the kinetic parameters listed in the text.
Conclusion
We have demonstrated in this work that CYP119 Compound I produced by the photooxidation method is identical to Compound I produced by MCPBA oxidation of the enzyme in terms of the UV-visible spectra, the products of oxidations of lauric and palmitic acids, and the kinetics of oxidations of lauric and caprylic acids. CYP119 Compound I is the most thoroughly characterized P450 Compound I, and we conclude that the photooxidation pathway does indeed give Compound I as initially reported.[11] The claim by Green and co-workers that the PN--photooxidation method does not give CYP119 Compound I was conjecture in a paper that did not test the hypothesis.[15] The only “evidence” that the photooxidation does not give Compound I is a claim that PN--photooxidation reaction with CYP102 gave a nitrosyl complex intead of Compound II,[13] but that report is almost certainly not correct given that the authors further claim that their purported CYP102 nitrosyl complex[13] is thousands of times more reactive than authentic CYP102 nitrosyl complex that was isolated by chromatography.[14]
Experimental Section
Materials
MCPBA (Sigma-Aldrich) was recrystallized before use. Sodium peroxynitrite solutions were prepared by the method of Uppu and Pryor.[21]
Cytochrome P450 119 (CYP119) was expressed in E. coli and purified by the method of Koo et al.[16] The isolated enzyme had an Rz value (ratio of absorbance at λmax of the Soret band to that at 280 nm of 1.6 to 1.7 indicating high purity.[16]
Substrates
Octanoic (caprylic) acid, dodecanoic (lauric) acid, and hexadecanoic (palmitic) acid were commercial samples (Sigma-Aldrich) that were used as obtained. The preparation of 9,9,10,10-tetradeuteriododecanoic acid was briefly described,[18] and 13,13,14,14-tetradeuteriohexadecanoic acid was prepared by a similar method; details of the preparation of these labeled substrates have been submitted for publication.[22]
Oxidation products
Bulk oxidations with MCPBA-generated Compound I were conducted by treating CYP119 (1 nmol) and substrate (1 mmol) in 1 mL of 100 mM phosphate buffer (pH 7.0) at 4 °C with MCPBA (10 nmol). After 10 min, the reaction was quenched by addition of dilute HCl to bring the solution to pH 1, and the mixture was extracted with CH2Cl2 (15 mL). The combined CH2Cl2 phases were dried (MgSO4), and internal standard was added, and the mixture was treated with excess diazomethane in ether. The resulting mixture of methyl esters was analyzed by GC on a Carbowax 20M bonded phase column for quantitation. For identification purposes, the mixture of methyl esters of the hydroxylated products was treated with excess N-methyl-N-trimethylsilylacetamide to give the O-trimethylsilyl derivatives that were analyzed by GC-mass spectrometry on a DB5 bonded phase column. The fragmentation patterns for both the lauric acid derivatives[16] and the palmitic acid derivatives[23] were previously reported. The ω-1, ω-2, and ω-3 hydroxylated products predominated at pH 7.0 (Figures 2 and 3) as previously reported.[19]
Bulk oxidations with photo-oxidation generated Compound I were conducted by adding peroxynitrite solution (150 nmol of PN) to CYP119 (10 nmol) and substrate (1 mmol) in 1 mL of 100 mM phosphate buffer (pH 7.0) at 4 °C. Decay of excess PN was monitored at 308 nm. When PN decay was complete, the mixture was photolyzed with 5 J of 400–500 nm light, which depleted CYP119 Compound II. The reaction mixtures were worked up and analyzed as described above. Control reactions demonstrated that no oxidation products were formed when the enzyme, the PN, or the light were omitted.
Kinetic Studies
The methods for kinetic studies with MCPBA oxidations were the same as previously.[18] In brief, the oxidations were conducted in a four-syringe stopped-flow mixing unit held at 4 °C or −5 °C with either diode-array detection or (better) photo-multiplier detection with monochromatic light. Equal volumes of buffered solutions of the enzyme (20 μM) and MCPBA (20 μM) were mixed in the first push of the stopped-flow unit, aged for 100 ms, and then mixed with a buffered solution containing substrate at varying concentrations. The growth of signal at λ = 416 (λmax of the ferric protein) was followed, and the data was solved as a first-order growth to give kobs. Plots of kobs − k0 (background reaction) versus substrate concentration are shown in the text. Apparently linear data was solved for an apparent second-order rate constant, and saturation kinetic data was solved according to Eq 2.
The methods and apparatus for kinetic studies with photooxidation were the same as those previously reported for low temperature bulk photolyses.[17–18, 24] In brief, the enzyme solution containing substrate was treated with ca. 15 equivalents of PN, and PN decay was monitored at 308 nm. When PN decay was complete, the mixture was irradiated with 1–2 J of 400–500 nm light delivered in 1–2 s. Growth of signal at λ = 416 nm was followed.
Acknowledgments
This work was supported in part by a grant from the National Institutes of Health (GM-48722).
References
- 1.a) Ortiz de Montellano PR. Cytochrome P450 Structure, Mechanism, and Biochemistry. 3. Kluwer; New York: 2005. [Google Scholar]; b) Ortiz de Montellano PR. Chem Rev. 2010;110:932–948. doi: 10.1021/cr9002193. [DOI] [PMC free article] [PubMed] [Google Scholar]
- 2.Sono M, Roach MP, Coulter ED, Dawson JH. Chem Rev. 1996;96:2841–2887. doi: 10.1021/cr9500500. [DOI] [PubMed] [Google Scholar]
- 3.a) Groves JT, JT . In: Cytochrome P450 Structure, Mechanism, and Biochemistry. 3. Ortiz de Montellano PR, editor. Kluwer; New York: 2005. pp. 1–43. [Google Scholar]; b) Meunier B. Chem Rev. 1992;92:1411–1456. [Google Scholar]
- 4.Nordblom GD, White RE, Coon MJ. Arch Biochem Biophys. 1976;175:524–533. doi: 10.1016/0003-9861(76)90541-5. [DOI] [PubMed] [Google Scholar]
- 5.Egawa T, Shimada H, Ishimura Y. Biochem Biophys Res Commun. 1994;201:1464–1469. doi: 10.1006/bbrc.1994.1868. [DOI] [PubMed] [Google Scholar]
- 6.Kellner DG, Hung SC, Weiss KE, Sligar SG. J Biol Chem. 2002;277:9641–9644. doi: 10.1074/jbc.C100745200. [DOI] [PubMed] [Google Scholar]
- 7.Raner GM, Thompson JI, Haddy A, Tangham V, Bynum N, Reddy GR, Ballou DP, Dawson JH. J Inorg Biochem. 2006;100:2045–2053. doi: 10.1016/j.jinorgbio.2006.09.025. [DOI] [PubMed] [Google Scholar]
- 8.Rittle J, Green MT. Science. 2010;330:933–937. doi: 10.1126/science.1193478. [DOI] [PubMed] [Google Scholar]
- 9.Jung C, de Vries S, Schünemann V. Arch Biochem Biophys. 2011;507:44–55. doi: 10.1016/j.abb.2010.12.029. [DOI] [PubMed] [Google Scholar]
- 10.Zhang R, Chandrasena REP, Martinez E, Horner JH, Newcomb M. Org Lett. 2005;7:1193–1195. doi: 10.1021/ol050296j. [DOI] [PubMed] [Google Scholar]
- 11.Newcomb M, Zhang R, Chandrasena REP, Halgrimson JA, Horner JH, Makris TM, Sligar SG. J Am Chem Soc. 2006;128:4580–4581. doi: 10.1021/ja060048y. [DOI] [PMC free article] [PubMed] [Google Scholar]
- 12.Daiber A, Herold S, Schoneich C, Namgaladze D, Peterson JA, Ullrich V. Eur J Biochem. 2000;267:6729–6739. doi: 10.1046/j.1432-1033.2000.01768.x. [DOI] [PubMed] [Google Scholar]
- 13.Behan RK, Hoffart LM, Stone KL, Krebs C, Green MT. J Am Chem Soc. 2007;129:5855–5859. doi: 10.1021/ja064590y. [DOI] [PubMed] [Google Scholar]
- 14.Quaroni LG, Seward HE, McLean KJ, Girvan HM, Ost TWB, Noble MA, Kelly SM, Price NC, Cheesman MR, Smith WE, Munro AW. Biochemistry. 2004;43:16416–16431. doi: 10.1021/bi049163g. [DOI] [PubMed] [Google Scholar]
- 15.Rittle J, Younker JM, Green MT. Inorg Chem. 2010;49:3610–3617. doi: 10.1021/ic902062d. [DOI] [PubMed] [Google Scholar]
- 16.Koo LS, Immoos CE, Cohen MS, Farmer PJ, Ortiz de Montellano PR. J Am Chem Soc. 2002;124:5684–5691. doi: 10.1021/ja017174g. [DOI] [PubMed] [Google Scholar]
- 17.Yuan XT, Wang Q, Horner JH, Sheng X, Newcomb M. Biochemistry. 2009;48:9140–9146. doi: 10.1021/bi901258m. [DOI] [PMC free article] [PubMed] [Google Scholar]
- 18.Su Z, Chen X, Horner JH, Newcomb M. Chem Eur J. 2012;18:2472–2476. doi: 10.1002/chem.201103170. [DOI] [PubMed] [Google Scholar]
- 19.Su Z, Horner JH, Newcomb M. ChemBioChem. 2012;13:0000–0000. doi: 10.1002/cbic.201200387. [DOI] [PMC free article] [PubMed] [Google Scholar]
- 20.Kwart H. Acc Chem Res. 1982;15:401–408. [Google Scholar]
- 21.Uppu RM, Pryor WA. Anal Biochem. 1996;236:242–249. [PubMed] [Google Scholar]
- 22.Horner JH, Newcomb M. submitted for publication. [Google Scholar]
- 23.Nicolaides N, Soukup VG, Ruth EC. Biomed Mass Spec. 1983;10:441–449. [Google Scholar]
- 24.Wang Q, Sheng X, Horner JH, Newcomb M. J Am Chem Soc. 2009;131:10629–10636. doi: 10.1021/ja9031105. [DOI] [PMC free article] [PubMed] [Google Scholar]


