Abstract
Mass transport by diffusion within composite materials may depend not only on internal microstructural geometry, but also on the chemical interactions between the transported substance and the material of the microstructure. Retrospectively, there is a gap in methods and theory to connect material microstructure properties with macroscale continuum diffusion characteristics. Here we present a new hierarchical multiscale model for diffusion within composite materials that couples material microstructural geometry and interactions between diffusing particles and the material matrix. This model, which bridges molecular dynamics (MD) and the finite element (FE) method, is employed to construct a continuum diffusion model based on a novel numerical homogenization procedure. The procedure is general and robust for evaluating constitutive material parameters of the continuum model. These parameters include the traditional bulk diffusion coefficients and, additionally, the distances from the solid surface accounting for surface interaction effects. We implemented our models to glucose diffusion through the following two geometrical/material configurations: tightly packed silica nanospheres, and a complex fibrous structure surrounding nanospheres. Then, rhodamine 6G diffusion analysis through an aga-rose gel network was performed, followed by a model validation using our experimental results. The microstructural model, numerical homogenization and continuum model offer a new platform for modeling and predicting mass diffusion through complex biological environment and within composite materials that are used in a wide range of applications, like drug delivery and nanoporous catalysts.
Keywords: Diffusion, Multiscale, Homogenization, Composite media, Finite element method, Molecular dynamics
1. Introduction
Transport phenomena involving diffusion are commonly encountered in nature [1,2], in various technological processes [3,4] and biological systems [5,6], and thus have been thoroughly studied. Most of the research has focused on the macro-scale, where fundamental laws, such as Fick's or Darcy's law, describe movement of a given substance through a medium. Motion of solute particles through pores formed by complex microstructure may be affected not only by the solid pore boundaries, which dictate particle trajectories, but also by the physico-chemical interactions between the particles and solid surface occurring at the molecular level. The interactions between the diffusing substance and the surface become important and can profoundly affect overall diffusion when the spatial dimensions bounding diffusion are comparable to the diffusing particles or molecules [7,8]. Under these circumstances Fick's law alone cannot accurately describe diffusion and the surface interaction at the molecular level must be taken into account. Further in this study, we term Fickian diffusion as diffusion without surface interaction. The molecular dynamics (MD) technique enables the examination of diffusion with surface effects, where interactions at the atomistic and molecular level can be evaluated. Although MD is a widely employed and is extremely powerful tool, due to the exorbitantly large number of interactions needed to be considered, it can become impractical for even a small domain (on the order of micrometers). As technological breakthroughs, such as quantum computing, increase the computational power, it may one day become possible to perform large-scale MD simulations for practical applications. Until then, a computationally feasible method is needed to bridge the nano- and macroscale descriptions in order to model real-world complex diffusion processes.
In this study we present several new concepts. We first introduce a multiscale hierarchical model for diffusion at the microstructural level (further termed as ‘microstructural model’), within a small reference volume (RV). The implemented method is effective, robust, and generalizable to a variety of problems where diffusion governs transport. The method presented here can be easily expanded to include multiple molecule types (e.g. proteins, drugs), multiple surfaces (e.g. cells with different ligands/receptors, polymer fibers) and various media (different solvents). Further, we formulate a ‘continuum’ model which employs the results obtained by the microstructural model for diffusion within the RV. Our method relies on the fundamental condition of the equivalency of mass release kinetics between the continuum and microstructural models for a given region of space and over a prescribed concentration range. In formulating the continuum model, we introduce constitutive parameters, which include (traditional) equivalent ‘bulk’ diffusion coefficients (characterizing free, or Fickian, diffusion within the solvent), and also equivalent distances from an imaginary surface (describing surface effects within the microstructure [7]). Constitutive parameters, depending only on the structural geometry and the material properties of the diffusing constituents, are evaluated for three orthogonal coordinate directions – enabling modeling of general 3D diffusion conditions and anisotropy.
In order to construct the continuum model we introduce a novel numerical homogenization procedure. Previous homogenization procedures have limitations due to special assumptions made regarding microstructure (e.g. periodicity), as well as relying on various asymptotic expansions of analytic forms [9–13]. They have been extensively implemented in modeling diffusion within various porous media, [14–18], or in biological media [19–29]; however, these procedures are not readily generalizable. Our method is not only general (and overcomes the limitations of other homogenization procedures) but also includes concentration-dependent and new material parameters within a wide range of concentrations over which diffusion occurs. We demonstrate how to construct a model of diffusion through a composite material bounded by internal surfaces of arbitrary shape (e.g. representing tissue fibers or the microstructure of an agarose gel), where the interactions between the molecules, medium, and internal surfaces considerably retard the diffusion kinetics compared to Fickian diffusion.
2. Basic hierarchical model
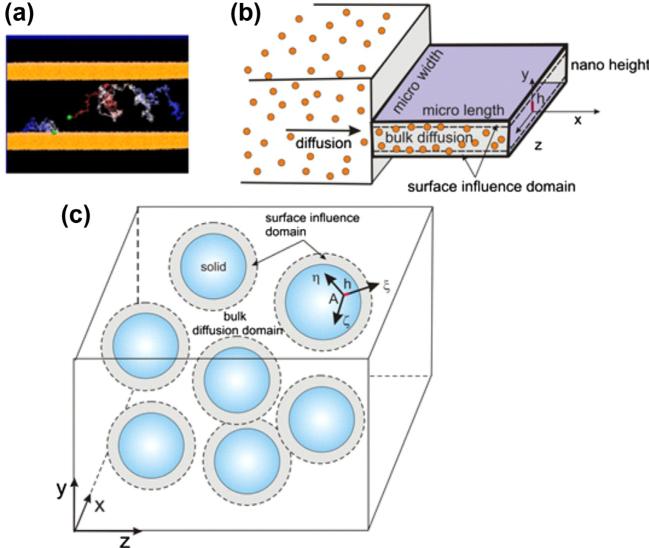
We here formulate the hierarchical diffusion model which is further used for introducing our homogenization procedure. Diffusion of particles or molecules through a porous medium represents motion of particles or molecules through fluid and is governed by the concentration gradient. Particle trajectories are affected by the pore and particle size and the overall diffusive properties can be considered dependent on porosity. This is realistic diffusion characterization for the case when the physico-chemical interactions between diffusing particles and solid surfaces of the microstructure can be neglected. However, in many cases, and particularly in diffusion of particles and molecules within biological media, the particle–surface interactions are very pronounced and strongly affect particle motion in the vicinity of the microstructural surfaces, modulating the diffusion process. These interaction effects are illustrated in Fig. 1a and b for diffusion within a nanochannel with a height h comparable to the particle size. Quantification of the surface interaction effects is performed using molecular dynamics (MD). This interaction is expressed as dependence of the effective diffusion coefficient on the distance from the solid surface and on the concentration, i.e. as D(h,c), further used within finite element (FE) models. The methodology of coupling MD–FE models is described next.
Fig. 1.
Diffusion within confined space. (a) Schematic of trajectories of molecules during diffusion within a nanochannel; (b) Bulk domain and domain of diffusion affected by interaction with surface in case of nanochannel of (nano) height h; (c) Bulk domain and surface influence domain in case of diffusion within a porous medium.
2.1. MD simulations
Molecular dynamics (MD) has been used for several decades [30]. It is based on statistical mechanics, where motion of particles or molecules is described according to the Newtonian mechanics:
| (1) |
where mi, and Fi aremass, acceleration and resulting force (including interaction forces fromthe neighboring particles and external forces), respectively. The interaction forces include bonded (repulsive-attractive, bending and torsion) and nonbonded (electrostatic, van der Waals) terms. The force field (FF) represents a functional form of behavior of chemical structures and is evaluated from potential energy function, E = Einter + Einter, of CHARMM FF [31] used in our MD models:
| (2) |
| (3) |
Material parameters of the intramolecular potential Eintra are given by the force constants Kb;Kθ and Kϕ, equilibrium values of bonds and angles b0 and θ0, and equilibrium torsion constants – dihedral multiplicity n and dihedral phase δ. Intermolecular potential sums are electrostatic and van der Waals (VDW) terms, where εij is VDW potential depth, Rmin is atom radius, and qi; qj are partial atomic charge. These parameters of FF are introduced to represent certain chemical classes of compounds in order to reproduce experimental physico-chemical properties.
MD simulations for calculating diffusivities in nanochannels were carried out [32,33] using NAMD 2.6 [34] with a TIP3P water model [35] and NVT (fixed number of particles N, volume V and temperature T) ensemble. CHARMM compatible amorphous silica force field [36] was employed to model the silica nanochannel, which is modeled by charged hydrophilic amorphous silica phase to match the silica properties after the fabrication process. Glucose diffusion coefficients were calculated from 30 ns trajectories by using the mean square displacement r2:
| (4) |
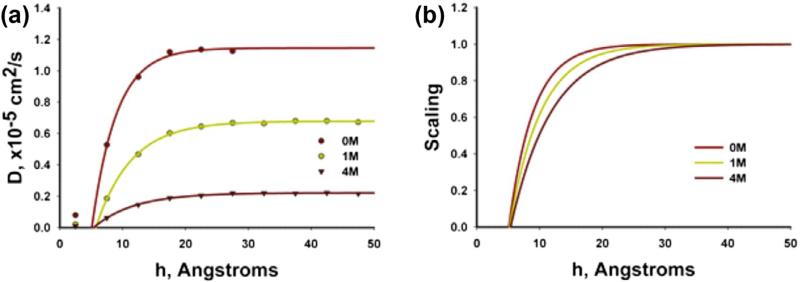
where the factor d = 1–3 depends on the dimensionality of the space, and t is time. The diffusivity along the surface normal (y-direction) was evaluated, from the surface up to the middle of the nanochannel. The time window t for r2 was chosen as 20 ps, which is small enough to catch local displacements within 0.5 nm thick slabs. Values of r2 wereh collected to bins according to the center of mass of glucose molecules and their initial position. Glucose molecules could leave the bin in which r2 is computed in order to avoid restricted ensemble. The diffusivity results include dependence on distance from the wall and glucose concentrations (Fig. 2a).
Fig. 2.
Diffusion scaling function of glucose calculated from MD as in [7]. (a) Glucose diffusion coefficient as a function of distance from silica surface for different glucose concnetrations. (b) Diffusion scaling functions, with the segment of zero diffusivity corresponding to statistical molecular radius.
The MD calculated diffusivity is normalized with respect to the “bulk” value Dbulk corresponding to diffusivity far from the surface, where influence of the surface is negligible. Hence, we have
| (5) |
where
| (6) |
is the scaling function which depends on the distance from the wall surface h and concentration c. The calculated scaling functions for different concentrations are shown in Fig. 2b. Experimental investigations showed that D(≡ Dbulk for glucose depends on concentration, although data are quite different (see [7] and references given therein). For examples shown here we have chosen the glucose D according to the largest data set that spans over a wide range of concentrations, from 0 to 3.36 M [37].
The presented calculation of the effective diffusion coefficient and scaling function for the simple geometry of nanochannel can be extended to any microstructural construct. Namely, using MD we can determine diffusion coefficients Dξξ, Dηη, Dϛϛ (or scaling functions sξ, sη, sϛ) in the local system ξ, η, ϛ (Fig. 1c), where ξ is in the direction normal to the surface, and η, Ϛ lie in the tangential plane:
| (7) |
where Dbulk can depend on concentration, i.e. Dbulk = Dbulk (c). Therefore, there are two domains in a microstructure: the domain with surface effects with the so-called hindered diffusion, and the bulk diffusion domain as shown in Fig. 1c. Diffusion tensor in the global coordinate system can be obtained by the tensorial transformation,
| (8) |
where DξηϚ is the diagonal tensor with components given in (7), while T is transformation matrix containing cosines of angles between local and global coordinate systems [38]. In the case of isotropic diffusion, the three scaling functions are equivalent sξ = sη = sϚ s(h, c) and the diffusion tensor is
| (9) |
where I is the identity tensor.
2.2. Finite element model
Finite element modeling of various problems in science and engineering has been well established [38–40]. We here consider unsteady diffusion where the diffusion coefficient depends on both concentration and spatial position of a point within the model. The fundamental constitutive relation is represented by the Fick's law,
| (10) |
where J is the mass flux, and summation on the repeated index is implied (j = 1–3).
FE solution procedures for nonlinear diffusion problems have been well established and successfully used in various applications [38–40]. The basic mass balance equation, which also includes Fick's law in Eq. (10), is
| (11) |
where c(xi, t is concentration, and q(xi, t) is a source term. By using a standard Galerkin procedure, this nonlinear differential equation is further transformed into the incremental-iterative system of linear balance equations for a finite element [38]
| (12) |
where C is the vector of nodal concentrations; the left upper indices n and n + 1 denote values at the start and end of the time step n of size Δt; the indices i and i – 1 correspond to the current and previous equilibrium iteration, respectively; QS and QS and QV are surface and volumetric nodal fluxes for the element; and components of the matrices M and K are
| (13) |
| (14) |
Here NI and NJ are the interpolation functions, and are components of the diffusion tensor corresponding to the last known concentration n+1c(i–1) at a point within the finite element, evaluated according to (7) and (8). Assembly of Eq. (12) and solution procedures are performed in a usual manner that is well described in the computational mechanics literature (e.g. [39]).
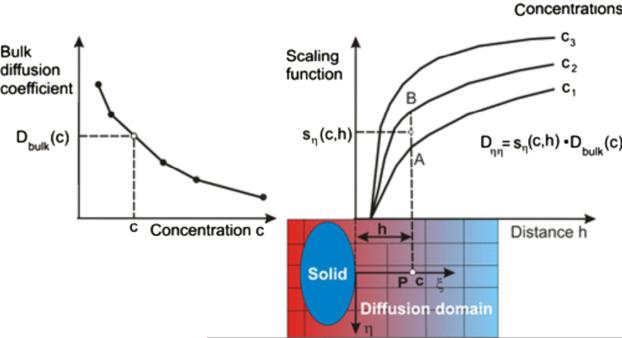
In our models we have incorporated concentration and interface effects, according to Eqs. (7) and (8). Implementation of the expression (7) is illustrated in Fig. 3. Note that linear interpolation between scaling curves is used.
Fig. 3.
Determination of diffusion coefficient Dηη at a spatial point P using dependence on concentration and surface effects. The “bulk” value is first determined from the curve Dbulk (c); then, the scaling function is evaluated from a family of curves, with linear interpolation between curves s(c,h) (between points A and B in the figure).
The described hierarchical model has been verified by comparison of diffusion experiments in nanochannels [41]. Good agreement between computed and experimental results for mass release was found [7]. The effects of the surface interaction are shown in Section 4.1.
3. Numerical homogenization
Modeling of diffusion within a complex microstructure, with detailed evaluation of the field of diffusion tensor, requires significant effort in generating internal microstructural geometry and calculation of the scaling functions. This microstructural model is practically not applicable to compute diffusion in large domains, as for example, micron size domains in case of diffusion within biological tissues. Hence, a macroscale model with equivalent diffusion parameters is necessary for practical applications. We here introduce a new concept of numerical homogenization which relies on the described microstructural model, and also includes surface interaction between diffusing particles or molecules and solid surfaces during transport through fluid within pores of microstructure.
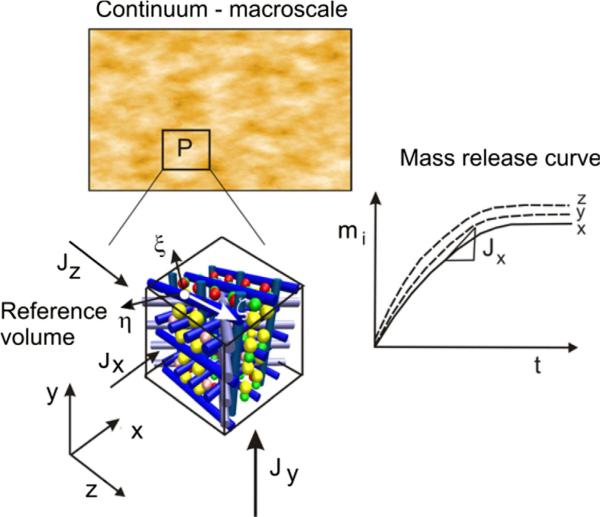
The basis for our homogenization procedure relies on the condition that mass release curves for the detailed microstructural and continuum models are the same (within a numerical tolerance). Namely, we select a small reference volume (RV) at a material point and calculate mass release curves for three coordinate directions; and then seek for equivalent diffusion parameters of the continuum to obtain the same mass release curves (see Fig. 4). If the equivalent parameters are determined under this condition, then the mass fluxes for the microstructural and continuum models
| (15) |
are the same (graphical representation shown in Fig. 4) for any time during the diffusion process; here i = 1–3 stands for x, y, z. Therefore, diffusion characteristics will be the same for both models and the governing equation (11), which represents the mass balance equation:
| (16) |
will yield the same solutions. Note that the microstructural model assumes MD calculation of the scaling functions for diffusing particles in microstructure and very fine FE mesh for discretization.
Fig. 4.
Illustration of the basic concept of numerical homogenization. A small reference volume (RV) is selected at point P of the medium and mass release curves mi(t) are evaluated by modeling diffusion in the coordinate directions x, y, z (i = 1–3). The microstructural model for diffusion within the RV contains a detailed description of the microstructure and the spatial field of the diffusion tensor is calculated using MD.
We introduce two sets of equivalent parameters:
equivalent diffusion coefficients D̄i
equivalent distances h̄i from solid surfaces
for the three coordinate directions. The first set accounts for bulk diffusion within microstructure, and has been commonly used in the past in the homogenization procedures [16,42]. The new parameters h̄i take into account surface interactions within the microstructure.
Practical evaluation of the equivalent parameters consists of the following steps:
Find mass release curves for the microstructural model with neglecting surface interaction effects within microstructure (Fickian diffusion);
Determine equivalent diffusion coefficients D̄i using these mass release curves;
Evaluate scaling functions for the microstructure and determine mass release curves for the microstructural model using these scaling functions and the bulk diffusion coefficient Dbulk;
Find equivalent distances h̄i by employing mass release curves from step 3 and diffusion coefficients l̄i from step 2.
These computational steps are illustrated in Fig. 5 for the case of linear dependence Dbulk (c). In calculating D̄i we assume that the dependence D̄i (c) is linear with the same slope (Fig. 5a) and search for the value such that the mass release curves of the microstructural and continuum models are the same; the initial value of is . On the other hand, when searching for h̄i we need to estimate the initial value . We briefly describe a way how we did this estimation. We discretize the RV space into a finite element mesh which is used for subsequent calculations. It is assumed that the microstructure consists of several material sets, and for each material set we calculate the scaling function for a representative concentration because diffusing particle may have different interaction with a different material (Fig. 5b). For illustration, a fibrous solid is assumed for the solid material set “s”. We calculate for each point within the diffusion domain (e.g. point P in Fig. 5c) the distance hs from the closest solid surface, using the appropriate local coordinate system (ξ, η, Ϛ in the figure). Then, we extrapolate the distance hs to the FE nodes, by employing isoparametric functions [38,39], to obtain nodal values (Fig. 5d). Further, we perform a weighting of these values according to the ratio of the total volume Vs of the set s with respect to the total volume of the solid phase . Hence, the initial value (for direction xi) can be written as
| (17) |
where
| (18) |
is the equivalent distance for the set s, and N is the number of nodes.
Fig. 5.
Details used in estimation of initial values. (a) Initial value and final value D̄0; (b) Scaling function for material set s; (c) Fibrous material set s with local and global coordinate systems; (d) Position of material point P within a finite element with distance hs from surface and nodal value at a node J.
The mass release curves are generated by assuming that the entering surface is attached to a “reservoir” of volume Vin with initial concentration c0, and that concentration at the opposite side is equal to zero; lateral surfaces are impermeable, ensuring one-directional diffusion conditions. The diffusion is calculated until concentration in RV and the inlet reservoir becomes close to zero, so that the mass release curve approaches a straight line parallel to the time-axis.
It is important to show that, for a given solvent and diffusing particles, equivalent diffusion parameters – equivalent diffusion coefficients and equivalent distances from surface – depend only on the geometry of the microstructure and its material characteristics. Then, it can be stated that these are material parameters. We demonstrate the material character of the equivalent diffusion parameters in example in Section 4.4.
Finally, regarding the practical application of this multiscale model, we emphasize that RVs can be specified at various points of continuum and the equivalent diffusion parameters can be interpolated to capture variability of material properties within the macro-domain. Also, a sub-structuring concept may be applied to include some of RVs into the simultaneous calculations over time steps. The balance equations for RV coupled with continuum over common boundary nodes can be written as
| (19) |
where the indices a and b indicate internal and boundary nodes of RV matrices and nodal vectors, respectively.
4. Verification and application of multiscale models
In this section we first give a short overview of applicability and limitations of the introduced diffusion models, and then present numerical results to illustrate the main characteristics of the presented methodology which include both micro-structural and multiscale models. Also, the emphasis is on the surface interaction effects within microstructure on diffusion characteristics, which can be dominant and which have not been addressed in existing diffusion models. The examples include verification of the introduced methodology.
4.1. Notes about applicability of computational models
We here give general remarks about the complexity of the introduced models, their applicability and further generalizations.
It can be noted from the above model descriptions that the models are straightforward regarding computational methodology: (a) with a given microstructure geometry, physico-chemical properties of solvent, diffusing particles and micro-structural solid material, it is possible to compute scaling functions and evaluate mass release curves for the microstructural model; (b) it is then straightforward to numerically determine continuum diffusion parameters for all necessary microstructural models within the diffusion domain; and (c) solution of diffusion problem with given boundary and initial conditions, using the field of equivalent diffusive material parameters, reduces to a “standard” incremental-iterative steps. However, in some diffusion processes, such as those occurring within biological media (e.g. tissues or inter-cellular spaces) there is enormous complexity of the internal microstructure through which molecules or small particles are diffusing, as well as the inherent biological variability. Then, evaluation of scaling functions, as well as mass release curves of the microstructural models, represents a challenge and can be considered as limitations to practical medical applications. The obtained solutions include variability which is present in any biological process.
Regarding computational efficiency, it can be stated that a significant computational effort is required for MD calculations of effective diffusion coefficients for each microstructural material, and consequently scaling functions. Computation of mass release curves and equivalent diffusion parameters is very efficient since the FE models correspond to small regions, although the FE mesh must be very fine to properly capture the microstructural geometry; number of nodes (with concentration as one-degree of freedom) is measured by tens of thousands, and number of steps for mass release curves is on the order of thousands. For example shown in Fig. 11, we used a cube mesh 40 × 40 × 40 with 64,000 elements and 68,921 nodes. We run 40 time steps with different step duration for each of the cases with or without scaling functions. Evaluation of mass release curves and continuum parameters for each coordinate direction required 10 h of CPU using an Intel® Core™ i7-2600k processor. Size of continuum FE models depend on the size of the diffusion domain, but it can be handled easily with today's computers since the nodes are with one-degree of freedom.
Fig. 11.
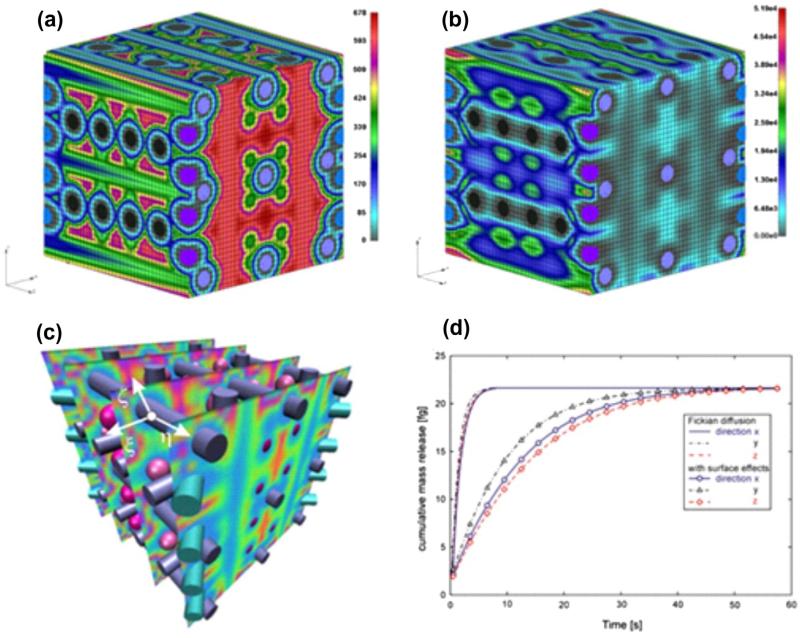
Diffusion through a medium with the complex microstructure. (a) Distribution of the x-direction diffusion coefficient Dx on the RV surface at time t = 0.4 s; values span from Dx = 0 (at the solid surfaces and within the solid) to Dx = 678 μm2s.Finite element mesh is shown, porosity is 65%; (b) Distribution of the x-direction flux Jx, displaying a similar character as Dx; (c) Distribution of Jx over several parallel planes. The local coordinate system ξ, η, Ϛ is shown for a point at the fiber surface. (d) Mass release curves for x, y, z directions, solutions obtained using microstructural and continuum models. Scaling functions for all solid constituents are taken to be the same (shown in Fig. 7b). Equivalent diffusion coefficients are (μm2/s): D̄x = 148.2, D̄y = 201.4, D̄z = 164:6, and the equivalent distances are (nm): h̄z = 0.53. Although the smallest diffusion coefficient is in the x-direction (hence, mass release kinetics should be the slowest), the slowest mass release is in z-direction since the equivalent distance h̄z < h̄x.
Generally, the introduced models can serve as the basic models even for complex media, as is the case with micro-environments within living organisms. They can be further enhanced by introducing other processes occurring simultaneously with diffusion, such as, for example, matrix degradation. Even without further generalizations, the current models can be implemented to study transport of drugs in tissue, coupled with convective transport within capillary systems, in order to achieve more efficient therapies for tumor growth. We foresee that the described methodology can readily be applied in drug delivery, catalysis and other areas, where mass exchange is tightly coupled with microstructure of media.
4.2. Validation of the microstructural model
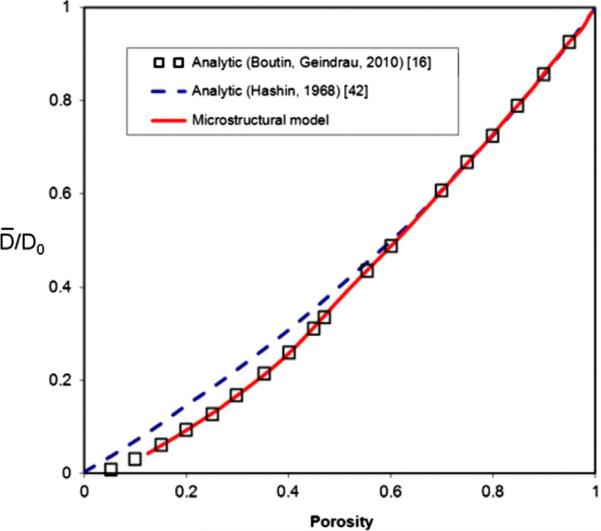
In this example we compute diffusion in a porous material, with microstructure composed of nanospheres as in Figs. 7a and 10c, using our microstructural model. These diffusion conditions correspond to those described in [16]. Calculation was performed by neglecting surface effects (Fickian diffusion) and for various porosities. Our results for the ratio of the effective diffusion coefficient D̄ to the bulk value D0, D̄/D0, show very good agreement with values obtained by analytical homogenization procedure in [16]. Dependence D̄/D0 on porosity ϕ was earlier obtained according to a self-consistent analytical method [42], and can be expressed in a simple form:
| (20) |
Fig. 7.
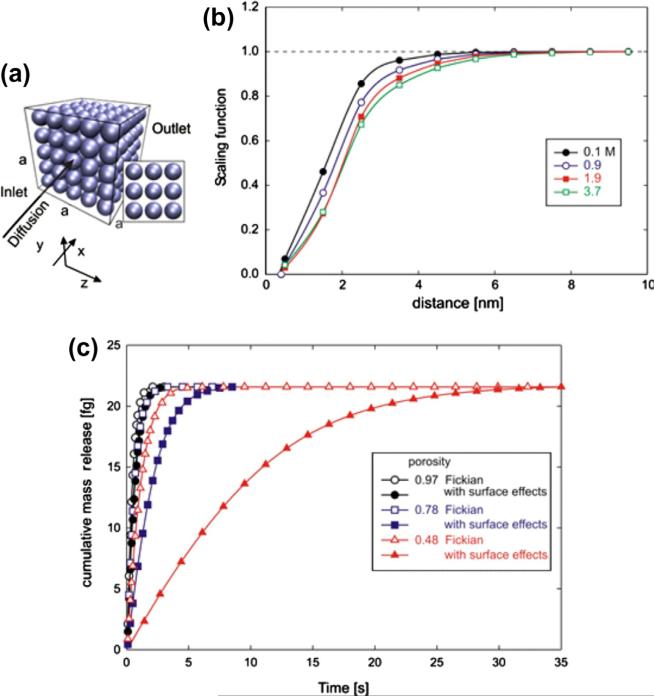
Diffusion through a porous medium consisting of packed silica nanospheres, microstructural model. (a) Internal structure of the medium; diffusion occurs from the inlet surface (attached to a reservoir with a prescribed volume and initial concentration c0) to the outlet with concentration c = 0. Porosity is 0.78; (b) Scaling functions used in the analysis, according to [7], for diffusion through water of glucose molecules and silica surfaces; (c) Mass release curves for Fickian diffusion (no surface effects) and diffusion with surface effects, for three different porosities; minimum porosity 0.48 corresponds to the case when the spheres are just touching. Surface effects are more pronounced for smaller porosities due to a relatively larger internal surface.
Fig. 10.
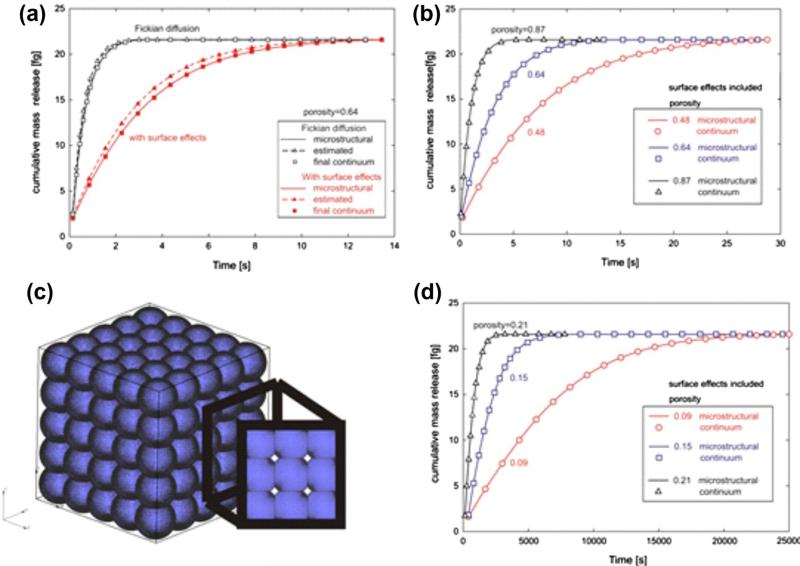
Mass release curves for microstructural and continuum models. (a) Diffusion conditions are as described in the caption of Fig. 7. Fickian and surface-affected diffusions are included. Initial continuum mass release curves are calculated using estimated constitutive parameters for the equivalent diffusion coefficient and equivalent distance from surface, and matching of the final continuum solutions (after several iterations from the initial, estimated values) with the microstructural results is achieved; (b) Microstructural and final continuum mass release curves, with surface effects included, for three porosities, for the case when the silica nanospheres are separated as in Fig. 7a; (c) Microstructure consisting of intersecting silica nanospheres; porosity is 9%; (d) Mass release curves for model with intersecting spheres and for three small porosities (9%, 15%, 21%); the time scale is three orders-of-magnitude greater than in Fig. 10b.
Results of this simple formula are displayed by dashed line in Fig. 6; deviation from our solution and in [42] becomes apparent for smaller porosities.
Fig. 6.
Ratio of the effective diffusion coefficient D̄ with respect to the bulk value D0; in terms of porosity. Our microstructural structure consists of spheres displaced as in Figs. 7a and 10c. Surface interaction is neglected, hence Fickian diffusion is assumed. Two analytical solutions are shown, according to Refs. [16,42].
4.3. Effects of surface interactions in diffusion of glucose molecules (microstructural model)
We investigate diffusion characteristics of glucose molecules in water surrounded by a simple microstructure consisting of packed silica nanospheres for the cases when the spheres are separated by a small distance (Fig. 7a). The scaling functions correspond to glucose molecules and are shown in Fig. 7b [7]. Based on previous results [7,8], where good agreement between the numerical and experimental results was achieved, we here assume that the bulk diffusion coefficient linearly varies between 690 μm2/s for c = 0 and 267 μm2/s for c = 2.75 M. In order to model diffusion in the x-direction within the selected cubic RV, we assume that one side of the RV (“inlet” in Fig. 7a) is attached to a reservoir with initial concentration c0, while the opposite side (“outlet”) is attached to a large-volume reservoir with a concentration c = 0..
Fig. 7c shows mass release curves for diffusion through the RV, for three different porosities, obtained for three values of sphere diameters (3, 6 and 8 nm). The minimum porosity corresponds to the special case when two neighboring spheres are touching. We assume that the scaling functions are the same for the normal and tangential directions, hence diffusion is isotropic in the entire domain. Mass release is hindered by surface interactions and these effects become more pronounced with decreasing porosities due to an increase in the internal surface area (which results in a corresponding increase in the volume affected by surface interaction).
4.4. Demonstration that the equivalent diffusion parameters are material parameters
For a given solvent and diffusing particles we show that material parameters of the continuum model (equivalent diffusion coefficients and equivalent distances from surface) only depend on the geometry of the microstructure and its material characteristics. We take a reference volume (RV) containing solid silica nanospheres (as shown in Fig. 7a), with sphere diameters of 7 nm and porosity of 64%. For this model we change the boundary conditions to achieve various mass release curves.
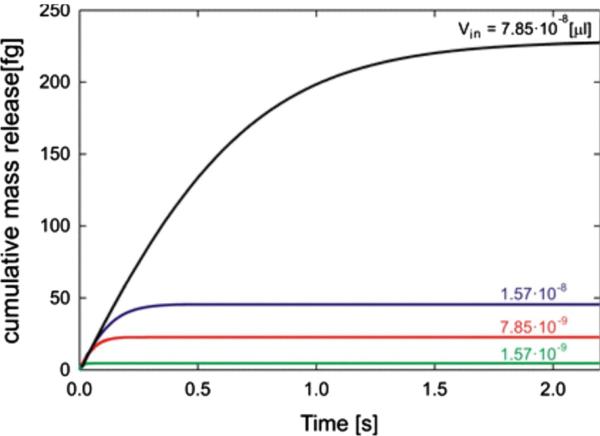
Fig. 8 shows three mass release curves that differ significantly, obtained by changing inlet reservoir volume Vin for one order of magnitude (from 1.57 10 −9 to 7.85 10 −8 [μL]). Equivalent diffusion coefficient D̄ and equivalent distance h̄ are given in Table 1; they are practically the same for these mass release curves.
Fig. 8.
Mass release curves for volumes of the inlet reservoir from Table 1: 7.85 10 −8, 1.57 10 −8, 7.85 10 −9 and 1.57 10 −9 [μL].
Table 1.
Material parameters D̄ and h̄ for four reservoir volumes Vin, with the same initial concentration c0 = 2.75 M/L.
| Vin [μL] | D̄ [μm2/s] | h̄ [nm] | |
|---|---|---|---|
| 1 | 7.850 · 10–8 | 381.010 | 0.89676 |
| 2 | 1.570 · 10–8 | 381.010 | 0.89676 |
| 3 | 7.850 · 10–9 | 381.010 | 0.90579 |
| 4 | 1.570 · 10–9 | 381.010 | 0.89676 |
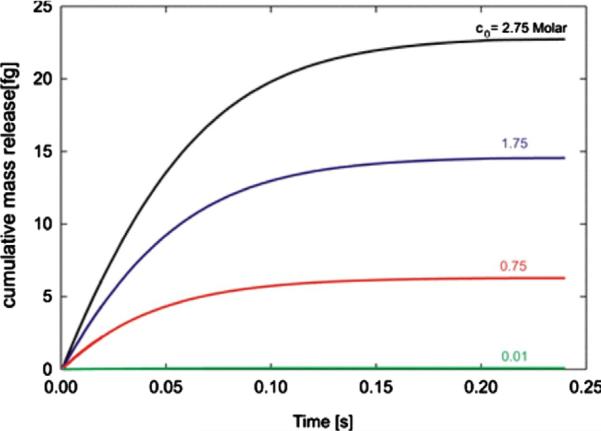
Another way to change mass release curves is to change initial concentration c0. We have changed c0 from 0.01 to 2.75 Molar, while keeping Vin unchanged. Mass release curves are shown in Fig. 9, while the calculated D̄ and h̄ are given in Table 2. Again, we see that the equivalent diffusion coefficient D̄ and distance from surface h̄ remain essentially unchanged.
Fig. 9.
Mass release curves obtained for inlet reservoir volume Vin = 7:850 · 10 −9μL and four initial concentrations of the inlet reservoir c0 (Molar): 2.75, 1.75, 0.75 and 0.01.
Table 2.
Material parameters D̄ and h̄ for four initial inlet concentrations c0, and constant reservoir volume Vin = 7.850 × 10⁻⁹ μL.
| c0 [M/L] | D̄ [μm2/s] | h̄ [nm] | |
|---|---|---|---|
| 1 | 2.75 | 381.010 | 0.90579 |
| 2 | 1.75 | 381.010 | 0.89133 |
| 3 | 0.75 | 381.010 | 0.88764 |
| 4 | 0.01 | 381.010 | 0.88455 |
Finally, we have doubled dimensions of the RV and calculated D̄ and h̄. Table 3 demonstrates that these material parameters are independent of th RV size.
Table 3.
Material parameters D̄ and h̄ for two sizes of the RV (c0 = 2.75 M/L).
| a [μm] | D̄ [μm2/s] | h̄ [μm] | |
|---|---|---|---|
| 1 | 0.04 | 381.010 | 0.90579 |
| 2 | 0.08 | 381.837 | 0.90128 |
Data: 1. Model 1: cube side a1 = 0:04 [μm], volume , number of spheres in RV is N1 = 5 * 5* 5 125. 2. Model 2: = cube a2 = 2a1 = 0:08 [μm], volume , number of spheres is N2 = 8N1 = 10 * 10 * 10 = 1000.
4.5. Application of the multiscale continuum model
Here, we present several examples with simple and complex microstructures, which give insight into the multiscale continuum model formulation and the model applicability.
4.5.1. Microstructure with spheres and variable porosity
Fig. 10 shows mass release curves for the microstructural and continuum models, with a spherical solid internal structure and data as in Fig. 7a. Initial curves, for estimated (initial) parameters and the final curves (which overlap with the micro-structural solutions) are shown in Fig. 10a for porosity 0.64 (with and without surface effects). Agreement between micro-structural and continuum mass release curves in the presence of surface effects is depicted in Fig. 10b. We also examine cases where the microstructure consists of intersecting silica nanospheres (microstructure for 9% porosity is shown in Fig. 10c), and again we obtain continuum constitutive parameters such that mass release curves for the microstructural and continuum models are essentially identical (Fig. 10d). For this case of 9% porosity, the time needed for complete removal of the initial mass is now around 2.5 × 10³ s which is three orders-of-magnitude greater than for larger porosities (Fig. 10b). The equivalent distance h̄ increases from 0.52 nm to 2.05 nm, with an increase of porosity from 9% to 87%, respectively.
4.5.2. Diffusion of glucose molecules through complex microstructure
We consider diffusion of glucose molecules in water through a complex microstructure composed of fibers and spheres, which could represent a section of a biological tissue. The microstructure of this example is shown in Fig. 11c. For the selected internal geometry, the porosity is calculated to be 65%. The bulk diffusion coefficient (Dbulk = 690 μm2/s) is assumed to be independent of concentration and the scaling functions are taken as in Fig. 7b. The spatial distribution of the x-direction diffusion coefficient Dx at the first time step (t = 0.4 s) and at the RV boundary is shown in Fig. 11a, with the values ranging from zero (within and on the boundary of the solids) to 690 μm2/s. Fig. 11b displays the spatial distribution of the mass flux in the x-direction Jx, having the same character of variation as Dx, while Fig. 11c shows distributions of Jx over several parallel planes. Mass release curves for the three coordinate directions (for both Fickian and with surface-influenced diffusion) are shown in Fig. 11d, and they are the same for the microstructural and continuum models. Values for the equivalent diffusion coefficients and equivalent distances are given in the figure legend. Based on these material parameters and the mass release curves, it is apparent that the continuum medium is anisotropic and that surface interactions significantly affect diffusion kinetics.
4.5.3. Diffusion of rhodamine 6G (R6G) molecules through an agarose polymer gel
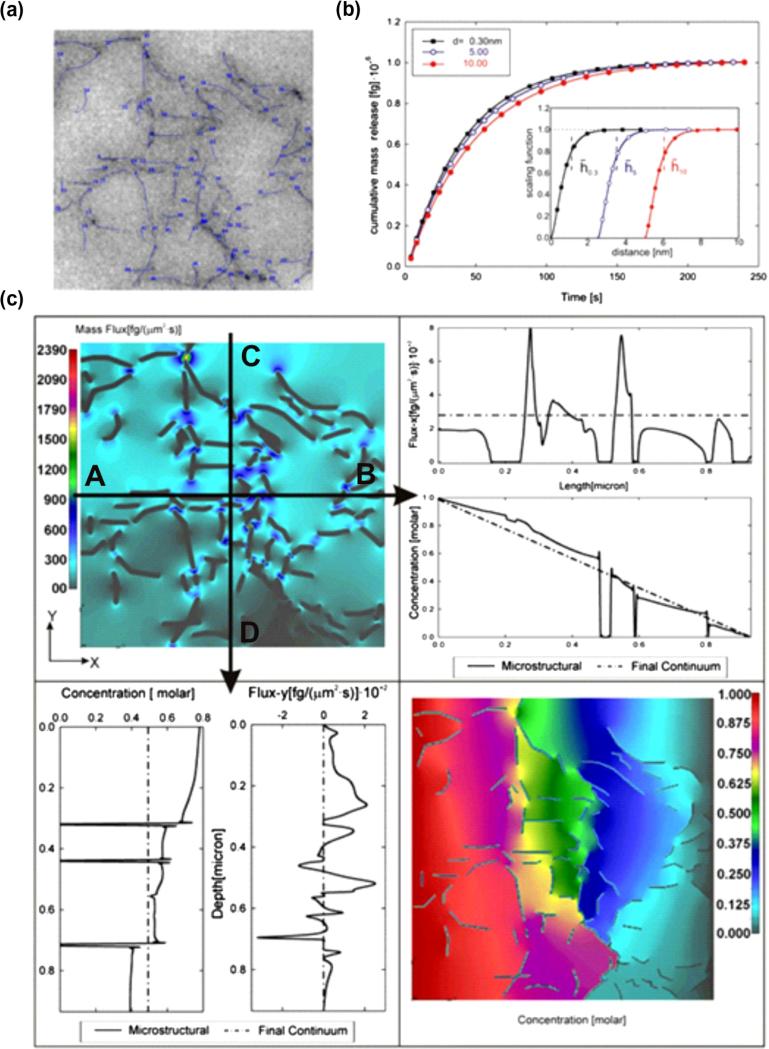
Here, we first present detailed analysis of the microstructural model, and then compare the predictions of the equivalent continuum model with the experimentally obtained results. For the first task, we use the internal structure of the gel obtained by imaging [43], shown in Fig. 12a with discretized agarose fibers and porosity of 97%. As expected, the calculated diffusion in the x and y directions are roughly equivalent, since the size of the RV (0.934 × 0.934 μm) is large enough so that the overall characteristics are the same in the two directions. The bulk diffusion coefficient is Dbulk = 286 μm2/s, while the scaling function, calculated using MD procedure, is displayed in the inset of Fig. 12b. To demonstrate that scaling functions may account for molecular size (zero diffusion in domain inside the radius of the molecule), two more scaling functions were created by off-setting the scaling function of R6G. Both microstructural and continuum models are used, giving the same total mass release. The release kinetics is slower for bigger molecules, since the scaling functions also incorporate the purely geometrical effects (size) of the diffusing molecules. The equivalent diffusion coefficients and equivalent distances from surface are given in the caption of Fig. 12.
Fig. 12.
Diffusion within an agarose polymeric solution. (a) Internal microstructure obtained by TEM imaging [43] with discretized fibers. The bulk diffusion coefficient is considered independent of concentration, Dbulk = 286 μm2/s. The equivalent diffusion coefficients (in μm2/s) are: 274, 261, 250 and equivalent distances from surface (in nm) are: 1.12, 3.49, and 6.06 for particle diameters 0.3, 5 and 10 nm, respectively. (b) Mass release curves for three particle diameters 0.3 (rhodamine 6G), 5 and 10 nm. Solutions are the same for microstructural and continuum models. The inset shows the scaling functions for the three particles (displaced to the right for increasing particle radius). (c) Results shown in this figure are for particle size of 5 nm. Upper left panel: Mass flux-x distribution at time t = 0.5 s; dark contours within the field show zero-flux at fiber points. Upper right panel: Distribution of mass flux and concentration in the x-direction, microstructural (solid line) and continuum (dashed line) solutions along line A–B; zero-values of flux and concentration correspond to fibers. Continuum model solutions show approximately constant flux-x and linear decrease of concentration along A–B line. Lower left panel: Distribution of y-direction mass flux and concentration, microstructural (full line) and continuum (dashed line) solution along line C–D; zero-values of flux and concentration correspond to fibers. Continuum model shows constant concentration along B–C line, while mass flux is equal to zero, since there is no diffusion through lateral (y-direction) boundaries of the RV. Lower right panel: Distribution of concentration at time t = 0.5 s, microstructural model; concentration decreases along the x-axis, while zero-values correspond to fibers.
In order to gain further insight into the diffusion within this polymer gel, we examine the mass flux and concentration distributions (Fig. 12c). Here, we consider the diffusion of molecules whose radius is 5 nm. The upper left panel shows the distribution of mass fluxes in the direction of diffusion at the end of the first time step, time t = 0.5 s. The field displays the variation of the flux due to the distribution of agarose fibers, with zero-values within the fibers and at the fiber surfaces. Diagrams of concentration and mass flux along the coordinate axes are shown in the lower-left and upper-right panels. Based on continuum solutions, the concentration decreases approximately linearly along line A–B, and remains constant along line C–D; flux-x is roughly constant along A–B, and flux-y is equal to zero along C–D. On the other hand, microstructural solutions have variations, with zero-values at the points corresponding to fibers. Finally, the right lower panel shows the solution for the concentration field obtained by the microstructural model at time t = 0.5 s; on average, concentration decreases along the x-axis, with zero-values at the fiber points. Taken together, the continuum model incorporates the microstructural flux fluctuations in order to achieve an equivalence of mass fluxes between the microstructural and continuum models through a given RV.
4.5.4. Verification example
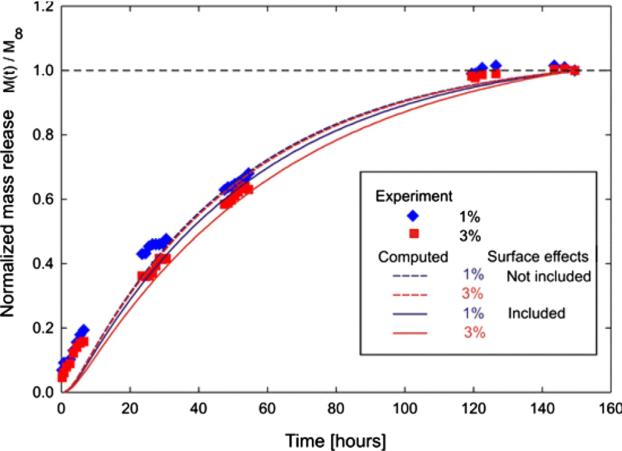
For the multiscale model verification, we have experimentally measured R6G diffusion, where R6G was released from reservoirs into a sink through a 1% and 3% agarose hydrogel membrane. Mass release curves are calculated using the equivalent continuum model, based on the above microstructural model and the homogenization procedure. The equivalent diffusion coefficient and the equivalent distance from surface are given in the caption of Fig. 12 for R6G molecule with diameter of 0.3 nm. Fig. 13 shows experimental and computational curves normalized by the maximum released mass M∞, as M(t)/M∞. We use M1 since our model does not include absorption which is also present in this mass transport. Simulated mass release curves in case of no surface interactions are practically the same for 1% and 3% due to the small difference in porosity, and show faster release than in case when surface effects are included. These effects are more pronounced for the 3% agarose hydrogel. However, our model captures both the porosity and surface effects within the microstructure, and shows good agreement with the experimental results, thus confirming the validity of our approach.
Fig. 13.
Diffusion of rhodamine 6G from reservoir into a sink through a 3 mm thick 1% and 3% agarose hydrogel. Computed (dashed curves – without surface effects, solid curves – surface effects included) and experiment (symbols) data are normalized by maximum released mass M.∞.
5. Summary and conclusions
We have formulated a microstructural hierarchical diffusion model for a general microstructural geometry, which includes interactions between the diffusing particles and the solid boundaries. In this model, the interaction effects are incorporated through scaling functions obtained from MD, which represent the ratios between the real and bulk diffusion coefficients. The scaling functions, expressed in terms of distance from the solid surfaces and concentration, are calculated in the local coordinate system of the solid surface. Therefore, two domains of diffusion are distinguished: the bulk diffusion domain (with Fickian diffusion) and the domain near surfaces, with non-Fickian hindered diffusion. In both domains, diffusion is calculated by using the FE method. The surface effects become apparent when comparing the slower mass release kinetics (with surface interactions) with purely Fickian mass release (without surface effects).
This microstructural model is then employed within a novel numerical homogenization procedure to establish the equivalent continuum diffusion model. The procedure is general since it is applicable to an internal structural geometry of any complexity, and can include different solid material sets with different material properties. The procedure relies on the condition that mass release curves of the two models must be equal. Constitutive diffusion parameters of the continuum model are determined for the three coordinate directions and include the traditional bulk diffusion coefficients, and also equivalent distances from the solid surfaces to account for surface interaction effects on diffusion. Furthermore, these constitutive parameters can depend on the local concentration. Our approach, consisting of a microstructural model and numerical homogenization procedure, is general and robust, and offers new possibilities in modeling diffusion through complex materials, including molecular transport in biological systems (e.g. intercellular spaces and tissues). The presented methodology has been experimentally validated and can serve as a tunable platform for constructing intricate multiscale hierarchical diffusion models with additional complexity and effects, such as multiple molecule types (e.g. different proteins/ligands), multiple surfaces (e.g. various cell types with different receptors), and various media (e.g. different solvents). These multiscale models provide a basis for a deeper, more accurate representation of fundamental transport processes occurring throughout nature.
Acknowledgments
The authors acknowledge the Texas Advanced Computing Center (TACC) at The University of Texas at Austin for providing HPC resources that have contributed to the research results reported within this paper. This project has been partially supported with Houston Methodist Research Institute, by the grants OI 174028 and III 41007 of the Serbian Ministry of Education and Science, and City of Kragujevac – Serbia. Authors also acknowledge partial supports from the following funding sources: the Ernest Cockrell Jr. Distinguished Endowed Chair (M.F.), US Department of Defense (W81XWH-09-1-0212) (M.F.), National Institute of Health (U54CA143837, U54CA151668) (M.F.).
References
- 1.Boving TB, Grathwohl P. Tracer diffusion coefficients in sedimentary rocks: correlation to porosity and hydraulic conductivity. J. Contam. Hydrol. 2001;53:85–100. doi: 10.1016/s0169-7722(01)00138-3. [DOI] [PubMed] [Google Scholar]
- 2.Zhang H, Selim HM. Second-order modeling of arsenite transport in soils. J. Contam. Hydrol. 2011;126:121–129. doi: 10.1016/j.jconhyd.2011.08.002. [DOI] [PubMed] [Google Scholar]
- 3.Cao ZYH, Wang J, Tegenfeldt J, Austin R, Chen E, Wu W, Chou S. Fabrication of 10 nm enclosed nanofluidic channels. Appl. Phys. Lett. 2002;81 [Google Scholar]
- 4.Gardeniers H, Berg A. Micro-and nanofluidic devices for environmental and biomedical applications. Int. J. Environ. Anal. Chem. 2004;84:809–819. [Google Scholar]
- 5.Desai TA, Hansford DJ, Kulinsky L, Nashat AH, Rasi G, Tu J, Wang Y, Zhang M, Ferrari M. Nanopore technology for biomedical applications. Biomed. Microdevices. 1999;2:11–40. [Google Scholar]
- 6.Alber F, Dokudovskaya S, Veenhoff LM, Zhang W, Kipper J, Devos D, Suprapto A, Karni-Schmidt O, Williams R, Chait BT. Determining the architectures of macromolecular assemblies. Nature. 2007;450:683–694. doi: 10.1038/nature06404. [DOI] [PubMed] [Google Scholar]
- 7.Ziemys A, Kojic M, Milosevic M, Kojic N, Hussain F, Ferrari M, Grattoni A. Hierarchical modeling of diffusive transport through nanochannels by coupling molecular dynamics with finite element method. J. Comput. Phys. 2011;230:5722–5731. [Google Scholar]
- 8.Ziemys A, Kojic M, Milosevic M, Ferrari M. Interfacial effects on nanoconfined diffusive mass transport regimes. Phys. Rev. Lett. 2012;108:236102–236105. doi: 10.1103/PhysRevLett.108.236102. [DOI] [PMC free article] [PubMed] [Google Scholar]
- 9.Benssousan JL, Papanicoulau G. Asymptotic Analysis for Periodic Structures. North-Holland; Amsterdam: 1978. [Google Scholar]
- 10.Ferrari M. Composite homogenization via the poly-inclusion approach. Compos. Eng. 1994;4:37–45. [Google Scholar]
- 11.Hornung U. Homogenization and Porous Media. Springer-Verlag; Berlin: 1997. [Google Scholar]
- 12.Nicolas MO, Oden JT, Vemagantia K, Remacle JF. Simplified methods and a posteriori error estimation for the homogenization of representative volume elements (RVE) Comput. Methods Appl. Mech. Eng. 1999;176:265–278. [Google Scholar]
- 13.Allaire G, Pankratova I, Piatnitski A. Homogenization and concentration for a diffusion equation with large convection in a bounded domain. J. Funct. Anal. 2012;262:300–330. [Google Scholar]
- 14.Sangani AS. An application of an homogenization method to a model of diffusion in glassy polymers. J. Polym. Sci. Part B Polym. Phys. 1986;24:563–575. [Google Scholar]
- 15.Auriault JL, Lewandowska J. Effective diffusion coefficient: from homogenization to experiment. Transp. Porous Media. 1997;27:205–223. [Google Scholar]
- 16.Boutin C, Geindreau C. Periodic homogenization and consistent estimates of transport parameters through sphere and polyhedron packings in the whole porosity range. Phys. Rev. E. 2010;82(036313):036311–036318. doi: 10.1103/PhysRevE.82.036313. [DOI] [PubMed] [Google Scholar]
- 17.Vassal J-P, Orgéas L, Favier D, Auriault J-L. Phys. Rev. E. 2008;77(011303):011301–011313. doi: 10.1103/PhysRevE.77.011303. [DOI] [PubMed] [Google Scholar]
- 18.Eitelberger J, Hofstetter K. Prediction of transport properties of wood below the fiber saturation point – a multiscale homogenization approach and its experimental validation. Part II: steady state moisture diffusion coefficient. Compos. Sci. Technol. 2011;71:145–151. [Google Scholar]
- 19.Chen KC, Nicholson C. Changes in brain cell shape create residual extracellular space volume and explain tortuosity behavior during osmotic challenge. PNAS. 2000;97:8306–8311. doi: 10.1073/pnas.150338197. [DOI] [PMC free article] [PubMed] [Google Scholar]
- 20.Rohan E. Modeling large-deformation-induced microflow in soft biological tissues. Theor. Comput. Fluid Dyn. 2006;20:251–276. [Google Scholar]
- 21.Shorten PR, Sneyd J. A mathematical analysis of obstructed diffusion within skeletal muscle. Biophys. J. 2009;96:4764–4778. doi: 10.1016/j.bpj.2009.02.060. [DOI] [PMC free article] [PubMed] [Google Scholar]
- 22.Chapman SJ, Shipley RJ, Jawad R. Multiscale modeling of fluid transport in tumors. Bull. Math. Biol. 2008;70:2334–2357. doi: 10.1007/s11538-008-9349-7. [DOI] [PubMed] [Google Scholar]
- 23.Chen Y, Zhou S, Li Q. Microstructure design of biodegradable scaffold and its effect on tissue regeneration. Biomaterials. 2011;32:5003–5014. doi: 10.1016/j.biomaterials.2011.03.064. [DOI] [PubMed] [Google Scholar]
- 24.Sanz-Herrera JA, Garcia-Aznar JM, Doblare M. A mathematical model for bone tissue regeneration inside a specific type of scaffold. Biomech. Model. Mechanobiol. 2008;7:355–366. doi: 10.1007/s10237-007-0089-7. [DOI] [PubMed] [Google Scholar]
- 25.Higgins ER, Goel P, Puglisi JL, Bers DM, Cannell M, Sneyd J. Modelling calcium microdomains using homogenisation. J. Theor. Biol. 2007;247:623–644. doi: 10.1016/j.jtbi.2007.03.019. [DOI] [PMC free article] [PubMed] [Google Scholar]
- 26.Novak IL, Kraikivski P, Slepchenko BM. Diffusion in cytoplasm: effects of excluded volume due to internal membranes and cytoskeletal structures. Biophys. J. 2009;97:758–767. doi: 10.1016/j.bpj.2009.05.036. [DOI] [PMC free article] [PubMed] [Google Scholar]
- 27.Muha I, Naegel A, Stichel S, Grillo A, Heisig M, Wittum G. Effective diffusivity in membranes with tetrakaidekahedral cells and implications for the permeability of human stratum corneum. J. Membr. Sci. 2011;368:18–25. [Google Scholar]
- 28.Rim JE, Pinsky PM, Osdol W.W.v. Using the method of homogenization to calculate the effective diffusivity of the stratum corneum with permeable corneocytes. J. Biomech. 2008;41:788–796. doi: 10.1016/j.jbiomech.2007.11.011. [DOI] [PubMed] [Google Scholar]
- 29.Marciniak-Czochra A, Ptashnyk M. Derivation of a macroscopic receptor-based model using homogenization techniques. SIAM J. Math. Anal. 2008;40:215–237. [Google Scholar]
- 30.Rapaport DC. The Art of Molecular Dynamics Simulation. Cambridge University Press; 2004. [Google Scholar]
- 31.MacKerell A, et al. All-atom empirical potential for molecular modeling and dynamics studies of proteins. J. Phys. Chem. B. 1998;102:3586–3616. doi: 10.1021/jp973084f. [DOI] [PubMed] [Google Scholar]
- 32.Ziemys A, Ferrari M, Cavasotto CN. Molecular modeling of glucose diffusivity in silica nanochannels. J. Nanosci. Nanotechnol. 2009;9:6349–6359. doi: 10.1166/jnn.2009.1822. [DOI] [PubMed] [Google Scholar]
- 33.Ziemys A, et al. Confinement effects on monosaccharide transport in nanochannels. J. Phys. Chem. B. 2010:132–137. doi: 10.1021/jp103519d. [DOI] [PubMed] [Google Scholar]
- 34.Phillips JC, et al. Scalable molecular dynamics with NAMD. J. Comput. Chem. 2005;26:1781–1802. doi: 10.1002/jcc.20289. [DOI] [PMC free article] [PubMed] [Google Scholar]
- 35.Jorgensen WL, et al. Comparison of simple potential functions for simulating liquid water. J. Chem. Phys. 1983;79:926–935. [Google Scholar]
- 36.Chu-Cruz ER, Aksimentiev A, Schulten K. Water silica force field for simulating nanodevices. J. Phys. Chem. B. 2006;110:21497–21508. doi: 10.1021/jp063896o. [DOI] [PMC free article] [PubMed] [Google Scholar]
- 37.Gladden JK, Dole M. Diffusion in supersaturated solution II: glucose solutions. J. Am. Chem. Soc. 1953;75:3900–3904. [Google Scholar]
- 38.Kojic M, Filipovic N, Stojanovic B, Kojic N. Computer Modeling in Bioengineering – Theoretical Background, Examples and Software. John Wiley and Sons; Chichester, England: 2008. [Google Scholar]
- 39.Bathe KJ. Finite Element Procedures. Prentice-Hall; Englewood Cliffs, N.J., USA: 1996. [Google Scholar]
- 40.Hughes TJR. The Finite Element Method: Linear Static and Dynamic Finite Element Analysis. New York: 2000. [Google Scholar]
- 41.Fine D, Grattoni A, Hosali S, Ziemys A, Rosa ED, Gill J, Medema R, Hudson L, Kojic M, Milosevic M, Ferrari M. A robust nanofluidic membrane with tunable zero-order release for implantable dose specific drug delivery. Lab Chip. 2010;10:3074–3083. doi: 10.1039/c0lc00013b. [DOI] [PubMed] [Google Scholar]
- 42.Hashin Z. Assessment of the self consistent scheme approximation: conductivity of particulate composites. J. Compos. Mater. 1968;2:284–300. [Google Scholar]
- 43.Griess GA, Guiseley KB, Serwer P. The relationship of agarose gel structure to the sieving of spheres during agarose gel electrophoresis. Biophys. J . 1993;65:138–148. doi: 10.1016/S0006-3495(93)81072-5. [DOI] [PMC free article] [PubMed] [Google Scholar]


