

Abstract
Bipolar disorder (BD) is a polygenic disorder that shares substantial genetic risk factors with major depressive disorder (MDD). Genetic analyses have reported numerous BD susceptibility genes, while some variants, such as single-nucleotide polymorphisms (SNPs) in CACNA1C have been successfully replicated, many others have not and subsequently their effects on the intermediate phenotypes cannot be verified. Here, we studied the MDD-related gene CREB1 in a set of independent BD sample groups of European ancestry (a total of 64 888 subjects) and identified multiple SNPs significantly associated with BD (the most significant being SNP rs6785[A], P = 6.32 × 10⁻⁵, odds ratio (OR) = 1.090). Risk SNPs were then subjected to further analyses in healthy Europeans for intermediate phenotypes of BD, including hippocampal volume, hippocampal function and cognitive performance. Our results showed that the risk SNPs were significantly associated with hippocampal volume and hippocampal function, with the risk alleles showing a decreased hippocampal volume and diminished activation of the left hippocampus, adding further evidence for their involvement in BD susceptibility. We also found the risk SNPs were strongly associated with CREB1 expression in lymphoblastoid cells (P<0.005) and the prefrontal cortex (P<1.0 × 10⁻⁶). Remarkably, population genetic analysis indicated that CREB1 displayed striking differences in allele frequencies between continental populations, and the risk alleles were completely absent in East Asian populations. We demonstrated that the regional prevalence of the CREB1 risk alleles in Europeans is likely caused by genetic hitchhiking due to natural selection acting on a nearby gene. Our results suggest that differential population histories due to natural selection on regional populations may lead to genetic heterogeneity of susceptibility to complex diseases, such as BD, and explain inconsistencies in detecting the genetic markers of these diseases among different ethnic populations.
Keywords: association, bipolar disorder, CREB1, gene expression, intermediate phenotype, natural selection
INTRODUCTION
Bipolar disorder (BD) is a severe psychiatric disorder characterized by profound mood symptoms including episodes of mania, hypomania and depression, and is often accompanied by psychotic features and cognitive changes. Though worldwide lifetime prevalence of BD is 0.5–1.5% in general populations,1 the rate of concordance for monozygotic twins is roughly 40–70% (compared with 5% in dizygotic twins) and the risk among the first-degree relatives of individuals with BD is 10-fold greater than among the general populations, implying a strong genetic predisposition for BD.1 Despite the relatively high heritability of BD, however, only a few risk single-nucleotide polymorphisms (SNPs) have been found and many cannot be successfully replicated in samples from different populations of various ethnicities. For example, a genome-wide risk SNP for BD in Europeans, rs1012053 in DGKH,2 was not replicated in Chinese.3 This phenomenon can be explained by environmental factors, such as environmental exposure, dietary or cultures. Moreover, differential population histories (caused by genetic drift and/or natural selection) on the risk genes may lead to differentiation in allele frequencies and linkage disequilibrium (LD) patterns, resulting in inconsistent associations between different populations. Petryshen et al.,4 for example, illustrated that rs6265, a risk SNP of BDNF for psychiatric disorders, showed inconsistent results among different samples; they detected evidence of positive selection on the BDNF loci, which could influence the detection of susceptibility genes.
Clinical, epidemiological and genetic findings have suggested shared risk factors between BD and major depressive disorder (MDD).5 BD shares phenotypic similarity with MDD, and there is an increased morbidity of MDD within family members of a proband with BD.1 BD and MDD also share some common risk genes, such as CACNA1C and SYNE1, which were identified in a recent meta-analysis of BD genome-wide association study (GWAS).6 These two BD risk genes also showed significant associations with MDD.7,8 Similarly, PCLO, a candidate susceptible gene for MDD identified by GWAS,9 has also been implicated in the genetic susceptibility of BD.10
Similarly, CREB1 has been identified as a susceptibility gene for MDD, with lines of supporting evidence.11–16 Spanning 75.7 kb on human chromosome 2q34, CREB1 encodes a transcription factor cAMP (cyclic adenosine monophosphate) responsive element binding protein 1, and is involved in the cAMP signaling pathway, which is often malfunctional in patients with MDD and BD.11,12 Previous studies suggested CREB1 has an important role in anxiety and depression in animal behavioral models.13 Independent human studies have also reported female-specific linkage to CREB1 in families with recurrent early-onset MDD.14,15 Sequence variations in the CREB1 promoter region were also implicated in the pathogenesis of MDD.16 In addition, CREB1 has also been implicated in antidepressant response,17 anger18 and neuronal plasticity as well as in hippocampus dependent memory process,12 although the mechanism is complicated.11 These findings led us to speculate that CREB1 may be a risk gene for BD, though current GWASs haven’t highlighted this genomic region in the genetic risk of BD.
In patients with BD, the volume of the hippocampus is reduced,19 and hippocampal abnormalities (for example, memory impairment) have been repeatedly observed in BD patients as well as in their unaffected relatives, suggesting that hippocampal abnormalities are related to the genetic risk for BD.20 Meanwhile, functional neuroimaging studies consistently found that dysfunctions of hippocampus and closely related regions underpin abnormal affective responses and dysfunctional emotion regulation in BD.21 Postmortem studies have also provided further evidence for the hypothesis that hippocampal abnormalities are relevant to the altered synaptic plasticity and diminished resilience in BD.22 Therefore, analysis of the risk genes on these intermediate phenotypes could provide additional evidence for their involvement in BD susceptibility.
In light of these findings, we opted to analyze CREB1 in two large-scale BD sample populations of European ancestries alongside analyzing intermediate phenotypes, including hippocampal volume, hippocampal function and cognitive performance in healthy European subjects. We also tested the effects of the risk SNPs on CREB1 expression in independent lymphoblastoid cell and brain samples. To test if these findings were universally applicable or particular to populations of a unique ancestry, we conducted a population analysis to determine if the risk SNPs were present in Chinese, and found they were totally absent while the non-risk SNPs were not, likely due to differential population histories of CREB1 caused by regional natural selections.
SUBJECTS AND METHODS
Case–control subjects
The Psychiatric GWAS Consortium (PGC) BD group recently conducted a meta-analysis of large-scale genome-wide data on BD in populations of European ancestry.6 In this study, all patients had experienced pathologically relevant episodes of elevated mood (mania or hypomania) and met the established criteria for BD within the primary study classification system, and the subjects with a low probability of having BD from the same geographic and ethnic populations were selected to use as a control. We extracted the results of all available common SNPs (minor allele frequency (MAF) >0.05) covering the entire genomic region of CREB1 gene (85.4 kb, Chromosome 2: 208382600–208468000, GRCh37.p5) from the primary GWAS samples (7481 cases/9250 controls).6 Detailed descriptions of the samples, data quality, genomic controls and statistical analyses can be found in the original GWAS.6
For replication analysis, we recruited six independent BD sample groups of European ancestries from several different locations: France (451/1631), Sweden (836/2093), Germany (181/527), Australia (330/1811), Poland (411/504) and Iceland (544/34 426). Considering the substantial genetic overlap between MDD and BD,5 we also added two MDD samples independently collected from Munich-Germany (640/542) and the UK (1636/1,594). All replication samples were previously reported in the large-scale collaborative studies or individual GWAS,6,23–25 and showed no overlap with the PGC BD GWAS samples. Written informed consent for participation was obtained from all the subjects in this study, in accordance with local ethical regulations (for detailed information of the samples, including genotyping methods see Supplementary Data and Supplementary Table S1).
Genotyping and association analysis
For genotyping in our samples, we mainly used the Illumina (San Diego, CA, USA) and Affymetrix platforms (details shown in Supplementary Data), and the genotyping yield was at least 95% in cases and control subjects of all groups. Control subjects were tested for deviation from the Hardy–Weinberg equilibrium, and we found no SNPs deviated from Hardy–Weinberg equilibrium. Genomic control was used to correct for relatedness and population stratification in each replication sample.26 With the exception of the Icelandic group, the genomic inflation factors (λ) were all <1.1. In the Icelandic sample, some related individuals were included in the analyses and the genomic control factor (λ) was 1.11. We used Haploview v4.1 to estimate the LD between paired SNPs with the r2 algorithm and to define haplotype blocks.27 P-values and allele-specific ORs for each individual sample were calculated with a logistic regression model adjusted using genomic control, assuming an additive effect. Meta-analysis of the results from different case–control samples were performed by PLINK v1.07 using the Mantel–Haenszel method with the fixed effect (inverse variance) method.28 A total of 34 SNPs in CREB1 were included in the GWAS by the PGC BD group.6 Among these 34 SNPs, we selected 25 common SNPs with the MAF >0.05 (according to data from the 1000-Human-Genome Project29) in European populations for our analysis. P>0.002 was set to as the statistical significance level in the discovery and combined samples; in the replication sample, P>0.05 was considered significant.
Analysis of hippocampal volume, hippocampal function and cognitive performance
Recently, GWASs on bilateral hippocampal volume were conducted by two independent consortia: (1) the Cohorts for Heart and Aging Research in Genomic Epidemiology (CHARGE),30 and (2) the Enhancing Neuro Imaging Genetics through Meta-Analysis (ENIGMA) consortium.31 Briefly, the CHARGE group included 9232 dementia-free subjects whose ages ranged from 56.0–84.0 years (with a weighted average of 67.1 years), and the ENIGMA samples contained 5775 young healthy individuals (mean age: 34.8 years). Detailed information on the samples, imaging procedures and genotyping methods of the two samples can be found in the original GWASs.30,31 We extracted the association results of CREB1 SNP with bilateral hippocampal volume instead of single-side hippocampal volume from these two GWASs, because the volumes of the right and left hippocampus do not differ significantly in healthy subjects,31 and the genetic bases are likely the same.32
For brain functions, we analyzed the data of a German sample of healthy individuals (N = 279) that was part of an ongoing study on neurogenetic mechanisms of psychiatric disease to study the effects of risk CREB1 SNPs on hippocampal function,33–35 using blood oxygenation level-dependent functional magnetic resonance imaging measurement during three consecutive blocks of memory tasks (that is, encoding, recall and recognition of face-profession pairs). We analyzed the effects of the SNPs on right and left hippocampal function separately, assuming potential asymmetry in hippocampal function, with the right hippocampus supporting processes contributing to visuo-spatial memory and the left hippocampus to verbal/narrative or episodic memory.36–38 All participants were of European ancestry with no lifetime or family history of psychiatric diseases. Detailed information on sample, data acquisition and statistical analysis are provided in the Supplementary Data.
We also recruited an Irish sample (N = 88) consisted of healthy subjects to study the effects of risk CREB1 SNPs on cognitive performance (that is, IQ, episodic memory, working memory, attention and social cognition). All participants were of European ancestry with no history of major mental health problems, intellectual disability or acquired brain injury. Detailed information on the sample description, cognitive assessment and statistical analysis are presented in the Supplementary Data.
Gene expression analysis
To detect the functional effects of the risk SNPs in CREB1, we analyzed their associations with gene expression levels. We first utilized the Genevar database39 containing data from lymphoblastoid cell lines in the healthy European subjects (N = 75).40 We also extracted the data of genome-wide expression analysis in the prefrontal cortex of healthy Caucasian and African American samples (N = 261) from the BrainCloud database (http://braincloud.jhmi.edu).41 In addition, we used the Stanley Neuropathology Consortium Integrative Database (SNCID, http://www.stanleyresearch.org/sncid/);42 a web-based tool for exploring neuropathological markers in neuropsychiatric disorders and the biological processes associated with abnormalities of those markers. The SNCID is a collection of 60 brains, consisting of 15 each diagnosed with BD, MDD, SCZ and healthy controls. The four groups are matched by age, sex, race, postmortem interval, pH, side of brain and mRNA quality (Supplementary Table S2). In SNCID, we studied the associations of the risk SNPs with CREB1 expression in several brain regions separately, including frontal cortex, cerebellum, thalamus and hippocampus. Finally, we also used data reported previously, from a whole-genome association mapping of gene expression in the cerebellar cortex of neuropsychiatric patients and controls (N = 164).43,44 Briefly, that study obtained 164 brain samples from the Stanley Medical Research Institute (SMRI), including BD, MDD, SCZ and healthy controls, and analyzed gene expression using Affymetrix U133A array. All the samples included data on collection group, diagnosis, age, sex, race, postmortem interval, brain pH, smoking, alcohol use, suicide status and psychotic feature, which were used as covariates in their analysis.43
Bioinformatics analysis of the CREB1 SNPs and functional prediction
To detect the potentially functional variant(s) for CREB1 expression, we obtained the sequence data of the entire CREB1 gene (85.4 kb, Chromosome 2: 208382600–208468000, GRCh37.p5) in Europeans from the 1000-Human-Genome Project.29 We identified a total of 49 SNPs (Supplementary Table S3) in strong LD (r2 ≥ 0.90) with highly similar frequencies (20.6–22.4%), including the risk SNPs for BD (for example, rs2709370 and rs6785). None of these SNPs are located in the CREB1 exon region. With the use of the ENCODE data (http://www.genome.gov/10005107),45–50 we conducted a bioinformatics analysis to predict the function of these SNPs. The ENCODE data provides a multitude of experimental data suitable to annotate regulatory variants outside of protein-coding regions, and this was achieved by the Regulome DB (http://www.regulomedb.org);51 a fairly comprehensive variant annotation tool that makes use of functional sources. We also predicted whether the SNPs are located in the microRNA-binding sites using an online-tool mirSNP (http://202.38.126.151/hmdd/mirsnp/search/).52
Population genetic analysis
Global distributions of the CREB1 SNPs among 53 populations were derived from the HGDP Selection Browser (http://hgdp.uchicago.edu/).53 Re-sequencing data for CREB1 and its adjacent genes (FAM119A, CCNYL1 and FZD5) were obtained from the 1000-Human-Genome Project,29 including 85 CEU (Utah residents with Northern and Western European ancestry) and 97 CHB (Han Chinese in Beijing, China) subjects.
We first calculated nucleotide diversity, π, and the proportion of segregating sites, θw, for each human population. Then in DnaSP v5.0, we used the statistics including Tajima’s DT,54 Fu and Li’s D, F, D*, F*,55,56 and Fay and Wu’s H57 to detect the deviation from neutrality. To calculate the significance of the deviation from neutrality, coalescent simulations were then constructed incorporating the best-fit human demographic parameters of Europeans and East Asians, as described in Schaffner et al.58 Africans were used as an out-group when analyzing Fu and Li’s D, F and Fay and Wu’s H-test.
RESULTS
CREB1 variants confer risk of BD
Data were recruited for all available common SNPs in CREB1 in the PGC GWAS on BD,6 and even after a multiple testing correction we observed significant associations for many SNPs (P<0.002, Figure 1), with the strongest signal located in the 3′-UTR region (rs6785, P = 3.38 × 10⁻⁴, OR = 1.111 for A allele). Most of these risk SNPs were in highly similar frequencies (~20%, Supplementary Table S4) and strong LD in Europeans (r2 ≥ 0.90, Supplementary Figure S1).
Figure 1.
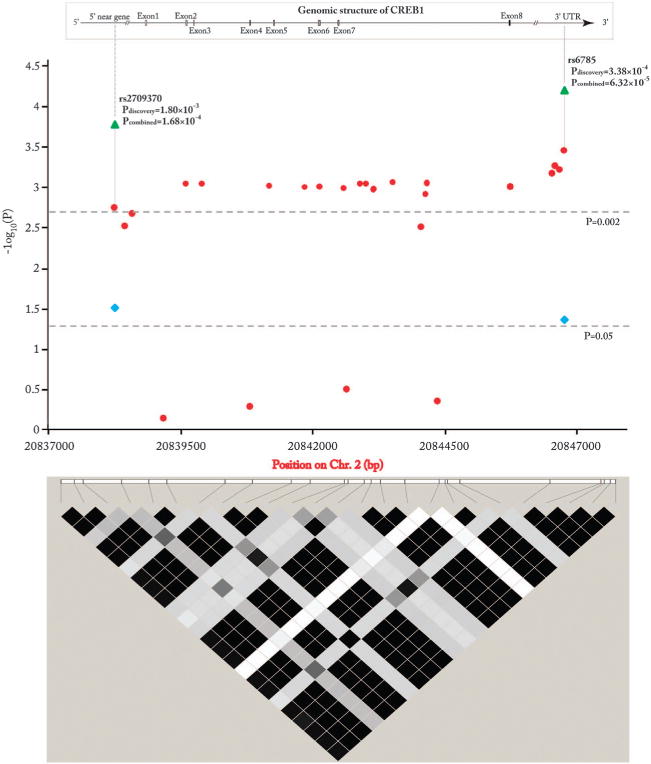
Genomic and linkage disequilibrium (LD) structure of CREB1 as well as association results with bipolar disorder. The results in the discovery sample were shown in red circle, and the results in the replication sample were shown in blue square, and the results in the combined sample were shown in green triangle. The LD color scheme was defined using the R-squared and the LD value of the paired SNPs was calculated using the r2 algorithm. The r2 value for each color was: black (r2>0.90), dark gray (0.2 < r2 < 0.6), gray (0.01 ≤ r2 < 0.2), white (r2 ≤ 0.01).
To further test the observed associations with BD in the PGC GWAS sample, we selected two representative SNPs, rs2709370 (P = 1.80 × 10⁻³, OR = 1.094 for C allele) in the 5′ near gene region (10 kb upstream of CREB1) and rs6785 in the 3′UTR region and conducted replication analysis on a large collection of independent BD and MDD case–control samples of European ancestry (2753 BD cases, 2276 MDD cases and 43 128 controls; Supplementary Table S1). These two SNPs showed nominally significant associations among the replication samples (rs2709370[C], P = 0.0303, OR = 1.070; and rs6785[A], P = 0.0433, OR = 1.066). Meta-analysis conducted by combining the PGC BD GWAS and replication samples (N = 64 888) indicated stronger significance levels (rs2709370[C], P = 1.68 × 10⁻⁴, OR = 1.083; and rs6785[A], P = 6.32 × 10⁻⁵, OR = 1.090, Figure 1), with no heterogeneity among the individual samples (rs2709370, P = 0.7044; and rs6785, P = 0.6827). The results for each sample are shown in Supplementary Table S5. The odds ratios in the cumulative analysis are comparable with other genes reported as significantly associated with psychiatric disorders in larger meta-analyses59,60 and exceed the Venice interim criteria for ‘small summary’ findings.61 Taken collectively, the association analysis suggests that SNPs in CREB1 may confer risk of BD among Europeans.
Effects of the risk SNPs on hippocampal volumes and hippocampal function
Given the known function of CREB1 in the hippocampus, a brain region subserving attention and memory processes and consistently implicated in the neuropathology of BD, we hypothesized that if the risk-associated SNPs affect the biology of this brain region, cognitive deficits referable to this region would also be associated with risk genotypes, regardless of disease status. We selected the two risk SNPs from the meta-analysis (rs2709370 and rs6785) and tested their effects on the biological phenotypes related to hippocampus in healthy subjects. The use of healthy controls for genetic association at the level of brain function avoids potential confounders related to chronic illness and medical treatment.
First, we tested the effects of the risk CREB1 SNPs (rs2709370 and rs6785) on hippocampal volume variation using published samples.30,31 In the ENIGMA sample (mean age 34.8 years), these SNPs were significantly associated with hippocampal volume (rs2709370[C], β = −17.70 mm3, P = 0.0477; rs6785[A], β = −22.27 mm3, P = 0.0127; β represents the difference in hippocampal volume per copy increase of the risk allele), with risk alleles possessing smaller volumes. However, the associations were not replicated in the CHARGE samples (weighted average age is 67.1 years) (rs2709370[C], β = 4.9 mm3, P = 0.6827; rs6785[A], β = 7.6 mm3, P = 0.5271). We evaluated effects of age and age × SNP interaction on the hippocampal volume in both samples, and there are significant effects of age on hippocampal volume in both samples (P<0.05), consistent with prior studies showing the influence of age on brain structures.62 However, the age–SNP interaction analysis was not significant (P>0.05). Hippocampal volume is a complex trait, and only around 40% of the variance in volume is attributable to genetic influences.63 Consequently, the SNP effect is barely detectable even if the sample size is large, and we are very underpowered to pick up an age × SNP interaction effect, as it requires orders of magnitude higher power than picking up the SNP effect itself. Hence, the nominally significant associations of CREB1 SNPs with hippocampal volume likely exist in young adult healthy individuals (ENIGMA), however, due to the influence of age and the limited genetic basis of hippocampal volume, such effects diminish in older subjects (CHARGE).
We next investigated the effects of the same risk CREB1 SNPs on hippocampal function with functional magnetic resonance imaging data using a recently published healthy sample from Germany (N = 279).33–35 As expected, we observed significant association of rs2709370 with hippocampal function during memory recall (P<0.01, family wise error corrected for multiple comparisons across the region of interest, Figure 2). The risk allele [C] carriers likewise showed diminished activation of the left hippocampus, consistent with a previous study of patients with BD who showed impaired hippocampal function, further supporting the involvement of CREB1 in BD. However, rs2709370 did not show evidence of association with the right hippocampal function (P>0.1), suggesting that rs2709370 may contribute to processes including mainly verbal/narrative or episodic memory (related to the left hippocampus), and less to visuo-spatial memory (related to the right hippocampus). We also showed that the demographic characteristics (for example, age and sex and so on.) of the functional magnetic resonance imaging sample was not modulated by the rs2709370 genotype (Supplementary Table S6). However, rs6785 did not show any significant associations with hippocampal function (data not shown).
Figure 2.
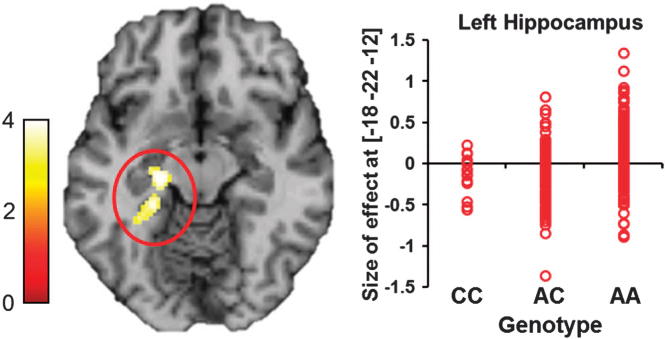
Effect of the risk single-nucleotide polymorphism (SNP) rs2709370 on hippocampal function. During memory recall, carriers of the risk allele (C) of rs2709370 exhibit significantly decreased allele-dosage-dependent hippocampal activation in the left hippocampus (Z = 3.97, P<0.01, family wise error corrected for multiple testing across region of interest). Each red dot represents size of effect in one subject and reflects hippocampal activation. Number of subjects in each group: CC = 14, AC = 99, AA = 166.
Finally, we analyzed the associations of the risk CREB1 SNPs (rs2709370 and rs6785) with neuropsychological measures of cognitive performance in a healthy Irish sample (N = 88). These SNPs, however, showed no detectable associations with variation in cognition as measured by either IQ, working memory, episodic memory recall, attention or social cognition (Supplementary Tables S7 and S8). As the sample size is small and the statistical power is limited, particularly when testing the effects of common genetic variants on behavioral response rather than cortical activation (as in the German data), further analysis is needed.
Association of the risk SNPs with CREB1 mRNA expression
The association of CREB1 with BD and related brain phenotypes in multiple independent samples lends statistical and biological support to the involvement of this genomic region in the risk of illness. However, these findings do not identify the underlying molecular mechanism. To test the effects of the risk SNPs on CREB1 expression in vivo, we utilized several existing expression quantitative trait loci databases. Unfortunately, rs2709370 and rs6785 were not available in most of these databases, so we instead selected rs2709373 (r2 = 0.93 with rs2709370 in European populations, according to data from the 1000-Human-Genome Project) and rs2551949 (r2 = 1.0 with rs6785). We firstly used the Genevar expression database, consisting of 75 lymphoblastoid cell lines from healthy European individuals,40 and found rs2709373 and rs2551949 were significantly associated with CREB1 expression (rs2709373, P = 2.4 × 10⁻³; rs2551949, P = 5.0 × 10⁻⁴, probe ID: ILMN_2334242; Figure 3a), with the risk alleles having higher expression. Conversely, these SNPs were not associated with the expression of the nearby genes located within 500 kb (P>0.01, Supplementary Figure S2; a total of five genes were included, so P = 0.01 was set as the significance level).
Figure 3.
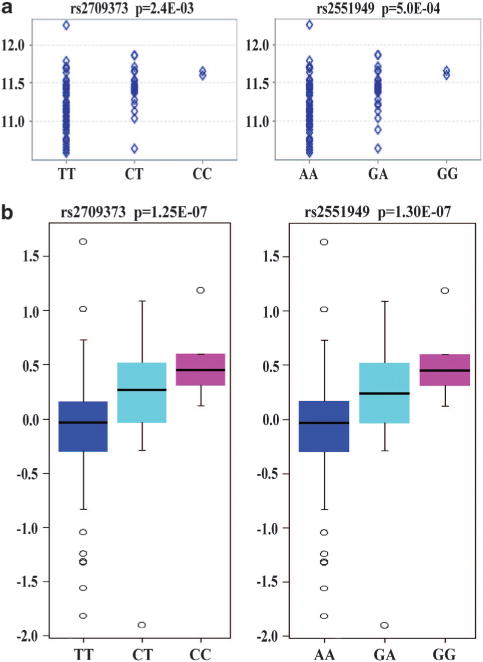
Effects of risk single-nucleotide polymorphisms (SNPs) on CREB1 mRNA expression. (a) Results in the lymphoblastoid cell lines of 75 healthy European subjects. (b) Results in the prefrontal cortex of healthy Caucasian and African-American subjects (N = 261).
Colantuoni et al.41 recently conducted genome-wide expression analyses of the human prefrontal cortex in 261 healthy Caucasian and African American individuals (BrainCloud). Both rs2709373 and rs2551949 showed strong associations with CREB1 expression in the sample (rs2709373, P = 1.25 × 10⁻⁷; rs2551949, P = 1.30 × 10⁻⁷, probe ID: 7409_Illumina; Figure 3b). Again, the risk alleles had higher CREB1 expression. We then conducted the analysis stratified by ethnics in BrainCloud database, and found these two SNPs also significantly associated with CREB1 expression in Caucasians only (P<1.0 × 10⁻³; data not shown). In addition, in another web-based database SNCID, all four SNPs (rs2709370, rs2709373, rs6785 and rs2551949) were included and were likewise strongly associated with CREB1 expression in several brain regions, including the frontal cortex, cerebellum, hippocampus and thalamus (P<5 × 10⁻⁶, probe ID: 204314_s_at and 204313_s_at; Supplementary Table S9). Furthermore, Liu et al.43 also reported significant associations of rs2709370 with CREB1 expression in the combined cerebellum samples of healthy controls, SCZ, BD and MDD patients (empirical P = 3.03 × 10⁻⁵, N = 164, probe ID: 204314_s_at; refer to the Supplementary data of their study).43 Collectively, these consistent results across multiple studies suggest that the risk CREB1 SNPs may influence CREB1 expression, although it is not clear which may be the causal SNP because all the risk SNPs are in high linkage.
To seek the causal variant(s) potentially influencing the expression of CREB1, we conducted a bioinformatics analysis (refer to Subjects and Methods for details). The results showed that, among the 49 candidate SNPs, there are at least 26 SNPs (having Regulome DB scores, Supplementary Table S3) that located in the potentially functional regions, that is, either containing predicted transcription factor binding motifs, having protein binding sequences as demonstrated by ChIP-seq method, or located in the chromatin structures or the histone modification regions. Notably, rs2464976 is located in the 5′ flanking region of CREB1, and has the highest Regulome DB score (Supplementary Table S3). In addition, we found that all the four SNPs located in the CREB1 3′UTR region (rs2551928, rs1806584, rs1045780 and rs6785) could bind at least one kind of microRNA with predicted binding affinity changes (Supplementary Figure S3). Collectively, our functional predictions identified multiple SNPs with potential functional roles in regulating CREB1 expression, which need to be tested in the future.
A CREB1 downstream neighboring gene FAM119A, has an overlap (~22.7 kb) with CREB1 in the genome. This gene also contains some risk SNPs for BD (for example, rs2551949), which are in high LD with the risk SNPs located in CREB1 in Europeans (for example, rs25519149 is in perfect LD with rs6785, r2 = 1.00). However, these risk SNPs in FAM119A were not associated with the expression of FAM119A (Supplementary Figure S2), and we concluded that FAM119A is unlikely to be the causative risk gene in BD.
Genetic differentiation between Europeans and Chinese for risk SNPs
To further replicate our results, we intended to test whether rs2709373 and rs6785 are also risk SNPs in Chinese. To our surprise, both SNPs were monomorphic in Chinese populations (Supplementary Table S3) and the risk alleles were completely absent. To characterize this situation, we obtained the sequence data of the entire CREB1 gene in Europeans and Chinese from the 1000-Human-Genome-Project (85.4 kb, Chromosome 2: 208382600-208468000, GRCh37.p5).29 Sequence comparisons showed 72 common CREB1 SNPs (MAF >0.05) in Europeans, 49 of them (Supplementary Table S3) were in strong LD (r2 ≥ 0.90) with highly similar frequencies (20.6–22.4%), including the risk SNPs for BD (for example, rs2709370 and rs6785). Among these 49 SNPs in Europeans, 44 SNPs were totally monomorphic in Han Chinese and the other 5 SNPs were nearly monomorphic (MAF ≤ 0.01). By contrast, a total of 23 common SNPs were observed in Chinese, all of them polymorphic in Europeans.
To reveal the detailed global allele frequency distributions of the risk CREB1 SNPs, we compared the allele frequencies of rs6785 and rs2709373 in 53 world populations. Intriguingly, these 2 SNPs showed a regional enrichment with the highest frequencies (~20%) in Europe and the Middle East, followed then by North Africa, becoming common in Central Asia, rare in southern Africa and Latin America and totally absent in East Asia, South Asia, Southeast Asia and Oceania (Figure 4a and Supplementary Figure S4). In contrast, the global distribution of the non-risk CREB1 SNPs (for example, rs2254137) showed no regional enrichment (Figure 4b).
Figure 4.
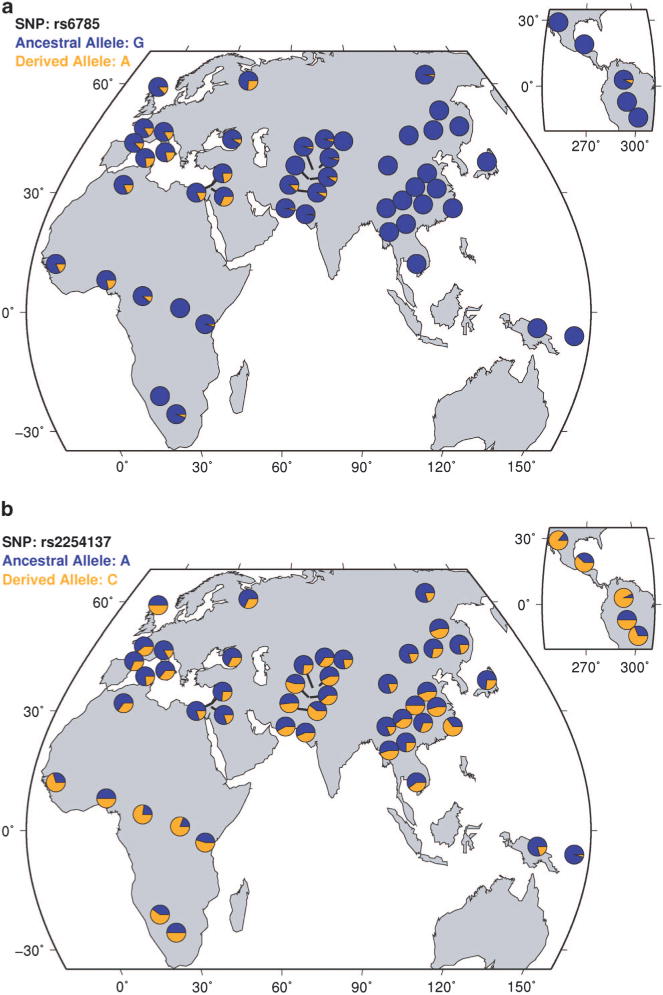
Global distribution of CREB1 single-nucleotide polymorphisms (SNPs) in world populations. (a) Global distribution of rs6785 (risk SNP) allele frequencies in world populations. The derived allele [A] is the risk allele. (b) Global distribution of rs2254137 (non-risk SNP) allele frequencies in world populations.
Detection of differential CREB1 population history between Europeans and Chinese
As we stated earlier, allelic differences between populations may possibly be due to different population histories on CREB1. We therefore conducted neutrality tests to detect which evolutionary forces may have acted on the different populations. We calculated Tajima’s DT, Fu and Li’s D, F, D*, F* and Fay and Wu’s H for CREB1 gene and evaluated whether these statistics significantly deviated from expectations under neutrality using coalescent simulations. The results showed that the values of Fu and Li’s D, D*, F, F* are significantly negative among Chinese, which can be attributed to recent population expansion or natural selection. Conversely, neutrality tests of CREB1 in Europeans only found marginally significant results (Fu and Li’s D and D*, Table 1).
Table 1.
Nucleotide diversity and neutrality tests for CREB1 and three neighboring genes in human populations
| Region | La | Pop | Nb | Sc | θwd | πe | Tajima’s D | Fu and Li’s D* | Fu and Li’s D | Fu and Li’s F* | Fu and Li’s F | Fay and Wu’s H |
|---|---|---|---|---|---|---|---|---|---|---|---|---|
| CREB1 | 85.4 | CHB | 97 | 128 | 2.6 | 1.4 | −1.37 | −5.57 | −5.89 | −4.30 | −4.40 | −0.18 |
| CEU | 85 | 206 | 4.2 | 3.3 | −0.68 | −2.28 | −2.34 | −1.82 | −1.81 | −3.92 | ||
| FAM119A | 45.3 | CHB | 97 | 56 | 2.1 | 1.4 | −0.99 | −3.31 | −3.50 | −2.75 | −2.85 | −2.20 |
| CEU | 85 | 101 | 3.9 | 3.6 | −0.25 | −1.51 | −1.49 | −1.12 | −1.08 | −3.42 | ||
| CCNYL1 | 50.3 | CHB | 97 | 152 | 5.2 | 8.7 | 2.14 | −0.64 | −0.71 | 0.81 | 0.83 | −7.18 |
| CEU | 85 | 161 | 5.6 | 2.9 | −1.53 | 0.73 | 0.78 | −0.39 | −0.42 | −127.4 | ||
| FZD5 | 7.0 | CHB | 97 | 18 | 4.4 | 4.5 | 0.05 | −1.03 | −1.07 | −0.73 | −0.75 | 0.65 |
| CEU | 85 | 19 | 4.8 | 3.9 | −0.52 | −0.33 | −0.36 | −0.49 | −0.51 | −2.81 |
P-value was obtained by coalescent simulations using human demographic history incorporating human best-fit model. Marginally significant P-values (0.05<P<0.1) are in marked italics, significant P-values (0.01<P<0.05) are in bold, and the highly significant P-values (P<0.01) are in bold and underlined.
Length of analyzed sequenced region (kb).
Sample size.
Number of segregating sites.
Watterson’s θ estimation per site (× 10−4).
Nucleotide diversity per site (× 10−4).
To gain further insight into the population history of CREB1, we analyzed the sequence data of three other nearby genes (FAM119A, CCNYL1 and FZD5) located within 500 kb of CREB1. For CCNYL1, Europeans showed a low negative Tajima’s DT value (P<0.05, Table 1), an indication of natural selection or population expansion. The Fay and Wu’s H value for CCNYL1 was also significantly negative (P<0.01, Table 1) in Europeans, implying selective sweep (that is, a reduction or elimination of sequence variations as a result of recent and strong positive selection) for this gene in Europeans, but we observed no such signal in Chinese. Therefore, CCNYL1 is the gene under selection in Europeans, and it can influence the sequence variation pattern of its neighboring genes through hitchhiking effect, which explains the elevated CREB1 risk allele frequencies in Europeans. By contrast, in Chinese, the reduced sequence diversity and absence of the risk SNPs can be attributed to different evolutionary forces (that is, selection or population expansion) acting on CREB1 itself. Collectively, the neutrality test results indicated a diverged genetic history for CREB1 between Europeans and Han Chinese.
DISCUSSION
In recent years, there have been numerous genetic association studies on a variety of BD samples, but many could not produce compelling evidence that reached genome-wide significance except for a few GWASs, which reported several genome-wide risk genes, such as CACNA1C, ANK3, ODZ4 and the like.2,6,23,64 These genes can only explain a small portion of the genetic liability for BD, as BD is widely known to be a polygenic disorder with many risk genes of small effects. Previous aggregated analysis indicated there may be accurate findings among those markers passing nominal significance in the GWASs.65 Many studies reported psychosis risk genes, although they did not reach genome-wide significance in the initial GWAS samples, they later showed consistent replications in multiple independent samples, such as CMYA5, VRK2 and FGFR2.59,60,66–68
In small sample sets (<300 cases), association of CREB1 with BD has previously been reported,69–71 with one study finding nominal significant association for the CREB1 variant. However, due to the small sample size and lack of replications, the possibility of false-positive results in their study could not be excluded.70 Here, we further confirmed CREB1 as a risk gene for BD by utilizing a large-scale BD samples of European ancestry (also included a small portion of MDD samples). Our results also suggest that the molecular mechanism of genetic susceptibility relates to changes in gene expression. Although we report here the significant association of several SNPs across independent samples and by meta-analysis, the exact risk structure may vary between populations, whereas the regional location and overall effect on CREB1 gene processing may remain consistent with what is described here. Additionally, the same risk CREB1 SNPs, although showing significant associations with susceptibility to BD, are also associated with SCZ (rs2709370[C], P = 0.026, OR = 1.060; and rs6785[A], P = 0.013, OR = 1.067) and MDD (rs2709370[C], P = 0.022, OR = 1.063; and rs6785[A], P = 0.042, OR = 1.056) in recent large-scale GWASs on SCZ and MDD.72,73 These findings are consistent with the known overlap of genetic risk factors that exist between different psychiatric disorders as well as the less clear-cut boundaries between diagnostic entities.
To our knowledge, the region of interest on chromosome 2q34 has not, to date, been reported as a major locus in the few GWASs of BD, and the P-values reported here would not be significant if we corrected for all SNPs across the genome. Scanning the genome with hundreds of thousands of SNPs and employing the necessary rigid statistical correction as no prior probability of any SNP being positive is a popular strategy at the moment, as it makes no assumptions about biology or function. This strategy has the appeal of a level of statistical significance being clear and incontrovertible. However, statistical significance does not, in and of itself, imply biological significance, nor does it necessarily identify the genes most likely to be important in unraveling new strategies for prevention and treatment, such as CREB1, which is of sufficient biological interest in mood disorders and treatment to merit further genetic and biological investigation.
To move beyond statistical association with clinical diagnosis and to obtain convergent evidence for association between CREB1 and BD-related biology, we have performed a series of convergent experiments testing risk-associated SNPs on several intermediate biological phenotypes. On the basis of clinical evidence22 and repeatedly reported roles of CREB1 in hippocampus,11 we expected that the genetic risk for BD associated with risk CREB1 SNPs would be mediated through hippocampal function. Consistent with this hypothesis, we observed strongly reduced hippocampal activity in healthy human carriers of the rs2709370 risk allele. This effect appears cognitively specific in that it was observed only during memory recall but not during encoding or recognition. Memory recall has been proposed to critically rely on the hippocampus,74 and thus our data provide evidence for a possible link between the role of CREB1 in genetic risk for BD and its functional relevance for hippocampal function, further confirming the associations of CREB1 with BD.
Our expression quantitative trait loci analysis of CREB1 has provided preliminary evidences of molecular mechanisms for the associated SNPs, in which risk alleles showed significantly higher expression in both blood cells and brain tissues when compared with the non-risk alleles, although the results are counter intuitive to our initial expectation that ‘the risk allele indicated lower CREB1 expression’ based on the observations of previous studies such as CREB1 could enhance memory ability,11 which were aberrant in BD patients. However, after a relatively comprehensive summary of CREB1 expression in the brains of BD patients and healthy controls, we observed seven studies showing significant upregulation of CREB1 expression in BD patients (P<0.01, Supplementary Figure S5), which seems consistent with our expression quantitative trait loci analysis. We are, however, cautious in interpreting our results as CREB1 is a target of antipsychotic drugs and it was unclear whether BD patients received medication. Gene expression analyses indicated potential more complicated underlying mechanisms between CREB1 and BD, and future studies on gene expression may shed further light on this relationship.
The striking differences of BD risk alleles between Europeans and Chinese were not expected. As mentioned in our results, analyses showed that this between-population genetic divergence of CREB1 is likely caused by differential genetic histories of CREB1 and its neighboring genes in regional populations. Recent population expansion and natural selection are two major forces shaping the genetic diversity of CREB1 between Europeans and Chinese, thereby resulting in the highly diverged CREB1 genetic backgrounds. Regionally selective forces, such as different environments and lifestyles, may have shaped the genetic background of Europeans. This is the first evidence suggesting that risk alleles for BD in CREB1 arose in Europeans through genetic hitchhiking due to natural selection on its neighboring gene. Consequently, the prevalence of the BD risk alleles of CREB1 among Europeans can be considered the cost of natural selection (the so-called genetic load). Because of the different selective pattern, we found no such cost in Chinese. Similar observations have been reported on SCZ risk genes.75 On a broader scale, these findings suggest that natural selection acting on regional populations could have profound effects on different genes, and by extension, on the detection of susceptibility genes for complex diseases. Accordingly, analyses of population genetic histories may help explain why we frequently observed inconsistent genetic associations of complex diseases among different ethnic populations, as we saw in our analyses of CREB1’s association with BD between Europeans and Chinese.
Supplementary Material
Acknowledgments
We acknowledge the Bipolar Disorder Working Group of Psychiatric GWAS Consortium for their efforts. We are deeply grateful for Stacy Steinberg, Hreinn Stefansson, Kari Stefansson (deCODE genetics, Reykjavik, Iceland) and Engilbert Sigurdsson (Landspitali University Hospital, Reykjavík, Iceland) for their results in the Icelandic samples, Angelika Erhardt (Max Planck Institute of Psychiatry, Kraepelinstr, Munich, Germany) for her assistance in this study, Andrew Willden (Kunming Institute of Zoology, China) for the language editing of the manuscript. We wish to thank Xiaosen Guo, Shanshan Dong and Jun Wang (Shenzhen Key Laboratory of Transomics Biotechnologies, BGI-Shenzhen, China) for providing sequence data of CREB1 from the 1000-Human-Genome project. We would like to thank Daniel R. Weinberger (Lieber Institute for Brain Development, Johns Hopkins University Medical Campus, Baltimore, USA) for his very helpful review of the manuscript. This work was supported by grants from the National 973 project of China (2011CBA00401), the National Natural Science Foundation of China (U1202225, 31130051 and 31071101), the German Federal Ministry of Education and Research (BMBF), the National Genome Research Network (NGFN), and the Integrated Genome Research Network (IG) MooDS (grant 01GS08144 to SC and MMR, grant 01GS08147 to MR and TGS).
Footnotes
CONFLICT OF INTEREST
The authors declare no conflict of interest.
Supplementary Information accompanies the paper on the Molecular Psychiatry website (http://www.nature.com/mp)
References
- 1.Craddock N, Jones I. Genetics of bipolar disorder. J Med Genet. 1999;36:585–594. doi: 10.1136/jmg.36.8.585. [DOI] [PMC free article] [PubMed] [Google Scholar]
- 2.Baum AE, Akula N, Cabanero M, Cardona I, Corona W, Klemens B, et al. A genome-wide association study implicates diacylglycerol kinase eta (DGKH) and several other genes in the etiology of bipolar disorder. Mol Psychiatry. 2008;13:197–207. doi: 10.1038/sj.mp.4002012. [DOI] [PMC free article] [PubMed] [Google Scholar]
- 3.Zeng Z, Wang T, Li T, Li Y, Chen P, Zhao Q, et al. Common SNPs and haplotypes in DGKH are associated with bipolar disorder and schizophrenia in the Chinese Han population. Mol Psychiatry. 2010;16:473–475. doi: 10.1038/mp.2010.86. [DOI] [PubMed] [Google Scholar]
- 4.Petryshen TL, Sabeti PC, Aldinger KA, Fry B, Fan JB, Schaffner SF, et al. Population genetic study of the brain-derived neurotrophic factor (BDNF) gene. Mol Psychiatry. 2009;15:810–815. doi: 10.1038/mp.2009.24. [DOI] [PMC free article] [PubMed] [Google Scholar]
- 5.McGuffin P, Rijsdijk F, Andrew M, Sham P, Katz R, Cardno A. The heritability of bipolar affective disorder and the genetic relationship to unipolar depression. Arch Gen Psychiatry. 2003;60:497–502. doi: 10.1001/archpsyc.60.5.497. [DOI] [PubMed] [Google Scholar]
- 6.Sklar P, Ripke S, Scott LJ, Andreassen OA, Cichon S, Craddock N, et al. Large-scale genome-wide association analysis of bipolar disorder identifies a new susceptibility locus near ODZ4. Nat Genet. 2011;43:977–983. doi: 10.1038/ng.943. [DOI] [PMC free article] [PubMed] [Google Scholar]
- 7.Green EK, Grozeva D, Jones I, Jones L, Kirov G, Caesar S, et al. The bipolar disorder risk allele at CACNA1C also confers risk of recurrent major depression and of schizophrenia. Mol Psychiatry. 2009;15:1016–1022. doi: 10.1038/mp.2009.49. [DOI] [PMC free article] [PubMed] [Google Scholar]
- 8.Green EK, Grozeva D, Forty L, Gordon-Smith K, Russell E, Farmer A, et al. Association at SYNE1 in both bipolar disorder and recurrent major depression. Mol Psychiatry. 2013;18:614–617. doi: 10.1038/mp.2012.48. [DOI] [PubMed] [Google Scholar]
- 9.Sullivan PF, de Geus EJ, Willemsen G, James MR, Smit JH, Zandbelt T, et al. Genome-wide association for major depressive disorder: a possible role for the pre-synaptic protein piccolo. Mol Psychiatry. 2009;14:359–375. doi: 10.1038/mp.2008.125. [DOI] [PMC free article] [PubMed] [Google Scholar]
- 10.Choi KH, Higgs BW, Wendland JR, Song J, McMahon FJ, Webster MJ. Gene expression and genetic variation data implicate PCLO in bipolar disorder. Biol Psychiatry. 2010;69:353–359. doi: 10.1016/j.biopsych.2010.09.042. [DOI] [PMC free article] [PubMed] [Google Scholar]
- 11.Carlezon WA, Jr, Duman RS, Nestler EJ. The many faces of CREB. Trends Neurosci. 2005;28:436–445. doi: 10.1016/j.tins.2005.06.005. [DOI] [PubMed] [Google Scholar]
- 12.Weeber EJ, Levenson JM, Sweatt JD. Molecular genetics of human cognition. Mol Interv. 2002;2:376–391339. doi: 10.1124/mi.2.6.376. [DOI] [PubMed] [Google Scholar]
- 13.Wallace TL, Stellitano KE, Neve RL, Duman RS. Effects of cyclic adenosine monophosphate response element binding protein overexpression in the basolateral amygdala on behavioral models of depression and anxiety. Biol Psychiatry. 2004;56:151–160. doi: 10.1016/j.biopsych.2004.04.010. [DOI] [PubMed] [Google Scholar]
- 14.Zubenko GS, Hughes HB, 3rd, Maher BS, Stiffler JS, Zubenko WN, Marazita ML. Genetic linkage of region containing the CREB1 gene to depressive disorders in women from families with recurrent, early-onset, major depression. Am J Med Genet. 2002;114:980–987. doi: 10.1002/ajmg.b.10933. [DOI] [PubMed] [Google Scholar]
- 15.Maher BS, Hughes HB, 3rd, Zubenko WN, Zubenko GS. Genetic linkage of region containing the CREB1 gene to depressive disorders in families with recurrent, early-onset, major depression: a re-analysis and confirmation of sex-specific effect. Am J Med Genet B Neuropsychiatr Genet. 2009;153B:10–16. doi: 10.1002/ajmg.b.30987. [DOI] [PMC free article] [PubMed] [Google Scholar]
- 16.Zubenko GS, Hughes HB, 3rd, Stiffler JS, Brechbiel A, Zubenko WN, Maher BS, et al. Sequence variations in CREB1 cosegregate with depressive disorders in women. Mol Psychiatry. 2003;8:611–618. doi: 10.1038/sj.mp.4001354. [DOI] [PubMed] [Google Scholar]
- 17.Blendy JA. The role of CREB in depression and antidepressant treatment. Biol Psychiatry. 2006;59:1144–1150. doi: 10.1016/j.biopsych.2005.11.003. [DOI] [PubMed] [Google Scholar]
- 18.Perlis RH, Purcell S, Fagerness J, Cusin C, Yamaki L, Fava M, et al. Clinical and genetic dissection of anger expression and CREB1 polymorphisms in major depressive disorder. Biol Psychiatry. 2007;62:536–540. doi: 10.1016/j.biopsych.2006.10.034. [DOI] [PubMed] [Google Scholar]
- 19.Rimol LM, Hartberg CB, Nesvag R, Fennema-Notestine C, Hagler DJ, Jr, Pung CJ, et al. Cortical thickness and subcortical volumes in schizophrenia and bipolar disorder. Biol Psychiatry. 2010;68:41–50. doi: 10.1016/j.biopsych.2010.03.036. [DOI] [PubMed] [Google Scholar]
- 20.Quraishi S, Walshe M, McDonald C, Schulze K, Kravariti E, Bramon E, et al. Memory functioning in familial bipolar I disorder patients and their relatives. Bipolar Disord. 2009;11:209–214. doi: 10.1111/j.1399-5618.2008.00661.x. [DOI] [PubMed] [Google Scholar]
- 21.Phillips ML, Ladouceur CD, Drevets WC. A neural model of voluntary and automatic emotion regulation: implications for understanding the pathophysiology and neurodevelopment of bipolar disorder. Mol Psychiatry. 2008;13:829, 833–857. doi: 10.1038/mp.2008.65. [DOI] [PMC free article] [PubMed] [Google Scholar]
- 22.Frey BN, Andreazza AC, Nery FG, Martins MR, Quevedo J, Soares JC, et al. The role of hippocampus in the pathophysiology of bipolar disorder. Behav Pharmacol. 2007;18:419–430. doi: 10.1097/FBP.0b013e3282df3cde. [DOI] [PubMed] [Google Scholar]
- 23.Cichon S, Muhleisen TW, Degenhardt FA, Mattheisen M, Miro X, Strohmaier J, et al. Genome-wide association study identifies genetic variation in neurocan as a susceptibility factor for bipolar disorder. Am J Hum Genet. 2011;88:372–381. doi: 10.1016/j.ajhg.2011.01.017. [DOI] [PMC free article] [PubMed] [Google Scholar]
- 24.Lewis CM, Ng MY, Butler AW, Cohen-Woods S, Uher R, Pirlo K, et al. Genome-wide association study of major recurrent depression in the U.K. population. Am J Psychiatry. 2010;167:949–957. doi: 10.1176/appi.ajp.2010.09091380. [DOI] [PubMed] [Google Scholar]
- 25.Kohli MA, Lucae S, Saemann PG, Schmidt MV, Demirkan A, Hek K, et al. The neuronal transporter gene SLC6A15 confers risk to major depression. Neuron. 2011;70:252–265. doi: 10.1016/j.neuron.2011.04.005. [DOI] [PMC free article] [PubMed] [Google Scholar]
- 26.Devlin B, Roeder K. Genomic control for association studies. Biometrics. 1999;55:997–1004. doi: 10.1111/j.0006-341x.1999.00997.x. [DOI] [PubMed] [Google Scholar]
- 27.Barrett JC, Fry B, Maller J, Daly MJ. Haploview: analysis and visualization of LD and haplotype maps. Bioinformatics. 2005;21:263–265. doi: 10.1093/bioinformatics/bth457. [DOI] [PubMed] [Google Scholar]
- 28.Purcell S, Neale B, Todd-Brown K, Thomas L, Ferreira MA, Bender D, et al. PLINK: a tool set for whole-genome association and population-based linkage analyses. Am J Hum Genet. 2007;81:559–575. doi: 10.1086/519795. [DOI] [PMC free article] [PubMed] [Google Scholar]
- 29.Abecasis GR, Auton A, Brooks LD, DePristo MA, Durbin RM, Handsaker RE, et al. An integrated map of genetic variation from 1092 human genomes. Nature. 2012;491:56–65. doi: 10.1038/nature11632. [DOI] [PMC free article] [PubMed] [Google Scholar]
- 30.Bis JC, Decarli C, Smith AV, van der Lijn F, Crivello F, Fornage M, et al. Common variants at 12q14 and 12q24 are associated with hippocampal volume. Nat Genet. 2012;44:545–551. doi: 10.1038/ng.2237. [DOI] [PMC free article] [PubMed] [Google Scholar]
- 31.Stein JL, Medland SE, Vasquez AA, Hibar DP, Senstad RE, Winkler AM, et al. Identification of common variants associated with human hippocampal and intracranial volumes. Nat Genet. 2012;44:552–561. doi: 10.1038/ng.2250. [DOI] [PMC free article] [PubMed] [Google Scholar]
- 32.Peper JS, Brouwer RM, Boomsma DI, Kahn RS, Hulshoff Pol HE. Genetic influences on human brain structure: a review of brain imaging studies in twins. Hum Brain Mapp. 2007;28:464–473. doi: 10.1002/hbm.20398. [DOI] [PMC free article] [PubMed] [Google Scholar]
- 33.Erk S, Meyer-Lindenberg A, Schnell K, Opitz von Boberfeld C, Esslinger C, Kirsch P, et al. Brain function in carriers of a genome-wide supported bipolar disorder variant. Arch Gen Psychiatry. 2010;67:803–811. doi: 10.1001/archgenpsychiatry.2010.94. [DOI] [PubMed] [Google Scholar]
- 34.Esslinger C, Walter H, Kirsch P, Erk S, Schnell K, Arnold C, et al. Neural mechanisms of a genome-wide supported psychosis variant. Science. 2009;324:605. doi: 10.1126/science.1167768. [DOI] [PubMed] [Google Scholar]
- 35.Walter H, Schnell K, Erk S, Arnold C, Kirsch P, Esslinger C, et al. Effects of a genome-wide supported psychosis risk variant on neural activation during a theory-of-mind task. Mol Psychiatry. 2010;16:462–470. doi: 10.1038/mp.2010.18. [DOI] [PubMed] [Google Scholar]
- 36.Burgess N, Maguire EA, O’Keefe J. The human hippocampus and spatial and episodic memory. Neuron. 2002;35:625–641. doi: 10.1016/s0896-6273(02)00830-9. [DOI] [PubMed] [Google Scholar]
- 37.Smith ML, Milner B. The role of the right hippocampus in the recall of spatial location. Neuropsychologia. 1981;19:781–793. doi: 10.1016/0028-3932(81)90090-7. [DOI] [PubMed] [Google Scholar]
- 38.Smith ML, Milner B. Right hippocampal impairment in the recall of spatial location: encoding deficit or rapid forgetting? Neuropsychologia. 1989;27:71–81. doi: 10.1016/0028-3932(89)90091-2. [DOI] [PubMed] [Google Scholar]
- 39.Yang TP, Beazley C, Montgomery SB, Dimas AS, Gutierrez-Arcelus M, Stranger BE, et al. Genevar: a database and Java application for the analysis and visualization of SNP-gene associations in eQTL studies. Bioinformatics. 2010;26:2474–2476. doi: 10.1093/bioinformatics/btq452. [DOI] [PMC free article] [PubMed] [Google Scholar]
- 40.Dimas AS, Deutsch S, Stranger BE, Montgomery SB, Borel C, Attar-Cohen H, et al. Common regulatory variation impacts gene expression in a cell type-dependent manner. Science. 2009;325:1246–1250. doi: 10.1126/science.1174148. [DOI] [PMC free article] [PubMed] [Google Scholar]
- 41.Colantuoni C, Lipska BK, Ye T, Hyde TM, Tao R, Leek JT, et al. Temporal dynamics and genetic control of transcription in the human prefrontal cortex. Nature. 2011;478:519–523. doi: 10.1038/nature10524. [DOI] [PMC free article] [PubMed] [Google Scholar]
- 42.Kim S, Webster MJ. The stanley neuropathology consortium integrative database: a novel, web-based tool for exploring neuropathological markers in psychiatric disorders and the biological processes associated with abnormalities of those markers. Neuropsychopharmacology. 2009;35:473–482. doi: 10.1038/npp.2009.151. [DOI] [PMC free article] [PubMed] [Google Scholar]
- 43.Liu C, Cheng L, Badner JA, Zhang D, Craig DW, Redman M, et al. Whole-genome association mapping of gene expression in the human prefrontal cortex. Mol Psychiatry. 2010;15:779–784. doi: 10.1038/mp.2009.128. [DOI] [PMC free article] [PubMed] [Google Scholar]
- 44.Gamazon ER, Badner JA, Cheng L, Zhang C, Zhang D, Cox NJ, et al. Enrichment of cis-regulatory gene expression SNPs and methylation quantitative trait loci among bipolar disorder susceptibility variants. Mol Psychiatry. 2013;18:340–346. doi: 10.1038/mp.2011.174. [DOI] [PMC free article] [PubMed] [Google Scholar]
- 45.Djebali S, Davis CA, Merkel A, Dobin A, Lassmann T, Mortazavi A, et al. Landscape of transcription in human cells. Nature. 2012;489:101–108. doi: 10.1038/nature11233. [DOI] [PMC free article] [PubMed] [Google Scholar]
- 46.Dunham I, Kundaje A, Aldred SF, Collins PJ, Davis CA, Doyle F, et al. An integrated encyclopedia of DNA elements in the human genome. Nature. 2012;489:57–74. doi: 10.1038/nature11247. [DOI] [PMC free article] [PubMed] [Google Scholar]
- 47.Gerstein MB, Kundaje A, Hariharan M, Landt SG, Yan KK, Cheng C, et al. Architecture of the human regulatory network derived from ENCODE data. Nature. 2012;489:91–100. doi: 10.1038/nature11245. [DOI] [PMC free article] [PubMed] [Google Scholar]
- 48.Neph S, Vierstra J, Stergachis AB, Reynolds AP, Haugen E, Vernot B, et al. An expansive human regulatory lexicon encoded in transcription factor footprints. Nature. 2012;489:83–90. doi: 10.1038/nature11212. [DOI] [PMC free article] [PubMed] [Google Scholar]
- 49.Sanyal A, Lajoie BR, Jain G, Dekker J. The long-range interaction landscape of gene promoters. Nature. 2012;489:109–113. doi: 10.1038/nature11279. [DOI] [PMC free article] [PubMed] [Google Scholar]
- 50.Thurman RE, Rynes E, Humbert R, Vierstra J, Maurano MT, Haugen E, et al. The accessible chromatin landscape of the human genome. Nature. 2012;489:75–82. doi: 10.1038/nature11232. [DOI] [PMC free article] [PubMed] [Google Scholar]
- 51.Boyle AP, Hong EL, Hariharan M, Cheng Y, Schaub MA, Kasowski M, et al. Annotation of functional variation in personal genomes using RegulomeDB. Genome Res. 2012;22:1790–1797. doi: 10.1101/gr.137323.112. [DOI] [PMC free article] [PubMed] [Google Scholar]
- 52.Liu C, Zhang F, Li T, Lu M, Wang L, Yue W, et al. MirSNP, a database of polymorphisms altering miRNA target sites, identifies miRNA-related SNPs in GWAS SNPs and eQTLs. BMC Genomics. 2012;13:661. doi: 10.1186/1471-2164-13-661. [DOI] [PMC free article] [PubMed] [Google Scholar]
- 53.Pickrell JK, Coop G, Novembre J, Kudaravalli S, Li JZ, Absher D, et al. Signals of recent positive selection in a worldwide sample of human populations. Genome Res. 2009;19:826–837. doi: 10.1101/gr.087577.108. [DOI] [PMC free article] [PubMed] [Google Scholar]
- 54.Tajima F. Statistical method for testing the neutral mutation hypothesis by DNA polymorphism. Genetics. 1989;123:585–595. doi: 10.1093/genetics/123.3.585. [DOI] [PMC free article] [PubMed] [Google Scholar]
- 55.Fu YX, Li WH. Statistical tests of neutrality of mutations. Genetics. 1993;133:693–709. doi: 10.1093/genetics/133.3.693. [DOI] [PMC free article] [PubMed] [Google Scholar]
- 56.Fu YX. Statistical tests of neutrality of mutations against population growth, hitchhiking and background selection. Genetics. 1997;147:915–925. doi: 10.1093/genetics/147.2.915. [DOI] [PMC free article] [PubMed] [Google Scholar]
- 57.Fay JC, Wu CI. Hitchhiking under positive Darwinian selection. Genetics. 2000;155:1405–1413. doi: 10.1093/genetics/155.3.1405. [DOI] [PMC free article] [PubMed] [Google Scholar]
- 58.Schaffner SF, Foo C, Gabriel S, Reich D, Daly MJ, Altshuler D. Calibrating a coalescent simulation of human genome sequence variation. Genome Res. 2005;15:1576–1583. doi: 10.1101/gr.3709305. [DOI] [PMC free article] [PubMed] [Google Scholar]
- 59.Chen X, Lee G, Maher BS, Fanous AH, Chen J, Zhao Z, et al. GWA study data mining and independent replication identify cardiomyopathy-associated 5 (CMYA5) as a risk gene for schizophrenia. Mol Psychiatry. 2010;16:1117–1129. doi: 10.1038/mp.2010.96. [DOI] [PMC free article] [PubMed] [Google Scholar]
- 60.Steinberg S, de Jong S, Andreassen OA, Werge T, Borglum AD, Mors O, et al. Common variants at VRK2 and TCF4 conferring risk of schizophrenia. Hum Mol Genet. 2011;20:4076–4081. doi: 10.1093/hmg/ddr325. [DOI] [PMC free article] [PubMed] [Google Scholar]
- 61.Ioannidis JP, Boffetta P, Little J, O’Brien TR, Uitterlinden AG, Vineis P, et al. Assessment of cumulative evidence on genetic associations: interim guidelines. Int J Epidemiol. 2008;37:120–132. doi: 10.1093/ije/dym159. [DOI] [PubMed] [Google Scholar]
- 62.DeCarli C, Massaro J, Harvey D, Hald J, Tullberg M, Au R, et al. Measures of brain morphology and infarction in the framingham heart study: establishing what is normal. Neurobiol Aging. 2005;26:491–510. doi: 10.1016/j.neurobiolaging.2004.05.004. [DOI] [PubMed] [Google Scholar]
- 63.Sullivan EV, Pfefferbaum A, Swan GE, Carmelli D. Heritability of hippocampal size in elderly twin men: equivalent influence from genes and environment. Hippocampus. 2001;11:754–762. doi: 10.1002/hipo.1091. [DOI] [PubMed] [Google Scholar]
- 64.Ferreira MA, O’Donovan MC, Meng YA, Jones IR, Ruderfer DM, Jones L, et al. Collaborative genome-wide association analysis supports a role for ANK3 and CACNA1C in bipolar disorder. Nat Genet. 2008;40:1056–1058. doi: 10.1038/ng.209. [DOI] [PMC free article] [PubMed] [Google Scholar]
- 65.Purcell SM, Wray NR, Stone JL, Visscher PM, O’Donovan MC, Sullivan PF, et al. Common polygenic variation contributes to risk of schizophrenia and bipolar disorder. Nature. 2009;460:748–752. doi: 10.1038/nature08185. [DOI] [PMC free article] [PubMed] [Google Scholar]
- 66.O’Donovan MC, Norton N, Williams H, Peirce T, Moskvina V, Nikolov I, et al. Analysis of 10 independent samples provides evidence for association between schizophrenia and a SNP flanking fibroblast growth factor receptor 2. Mol Psychiatry. 2009;14:30–36. doi: 10.1038/mp.2008.108. [DOI] [PMC free article] [PubMed] [Google Scholar]
- 67.Li M, Luo XJ, Zhang X, Yang ZH, Xiang K, Xiao X, et al. A common variant of the cardiomyopathy associated 5 gene (CMYA5) is associated with schizophrenia in Chinese population. Schizophr Res. 2011;129:217–219. doi: 10.1016/j.schres.2010.12.016. [DOI] [PubMed] [Google Scholar]
- 68.Li M, Wang Y, Zheng XB, Ikeda M, Iwata N, Luo XJ, et al. Meta-analysis and brain imaging data support the involvement of VRK2 (rs2312147) in schizophrenia susceptibility. Schizophr Res. 2012;142:200–205. doi: 10.1016/j.schres.2012.10.008. [DOI] [PubMed] [Google Scholar]
- 69.Burcescu I, Wigg K, King N, Vetro A, Kiss E, Katay L, et al. Association study of CREB1 and childhood-onset mood disorders. Am J Med Genet B Neuropsychiatr Genet. 2005;137B:45–50. doi: 10.1002/ajmg.b.30201. [DOI] [PubMed] [Google Scholar]
- 70.Mamdani F, Alda M, Grof P, Young LT, Rouleau G, Turecki G. Lithium response and genetic variation in the CREB family of genes. Am J Med Genet B Neuropsychiatr Genet. 2008;147B:500–504. doi: 10.1002/ajmg.b.30617. [DOI] [PMC free article] [PubMed] [Google Scholar]
- 71.Crisafulli C, Shim DS, Andrisano C, Pae CU, Chiesa A, Han C, et al. Case-control association study of 14 variants of CREB1, CREBBP and CREM on diagnosis and treatment outcome in major depressive disorder and bipolar disorder. Psychiatry Res. 2012;198:39–46. doi: 10.1016/j.psychres.2011.08.022. [DOI] [PubMed] [Google Scholar]
- 72.Ripke S, Sanders AR, Kendler KS, Levinson DF, Sklar P, Holmans PA, et al. Genome-wide association study identifies five new schizophrenia loci. Nat Genet. 2011;43:969–976. doi: 10.1038/ng.940. [DOI] [PMC free article] [PubMed] [Google Scholar]
- 73.Major Depressive Disorder Working Group of the Psychiatric GWAS Consortium. A mega-analysis of genome-wide association studies for major depressive disorder. Mol Psychiatry. 2013;18:497–511. doi: 10.1038/mp.2012.21. [DOI] [PMC free article] [PubMed] [Google Scholar]
- 74.Aggleton JP, Brown MW. Interleaving brain systems for episodic and recognition memory. Trends Cogn Sci. 2006;10:455–463. doi: 10.1016/j.tics.2006.08.003. [DOI] [PubMed] [Google Scholar]
- 75.Crespi B, Summers K, Dorus S. Adaptive evolution of genes underlying schizophrenia. Proc Biol Sci. 2007;274:2801–2810. doi: 10.1098/rspb.2007.0876. [DOI] [PMC free article] [PubMed] [Google Scholar]
Associated Data
This section collects any data citations, data availability statements, or supplementary materials included in this article.