

Abstract
Diffusion of solutes and macromolecules in the extracellular space (ECS) in brain is important for non-synaptic intercellular communication, extracellular ionic buffering, and delivery of drugs and metabolites. Diffusion in tumor ECS is important for delivery of anti-tumor drugs. The ECS in brain comprises ∼20% of brain parenchymal volume and contains cell–cell gaps down to ∼50 nm. We have developed fluorescence methods to quantify solute diffusion in the ECS, allowing measurements deep in solid tissues using microfiberoptics with micron tip size. Diffusion through the tortuous ECS in brain is generally slowed by ∼3–5-fold compared with that in water, with approximately half of the slowing due to tortuous ECS geometry and half due to the mildly viscous extracellular matrix (ECM). Mathematical modeling of slowed diffusion in an ECS with reasonable anatomical accuracy is in good agreement with experiment. In tumor tissue, diffusion of small macromolecules is only mildly slowed (<3-fold slower than in water) in superficial tumor, but is greatly slowed (>10-fold) at a depth of few millimeters as the tumor tissue becomes more compact. Slowing by ECM components such as collagen contribute to the slowed diffusion. Therefore, as found within cells, cellular crowding and highly tortuous transport can produce only minor slowing of diffusion in the ECS.
Introduction
The extracellular space (ECS) is the volume outside of cells in solid tissues, consisting of a jelly-like aqueous matrix into which various cell types and blood vessels are embedded. The fraction of total tissue volume that is extracellular, called α, is an important determinant of solute and macromolecule diffusion between tissue microvasculature and cells. The other determinants of solute diffusion in the ECS are the composition (viscous properties) of the extracellular matrix (ECM) and the detailed ECS geometry. There is long-standing interest in ECS anatomy and ECM composition, and their effects on diffusion in the ECS, with most attention focused on the ECS in brain and tumor tissue.
Diffusion in the ECS in brain is important for a variety of functions, such as non-synaptic cell–cell communication, cellular nutrient uptake, extracellular K+ and glutamate buffering during neuronal signaling, and seizure activity and cortical spreading depression [1, 2]. Brain ECS represents on average ∼20% (α = 0.20) of parenchymal volume, though α varies somewhat in different regions of brain. The small α can translate to relatively large, dynamic change in ECS size and composition during neuroexcitation; for example K+ is rapidly dumped by neurons during neuroexcitation, with excess K+ and water taken up by astrocytes [3, 4].
Diffusion in tumor ECS (or ‘tumor interstitium’) is involved in nutrient uptake by tumor cells, and is particularly important for delivery of intravenous or directly injected anti-tumor drugs to tumor cells [5]. Convective delivery in solid tumors is probably minimal because of elevated interstitial fluid pressure as a consequence of vascular leakiness and the absence of functional lymphatics [6]. As in brain, the determinants of diffusion in tumor ECS include ECM composition, and ECS size and geometry [7, 8]. The ECM is composed mainly of type I collagen, glycosaminoglycans such as hyaluronan, proteoglycans such as decorin and glycoproteins [9, 10]. It was originally believed, based largely on measurements in light-accessible superficial tumor tissue [11–14], that diffusion through tumor ECS is rapid and hence not a major barrier to drug delivery.
Here, recent advances made in our laboratory are reviewed in biophysical measurement methods and modeling that have impacted our understanding of solute and macromolecular diffusion in the ECS of brain and tumor tissues. We previously reviewed diffusion within cellular aqueous and membrane compartments, and concluded that diffusion was often minimally slowed even in crowded regions, and that the concept of anomalous diffusion is probably overrated [15]. The development of microfiberoptic measurement methods [16] has allowed detection of fluorescence deep in solid tissues in vivo for measurement of ECS volume fraction α [17, 18] and diffusion in tissue (expressed as ratio of diffusion in water versus tissue, Do/D) [19, 20]). Microfiberoptic studies have yielded interesting descriptive data on α and Do/D, which has facilitated mathematical modeling of ECS diffusion. In addition, a number of unanticipated observations have emerged from deep-tissue diffusion measurements, such as greatly slowed ECS diffusion deep in tumors.
New methods to measure ECS volume fraction
The ECS volume fraction α has been a subject of long-standing interest, with wide variation in α reported in different tissues in the older literature, utilizing methods such as partitioning of radioactive extracellular markers [21–23]. Much of the more recent information about α in brain has come from measurements in brain slices using the tetramethylammonium (TMA+) method, where α in the range 0.15 to 0.28 has been reported [2, 24]. The TMA+ method, which was introduced more than 30 years ago [25], involves iontophoretic infusion of TMA+ into tissue through a micropipette, and microelectrode detection of [TMA+] using an ion-selective, dual-lumen micropipette near the delivery site. The TMA+ method is technically very challenging, in part because it requires construction of a triple-barrel micropipette, as so it has been used only by a few laboratories worldwide. The TMA+ method also requires difficult-to-justify assumptions and complex analysis procedures, and is very sensitive to anisotropy in tissue structure (discussed in [18]).
We developed a simple dye partitioning method to measure α accurately in slices of tissues such as brain and tumor [17]. As diagrammed in figure 1(A), the method, called ‘fluorescent dye partitioning with microfiberoptic detection’ (DPMD), relies on fluorescent dye equilibration between the aqueous ECS and the external solution overlying the slice. The ECS volume fraction α is the ratio of dye molecules per unit volume in the slice to that in the external solution. The dye ratio is measured using a microfiberoptic whose micron-size tip is inserted into the tissue slice through the overlying solution. If the effective detection volume of the microfiberoptic is the same in the tissue and the overlying solution, and if the fluorescent dye partitions evenly between tissue ECS and the solution, then the fluorescence intensity ratio measured in slice versus solution is equal to α.
Figure 1.
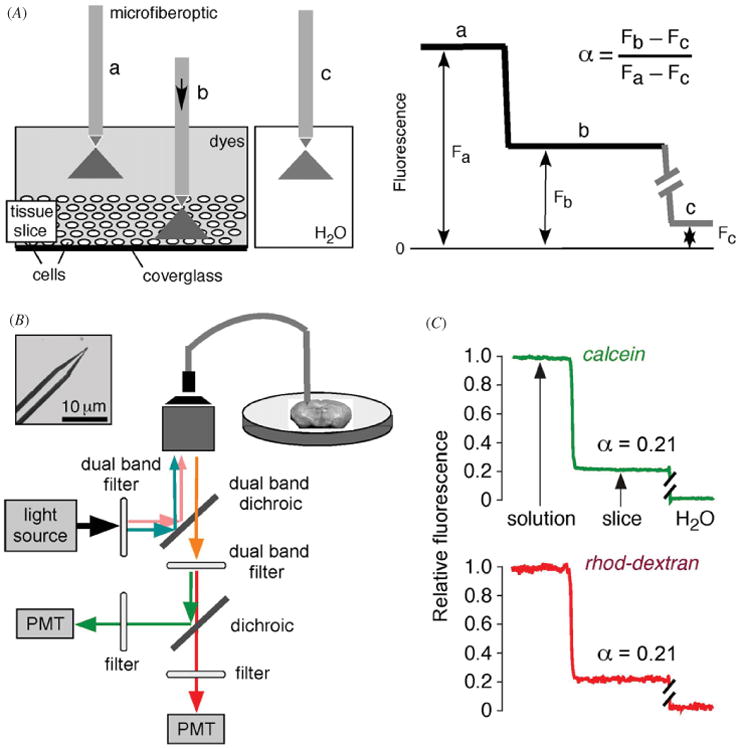
Extracellular space volume determination by fluorescent dye partitioning with microfiberoptic detection (DPMD). Left: method principle, showing microfiberoptic detection of fluorescence of a non-interacting, aqueous-phase dye in tissue slice and overlying solution. The illumination/detection volume is approximately conical, with most of the light collected from near the fiberoptic tip. Right: schematic of data, showing α determination from the ratio of (background-subtracted) dye fluorescence in slice to that in overlying solution. (B) Instrumentation showing multi-mode etched microfiberoptic with micron-size tip inserted into the overlying solution and tissue slice. Inset shows microfiberoptic tip geometry. Fluorescence from two probes of different colors are detected simultaneously using photomultipliers. (C) ECS volume measurement in mouse brain slice with microfiberoptic tip positioned at depth 200 μm in a 400 μm-thick brain slice. Adapted from [17].
As diagrammed in figure 1(B), the microfiberoptic is inserted into the dye-equilibrated tissue slice. The distal end of a multimode fiberoptic is chemically etched with hydrofluoric acid as described [16] to create a tapered tip down to ∼3 μm diameter. Dye fluorescence is detected using an epifluorescence microscope in which the excitation light is focused onto the back of the fiberoptic. Measurement of α requires an appropriately shaped microfiberoptic and non-interacting fluorescent probes, such that the measured fluorescence signal is proportional to the aqueous-phase ECS volume fraction at the location of the microfiberoptic tip. To ensure robustness of the results, two fluorescent dyes (calcein and rhodamine-dextran) are detected simultaneously, as diagrammed. The method and dye selection was validated using cell-embedded gels with known α, and various optical and geometric factors, such as light scattering by tissue, were considered [17].
Figure 1(C) shows a measurement made in a 400 μm-thick mouse brain slice (within cortex) bathed under physiological conditions in artificial cerebrospinal fluid (aCSF) containing calcein and rhodamine-dextran. The green and red fluorescence of calcein and rhodamine-dextran, respectively, were stable during insertion into the fluorescent solution overlying the brain slice, and then were reduced within the slice to ∼21% of that in the overlying solution. In additional studies in brain slices from mice α was strongly location-dependent, ranging from 0.16 in thalamus to 0.22 in brain stem, and was sensitive to cell volume changes. Transgenic mice lacking astrocyte water channel aquaporin-4 had an expanded ECS, with α of 0.181 ± 0.002 in cortex in wildtype mice versus 0.211 ± 0.003 in AQP4 knockout mice. In slices of LLC1 cells tumors grown in mice to ∼5 mm diameter, α decreased from ∼0.45 in superficial tumor to <0.25 in deeper (>100 μm) tumor. Prior measurements in human gliomas using the TMA+ method showed a wide range of α, with values ∼0.35 for low-grade astrocytomas up to 0.43 for high-grade glioblastomas [7].
A limitation of the DPMD method is its applicability to α measurements in ex vivo tissue slices in which equilibrium dye partitioning is possible. We introduced a different, albeit more complex method, to measure α in solid tissues in vivo, called ‘pulsed-infusion microfiberoptic photodetection’ (PIMP) [18]. As diagrammed in figure 2(A), the method involves brief iontophoretic deposition of two fluorescent dyes, calcein and sulforhodamine 101 (SR), over a distance greater than the separation between delivery and microfiberoptic measurement sites. Calcein is delivered at self-quenching concentrations. Following deposition, the dyes diffuse away over time. The time course of calcein fluorescence is related to calcein diffusion and self-quenching, whereas the time course of SR fluorescence depends only on SR diffusion. Experimentally, the fluorescence time course following dye infusion in a test material such as brain is compared to a reference (0.3% agarose gel, α = 1). Because calcein is initially self-quenched, its fluorescence will initially increase to a maximum value when calcein is ∼3 mM. Maximum calcein fluorescence is proportional to α, since calcein molecules in the detection volume are distributed in volume fraction α. Therefore, the ratio of maximum calcein fluorescence in test versus reference samples is equal to α. The ratio of half-times (t1/2) for decay of SR fluorescence in the test versus reference samples gives Do/D.
Figure 2.

Extracellular space volume determination by ‘pulsed-infusion microfiberoptic photodetection’ (PIMP). (A) Method principle. Two dyes—calcein at self-quenching concentration and sulforhodamine 101 (SR), a dye that does not undergo self-quenching—are deposited by a brief (1 s) iontophoresis pulse. Reduced extracellular space volume fraction (α) results in a reduced aqueous volume for dye deposition, and consequent reduced calcein fluorescence. SR fluorescence provides an α-independent ‘reference’. (B) Measurements in gels embedded with live SP2/0 cells in 0.3% agarose, giving α of 1 (gel not containing cells), 0.42 and 0.21. Left: brightfield micrographs of the cell-embedded gels. Right: time course of calcein (center panels) and SR (right panels) fluorescence following pulsed iontophoretic dye delivery. (C) PIMP measurement made at a depth of 400 μm in mouse brain cortex before and after inducing brain swelling by intraperitoneal water administration. For comparison data shown for (cell-free) agarose cel. Adapted from [18].
The PIMP method was validated using cell-embedded gels with specified α of 1.0 (agarose gel not containing cells), 0.42 and 0.21. Figure 2(B) show light micrographs of the gels (left panels) and time courses of calcein and SR fluorescence (right panels). With decreasing α, the amplitudes of the calcein fluorescence curves are reduced, whereas the amplitudes of the SR curves were unchanged, as predicted. Measured α agreed well with that computed from cell density and size.
The PIMP method was applied to measure α and Do/D in various solid organs in mice. Figure 2(C) shows the time course of calcein and SR fluorescence in brain cortex, compared with the α = 1 reference. Data from multiple measurements in brain gave α of 0.20 ± 0.01 and Do/D of 3.6 ± 0.3. Also shown in figure 2(C) is the reduced α following brain swelling caused by water intoxication. The PIMP method was also applied in other tissues, with low α of 0.13 ± 0.02 measured in kidney and 0.074 ± 0.01 in skeletal muscle.
Photobleaching measurements of diffusion in brain ECS
We adapted the fluorescence recovery after photobleaching method to measure fluorescent dye diffusion in brain ECS in vivo [26]. The ECS in mouse brain was fluorescently stained by exposure of the intact dura, following craniectomy, to FITC-dextran (figure 3(A)). FITC-dextran diffusion was detected by fluorescence recovery after laser-induced cortical surface photobleaching using confocal optics, as diagrammed in figure 3(B). Figure 3(C) shows fluorescence recovery data for FITC-dextran (4 kDa, hydrodynamic radius ∼4 nm) in aCSF (relative viscosity 1.0) and in brain cortex, the later showing similar recovery kinetics to that of aCSF containing glycerol (to give relative viscosity ∼3). Similar slowing of the diffusion of TMA+ in brain versus saline has been reported [2]. Diffusion of FITC-dextran was significantly accelerated in AQP4 null mice, indicating an expanded ECS [26]. Also, cytotoxic brain edema (produced by water intoxication) or seizure activity (produced by convulsant administration) greatly slowed diffusion by >10-fold. In a follow-on study, FITC-dextran diffusion in ECS at the brain surface was increased in brain tumor and freeze-injury models of vasogenic edema, which are associated with ECS expansion [27].
Figure 3.
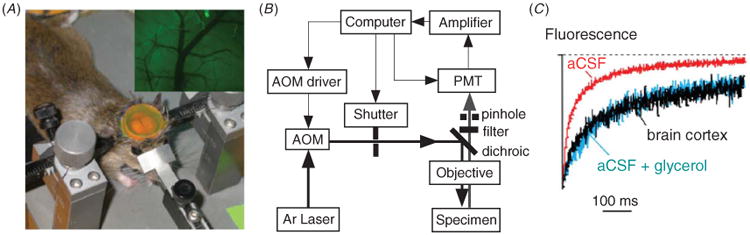
Diffusion of FITC-dextran in mouse brain cortex measured by cortical surface photobleaching. (A) Mouse brain surface exposed to FITC-dextran with dura intact following craniectomy. Inset shows fluorescence imaging of the brain cortical surface after dye loading. (B) Photobleaching apparatus. A laser beam is modulated by an acousto-optic modulator and directed onto the brain surface. (C) In vivo fluorescence recovery in mouse brain cortex shown in comparison to aCSF (relative viscosity 1) and 30% glycerol (relative viscosity ∼3) in aCSF. Adapted from [26].
As mentioned above, the determinants of ECS diffusion include ECM composition (matrix viscosity) and geometry (tortuosity). In order to establish the relative contributions of these factors, we exploited the fact that in spinal cord white matter diffusion along oriented neuronal fibers is hindered mainly by the ECM rather than by geometric factors [28]. An ‘elliptical’ spot photobleaching approach was developed in which anisotropic diffusion was quantified using an elliptical spot produced by cylindrical excitation optics. The method was applied to measure FITC-dextran diffusion in white matter tracts in thoracic spinal cord in live mice. It was found that the ECM slows FITC-dextran diffusion by ∼1.8-fold compared with diffusion in water. ECS geometry hinders diffusion across (but not along) axonal fibers in spinal cord by a further ∼5-fold. From these and additional measurements in brain cortex, we concluded that ∼50% of the hindrance to ECS diffusion comes from the ECM and ∼50% from geometric factors.
As mentioned above with regard to α determination, a major limitation of surface fluorescence measurement methods is the relatively shallow penetration depth of light in tissues, precluding diffusion measurements beyond ∼150 μm in solid tissues such as brain. To overcome this limitation for diffusion measurements deep in solid tissues we developed a microfiberoptic epifluorescence photobleaching (MFEP) method that overcomes this limited light penetration [16]. MFEP involves introduction, deep in living tissues, of a multimode optical fiber with a tapered shaft and micron-size tip diameter. Fluorescence recovery is measured following the bleaching of a small volume near the tip of the microfiberoptic. Diffusion coefficients are deduced quantitatively from fluorescence recovery data.
In order to introduce fluorescent dyes deep into tissue, a double-lumen microcapillary system was constructed in which an injection microcapillary is position next to a hollow microcapillary through which the microfiberoptic is introduced (figure 4(A)) [19]. Figure 4(B) shows a schematic of the photobleaching apparatus, in which beam intensity is modulated using an acousto-optic modulator and fluorescence is detected in an epifluorescence configuration by focusing the excitation laser beam at the back surface of the multimode fiberoptic. The photograph shows insertion of the double-lumen microcapillary into mouse brain.
Figure 4.

Dye diffusion measured in deep brain structures by microfiberoptic fluorescence photobleaching. (A) Apparatus for dye introduction and fluorescence measurement, consisting of dye-introducing and optical fiber-introducing microcapillaries. Photograph shown in the upper panel, with inset (at the left) showing aluminized microfiberoptic tip. Schematic shown in the bottom panel. (B) Photobleaching apparatus showing laser illumination of the back end of a multi-mode microfiberoptic. AOM: acousto-optic modulation; PMT: photomultiplier. Photograph showing mouse head immobilized in a stereotactic frame with double-lumen device inserted through burr holes. (C) Left: in vitro validation of diffusion measurement showing photobleaching recovery curves for aqueous glycerol solutions containing 70 kDa FITC-dextran. Original fluorescence recovery data (black) shown together with fitted curves (red). Right: photobleaching recovery of FITC-dextran in aCSF (t1/2 1.25 ± 0.05 s) and at 400 μm depth in brain cortex (t1/2 4.1 ± 0.3). Adapted from [19].
The accuracy of MFEP diffusion measurements was verified in various model systems, such as solutions of specified viscosity containing glycerol (figure 4(C), left). Fluorescence recovery was slowed with increasing glycerol concentration. Figure 4(C) (right) shows recovery in aCSF versus brain cortex. At an insertion depth of 400 μm, fluorescence recovery data fitted well to a single-component diffusion model with Do/D ∼ 4 with ∼100% fluorescence recovery.
MFEP was also done to investigate heterogeneity in diffusion in different regions of brain and effects of solute size [19]. In brain cortex, the diffusion of 70 kDa FITC-dextran (hydrodynamic radius ∼12 nm) was slowed 4.5 ± 0.5-fold compared to its diffusion in water (Do/D), and was depth-independent down to 800 μm from the brain surface. FITC-dextran diffusion varied greatly in different regions of brain, with Do/D of 3.5 ± 0.3 in hippocampus and 7.4 ± 0.3 in thalamus. Interestingly, Do/D in deep brain depended strongly on dextran size, whereas diffusion in cortex was relatively independent of size. As mentioned below, mathematical modeling of ECS diffusion required non-uniform ECS dimensions in deep brain, which was called ‘heterometricity’, to account for the size-dependent diffusion.
Mathematical modeling of diffusion in brain ECS
Several mathematical models of solute diffusion in the ECS have been constructed. In an early model, Rusakov and Kullmann [29] assumed that brain ECS consisted of a random assembly of space-filling obstacles, and computed Do/D ∼ 2, irrespective of ECS shape and size. In another early model, Chen and Nicholson [30] developed a two-dimensional model in which the ECS is outlined by various geometric shapes. The first attempt to model brain ECS in three-dimensions, which assumed uniformly spaced convex cells, concluded that Do/D cannot exceed ∼1.5 [31]. In an attempt to increase predicted Do/D, Tao et al [32] included ‘dead-space microdomains’ as evenly spaced square cavities in all brain cells. The model required ∼40% of the ECS to comprise such hypothetical cavities in order to predict experimental Do/D. A more recent model by Nandigam and Kroll [33] included expansions in the ECS to increase predicted Do/D. Their ECS model contained close-packed arrays of spherical cells generated by minimizing configurational energy.
We subsequently developed a random-walk model to simulate macromolecule diffusion in brain ECS in three-dimensions using more realistic ECS dimensions [34]. Model inputs included ECS volume fraction (α), cell size, cell–cell gap geometry, intercellular ‘lake’ (expanded regions of brain ECS) dimensions, and the molecular size of the diffusing solute (figure 5(A)). Model output was relative solute diffusion in water versus brain ECS (Do/D). Simulations using realistic α, cell size and cell–cell gap required the presence of intercellular ‘lakes’ at multi-cell contact points, and the contact length of cell–cell gaps to be least 50-fold smaller than cell size. Figure 5(B) shows model predictions with different assumptions of detailed geometries. The model accurately predicted Do/D for different solute sizes. Also, the modeling revealed unanticipated effects on Do/D of changing ECS and cell dimensions that implicated ‘solute trapping’ by lakes. The reader is referred to our original modeling paper for further details [34].
Figure 5.

Modeling slowed relative diffusion in brain versus saline (Do/D) in brain extracellular space. (A) Schematic of three-dimensional brain ECS model with modified lakes, showing (left) cell arrangement, and (right) ECS geometry. Lake dimensions were modified such that the gap width spacing (wc) could be independently specified. Gap size in each direction (gci) could be independently specified to introduce gap heterogeneity. (B). Do/D computed as a function of α. Two types of modifications were made to change α—altered wc (open circles) and fixed wc (altered lake mass, filled circles). Parameters: gc = 80 nm, dcell = 10 μm. Adapted from [34].
As mentioned above microfiberoptic fluorescence measurements indicated an unexpected effect of the size of the diffusing solute on diffusion in deep brain structures but not in brain cortex. To explore this observation brain ECS was modeled using Voronoi cell diagrams with defined cell shrinkage algorithms [19]. We tested two ECS models: (a) ‘non-heterometric’ ECS in which apposing cell edges were parallel, and (b) ‘heterometric’ ECS in which apposing the cell edges were not parallel. Predicted Do/D increased greatly with increasing solute size in the case of the non-parallel ECS model as applied to deep brain, but were largely unchanged for the parallel ECS as applied to brain cortex, in close agreement with experimental data. Qualitatively, because a non-zero size particle cannot pass through a gap narrower than its diameter, a non-parallel ECS model predicts a relatively strong dependence of diffusion on particle size. A parallel ECS is termed as a ‘non-heterometric’ arrangement and a non-parallel ECS as ‘heterometric’. The various ECS models generated a number of testable predictions, which await experimental verification.
Diffusion in the ECS in tumors
Diffusion in the ECS in tumors is important for delivery of chemotherapeutic agents. Early measurements using single and multi-photon optical methods have described effects of matrix composition and macromolecule characteristics on diffusion at the light-accessible surface of solid tumors [11–14]. In superficial tumor the diffusion of dextrans and proteins such as albumin is slowed by 2–10-fold compared to water, depending on tumor type and macromolecule size and charge. However, because of the shallow penetration of light using external beam-based optical methods, little information had been available about diffusion beyond ∼200 μm, where the vast majority of the tumor resides. The development of microfiberoptic fluorescence photobleaching provided a unique opportunity to measure Do/D deep in tumors.
Figure 6(A) shows fluorescence recovery curves for diffusion of 10 kDa FITC-dextran at different depths in tumors generated from subcutaneously injected B16F10 melanoma cells [18]. The recovery curves in tumors were monophasic and fitted well to a Brownian diffusion model, though fluorescence recovery was incomplete at greater depths, suggesting dye compartmentalization in diffusion-inaccessible pockets. FITC-dextran diffusion in superficial tumor ≤0.2 mm) was slowed mildly compared to that in saline (Do/D ∼2 to 3-fold), but greatly slowed by > 10-fold in deeper tumor (≥1 mm).
Figure 6.

Greatly reduced diffusion of FITC-dextran deep in tumor in vivo. (A) Fluorescence recovery curves of 10 kDa FITC-dextran at indicated depths from the (melanoma) tumor surface. (B) Altered diffusion in tumors after enzymatic digestion of components of the extracellular matrix. Measurements done as in (A) at 3 h after intratumoral injections of collagenase, hyaluronidase or cathepsin C. (C) Data summary showing percentage fluorescence recovery and relative diffusion in saline (Do) versus tumor (D). Adapted from [20].
To investigate the role of ECM in diffusion, each of the major components of tumor ECM were degraded individually—type I collagen, HA and decorin—by direct intratumoral enzyme injection (figure 6(B)). Fluorescence recovery after collagenase treatment became near complete to a depth of 2 mm. Digestion of decorin by cathepsin (C), which removes N-terminal dipeptides, increased FITC-dextran diffusion throughout the tumor to a similar extent as found for collagenase treatment. In contrast, hyaluronan digestion by hyaluronidase slowed FITC-dextran throughout the tumor, and significantly reduced fluorescence recovery. Figure 6(C) summarizes percent fluorescence recovery and Do/D for the control and enzyme-treated tumors.
For larger macromolecules, collagen digestion increased by ∼2-fold the diffusion of albumin and 500 kDa FITC-dextran (hydrodynamic radius ∼ 30 nm) at a depth of 0.5 mm, and increased the percentage fluorescence recovery [18]. More pronounced effects of ECM digestions were found deeper in tumor tissue. Collagenase and cathepsin C increased diffusion by >10-fold of 500 kDa dextran at a depth of 2 mm, giving a large increase in percentage recovery. In vitro measurements in defined gel-like mixtures of collagen, hyaluronan and decorin closely recapitulated results in tumors in vivo. Mathematical modeling quantified the roles of extracellular space volume fraction and dimensions, and indicated a substantial effect of cell density on diffusion in deep tumor. These results defined the determinants of diffusion in deep tumor and suggested the potential therapeutic utility of collagen and decorin digestion to facilitate macromolecule delivery.
Surface photobleaching measurements have also shown greatly reduced diffusion of large macromolecules in the ECS in tumors (U87 glioblastoma and Mu89 melanoma) [8]. It was suggested that the slowed diffusion was caused by fibrillar, type I collagen in tumor ECS. Indeed, there is body of theoretical literature that models size-dependent diffusion of particles through fibrillar networks showing, as expected, greatly slowed diffusion as particle size approach interfibrillar spacing [35, 36].
Concluding remarks
The biology of the ECS remains a relatively understudied subject. The recent biophysical measurement and mathematical modeling advances described herein have clarified the magnitude and determinants of solute and macromolecule diffusion in the ECS. Further refinement of the ideas presented may emerge from application of newer optical approaches to study ECS geometry and diffusion, such as super-resolution optical imaging, three-dimensional single particle tracking, and quantum-rod polarization correlation microscopy. Finally, there remain broad opportunities in translating basic laboratory data on ECS biology into the clinic, such as in modifying ECS properties to improve tumor drug delivery and in better understanding the role of the ECS in neurological conditions such as epilepsy and inflammatory demyelinating diseases.
References
- 1.Sykova E. Diffusion properties of the brain in health and disease. Neurochem Int. 2004;45:453–66. doi: 10.1016/j.neuint.2003.11.009. [DOI] [PubMed] [Google Scholar]
- 2.Sykova E, Nicholson C. Diffusion in brain extracellular space. Physiol Rev. 2008;88:1277–340. doi: 10.1152/physrev.00027.2007. [DOI] [PMC free article] [PubMed] [Google Scholar]
- 3.Jin BJ, Zhang H, Binder DK, Verkman AS. Aquaporin-4-dependent K+and water transport modeled in brain extracellular space following neuroexcitation. J Gen Physiol. 2013;141:119–32. doi: 10.1085/jgp.201210883. [DOI] [PMC free article] [PubMed] [Google Scholar]
- 4.Cordingley GE, Somjen GG. The clearing of excess potassium from extracellular space in spinal cord and cerebral cortex. Brain Res. 1978;151:291–306. doi: 10.1016/0006-8993(78)90886-7. [DOI] [PubMed] [Google Scholar]
- 5.Netti E, Hamberg LM, Babich JW, Kierstad D, Graham W, Hunter GH, Wolf GL, Fischman A, Boucher Y, Jain RK. Enhancement of fluid filtration across tumor vessels: implication for delivery of macromolecules. Proc Natl Acad Sci USA. 1999;96:3137–42. doi: 10.1073/pnas.96.6.3137. [DOI] [PMC free article] [PubMed] [Google Scholar]
- 6.Ribatti D, Nico B, Crivellato E, Vacca A. The structure of the vascular network of tumors. Cancer Lett. 2007;248:18–23. doi: 10.1016/j.canlet.2006.06.007. [DOI] [PubMed] [Google Scholar]
- 7.Vargova L, Homola A, Zamecnik J, Tichy M, Benes V, Sykova E. Diffusion parameters of the extracellular space in human gliomas. Glia. 2003;42:77–88. doi: 10.1002/glia.10204. [DOI] [PubMed] [Google Scholar]
- 8.Pluen A, et al. Role of tumor–host interactions in interstitial diffusion of macromolecules: cranial versus subcutaneous tumors. Proc Natl Acad Sci USA. 2001;98:4628–33. doi: 10.1073/pnas.081626898. [DOI] [PMC free article] [PubMed] [Google Scholar]
- 9.Alberts B, Bray D, Lewis J, Raff M, Roberts K, Watson J. Molecular Biology of the Cell. 3rd. New York: Garland; 1994. Extracellular matrix of animals; pp. 971–95. [Google Scholar]
- 10.Gribbon PM, Maroudas A, Parker KH, Winlove CP. Water and solute transport in the extracellular matrix: physical principles and macromolecular determinants. In: Reed RK, Rubin K, editors. Connective Tissue Biology: Integration and Reductionism. London: Portland Press; 1998. pp. 95–124. [Google Scholar]
- 11.Alexandrakis G, Brown EB, Tong RT, McKee TD, Campbell RB, Boucher Y, Jain RK. Two-photon fluorescence correlation microscopy reveals the two-phase nature of transport in tumors. Nature Med. 2004;10:203–7. doi: 10.1038/nm981. [DOI] [PubMed] [Google Scholar]
- 12.Brown EB, Campbell RB, Tsuzuki Y, Xu L, Carmeliet P, Fukumura D, Jain RK. In vivo measurement of gene expression, angiogenesis and physiological function in tumors using multiphoton laser scanning microscopy. Nature Med. 2001;7:864–8. doi: 10.1038/89997. [DOI] [PubMed] [Google Scholar]
- 13.Brown E, McKee T, diTomaso E, Pluen A, Seed B, Boucher Y, Jain RK. Dynamic imaging of collagen and its modulation in tumors in vivo using second-harmonic generation. Nature Med. 2003;9:796–800. doi: 10.1038/nm879. [DOI] [PubMed] [Google Scholar]
- 14.Stroh M, et al. Quantum dots spectrally distinguish multiple species within the tumor milieu in vivo. Nature Med. 2005;11:678–82. doi: 10.1038/nm1247. [DOI] [PMC free article] [PubMed] [Google Scholar]
- 15.Dix JA, Verkman AS. Crowding effects on diffusion in solution and cells. Annu Rev Biophys. 2008;37:247–63. doi: 10.1146/annurev.biophys.37.032807.125824. [DOI] [PubMed] [Google Scholar]
- 16.Thiagarajah JR, Kim JK, Magzoub M, Verkman AS. Slowed diffusion in tumors revealed by microfiberoptic epifluorescence photobleaching. Nature Methods. 2006;3:275–80. doi: 10.1038/nmeth863. [DOI] [PubMed] [Google Scholar]
- 17.Zhang H, Verkman AS. Microfiberoptic measurements of extracellular space volume in brain and tumor slices based on fluorescent dye partitioning. Biophys J. 2010;99:1284–91. doi: 10.1016/j.bpj.2010.06.023. [DOI] [PMC free article] [PubMed] [Google Scholar]
- 18.Magzoub M, Zhang H, Dix JA, Verkman AS. Extracellular space volume measured by two-color pulsed dye injection with microfiberoptic fluorescence photodetection. Biophys J. 2009;96:2382–90. doi: 10.1016/j.bpj.2008.12.3916. [DOI] [PMC free article] [PubMed] [Google Scholar]
- 19.Zador Z, Magzoub M, Jin S, Manley GT, Papadopoulos MC, Verkman AS. Microfiberoptic fluorescence photobleaching reveals size-dependent macromolecule diffusion in extracellular space deep in brain. FASEB J. 2008;22:326–32. doi: 10.1096/fj.07-9468com. [DOI] [PubMed] [Google Scholar]
- 20.Magzoub M, Jin S, Verkman AS. Enhanced macromolecule diffusion deep in tumors after enzymatic degradation of extracellular matrix collagen and its associated proteoglycan decorin. FASEB J. 2008;22:276–84. doi: 10.1096/fj.07-9150com. [DOI] [PubMed] [Google Scholar]
- 21.Rosenberg LE, Downing SJ, Segal S. Extracellular space estimation in rat kidney slices using C saccharides and phlorizin. Am J Physiol. 1962;202:800–4. doi: 10.1152/ajplegacy.1962.202.4.800. [DOI] [PubMed] [Google Scholar]
- 22.Law RO. Techniques and applications of extracellular space determination in mammalian tissues. Experientia. 1982;38:411–21. doi: 10.1007/BF01952615. [DOI] [PubMed] [Google Scholar]
- 23.Jackson MJ, Cassidy MM, Weller RS. Studies on intestinal fluid transport: 1. Estimation of extracellular space of everted sacs of rat small intestine. Biochim Biophys Acta. 1970;211:425–35. doi: 10.1016/0005-2736(70)90248-8. [DOI] [PubMed] [Google Scholar]
- 24.Nicholson C, Chen KC, Hrabetova S, Tao L. Diffusion of molecules in brain extracellular space: theory and experiment. Prog Brain Res. 2000;125:129–54. doi: 10.1016/S0079-6123(00)25007-3. [DOI] [PubMed] [Google Scholar]
- 25.Nicholson C, Phillips JM. Ion diffusion modified by tortuosity and volume fraction in the extracellular microenvironment of the rat cerebellum. J Physiol. 1981;321:225–57. doi: 10.1113/jphysiol.1981.sp013981. [DOI] [PMC free article] [PubMed] [Google Scholar]
- 26.Binder D, Papadopolous MC, Haggie PM, Verkman AS. In vivo measurement of brain extracellular space diffusion by cortical surface photobleaching. J Neurosci. 2004;24:8049–56. doi: 10.1523/JNEUROSCI.2294-04.2004. [DOI] [PMC free article] [PubMed] [Google Scholar]
- 27.Papadopoulos MC, Binder DK, Verkman AS. Enhanced macromolecular diffusion in brain extracellular space in mouse models of vasogenic edema measured by cortical surface photobleaching. FASEB J. 2005;19:425–7. doi: 10.1096/fj.04-2834fje. [DOI] [PubMed] [Google Scholar]
- 28.Papadopoulos MC, Kim JK, Verkman AS. Extracellular space diffusion in central nervous system: anisotropic diffusion measured by elliptical surface photobleaching. Biophys J. 2005;89:3660–8. doi: 10.1529/biophysj.105.068114. [DOI] [PMC free article] [PubMed] [Google Scholar]
- 29.Rusakov DA, Kullmann DM. Geometric and viscous components of the tortuosity of the extracellular space in the brain. Proc Natl Acad Sci USA. 1998;95:8975–80. doi: 10.1073/pnas.95.15.8975. [DOI] [PMC free article] [PubMed] [Google Scholar]
- 30.Chen KC, Nicholson C. Changes in brain cell shape create residual extracellular space volume and explain tortuosity behavior during osmotic challenge. Proc Natl Acad Sci USA. 2000;97:8306–11. doi: 10.1073/pnas.150338197. [DOI] [PMC free article] [PubMed] [Google Scholar]
- 31.Hrabe J, Hrabetova S, Segeth K. A model of effective diffusion and tortuosity in the extracellular space of the brain. Biophys J. 2004;87:1606–17. doi: 10.1529/biophysj.103.039495. [DOI] [PMC free article] [PubMed] [Google Scholar]
- 32.Tao A, Tao L, Nicholson C. Cell cavities increase tortuosity in brain extracellular space. J Theor Biol. 2005;234:525–36. doi: 10.1016/j.jtbi.2004.12.009. [DOI] [PubMed] [Google Scholar]
- 33.Nandigam RK, Kroll DM. Three-dimensional modeling of the brain's ECS by minimum configurational energy packing of fluid vesicles. Biophys J. 2007;92:3368–78. doi: 10.1529/biophysj.106.095547. [DOI] [PMC free article] [PubMed] [Google Scholar]
- 34.Jin S, Zador Z, Verkman AS. Random-walk model of diffusion in 3-dimensions in brain extracellular space: comparison with microfiberoptic photobleaching measurements. Biophys J. 2008;95:1785–94. doi: 10.1529/biophysj.108.131466. [DOI] [PMC free article] [PubMed] [Google Scholar]
- 35.Clague DS, Phillips RJ. Hindered diffusion of spherical macromolecules through dilute fibrous media. Phys Fluids. 1996;8:1720–31. [Google Scholar]
- 36.Stylianopoulos T, Diop-Frimpong B, Munn LL, Jain RK. Diffusion anisotropy in collagen gels and tumors: the effect of fiber network orientation. Biophys J. 2012;99:3119–28. doi: 10.1016/j.bpj.2010.08.065. [DOI] [PMC free article] [PubMed] [Google Scholar]