Abstract
Applications of fluorescence based imaging techniques for detection in cellular and tissue environments are severely limited by autofluorescence of endogenous components of cells, tissue, and the fixatives used in sample processing. To achieve sufficient signal-to-background ratio, a high concentration of the probe needs to be used which is not always feasible. Since typically autofluorescence is in the nanosecond range, long-lived fluorescence probes in combination with time-gated detection can be used for suppression of unwanted autofluorescence. Unfortunately, this requires the sacrifice of the large portion the probe signal in order to sufficiently filter the background.
We report a simple and practical approach to achieve a many-fold increase in the intensity of a long-lived probe without increasing the background fluorescence. Using controllable, well separated bursts of closely spaced laser excitation pulses, we are able to highly increase the fluorescence signal of a long-lived marker over the endogenous fluorescent background and scattering, thereby greatly increasing detection sensitivity. Using a commercially available confocal microscopy system equipped with a laser diode and time correlated single photon counting (TCSPC) detection, we are able to enhance the signal of a long-lived Ruthenium (Ru)-based probe by nearly an order of magnitude. We used 80 MHz bursts of pulses (12.5 ns pulse separation) repeated with a 320 kHz repetition rate as needed to adequately image a dye with a 380 ns lifetime. Just using 10 pulses in the burst increases the Ru signal almost 10 fold without any increase in the background signal.
1. Introduction
During the last couple of decades, fluorescence based imaging has made incredible progress, becoming one of the most versatile and widely utilized visualization techniques in research and biomedical diagnostics. The quickly increasing availability of new dyes and fluorescent proteins as well as technological progress opens new ways for noninvasive studies of fundamental processes from gene expression, protein function, and protein-protein interactions to cellular and tissue processes [1,2]. In addition to outstanding successes in microscopy, fluorescence based imaging is gaining momentum as an imaging method for whole-body, in-vivo investigation of molecular processes in small animals [3–5]. The development of bright probes and highly sensitive detectors puts fluorescence among the most sensitive detections frequently allowing study of nanomolar and picomolar concentrations [6].
The fundamental limitation for cellular and tissue imaging is sample autofluorescence (fluorescence of endogenous components of cells, tissue, and fixatives). The large variety of autofluorescence sources produces a broad emission that overlaps with the emission of typical fluorescent dyes used for labeling [7–9]. Typically the brightness of such natural components is relatively low, but the overwhelming abundance of them results in a significant contribution to the observed fluorescence signal, especially in tissue samples. It is very difficult to reduce the signal from autofluorescence without altering the probe and/or the biological system [10–12], thus one typically increases the concentration of the dye to a level at which the fluorescence of the dye dominates the overall signal. Such a large increase in dye concentration is not always possible for various physiological reasons, and in many cases it may interfere with the biological process one wants to investigate. Obviously, in cases where background is a problem, an increase in excitation intensity is not an option, since it always leads to a proportional increase in both background intensity and signal intensity. Red and near infrared dyes have been developed to decrease autofluorescence and scattering, but this does not eliminate the problem completely [13].
Usually autofluorescence is characterized by complex fluorescence intensity decay with multiple fluorescent lifetimes ranging from subnanoseconds to a few nanoseconds, but typically not exceeding 6-7 ns [14–16]. The development of long-lived fluorophores with fluorescence lifetimes longer than 10 ns and the use of so-called time-gated detection [17–19] dramatically increase the signal to background ratio in microscopy and tissue imaging. While time-gated detection reduces the overall signal, it reduces the signal of the short-lived background to a greater extent than the long-lived probe. However, the signal from only moderately long-lived probe (~10-20 ns lifetime) will still be adversely impacted [20]. Extremely long-lived probes like those based on lanthanide atoms [21] have been shown to allow detection at practically background free conditions [22], but unfortunately the fundamental physics/chemistry dictates that such long-lived probes typically have low extinction coefficients and relatively low quantum yields, leading to a low overall brightness of the probe.
In spite of many difficulties, fluorescence lifetime imaging (FLIM) has been very successful and lead to many practical applications [23–27]. Further, the development of pulsed lasers and laser diodes that are now widely available with typical imaging systems opens many new applications for FLIM. Advanced electronics and computers now allow for very precise control of the pulse repetition rate and pulse sequences for single or even multiple laser diodes. Very successful applications of Forster resonance energy transfer (FRET) in microscopy recently stimulated development of the pulse interleave excitation (PIE) approach using interleaved pulses of two colors that allows for independent control of donor and acceptor emissions [28–31]. We now realize that we can use controllable bursts of single color pulses to significantly increase the fluorescence signal of a long-lived marker over the endogenous fluorescent background and scattering. In this work, we are presenting a simple method that uses well separated bursts of closely spaced excitation pulses, while the signal collection for time correlated single photon counting (TCSPC) is synchronized with the last pulse in the burst. Systems capable of realizing such sequences of pulses are readily available from commercial producers like PicoQuant Inc., Horiba Inc., or Becker & Hickel. In effect in this approach, we are “pumping” a long-lived fluorescent dye to an excited state with a series (burst) of ps, high repetition (closely spaced) laser pulses, while the short-lived background stays constant from pulse-to-pulse. Herein we present a theoretical model demonstrating that the extent of this pumping is dependent upon the lifetime of the probe and the repetition rate within the excitation burst, and we show that when applied to a fluorescence probe with a lifetime of 10 ns or longer, the pumping by commercially available, high repetition rate (80 MHz -90 MHz) laser diodes can significantly increase the signal-to-background ratio, easily exceeding an order of magnitude gain. We then show experimental results that demonstrate this concept in confocal microscopy. This simple approach opens new ways for highly enhanced imaging capabilities using existing technology without sacrificing probe signal or photostability. Also, it is independent of wavelength, so long wavelength dyes may be developed for use with multi-pulse excitation in tissue imaging.
2. Theory/Calculations
The large majority of experiments involving fluorescent dyes are conducted under the condition where only a very small number of the fluorescent molecules are excited. Many time-resolved microscopy systems use picosecond pulsed diode lasers with typical average intensity in the range of a few mW for excitation and time-correlated single photon counting (TCSPC) detection. In fact, less than 500 W actually reaches the sample, depending on the microscope's optics. This means that only a small fraction of the molecules in the typical confocal volume (< 1 fl) can be excited by a single, picosecond pulse. Since such a confocal volume would contain well over 1000 molecules of a dye that has a micromolar concentration, the small fraction of excited molecules can still provide sufficient photon flux, provided that the laser repetition rate is in the kHz-MHz range. However, as we’ve already explained in the previous section, the detected signal is typically a sum of photons emitted by dye molecules as well as endogenous chromophores from the sample that constitute sample background.
The repetition rate (RR) used in TCSPC systems is usually determined by the fluorescence lifetime of the dye. To avoid problems in data analysis, the time between pulses (1/RR) should be 5-10 times longer than the fluorescence lifetime of longest lifetime component of the sample. Otherwise the fluorescence decay of a particular pulse would overlap with that of the subsequent pulse. Hence for typical dyes like fluorescein with fluorescence lifetimes of 4 ns or less, a RR of less than 20-40 MHz is acceptable. When fluorophores with longer lifetimes are used, typically one decreases the RR to allow the excited state to completely decay before subsequent pulses arrive.
Here we consider the case when the RR is not sufficiently low to allow the complete decay after each excitation pulse. If the number of fluorophores in the excitation volume is N0 and a single pulse excites Ne molecules, then the observed fluorescence intensity will be proportional to the number of molecules excited by each pulse (I~Ne). This situation changes when the RR approaches a level such that subsequent pulses arrive before the excited population can decay completely. For simplicity, we assume that N0>>Ne, so we can assume that the depletion of the ground state is negligible and each pulse excites Ne molecules. Such a system will reach equilibrium when the number of molecules excited by a single pulse is equal to the number of molecules that return to the ground state over the time interval equal to 1/RR. So for a given RR, the number of excited molecules returning to the ground state between pulses is simply the difference between the total number of molecules in the excited state immediately after the pulse arrival, NeT, and the total number of molecules in the excited state after time 1/RR (the time when next pulse arrive):
| (1) |
where τ is the fluorescence lifetime of the fluorophore. For simplicity of the model we assume that the fluorophore has a single exponential decay. One can also calculate the number of molecules in the excited state by analyzing subsequent pulses. The first pulse excites Ne molecules. When the second pulse arrives, the number of molecules remaining in the excited state is N1 = Nee–/τ·RR and total number of excited molecules immediately after second pulse is: . Extending this for n pulses, we have a geometrical series, and the number of molecules in the exited state after n pulses will be:
| (2) |
And consequently for an infinite number of pulses:
| (3) |
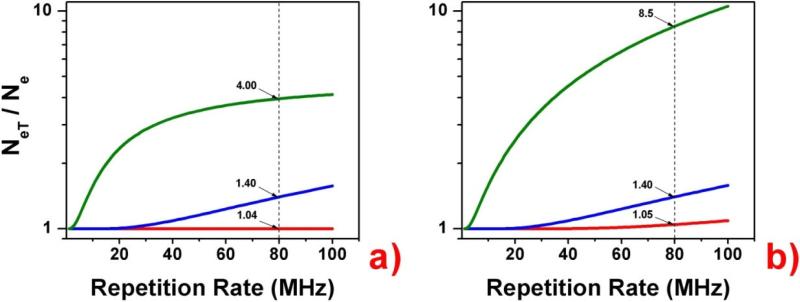
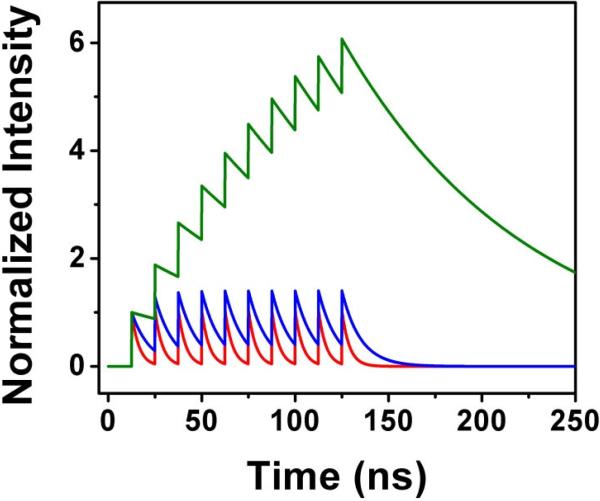
That is identical to the equilibrium solution given by Equation (1). In Figure 1a we present the number of excited molecules after 5 pulses for three model fluorophores with fluorescence lifetimes of 4 ns, 10 ns, and 100 ns as a function of increasing RR from 1 MHz to 100 MHz. For comparison, in Figure 1b we also present the relative number of molecules in the excited state for equilibrium conditions (after an infinite number of pulses). It is intuitive that the number of molecules in the excited state after each pulse for a short-lived fluorophore is constant and for a long-lived fluorophore increases quickly with the RR. It is important to realize that for a continuous train of pulses, the out coming intensity of fluorescence (number of emitted photons) depends on the decay factor e–1/τRR, and the relative average intensities for short-lived and long-lived fluorophores are increasing proportionally with increasing RR. The intensity is not only proportional to the number of molecules in the excited state at the instant of each excitation pulse but also to the interval between pulses. This is obvious since, in steady-state conditions, the relative intensities must be the same—increasing the RR cannot change the relative signals of two fluorophores. However the situation changes dramatically when we use a different approach. With technology available today, we can use variable pulse trains that allow time for the excited states to depopulate completely after a series of pulses (burst of pulses). Then, by detecting only the fluorescence intensity decay after the last pulse in the burst, we can dramatically change the relative intensities of a long-lived probe to a short-lived background. Depending on the ratio between τ and 1/RR, the initial population of the excited state will be different, resulting in a different number of photons collected after the last pulse in the burst. This is illustrated in the example shown in Figure 2 with a 10-pulse burst and τ*RR = 0.32, 0.80, and 8.00. If we assume that RR = 80 MHz, which is commonly available in pulsed diode lasers, these ratios would correspond to τ = 4 ns, 10 ns, and 100 ns, respectively. The total fluorescence from each model dye measured over the entire time interval shown will be the result of exactly 10 excitation-decay cycles regardless of the τ*RR factor. However, the 4 ns dye decays almost completely between excitation pulse, and each cycles is practically completed before the arrival of the next pulse. For 10 ns and 100 ns dyes, there is significant overlap with each excitation cycle. If we only measure the fluorescence decay after the last excitation pulse, this measurement for the 10 ns and 100 ns dyes will include the fluorescence from the overlapping excited state population from previous excitation pulses in the burst. Thus it is this break between bursts of excitation pulses that we may exploit in order to increase the contrast between fluorophores of differing decay times. It is easy to see that, for a fixed RR (fixed pulse separation in the burst), an increased lifetime results in a greater relative signal for the long-lived dye. If the fluorescence lifetime is much longer than the separation of pulses in the burst (1/RR), the number of long-lived fluorophores in the excited states after a small number of pulses is proportional to that number of pulses. So, for a pulse repetition of 80 MHz within the burst and a dye with a fluorescence lifetime of 200 ns or more (like some metal-ligand complexes), the number of dyes in the excited state after 10 pulses is ~ 10 times greater than that for a single pulse. In the same time, the number of background fluorophores in the exited state that have a fluorescence lifetime of 2 ns will be almost constant from pulse-to-pulse (the fluorophores will decay completely within 12.5 ns interval time). In effect, synchronizing the time correlated detection with the last pulse in the burst will give ~10 times greater signal than that from each individual pulse. We also want to stress that this is conceptually very different from simply increasing the power delivered by single pulses 10-fold, in which case both populations (short-lived background and long-lived dye) increase proportionally (10 times in this case).
Figure 1.
Molecules in the excited state as a function of repetition rate (RR). The number of molecules in the excited state at the instant that an excitation pulse arrives is calculated using a) Equation (2) for five pulses (n=5), and b) Equations (1) and (3) for infinite pulses. The blue lines represents calculations for a fluorophore with a 100 ns lifetime, the red lines for 10 ns, and the green lines for 4 ns, the last of which being the approximate lifetime for commonly-used organic dyes. Increasing the RR increases the excited state population at a rate which increases fro longer-lived dyes. Note that the vertical axes are logarithmic. The dotted, vertical line is drawn at RR = 80 MHz, a commonly avalable RR for pulsed diode lasers.
Figure 2.
Model of fluorescence decay from bursts of 10 excitation pulses. The red line shows the calculated decay curve for a fluorophore with a 4 ns lifetime, the blue line for 10 ns, and the green line for 100 ns. The repetition rate for the pulses within the burst was 80 MHz, or 12.5 ns between pulses.
3. Experimental
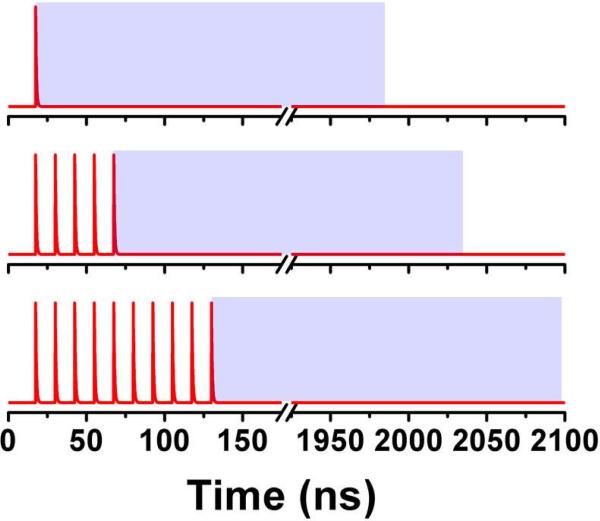
Laser excitation was provided by a pulsed laser diode (PDL-470) emitting 470 nm light and driven by a PDL 828 “Sepia II” driver. This driver was operated at 80 MHz and configured so that the pulse train consisted of bursts of laser pulses with 80 MHz RR and followed by a series of blank “pulses.” In the case of conventional, single pulse excitation, one pulse from the 470 nm diode laser was followed by 249 blank pulses, exciting the sample with an effective repetition rate of 320 kHz. For the case of excitation by a burst of m pulses, the burst would be followed by 250-m blank pulses, so that the total pulse train remained 250 pulses long, or 3.125 μs in length. Because the base oscillator operated at 80 MHz, there were 12.5 ns between each excitation pulse. In order to differentiate the advantageous pumping of long-lived dyes from the increased intensity that simply results from increased repetition rate of the excitation source, only the fluorescence following the final excitation pulse was analyzed. For example, when 10 pulses were used, the final pulse arrived 129 ns after the synchronization pulse from the laser driver. So only photons arriving between 129 ns and the end of the synchronization period at 2100 ns were analyzed. The effective synchronization period was therefore 1971 ns, and this was kept constant for all excitation schemes. However, the effective synchronization period was shifted to start at the peak of the last pulse in the excitation burst. Figure 3 shows a schematic of the excitation schemes for 3 burst lengths (1 pulse, 5 pulses, and 10 pulses).
Figure 3.
Schematic of excitation for 1-pulse (top) 5-pulse (middle) and 10 pulse (bottom) excitation. The t=0 point is the time at which the synchronization pulse reached the TCSPC module. The blue box shows the window from which photons were collected. This window remained the same for all multiple pulse excitation schemes. Note that the time scale is broken here, as a relative large amount of time was provided to allow all fluorophores to decay completely.
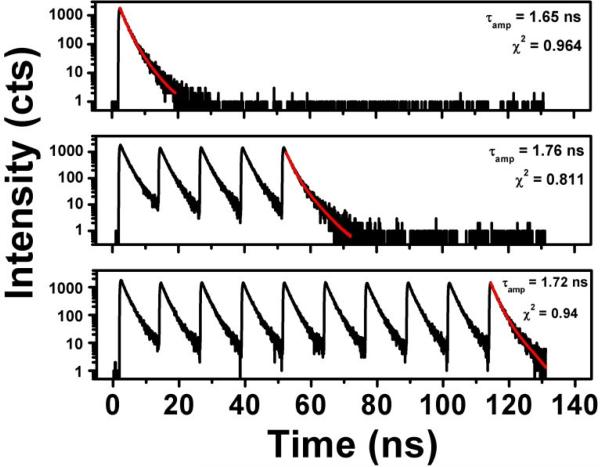
Measurements were performed on a MicroTime 200 time-resolved, confocal microscope by PicoQuant. The excitation and emission light was focused by a 60X 1.2 NA Olympus objective in an Olympus IX71 microscope, and the emission light was filtered by a 488 long wave pass filter before passing through a 50 μm pinhole. Detection was made by a hybrid photomultiplier assembly. The resolution of the time correlated single photon counting (TCSPC) module was set to 512 ps/bin in order to facilitate the detection of the long-lived Ruthenium dye, producing a measurement window around 1.2 μs in length. However, the resolution was increased to 16 ps/bin when the lifetimes of Sulforhodamine B were measured (Figure 4), as the short lifetime of this dye cannot be accurately measured otherwise. All data analysis was performed using the SymPhoTime software, version 5.3.2. All experimental equipment and the SymPhoTime software were provided by PicoQuant, GmbH as part of the MicroTime 200 system. The surface plots in Figure 7 were created using ImageJ software.
Figure 4.
Intensity decays of a SRB solution with 1-pulse (top), 5-pulse (middle), and 10-pulse (bottom) excitation schemes. No appreciable change is seen in the lifetime fittings.
Figure 7.
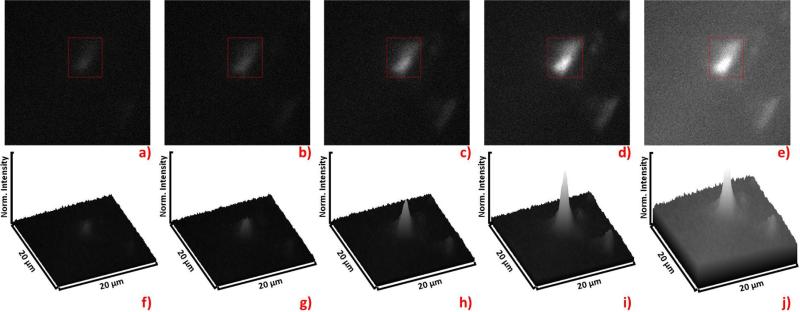
Fluorescence imaging with multiple pulse excitation. Images a) through d) depict a bead loaded with the long-lived Ru on a background of short-lived SRB, and the intensity scales are normalized to the full intensity span of d). The image a) shows the result of 1-pulse excitation, b) shows 2-pulse excitation, c) shows 5-pulse excitation, and d) shows 10-pulse excitation. The image in e) depicts 1-pulse excitation, but the average laser power has been increased to the average laser power of the pulse train involving 10-pulse bursts in d). The Signal to background ratio in e) differs by 3% from that of a). Each surface plot, f) through j), corresponds to the image, a) through e) above it. The red boxes in images a) through d) indicate the area from which the data in Figure 8 were collected.
Samples were prepared using aqueous solutions of the Ruthenium based dye Tris(2,2′-bipyridyl)dichlororuthenium(II) hexahydrate (Ru) (Sigma-Aldrich) and Sulforhodamine B (SRB) dropped onto a No. 1 coverslip from Thermo Electron. The confocal volume was positioned so that it was 20 μm above the top surface of the coverslip. Mesoporous silica MCM-41 nanoparticles prepared as in [32] and were labeled with adsorbed Ru dye. Ru dye labeled beads were mixed into an aqueous solution of polyvinyl alcohol (Sigma-Aldrich), and dropped onto a heated coverslip to dry quickly. Then the solution of SRB was dropped near the dried droplet of Ru. The images were taken at the interface of these two droplets, where the two substances had mixed.
Preparation of Ruthenium labeled IgG
Donkey anti-mouse IgG ( mIgG) (Company name) was mixed with freshly prepared 100 mmolL–1 bicarbonate solution (0.1 mL to 0.4 mL), and to this was added a small volume of the Bis(2,2′-bipyridine)-4,4′-dicarboxybipyridine-ruthenium di(N-succinimidyl ester) bis(hexafluorophosphate) (active Ru dye) (Sigma-Aldrich) in DMF (less than 5 % by volume). After 18 h of gentle shaking, excess free dye was separated from the labeled mIgG by passing over a Sephadex G-25 desalting column (GE electric, USA).
Animals
All animal-related procedures were approved by the Institutional Animal Care and Use Committee (IACUC) of the UNTHSC and are in compliance with the ARVO Statement for the Use of Animals in Ophthalmic and Vision Research.
Histology, Paraffin sections
Retired breeders Brown Norway rats (Rattus Norvegicus) were sacrificed with an overdose of pentabarbitol, after which the eyes were enucleated, immersion fixed in 4% phosphate-buffered formalin, and processed for paraffin embedding. Paraffin saggital retinal sections through the optic nerve head (5 μm thick) were cut and deparaffinated in xylene (Fisher Scientific, NJ, USA), re-hydrated using a descending series of ethanol washes and processed for immunohistochemical staining.
Immunostaining protocol
The deparafinized and rehydrated retinal sections were blocked with 5% Donkey serum and 5% BSA in PBS, and then treated with primary antibody: mouse anti-tubulin III antibody (Sigma-Aldrich) diluted 1:500 and incubated overnight at 4°C. Secondary incubation for 1 h was carried out with a 1:1000 (1 μg/ml) dilution of the secondary antibody donkey anti-mouse IgG conjugated with Ru fluorophore. Next the samples were analyzed on the MicroTime 200 time resolved, confocal microscope by PicoQuant.
4. Results and Discussion
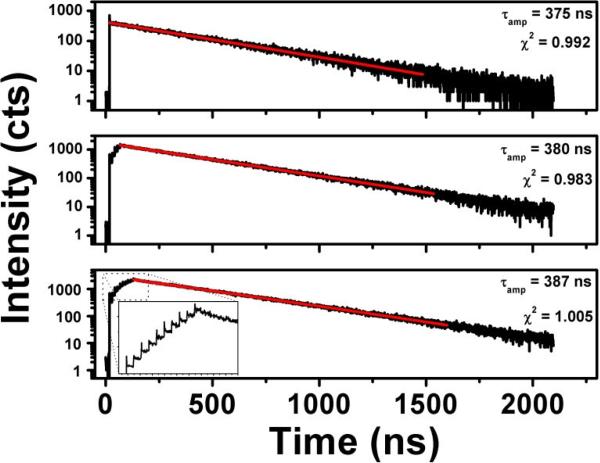
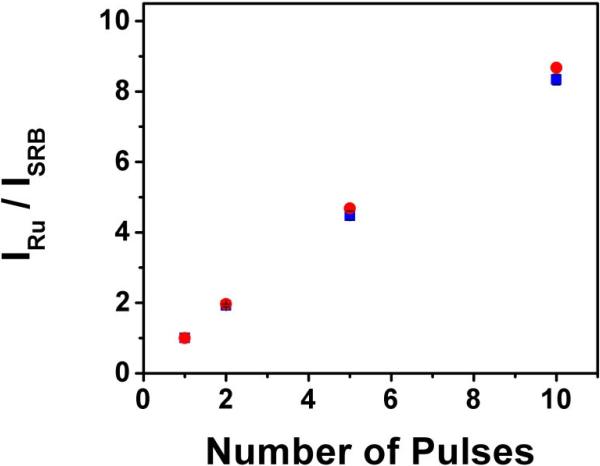
The dyes were chosen to show a simple example of the contrast improvements that can be achieved with multi-pulse excitation. As we show in Figure 4, the lifetime of SRB was ~1.7 ns, and did not change appreciably between 1-pulse, 2-pulse, and 5-pulse excitation schemes. We would like to point out to the reader that the intensity of the fluorescence signal did not increase with each pulse, as the short-lived dye decays nearly completely in the 12.5 ns between subsequent pulses. In Figure 5, we show the results of the same experiment conducted on Ru dye. Just as with SRB, the lifetime of this dye was also independent of the number of excitation pulses applied. Please note that the time scale has been expanded to accommodate the long-lived dye. However, this long-lived dye experienced a dramatic pumping effect with the addition of multiple excitation pulses. The inset of the 5-pulse decay curve shows the pumping on a linear scale. In the manner described in the previous section, the total fluorescence intensity was measured from 1-pulse, 2-pulse, 5-pulse, and 10-pulse excitation schemes, and the results are shown in Figure 6 (blue squares). The data are normalized to the single pulse intensity of each respective dye. This figure shows the dramatic increase in relative intensity of Ru dye with increasing number of pulses in the burst which begins to level off between burst lengths of 5 and 10 pulses.
Figure 5.
Intensity decays of a Ru dye solution with 1-pulse (top), 5-pulse (middle), and 10-pulse (bottom) excitation schemes. No appreciable change is seen in the lifetime fittings. The time scale of this figure is set very large in order to accommodate the ~380 ns liftime of Ru, however, the inset in the bottom graph shows a magnified view of the excited state pumping that occurs with the 10-pulse excitation. Both the time scales and intensity scales of the inset are linear.
Figure 6.
Increasing signal to background intensity with multi-pulse excitation. The blue squares represent experimental data collected from free dye of Ru and, separately, SRB. Each data collection was normalized and the ratio was then calculated. The red circles represent the modeled data.Error bars are shown on the experimental data to portray the standard deviation between 3 collections, which was always less than 2%.
Model system
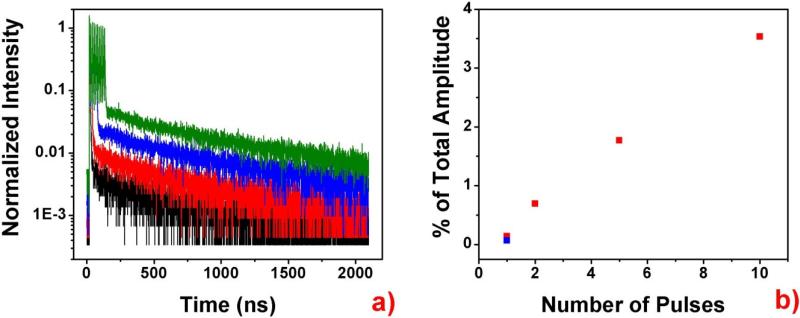
As an example of multi-pulse excitation for imaging, we prepared a Ru-loaded bead positioned on a background of SRB. The image shows improved contrast of the Ru bead as excitation is increased from 1 pulse to 2, 5, and 10 pulses. The corresponding surface plots below further highlight the increased contrast. Note that the surface plots are normalized to the peak intensity of the 10-pulse excitation image in Figure 7d. As expected, the increase in intensity from the Ru loaded bead was proportional to the number of pulses in the burst. We then reconfigured the laser driver for 1-pulse excitation and increased the output power (average energy delivered per second) to equal the power employed in the 10-pulse excitation scheme, so that one strong laser pulse would deliver the same energy as 10 weaker pulses. Then we collected an image from the same region, which is shown in Figure 7e. Note how the more powerful, single pulse was capable of producing the same signal from the Ru bead. However, the SRB background was dramatically increased in Figure 7e compared to Figure 7d. Thus our multi-pulse excitation scheme significantly improved the signal to background ratio. We selected a region of interest (ROI) on the bead and analyzed intensity decays from 1-pulse, 2-pulse, 5-pulse, and-10 pulse excitation. The intensity decays are presented in Figure 8. For all excitation schemes, a significant short-lived decay component from the background is detected. This is expected since the bead is emerged in the short-lived SRB background. As the number of pulses increased, one may see in Figure 8a that the long-lived decay component rose and the relative contribution of the short-lived component decreased.
Figure 8.
a) Fluorescence intensity decays collected from the area indicated in the red boxes in Figure 7a through 7d. The black line shows 1 pulse excitation, red shows 2-pulse excitation, blue shows 5-pulse excitation, and green shows 10-pulse excitation. All data are normalized to the last pulse in the burst. b) To each of the decay curves, a two-component exponential decay fitting was performed with the lifetimes of the two components fixed at 1.65 ns (SRB background) and 375 ns (bead labeled with Ru). The amplitude of the long-lived component is shown as the percentage of the overall amplitude in the pane on the right. The blue square in this pane shows percentage computed for the high intensity, 1-pulse excitation depicted in Figure 7d, whose decay is not shown in a) in order to increase clarity.
Tissue sample
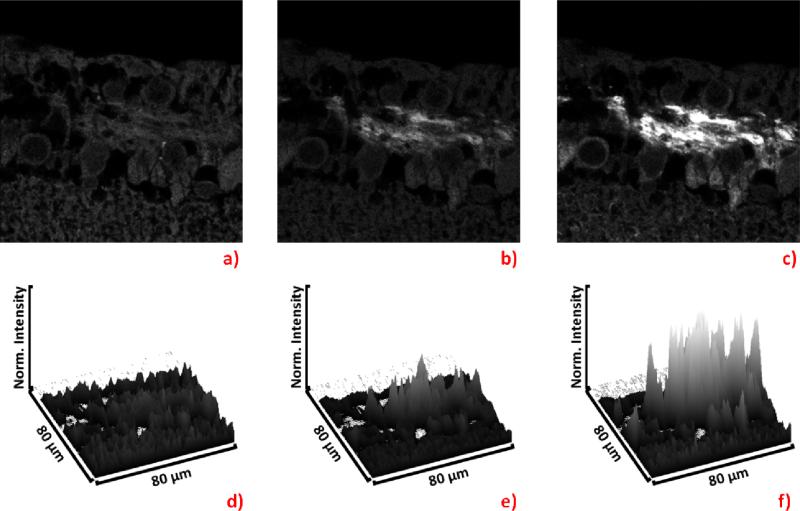
Multi-pulse excitation was then demonstrated in ocular tissue samples, where autofluorescence is particularly problematic. We applied the method to a rat retinal tissue samples stained with Ru-labeled IgG to detect the β-tubulin III. We performed immunostaining of rat retinal ganglion cells (RGCs) using the RGC specific marker β-tubulin III. Apart from being a RGC marker, β-tubulin III contributes to microtubule stability in neuronal somas and axons, by playing an important role in axonal structure [33]. Moreover β-tubulin III plays a crucial role in axon guidance and mantainance [34].
The nerve fiber layer composed mainly of axons of RGCs was targeted with Ru labeled antibodies, and the results from 1-pulse, 5-pulse, and 20 pulse excitation are shown in Figure 9. We purposely kept labeling efficiency low so that the signal with a single pulse barely shows the targeted structure. With only 5 pulses, the signal from the labeled area is already greatly elevated above the background, and pulses further increases the signal to noise ratio. It is clear that images collected from the same region of rat retinas, present a stronger signal from the Ru-labeled IgG as the number of pulses increases (Fig 9 a, b, c) with background signal remaining at the same level. This experiment serves as a great example for application of multi-pulsed excitation in biological experiments involving animal tissue and demonstrates excellent potential for further applications.
Figure 9.
Fluorescence intensity images of Ru-labeled IgG detecting the β-tubulin III in the rat retinal tissue. The image a) shows the result of 1-pulse excitation, b) shows 5-pulse excitation, c) shows 20-pulse excitation. Each surface plot, d) through f), corresponds to the image, a) through c) above it.
5. Conclusions
We have demonstrated that a simple burst of pulses can be used to change the relative intensities of components with different lifetimes. When the probe has a significantly longer lifetime than the background, the relative intensity of the probe can be dramatically amplified by increasing the number of pulses and decreasing the pulse separation in each burst. In practice with a fundamental repetition rate of 80 MHz, we can increase the relative intensity of a probe that has fluorescence lifetime of 20 ns over 100% by just using a 5 pulses burst and still keep a 1-5 MHz effective repletion rate for the bursts that is convenient for fast imaging. Using a laser system with a fundamental repetition rate of 200 MHz, the same 20 ns probe would be enhanced over 300% as compared to the background.
We also expect that such a measurement scheme would be very advantageous for extremely long-lived fluorophores like lanthanide probes, where the lifetimes are in the microsecond to millisecond range. Such systems are typically used with time-gated detection to eliminate the background. In this case, using a high repetition rate system and a burst excitation scheme will allow increasing of the initial intensity of the probe without increasing the background intensity, all while still allowing time-gated detection.
Finally we consider how pulse bursts may affect photostability. In principle, using 5 pulses in place of one 5 times stronger does not change relative photostability of the probe as compared to the background photostability. We may expect that weaker multiple pulses will produce less local heating and rather promote better photostability.
Acknowledgements
This work was supported by the National Institutes of Health (USA): NIH-5R01 EB012003.
Footnotes
Publisher's Disclaimer: This is a PDF file of an unedited manuscript that has been accepted for publication. As a service to our customers we are providing this early version of the manuscript. The manuscript will undergo copyediting, typesetting, and review of the resulting proof before it is published in its final citable form. Please note that during the production process errors may be discovered which could affect the content, and all legal disclaimers that apply to the journal pertain.
References
- 1.Funovics M, Weissleder R, Tung C-H. Protease sensors for bioimaging. Anal. Bioanal. Chem. 2003;377:956–963. doi: 10.1007/s00216-003-2199-0. [DOI] [PubMed] [Google Scholar]
- 2.Tsien RY. Building and breeding molecules to spy on cells and tumors. FEBS Lett. 2005;579:927–932. doi: 10.1016/j.febslet.2004.11.025. [DOI] [PubMed] [Google Scholar]
- 3.Yang M, Baranov E, Jiang P, Sun F-X, Li X-M, Li L, et al. Whole-body optical imaging of green fluorescent protein-expressing tumors and metastases. Proc. Natl. Acad. Sci. 2000;97:1206–1211. doi: 10.1073/pnas.97.3.1206. [DOI] [PMC free article] [PubMed] [Google Scholar]
- 4.Yang M, Baranov E, Moossa AR, Penman S, Hoffman RM. Visualizing gene expression by whole-body fluorescence imaging. Proc. Natl. Acad. Sci. 2000;97:12278–12282. doi: 10.1073/pnas.97.22.12278. [DOI] [PMC free article] [PubMed] [Google Scholar]
- 5.Leblond F, Davis SC, Valdés PABW. Pogue, Pre-clinical whole-body fluorescence imaging: Review of instruments, methods and applications. J. Photochem. Photobiol. B. 2010;98:77–94. doi: 10.1016/j.jphotobiol.2009.11.007. [DOI] [PMC free article] [PubMed] [Google Scholar]
- 6.Rich RM, Mummert M, Gryczynski Z, Borejdo J, Sørensen TJ, Laursen BW, et al. Elimination of autofluorescence in fluorescence correlation spectroscopy using the AzaDiOxaTriAngulenium (ADOTA) fluorophore in combination with time-correlated single-photon counting (TCSPC) Anal. Bioanal. Chem. 2013;405:4887–4894. doi: 10.1007/s00216-013-6879-0. [DOI] [PMC free article] [PubMed] [Google Scholar]
- 7.Ghisla S, Massey V, Lhoste J-M, Mayhew SG. Fluorescence and optical characteristics of reduced flavines and flavoproteins. Biochemistry (Mosc.) 1974;13:589–597. doi: 10.1021/bi00700a029. [DOI] [PubMed] [Google Scholar]
- 8.Croce AC, Spano A, Locatelli D, Barni S, Sciola L, Bottiroli G. Dependence of Fibroblast Autofluorescence Properties on Normal and Transformed Conditions. Role of the Metabolic Activity. Photochem. Photobiol. 1999;69:364–374. doi: 10.1562/0031-8655(1999)069<0364:dofapo>2.3.co;2. [DOI] [PubMed] [Google Scholar]
- 9.Haralampus-Grynaviski NM, Lamb LE, Clancy CMR, Skumatz C, Burke JM, Sarna T, et al. Spectroscopic and morphological studies of human retinal lipofuscin granules. Proc. Natl. Acad. Sci. 2003;100:3179–3184. doi: 10.1073/pnas.0630280100. [DOI] [PMC free article] [PubMed] [Google Scholar]
- 10.Schnell SA, Staines WA, Wessendorf MW. Reduction of Lipofuscin-like Autofluorescence in Fluorescently Labeled Tissue. J. Histochem. Cytochem. 1999;47:719–730. doi: 10.1177/002215549904700601. [DOI] [PubMed] [Google Scholar]
- 11.Clancy B, Cauller L. Reduction of background autofluorescence in brain sections following immersion in sodium borohydride. J. Neurosci. Methods. 1998;83:97–102. doi: 10.1016/s0165-0270(98)00066-1. [DOI] [PubMed] [Google Scholar]
- 12.Cowen T, Haven AJ, Burnstock G. Pontamine sky blue: A counterstain for background autofluorescence in fluorescence and immunofluorescence histochemistry. Histochemistry. 1985;82:205–208. doi: 10.1007/BF00501396. [DOI] [PubMed] [Google Scholar]
- 13.Weissleder R, Ntziachristos V. Shedding light onto live molecular targets. Nat. Med. 2003;9:123–128. doi: 10.1038/nm0103-123. [DOI] [PubMed] [Google Scholar]
- 14.Schweitzer D, Gaillard ER, Dillon J, Mullins RF, Russell S, Hoffmann B, et al. Time-Resolved Autofluorescence Imaging of Human Donor Retina Tissue from Donors with Significant Extramacular Drusen. Invest. Ophthalmol. Vis. Sci. 2012;53:3376–3386. doi: 10.1167/iovs.11-8970. [DOI] [PMC free article] [PubMed] [Google Scholar]
- 15.Becker W. Fluorescence lifetime imaging – techniques and applications. J. Microsc. 2012;247:119–136. doi: 10.1111/j.1365-2818.2012.03618.x. [DOI] [PubMed] [Google Scholar]
- 16.Schneckenburger H, Wagner M, Weber P, Strauss WSL, Sailer R. Autofluorescence Lifetime Imaging of Cultivated Cells Using a UV Picosecond Laser Diode. J. Fluoresc. 2004;14:649–654. doi: 10.1023/b:jofl.0000039351.09916.cc. [DOI] [PubMed] [Google Scholar]
- 17.Cubeddu R, Ramponi R, Taroni P, Canti G, Ricci L, Supino R. Time-gated fluorescence spectroscopy of porphyrin derivatives incorporated into cells. J. Photochem. Photobiol. B. 1990;6:39–48. doi: 10.1016/1011-1344(90)85072-5. [DOI] [PubMed] [Google Scholar]
- 18.Periasamy A, Siadat-Pajouh M, Wodnicki P, Wang XF, Herman B. micranalysis-1995.pdf. USA Microsc. Anal. 1995:19–21. [Google Scholar]
- 19.Dahan M, Laurence T, Pinaud F, Chemla DS, Alivisatos AP, Sauer M, et al. Time-gated biological imaging by use of colloidal quantum dots. Opt. Lett. 2001;26:825–827. doi: 10.1364/ol.26.000825. [DOI] [PubMed] [Google Scholar]
- 20.Rich RM, Stankowska DL, Maliwal BP, Sørensen TJ, Laursen BW, Krishnamoorthy RR, et al. Elimination of autofluorescence background from fluorescence tissue images by use of time-gated detection and the AzaDiOxaTriAngulenium (ADOTA) fluorophore. Anal. Bioanal. Chem. 2013;405:2065–2075. doi: 10.1007/s00216-012-6623-1. [DOI] [PMC free article] [PubMed] [Google Scholar]
- 21.Eliseeva SV, Bünzli J-CG. Lanthanide luminescence for functional materials and biosciences. Chem. Soc. Rev. 2009;39:189–227. doi: 10.1039/b905604c. [DOI] [PubMed] [Google Scholar]
- 22.Jin D, Piper JA. Time-Gated Luminescence Microscopy Allowing Direct Visual Inspection of Lanthanide-Stained Microorganisms in Background-Free Condition. Anal. Chem. 2011;83:2294–2300. doi: 10.1021/ac103207r. [DOI] [PubMed] [Google Scholar]
- 23.Rich R, Li J, Fudala R, Gryczynski Z, Gryczynski I, Mandecki W. Properties of coatings on RFID p-Chips that support plasmonic fluorescence enhancement in bioassays. Anal. Bioanal. Chem. 2012;404:2223–2231. doi: 10.1007/s00216-012-6369-9. [DOI] [PMC free article] [PubMed] [Google Scholar]
- 24.Lakowicz JR, Szmacinski H, Nowaczyk K, Berndt KW, Johnson M. Fluorescence lifetime imaging. Anal. Biochem. 1992;202:316–330. doi: 10.1016/0003-2697(92)90112-k. [DOI] [PMC free article] [PubMed] [Google Scholar]
- 25.Pepperkok R, Squire A, Geley S, Bastiaens PIH. Simultaneous detection of multiple green fluorescent proteins in live cells by fluorescence lifetime imaging microscopy. Curr. Biol. 1999;9:269–274. doi: 10.1016/s0960-9822(99)80117-1. [DOI] [PubMed] [Google Scholar]
- 26.Bilan DS, Pase L, Joosen L, Gorokhovatsky AY, Ermakova YG, Gadella TWJ, et al. HyPer-3: A Genetically Encoded H2O2 Probe with Improved Performance for Ratiometric and Fluorescence Lifetime Imaging. ACS Chem. Biol. 2013;8:535–542. doi: 10.1021/cb300625g. [DOI] [PubMed] [Google Scholar]
- 27.Beams R, Smith D, Johnson T, Oh S-H, Novotny L, Vamivakas N. Using a Single Diamond NV Center for Nanoscale Fluorescence Lifetime Imaging. Rochester Conf. Coherence Quantum Opt. Quantum Inf. Meas. Meet., Optical Society of America. 2013:M6, 55. [Google Scholar]
- 28.Muller BK, Zaychikov E, Brauchle C, Lamb DC. Pulsed Interleaved Excitation. Biophys. J. 2005;89:3508–3522. doi: 10.1529/biophysj.105.064766. [DOI] [PMC free article] [PubMed] [Google Scholar]
- 29.Fore S, Yuen Y, Hesselink L, Huser T. Pulsed-Interleaved Excitation FRET Measurements on Single Duplex DNA Molecules Inside C-Shaped Nanoapertures. Nano Lett. 2007;7:1749–1756. doi: 10.1021/nl070822v. [DOI] [PubMed] [Google Scholar]
- 30.Rüttinger S, Macdonald R, Krämer B, Koberling F, Roos M, Hildt E. Accurate single-pair Förster resonant energy transfer through combination of pulsed interleaved excitation, time correlated single-photon counting, and fluorescence correlation spectroscopy. J. Biomed. Opt. 2006;11:024012–024012. doi: 10.1117/1.2187425. [DOI] [PubMed] [Google Scholar]
- 31.Sánchez-Mosteiro G, van Dijk EMHP, Hernando J, Heilemann M, Tinnefeld P, Sauer M, et al. DNA-Based Molecular Wires: Multiple Emission Pathways of Individual Constructs. J. Phys. Chem. B. 2006;110:26349–26353. doi: 10.1021/jp064701f. [DOI] [PubMed] [Google Scholar]
- 32.Di Pasqua AJ, Miller ML, Lu X, Peng L, Jay M. Tumor accumulation of neutron-activatable holmium-containing mesoporous silica nanoparticles in an orthotopic non-small cell lung cancer mouse model. Inorganica Chim. Acta. 2012;393:334–336. [Google Scholar]
- 33.Niwa S, Takahashi H, Hirokawa N. β-Tubulin mutations that cause severe neuropathies disrupt axonal transport. EMBO J. 2013;32:1352–1364. doi: 10.1038/emboj.2013.59. [DOI] [PMC free article] [PubMed] [Google Scholar]
- 34.Tischfield MA, Baris HN, Wu C, Rudolph G, Van Maldergem L, He W, et al. Human TUBB3 Mutations Perturb Microtubule Dynamics, Kinesin Interactions, and Axon Guidance. Cell. 2010;140:74–87. doi: 10.1016/j.cell.2009.12.011. [DOI] [PMC free article] [PubMed] [Google Scholar]


