

Abstract
Background
Statins have antiinflammatory and antiatherogenic effects that have been attributed to inhibition of RHO protein geranylgeranylation in inflammatory cells. The activity of protein geranylgeranyltransferase type I (GGTase-I) is widely believed to promote membrane association and activation of RHO family proteins. However, we recently showed that knockout of GGTase-I in macrophages activates RHO proteins and proinflammatory signaling pathways, leading to increased cytokine production and rheumatoid arthritis. In this study, we asked whether the increased inflammatory signaling of GGTase-I–deficient macrophages would influence the development of atherosclerosis in low-density lipoprotein receptor–deficient mice.
Methods and Results
Aortic lesions in mice lacking GGTase-I in macrophages (Pggt1b∆/∆) contained significantly more T lymphocytes than the lesions in controls. Surprisingly, however, mean atherosclerotic lesion area in Pggt1b∆/∆ mice was reduced by ≈60%. GGTase-I deficiency reduced the accumulation of cholesterol esters and phospholipids in macrophages incubated with minimally modified and acetylated low-density lipoprotein. Analyses of GGTase-I–deficient macrophages revealed upregulation of the cyclooxygenase 2–peroxisome proliferator-activated-γ pathway and increased scavenger receptor class B type I– and CD36-mediated basal and high-density lipoprotein–stimulated cholesterol efflux. Lentivirus-mediated knockdown of RHOA, but not RAC1 or CDC42, normalized cholesterol efflux. The increased cholesterol efflux in cultured cells was accompanied by high levels of macrophage reverse cholesterol transport and slightly reduced plasma lipid levels in vivo.
Conclusions
Targeting GGTase-I activates RHOA and leads to increased macrophage reverse cholesterol transport and reduced atherosclerosis development despite a significant increase in inflammation.
Keywords: atherosclerosis, cholesterol, hydroxymethylglutaryl-CoA reductase inhibitors, macrophages, prenylation, statins
The RHO family proteins contain a carboxyl-terminal CAAX motif and undergo posttranslational modification with a 20-carbon geranylgeranyl lipid.1 The reaction is catalyzed by protein geranylgeranyltransferase type I (GGTase-I), a cytosolic enzyme composed of a unique β subunit encoded by Pggt1b and an α subunit that is shared with protein farnesyltransferase.1 The geranylgeranylation and farnesylation reactions, which are conserved from yeast to humans, render the carboxyl terminus of CAAX proteins more hydrophobic and promote their interactions with membranes and other proteins within cells. The most well-studied protein substrates for GGTase-I are RHOA, RAC1, and CDC42.
The RHO proteins control the actin cytoskeleton during cell movements such as extravasation, migration, and phagocytosis, and they participate directly in intracellular signaling pathways.2,3 These activities are important for the proper function of macrophages and other inflammatory cells. Geranylgeranylation is considered essential for membrane targeting and activation of the RHO proteins.4,5 Therefore, inhibiting GGTase-I to block RHO protein activity has been proposed as a strategy to reduce inflammation and to treat arthritis, atherosclerosis, and other inflammatory disorders.6–9 Reduced geranylgeranylation and inhibition of RHO proteins have also been proposed to explain the antiinflammatory and some antiatherogenic properties of statins.8,10 Statins reduce plasma cholesterol levels but also interfere with the production of geranylgeranyl lipids, which in turn reduces RHO protein geranylgeranylation.11,12 There has been considerable support for the notion that blocking geranylgeranylation inactivates RHO proteins.9,13–16
However, a recent study showed that knockout of GGTase-I in macrophages blocked CAAX protein geranylgeranylation and led to accumulation of GTP-bound active RHOA, RAC1, and CDC42.17 The increased RHO protein activity led to increased RAC1, p38, and nuclear factor-κB signaling; increased reactive oxygen species; and increased proinflammatory cytokines, leading to rheumatoid arthritis in vivo. These results suggested that geranylgeranylation serves to inhibit, rather than activate, RHO proteins in macrophages and further suggested a need to reevaluate the importance of RHO protein geranylgeranylation and GGTase-I activity in other pathways and specific disease processes.
RHO proteins are involved in signaling pathways that regulate macrophage foam cell formation and cholesterol efflux, 2 processes relevant to the pathogenesis and treatment of atherosclerosis.18–20 For example, several studies have suggested that activation of RHOA and CDC42 inhibits peroxisome proliferator-activated-γ (PPARγ) activity and cholesterol efflux in macrophages.9,20–22 However, most of those studies were performed by expressing dominant-negative RHO constructs or by treating cells with compounds that alter the activity of the RHO proteins or interfere with protein geranylgeranylation. Thus far, no one has used a genetic strategy to block GGTase-I activity and then define the impact of this intervention on the behavior of macrophages in vivo.
In this study, we investigated how inactivation of GGTase-I in macrophages affects the development of atherosclerosis in low-density lipoprotein (LDL) receptor–deficient mice. We hypothesized that knockout of GGTase-I would accelerate atherosclerosis. This hypothesis was based on 3 observations. First, macrophages lacking GGTase-I mount a robust inflammatory response that would likely promote lesion development.17,23 Second, GGTase-I–deficient mice develop rheumatoid arthritis,17 an inflammatory disorder associated with a high risk of atherosclerosis in humans.24 Third, activation of RHO proteins should inhibit cholesterol efflux and stimulate foam cell formation.9,20,25
Methods
Mouse Breeding
Mice homozygous for a conditional knockout allele of the GGTase-I β subunit and heterozygous for the lysozyme M-Cre knock-in allele (Pggt1bfl/flLC) have been described.26 Pggt1bfl/flLC mice were bred with LDL receptor knockout mice (Ldlr−/−; Jackson Laboratories) and backcrossed 6 times to a C57BL/6 background. Mice were genotyped as described.26,27Pggt1bfl/flLC;Ldlr −/− mice were designated Pggt1b∆/∆; littermate control Pggt1b+/+LC;Ldlr−/− and Pggt1bfl/+LC; Ldlr−/− mice were indistinguishable in phenotype and designated Pggt1b+/+. Six- to 7-week-old male mice were fed a Western-type diet containing 1.25% cholesterol (Harlan AB, Sweden) for 12 and 24 weeks. Mouse experiments were approved by the local research animal ethics committee.
Preparation of En Face Aortas and Proximal Aortic Sections
Aortas were dissected to the iliac bifurcation, fixed in 4% formaldehyde, pinned out under an inverted microscope, and stained with Sudan IV as described.28 Aortic roots were frozen in optimal cutting temperature freezing medium, and 10-μm-thick sections were stained with Oil Red O and hematoxylin.29,30
Quantification of Aortic Lesions and Immunohistochemistry
En face aortas were photographed with a Sony DSC25 digital camera, and lesion areas were quantified with ImageJ software.31 Aortic root sections were scanned in a Mirax Scanner (Zeiss, Germany), and lesions were quantified with BioPix iQ 2.1.8 software. Macrophages, smooth muscle cells, and lymphocytes in lesions were analyzed immunohistochemically with antibodies against monocyte/macrophage antibody-2 (MCA519G, Accurate, NY), α-smooth muscle actin (ab5694, Abcam), CD4, and CD8 (553043 and 553027, BD Pharmingen). Apoptotic cells in aortic root sections were analyzed with the In Situ Cell Death Detection Kit (11684809910, Roche).
Plasma Lipid and Cytokine Analyses
Plasma cholesterol and triglycerides were determined with Konelab/T Series kits and a Konelab 20 Autoanalyzer (Thermo-Fisher). Cholesterol was also measured in lipoprotein fractions of pooled plasma after fast performance liquid chromatography as described.32 Plasma cytokines were quantified with the Mouse Proinflammatory 7-plex Ultrasensitive Kit in a Sector 2400 Imager (Meso Scale Discovery).
Generating Bone Marrow and Peritoneal Macrophages
Bone marrow cells were cultured in high-glucose Dulbecco modified Eagle medium supplemented with 10% FCS, 1% HEPES, 1% glutamine, 1% gentamycin, 0.01% β-mercaptoethanol, and 10% whole supernatant of cell line CMG14-12 as a source of monocyte colony-stimulating factor.33 Experiments were done on differentiated macrophages 7 to 10 days after plating. Intraperitoneal macrophages were collected after rinsing of the mouse peritoneal cavity with 5 mL PBS. Experiments were done 1 to 3 days after plating.
Cytokine Array
Macrophages were incubated with minimally modified LDL for 24 hours, and cytokines in the supernatant were quantified with the Mouse Cytokine Antibody Array Panel A (ARY006, R&D Biosystems).
Foam Cell Formation Assay and Quantification of Cholesterol Esters
Macrophages were seeded on glass slides in 24-well plates, incubated with 50 μg/mL acetylated LDL (acLDL) or minimally modified LDL for 24 hours, fixed with ethanol, and stained with Oil Red O as described.31 The cells were imaged in the Mirax Scanner, and Oil Red O staining and cell area were determined with BioPix iQ 2.1.8 software. Lipid uptake was also analyzed by fluorescence-activated cell sorter analysis after cells were incubated with Alexa Fluor 488–labeled acLDL (I23380, Invitrogen) for 30 minutes at 4C and 16 hours at 37C. Cholesterol ester content in macrophages was measured 36 hours after incubation with acLDL. Neutral lipids were extracted in 2:3 n-hexane/isopropanol for 20 minutes, dried, and dissolved in 10% Triton X-100 in isopropanol. Total cholesterol and free cholesterol were determined (Wako Chemicals), and cholesterol ester content was calculated by subtracting free from total cholesterol and normalized to total cellular protein levels.
Lipidomics Analyses
Lipids were extracted from bone marrow macrophages with the procedure of Folch et al.34 Cholesterol esters were quantified with straight-phase high-performance liquid chromatography with evaporative light-scattering detection; phospholipids were analyzed with a QTRAP 5500 mass spectrometer equipped with a NanoMate HD robotic nanoflow ion source (Advion Biosciences); and ceramide and glucosylceramide were analyzed by high-performance liquid chromatography coupled to a Quattro Premier XE triple-quadrupole mass spectrometer.35
Cholesterol Efflux Assay, Apoptosis, and Cell Death Analyses
Macrophages were incubated with 1 to 2 μCi [3H]cholesterol (pre-incubated with 50 μg/mL acLDL) in medium containing endotoxin- and free fatty acid–free 0.2% BSA for 24 hours. Cholesterol pools were equilibrated overnight in medium containing 0.1% BSA. Basal and lipid acceptor–stimulated efflux was measured 6 hours after the addition of vehicle, apolipoprotein AI (10 μg/mL), or high-density lipoprotein (HDL; 100 μg/mL). Radioactivity was measured in the medium and cell lysate, and efflux was calculated as percent radioactivity in the medium relative to total radioactivity in cells and medium, normalized to total protein content. Macrophage apoptosis was detected with the ApopTag Fluorescein In Situ Apoptosis Detection Kit (S7110, Millipore), and lactate dehydrogenase in media was detected with the Cytotoxicity Detection Kit (11644793001, Roche).
Western Blotting
Cells were lysed as described.36 GTP-bound RAC1 and CDC42 were affinity precipitated with PAK1-GST (EZ Detect Rac1 Activation Kit, Pierce), and GTP-bound RHOA was precipitated with Rhotekin-GST (RhoA Activation Biochem Kit, Cytoskeleton) as described.17 Total lysates or affinity-precipitated proteins were resolved on 12% and 7.5% SDS-PAGE gels (Criterion and Protean, BioRad), transferred to nitrocellulose or polyvinylidene difluoride membranes, and incubated with antibodies to RAC1 (05-389, Millipore), RHOA (ARH03-B, Cytoskeleton), CDC42 (sc-2462), np-RAP1A (sc-1482, Santa Cruz Biotechnology), liver X receptor-α (LXRα; ab41902, Abcam), cyclooxygenase 2 (COX2; NB110-1948), CD36 (NB400-144), scavenger receptor class B type I (SR-B1; NB400-104), ATP-binding cassette (ABC) family members A1 (NB400-105) and G1 (ABCG1; NB400-132, Novus Biologicals), and actin (A2066, Sigma-Aldrich). Protein bands were visualized with horseradish peroxidase–conjugated secondary antibodies (sc-2354 from Santa Cruz Biotechnology and NA931 and NA934 from GE Healthcare) and the enhanced chemiluminescence Western blotting system (GE Healthcare). Band densities were analyzed with Quantity One (version 4.4.0, Bio-Rad).
PPARγ Activity Assay
Macrophages were cultured to 75% confluence on 150-mm2 plates and incubated without monocyte colony-stimulating factor for 12 hours. Basal PPARγ activity in nuclear extracts was determined with a PPARγ activity assay kit (10006855, Cayman), and values were normalized to total nuclear protein content.
Gene Expression Analyses
RNA was isolated with the RNeasy Mini Kit (Qiagen); cDNA was synthesized with the iScript cDNA Kit (170–889, BioRad); and gene expression was analyzed by TaqMan reverse transcription–quantitative polymerase chain reaction using mouse and human probe sets for Abca1 (Mm00442646_m1, Hs01059118_m1), Abcg1 (Mm00437390_m1, Hs00245154_m1), Cox2 (m00478374_m1, Hs00153133_m1), Cd36 (Mm00432403_m1, Hs01567185_m1), Scarb1 (Mm00450234_m1, Hs00969821_m1), Pparg (Mm01184322_m1, Hs01115513_m1), and Lxra (Mm00443451_m1). Values were normalized to Gapdh (Mm4352932E, Hs402869).
Lentivirus Experiments and Inhibitors
Lentiviruses expressing short hairpin (sh) RNAs targeting mouse ABCA1 (TRCN0000271812-60), ABCG1 (TRCN0000105286–87), CD36 (TRCN000066518–22), RHOA (TRCN0000055192), RAC1 (TRCN0000304690), and SR-BI (TRCN000066573-75) were from Sigma-Aldrich; shCDC42 lentiviruses were from Santa Cruz Biotechnology (SC-29257-V). Macrophages were incubated with lentiviruses at a multiplicity of infection of 10 to 20 for 72 to 96 hours before experiments. Lentiviral construct expressing human PGGT1B gene was from SBI. Inhibitors of GGTase-I (GGTI-298), farnesyltransferase (FTI-276), COX2 (Celecoxib; PZ0008), RHO-associated protein kinase (Y-27632), and etoposide (E1383) were from Sigma; the inhibitor of P21-activated kinase (PAK18) was from Merck.
THP-1 Cells
The human acute monocytic leukemia cell line THP-1 was differentiated into macrophage-like cells with phorbol 12-myristate 13-acetate.37 For cholesterol efflux, gene expression analyses, and Western blotting, THP-1 macrophages were incubated with a GGTI (1, 5, and 10 μmol/L) for 48 hours before experiments.
Reverse Cholesterol Transport
Bone marrow macrophages were loaded with 25 μg/mL acLDL and 5 μCi/mL [3H]cholesterol for 30 hours, washed twice with PBS, scraped into RPMI-1640/0.2% BSA, spun (1000 rpm, 5 minutes, 4°C), and resuspended in RPMI-1640/0.2% BSA. Cell viability and radioactivity were counted, and 1.3×10⁶ counts per minute (CPM) was injected intraperitoneally into Pggt1b∆/∆ recipient mice. Plasma samples were obtained at baseline and after 24 and 48 hours, and 5-μL aliquots were counted in a scintillation counter. Feces were collected at 0, 24, and 48 hours; soaked in distilled water (100 mg/mL) overnight at 4°C; and homogenized in an equal volume of ethanol. Then, 500-μL aliquots of the homogenate were counted in a scintillation counter. CPM/mL in the plasma and CPM/100 mg feces were expressed as percent of injected CPMs. This protocol was a modification of those used in previous studies.38,39
Statistics
Values are mean±SEM unless stated otherwise. Differences between groups were assessed with the t test or Mann-Whitney test and considered significant at P<0.05.
Results
Inactivating Macrophage GGTase-I Reduces Atherosclerosis but Increases Inflammation
To define the role of macrophage GGTase-I in atherogenesis, we bred mice lacking Pggt1b expression in macrophages26 onto an Ldlr-deficient background. These mice, designated Pggt1b∆/∆, were fed a Western-type diet for 12 or 24 weeks. Atherosclerotic lesions in Pggt1b∆/∆ aortas were 50% smaller than in littermate controls at 12 weeks and 60% smaller at 24 weeks, as judged by en face analyses of the aorta (Figure 1A). Lesions were also reduced in aortic root sections (Figure IA in the online-only Data Supplement). Areas of necrosis in aortic root sections were less frequent in Pggt1b∆/∆ than in control Pggt1b+/+ mice; however, levels of apoptotic cells did not differ (Figure IB and IC in the online-only Data Supplement). Body weight curves in Pggt1b∆/∆ and control Pggt1b+/+ mice were similar, but Pggt1b∆/∆ mice had slightly lower plasma cholesterol and triglyceride levels (Figure 1B and 1C). The lower plasma lipid levels were also evident when the plasma lipoproteins were fractionated by fast protein liquid chromatography (Figure 1D and Figure ID in the online-only Data Supplement).
Figure 1.
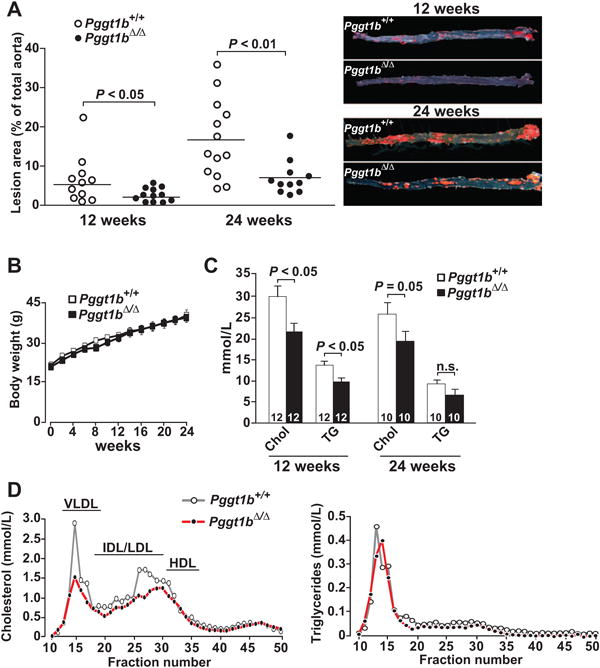
Knockout of macrophage geranylgeranyltransferase type I (GGTase-I) reduces atherosclerosis development in Ldlr-deficient mice. A, Quantification of lipid lesions in aortas of Pggt1b+/+ and Pggt1b∆/∆ mice fed a high-fat diet for 12 and 24 weeks. Right, Representative photographs of aortas. B, Body weight curves of Pggt1b+/+ mice (n=11) and Pggt1b∆/∆ mice (n=13) fed a high-fat diet. C, Plasma cholesterol (Chol) and triglyceride (TG) levels. Numbers in bars indicate the number of mice. D, Cholesterol and triglyceride levels in fast protein liquid chromatography–fractionated plasma pooled from 10 mice per genotype. The mice were fed a high-fat diet for 12 weeks. HDL indicates high-density lipoprotein; IDL, intermediate-density lipoprotein; LDL, low-density lipoprotein; and VLDL, very-low-density lipoprotein.
The macrophage lesion area of aortic root sections was reduced in Pggt1b∆/∆ mice compared with controls, whereas the area of smooth muscle cells was similar in both groups of mice, as judged by immunostaining for monocyte/macrophage antibody-2 and α-smooth muscle actin (Figure 2A and 2B). However, the number of T cells in lesions was 2-fold higher in Pggt1b∆/∆ mice than in controls, as judged by immunostaining for CD4 (Figure 2C) and CD8 (not shown). Quantification of inflammatory markers in plasma revealed increased levels of the proinflammatory cytokine CXCL1 and reduced levels of the antiinflammatory cytokine interleukin-10 in Pggt1b∆/∆ mice (Figure 2D). Consistent with the increased inflammatory response in vivo, cytokine production was markedly increased in Pggt1b∆/∆ intraperitoneal macrophages incubated with minimally modified LDL (Figure 2E). Similar results were observed in bone marrow–derived macrophages (not shown). Thus, GGTase-I–deficient macrophages are capable of robust inflammatory responses, but the Pggt1b∆/∆ mice exhibited smaller atherosclerotic lesions.
Figure 2.
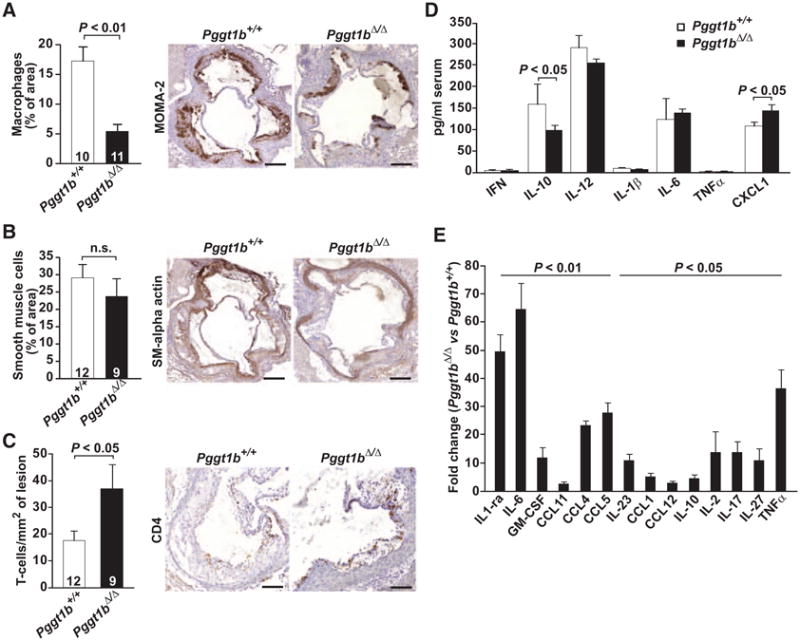
Geranylgeranyltransferase type I (GGTase-I) deficiency in macrophages increases inflammation. A through C, Immunohisto-chemical analyses of the cellular composition in aortic root lesions of mice fed a high-fat diet for 12 weeks. Quantification (left) and representative photographs (right) of sections stained with monocyte/macrophage antibody-2 (MOMA-2; macrophages; A), α-smooth muscle actin (SMα; smooth muscle cells; B), and CD4 (T lymphocytes; C). Numbers in bars indicate the number of mice. D, Cytokine levels in serum of mice fed a high-fat diet for 24 weeks (n=10 per genotype). E, Cytokine levels in medium of Pggt1b+/+ and Pggt1b∆/∆ intraperitoneal macrophages (n=5 per genotype) incubated with minimally modified low-density lipoprotein (mmLDL) for 24 hours. CLXL1 indicates C-X-C-motif chemokine ligand 1; GM-CSF, granulocyte macrophage colony-stimulating factor; IFN, interferon-γ; IL, interleukin; and TNF-α, tumor necrosis factor-α.
Knockout of GGTase-I Impairs Macrophage Foam Cell Formation
To determine whether GGTase-I deficiency affects lipid accumulation, we quantified Oil Red O staining in macrophages incubated for 24 hours with acLDL and minimally modified LDL. Pggt1b∆/∆ macrophages had lower levels of staining compared with Pggt1b+/+ cells (Figure 3A and 3B). To exclude the possibility that the spreading defect of Pggt1b∆/∆ macrophages17 confounds 2-dimensional analysis of lipid accumulation, we quantified uptake of Alexa Fluor–conjugated acLDL by fluorescence-activated cell sorter analysis. (Pggt1b+/+ and Pggt1b∆/∆ macrophages in suspension are similar in size and shape; Figure II in the online-only Data Supplement.) The fluorescence-activated cell sorter analyses also revealed reduced levels of lipid accumulation by Pggt1b∆/∆ cells (Figure 3C). Consistent with those observations, after a 36-hour incubation with acLDL, cholesterol ester levels were 45% lower in Pggt1b∆/∆ macrophages than in Pggt1b+/+ macrophages, as judged by enzymatic assays and lipidomics analyses (Figure 3D and Figure IIIA in the online-only Data Supplement). Moreover, ceramide and phospholipid levels were 37% to 55% lower in Pggt1b∆/∆ macrophages (Figure IIIB and IIIC in the online-only Data Supplement). Basal lipid levels were similar in Pggt1b∆/∆ and Pggt1b+/+ macrophages (Figure IIIA-IIIC in the online-only Data Supplement).
Figure 3.
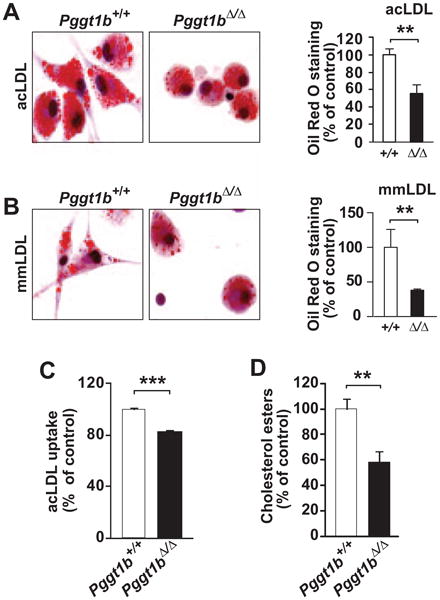
Geranylgeranyltransferase type I (GGTase-I) inactivation reduces macrophage foam cell formation. A and B, Oil Red O staining of intraperitoneal macrophages incubated with (A) 50 μg/mL acetylated low-density lipoprotein (acLDL; n=5–7 per genotype) and (B) 50 μg/mL minimally modified LDL (mmLDL; n=3–4 per genotype) for 24 hours. Left, Representative photographs. Right, Quantification of staining divided by cell number and expressed as percent of that in Pggt1b+/+ macrophages. C, Fluorescence-activated cell sorter analyses of the uptake of Alexa Fluor–conjugated acLDL by bone marrow macrophages (n=4 per genotype). D, Macrophage cholesterol ester level after a 36-hour incubation with acLDL normalized to total cell protein content and expressed as percent of that in Pggt1b+/+ macrophages (n=7 per genotype). **P<0.01; ***P<0.001.
GGTase-I Deficiency Increases Cholesterol Efflux by COX2- and PPARγ-Mediated Increase in SR-B1 and CD36
Pggt1b∆/∆ macrophages have normal phagocytic activity.17 Thus, we asked whether increased lipid export might account for the reduced lipid accumulation in Pggt1b∆/∆ macrophages. For this, we loaded cells with [3H]cholesterol and measured cholesterol efflux at baseline and after adding apolipoprotein AI or HDL. Basal levels of efflux in Pggt1b∆/∆ macrophages were 4-fold higher than in Pggt1b+/+ macrophages (Figure 4A and 4B). Efflux was increased 2-fold by apolipoprotein AI and 3-fold by HDL (Figure 4A and 4B). In keeping with these findings, cholesterol efflux was higher in Pggt1b+/+ macrophages incubated with a protein GGTI. In addition, the high levels of cholesterol efflux in Pggt1b∆/∆ macrophages could be reduced with a lentivirus expressing human PGGT1B. A protein farnesyltransferase inhibitor had no impact on cholesterol efflux in Pggt1b+/+ macrophages (Figure 4C–4F and Figure IVA and IVB in the online-only Data Supplement).
Figure 4.
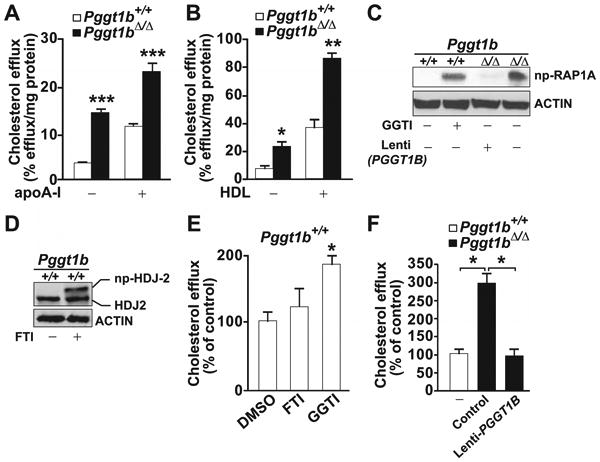
Increased cholesterol efflux in macrophages from Pggt1b∆/∆ mice. A and B, Basal and (A) apolipoprotein A1 (apoA1)– and (B) high-density lipoprotein (HDL)–stimulated cholesterol efflux in bone marrow (BM) macrophages (n=4 per genotype). C, Western blots demonstrating high levels of nonprenylated (np) RAP1A in Pggt1b∆/∆ BM macrophages and in Pggt1b+/+ macrophages incubated with a geranylgeranyltransferase type I (GGTase-I; 10 μmol/L) and low levels in Pggt1b+/+ cells and in Pggt1b∆/∆ cells incubated with a lentivirus expressing human PGGT1B. D, Control Western blots demonstrating reduced electrophoretic mobility of HDJ2 in Pggt1b+/+ cells incubated with a farnesyltransferase inhibitor (FTI; 10 μmol/L). E and F, Basal cholesterol efflux in BM macrophages incubated with dimethyl sulfoxide (DMSO), FTI, or GGTI (n=3–4 per treatment; E) or with lenti-PGGT1B at a multiplicity of infection of 20 (n=3; F). *P<0.05; **P<0.01; ***P<0.001.
We asked if apoptosis of Pggt1b∆/∆ macrophages accounts for the increased release of [3H]cholesterol to the media in the efflux assays. Terminal deoxynucleotidyl transferase dUTP nick-end labeling staining of Pggt1b∆/∆ and Pggt1b+/+ macrophages after incubation with acLDL revealed no differences in levels of apoptosis. Cell death was slightly reduced in Pggt1b∆/∆ macrophages, as judged by lactate dehydrogenase cytotoxicity assay (Figure VA and VB in the online-only Data Supplement). Moreover, apoptosis induction with etoposide did not affect levels of cholesterol efflux in Pggt1b+/+ macrophages (Figure VC in the online-only Data Supplement).
To identify the pathways that mediate increased cholesterol efflux in Pggt1b∆/∆ macrophages, we quantified levels of PPARγ in nuclear extracts with an ELISA; we also assessed levels of Pparg transcripts. Basal PPARγ activity was 2-fold higher and Pparg mRNA levels were 4-fold higher in Pggt1b∆/∆ macrophages than in Pggt1b+/+ macrophages (Figure 5A and 5B). Basal expression levels of COX2 and LXRα were also higher, as judged by mRNA levels and Western blots (Figure 5B and 5C). When COX2 activity in Pggt1b∆/∆ macrophages was inhibited with Celecoxib, cholesterol efflux returned to normal levels (Figure 5D).
Figure 5.
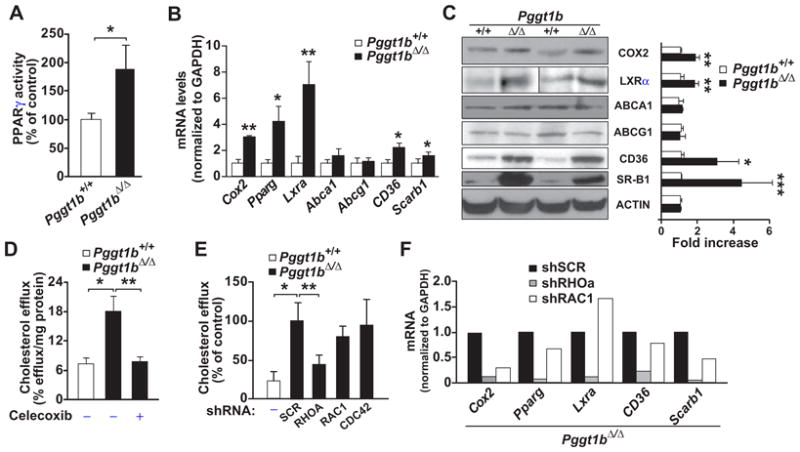
Increased peroxisome proliferator-activated receptor-γ (PPARγ) activation and scavenger receptor expression in geranylgeranyltransferase type I (GGTase-I)–deficient macrophages. A, PPARγ activity in nuclear extracts of bone marrow (BM) macrophages (n=6–7 per genotype). B, TaqMan analyses showing gene expression in intraperitoneal macrophages (n=6 per genotype). C, Western blot showing levels of proteins analyzed in B. Left, Representative blots; right, quantification of band density in cell preparations from 3 to 4 mice per genotype. D and E, Basal cholesterol efflux in BM macrophages incubated with dimethyl sulfoxide or cyclooxygenase 2 (COX2) inhibitor (Celecoxib; 12.5 μmol/L; n=3–6 per genotype and treatment; D) or with lentiviruses expressing shRNA targeting RHOA, RAC1, and CDC42 or containing a scrambled (SCR) sequence (n=4–6; E). F, TaqMan analysis of genes involved in cholesterol efflux in intraperitoneal macrophages incubated with RHOA, RAC1, and SCR shRNA lentiviruses (n=3). ABCA1 indicates ATP-binding cassette family member A1; ABCG1 ATP-binding cassette family member G1; LXRα, liver X receptor-α, and SR-B1, scavenger receptor class B type I. *P < 0.05; **P<0.01.
Cholesterol efflux can be mediated by PPARγ-LXRα–induced upregulation of ABCA1 and ABCG1 and by COX2-PPARγ–mediated upregulation of CD36 and SR-B1.40–42 ABCA1 and ABCG1 expression in Pggt1b∆/∆ macrophages was not different from that in Pggt1b+/+ macrophages; however, levels of SR-B1 and CD36 proteins were significantly increased (Figure 5B and 5C). SR-B1 levels were also higher in aortic sections from Pggt1b∆/∆ mice, as judged by immunohistochemical studies (Figure VIA and VIB in the online-only Data Supplement).
To assess the importance of SR-B1 and CD36 in efflux of Pggt1b∆/∆ macrophages, we suppressed their expression with lentiviral shRNAs. We also suppressed expression of ABCA1 and ABCG1. In our studies, Abca1, Abcg1, Cd36, and Scarb1 transcripts were reduced by 60% to 80% (Figure VIIA in the online-only Data Supplement). Knockdown of SR-B1 reduced basal cholesterol efflux in Pggt1b∆/∆ macrophages, and knockdown of CD36 reduced HDL-stimulated efflux (Figure VIIB and VIIC in the online-only Data Supplement). Knockdown of ABCA1 and ABCG1 had no discernible effect on cholesterol efflux in Pggt1b∆/∆ macrophages.
To assess the effects of GGTase-I inhibition on human macrophages, we incubated THP1 cells with a GGTI. Basal cholesterol efflux increased, as did mRNA and protein expression of COX2, PPARG, CD36, and SCARB1 (Figure VIIIA–VIIIC in the online-only Data Supplement). The GGTI did not affect the expression of ABCA1 or ABCG1. Thus, mouse and human macrophages respond similarly to GGTase-I inhibition.
RHOA Activation Mediates the Increased Cholesterol Efflux in GGTase-I–Deficient Macrophages
We previously showed that GGTase-I–deficient macrophages accumulate high levels of active GTP-bound RHOA, RAC1, and CDC42,17 and we confirmed those results in the present model (Figure IXA in the online-only Data Supplement). To determine whether activated RHO proteins contribute to cholesterol efflux in Pggt1b∆/∆ macrophages, we suppressed their expression with lentiviral shRNA. The shRNAs reduced expression of Rhoa, Rac1, and Cdc42 transcripts by 50% to 75% (Figure IXB in the online-only Data Supplement). Knockdown of RHOA, but not RAC1 and CDC42, reduced cholesterol efflux in Pggt1b∆/∆ macrophages to the levels observed in Pggt1b+/+macrophages (Figure 5E). RHOA knockdown also reduced the expression of Cox2, Pparg, Lxra, Cd36, and Scarb1 (Figure 5F). Consistent with these findings, cholesterol efflux in Pggt1b∆/∆ macrophages was reduced when RHOA signaling was inhibited with a RHO kinase inhibitor. An inhibitor of RAC signaling had no effect (Figure IXC in the online-only Data Supplement). Overall, the data suggest that RHOA activation, acting upstream of COX2, increases cholesterol efflux in Pggt1∆/∆macrophages.
GGTase-I Deficiency Increases Macrophage-Stimulated Reverse Cholesterol Transport In Vivo
To determine whether the increased cholesterol efflux in Pggt1b∆/∆ macrophages results in higher levels of reverse cholesterol transport in vivo, we loaded Pggt1b+/+ and Pggt1b∆/∆ macrophages with [3H]cholesterol:acLDL, injected the cells into the peritoneal cavity of Pggt1b∆/∆ mice, and measured radioactivity in plasma and feces after 24 and 48 hours. Levels of [3H]cholesterol in plasma and feces were 1.5- to 2-fold higher in mice injected with Pggt1b∆/∆ macrophages than in those injected with Pggt1b+/+ macrophages (Figure 6A and 6B).
Figure 6.

Geranylgeranyltransferase type I (GGTase-I) deficiency in macrophages increases reverse cholesterol transport in vivo. Transport of [3H]cholesterol into plasma (A) and feces (B) after an intraperitoneal injection of [3H]cholesterol:acetylated low-density lipoprotein–loaded bone marrow macrophages into Pggt1b∆/∆ recipient mice. Data are from 3 independent experiments (n=6–8 mice per group). *P<0.05; **P<0.01.
Discussion
Levels of atherosclerosis in mice are generally worsened by proinflammatory factors.23,43 In this study, we found that GGTase-I deficiency in macrophages markedly reduces atherosclerosis despite higher levels of inflammation. GGTase-I–deficient macrophages produced high levels of proinflammatory cytokines in response to minimally modified LDL, and T-cell recruitment to subendothelial lesions was increased. The Pggt1b∆/∆ mice also develop rheumatoid arthritis, which is associated with more atherosclerotic disease in humans.24 Thus, the lower levels of atherosclerosis in Pggt1b∆/∆ mice were surprising. Uncoupling of inflammation and lipid accumulation in atherogenesis has been observed previously,44–46 although not to the same degree as in Pggt1b∆/∆ mice.
The finding of reduced atherosclerosis in Pggt1b∆/∆ mice is likely explained by 3 factors. First, foam cell formation in Pggt1b∆/∆ macrophages was reduced as a consequence of increased cholesterol efflux, triggered by RHOA and signaling through the COX2–PPARγ–scavenger receptor pathway. Second, the increased cholesterol efflux of Pggt1b∆/∆ macrophages resulted in increased levels of reverse cholesterol transport in Pggt1b∆/∆ mice. Third, plasma lipid levels were slightly lower in Pggt1b∆/∆ mice, likely a consequence of the increased reverse cholesterol transport. Each of these factors—more unloading of cholesterol by cultured macrophages, increased macrophage reverse cholesterol transport in vivo, and lower plasma lipid levels—would be expected, on the basis of previous studies, to reduce atherogenesis.47–52
The signaling pathway that led to increased cholesterol efflux of Pggt1b∆/∆ macrophages was triggered by activated RHOA, was dependent on COX2 activity, and was associated with increased expression of COX2, PPARγ, CD36, and SR-B1. RHOA was upstream in this pathway because RHOA inhibition normalized both the gene-expression changes and cholesterol efflux. Treatment with a COX2 inhibitor also normalized efflux. Knockdown experiments demonstrated that SR-B1 and CD36 were functionally involved in the increased basal and HDL-stimulated cholesterol efflux in Pggt1b∆/∆ macrophages.
LXRα expression was increased in Pggt1b∆/∆ macrophages, but its targets, ABCA1 and ABCG1, were probably not involved in the increased efflux because their expression was unaffected by Pggt1b deficiency and because knockdown of those genes had no impact on cholesterol efflux. One potential explanation for why the high levels of LXRα in Pggt1b∆/∆ macrophages did not affect ABCA1 and ABCG1 expression could be an accumulation of geranylgeranyl pyrophosphate, one of the substrates for GGTase-I. Geranylgeranyl pyrophosphate and its metabolite, GGOH, block the transcriptional activity of LXRα by interfering with the interaction between LXRα and nuclear coactivators.25,53
The finding that ABCA1 and ABCG1 were not involved in the increased cholesterol efflux of Pggt1b∆/∆ macrophages was surprising because those transporters are considered crucial for the unloading of cholesterol from macrophages.48,49 However, SR-B1 and CD36 contributed to macrophage cholesterol efflux in previous studies,40–42 and our present experiments provide strong evidence for their contribution to efflux of Pggt1b∆/∆ macrophages.
Blocking GGTase-I activity in other tissues can be associated with significant pathology54; thus, our results should not prompt unbridled enthusiasm for using GGTIs in the treatment of atherosclerosis. However, they demonstrate that blocking GGTase-I activity in macrophages is atheroprotective despite local and systemic inflammation and despite the presence of severe rheumatoid arthritis. The results also shed light on mechanisms underlying pleiotropic effects of statins. Many studies, including several that assessed the impact of statins on cholesterol efflux,9,13–16,21,22,55,56 concluded that statins and GGTIs inhibit the geranylgeranylation of RHO proteins, interfering with membrane attachment and thereby inactivating the proteins. Most of those studies were performed on the assumption that nonprenylated RHO proteins are GDP bound and inactive. But, with few exceptions, these studies did not assess the activation status of RHO proteins in statin- and GGTI-treated cells. Our genetic experiments clearly demonstrate that nonprenylated RHO proteins are GTP bound and active in macrophages and should refine our understanding of the cellular and in vivo importance of CAAX protein geranylgeranylation.
Supplementary Material
Supplementary Figure 1 (A) Quantification of Oil Red O staining of lipid lesions in aortic root sections expressed as percent of total aortic root area. Right panel, representative photographs of Oil Red O–stained aortic root sections. Scale bar, 50 μm. The mice were fed a high-fat diet for 12 weeks. (B) Quantification of necrosis in aortic root sections. The mice were fed a high-fat diet for 24 weeks. Right panel, photographs of Oil Red O–stained aortic root lesions; areas of necrosis are indicated. Scale bar, 20 μm (C) Quantification of TUNEL positive cells in aortic root lesions from mice shown in panel B. Right panel, representative immunoflouresence images. Thymus was used as a positive control. Scale bar, 20 μm (D) Cholesterol and triglycerides levels in FPLC-fractionated plasma pooled from 10 mice per genotype. The mice were fed a high-fat diet for 24 weeks.
Supplementary Figure 2 (A) Average diameter of BM and IP macrophages in suspension. (B) Average circularity of BM and and IP macrophages in suspension. Values were obtained in a Vi-Cell XR cell counter (Beckman Coulter).
Supplementary Figure 3 HPLC- and mass spectrometry–based lipidomic analysis of cholesterol esters (A); ceramide (CER) and glucosylceramide (gluCER) (B); phosphatidylcholine (PC), phosphetidylethanolamine (PE), and sphingomyelin (SM) (C) in BM microphages before and after a 36-h incubation with acLDL (50 μg/ml). * P < 0.05 and ** P < 0.01.
Supplementary Figure 4 (A) ApoA1-mediated cholesterol efflux in BM macrophages incubated with DMSO, FTI (10 μM), and GGTI (10 μM) (n = 3–4/treatment). (B) HDL-mediated cholesterol efflux in BM macrophages incubated with DMSO, FTI, and GGTI (n = 2/treatment).
Supplementary Figure 5 (A) TUNEL staining of BM macrophages incubated for 24 h with 50 μg acLDL. Etoposide (25 μM) was used as a positive control. Right panel, representative immunofluorescence images. Scale bar, 10 μm. (B) Levels of lactate dehydrogenase (LDH; cytotoxicity assay) in cell culture media of BM macrophages from the efflux phase of the cholesterol efflux assay (n = 3/genotype). (C) Basal cholesterol efflux of BM macrophages incubated with etoposide (25 μM) or DMSO during the equilibration and efflux phases of the cholesterol efflux assay (n = 3 Pggt1b∆/∆ and 4 Pggt1b+/+ cell lines).
Supplementary Figure 6 (A) Immunohistochemical staining of SR-BI in aortic root sections of mice fed a high-fat diet for 12 weeks. Scale bar, 10 μm (B) Quantification of SR-BI stainingaortic root lesions (n = 10/genotype).
Supplementary Figure 7 (A) Taqman analyses showing gene axpression in BM macrophages incubated with lentiviruses expressing shRNAs for Abca1, Abcg1, Cd36, and Scarb1, or containing a scrambled (SCR) sequence (n = 2/treatment). (B, C) Basal (B) and HDL-mediated (C) cholesterol efflux in BM macrophages incubated with lentiviruses described A (n = 6–9/treatment). * P < 0.05.
Supplementary Figure 8 (A) Basal cholesterol efflux in THP-1 human macrophages incubated with DMSO or GGTI (10 μM) for 48 h. Values are the mean of two independent experiments performed in triplicate. (B) TaqMan analysis showing gene expression in THP-1 macrophages incubated with DMSO or GGTI (10 μM) for 48 h (n = 4/treatment). (C) Western blots of lysates from THP-1 macrophages incubated with DMSO or GGTI for 48 h. The experiment was repeated three times with similar results. * P < 0.05 and ** P < 0.01.
Supplementary Figure 9 (A) Western blots showing levels of GTP-bound and total RHOA, RAC1, and CDC42 in lysates of BM macrophages. (B) Taqman analyses showing gene expression in Pggt1b∆/∆ BM macrophages incubated with lentiviruses expressing shRNAs targeting RHOA, RAC1, and CDC42, or containing a scrambled (SCR) sequence (n = 3/treatment). (C) Basal cholesterol efflux in BM macrophages incubated with DMSO, ROCK inhibitor, and PAK kinase inhibitor (n = 6–8/genotype). * P < 0.05, ** P < 0.01, and *** P < 0.001.
Clinical Perspective.
The RHO family proteins undergo posttranslational lipidation by protein geranylgeranyltransferase (GGTase-I). It is widely believed that geranylgeranylation is essential for membrane targeting and activity of the RHO proteins; this notion is supported by numerous studies using statins to reduce prenylation in cells. However, we recently demonstrated that knockout of GGTase-I in macrophages hyperactivates RHOA, RAC1, and CDC42; increases cytokine production; and induces rheumatoid arthritis in mice. In this study, we tested whether the increased inflammatory signaling of GGTase-I–deficient macrophages and the systemic inflammation and rheumatoid arthritis would accelerate atherosclerosis development in low-density lipoprotein receptor–deficient mice. As expected, aortic lesions in mice lacking GGTase-I in macrophages contained significantly more T lymphocytes compared with control. But surprisingly, aortic lesions were markedly reduced. Analyses of GGTase-I–deficient macrophages revealed reduced foam cell formation and a striking increase in basal and high-density lipoprotein–stimulated cholesterol efflux, which resulted in increased levels of macrophage-stimulated reverse cholesterol transport in vivo. The increased cholesterol efflux of GGTase-I–deficient macrophages was caused by RHOA-mediated upregulation of cyclooxygenase 2–peroxisome proliferator-activated receptor-γ signaling, which resulted in increased expression of the scavenger receptors SR-B1 and CD36. The results are clinically relevant in that they demonstrate a potent antiatherogenic effect of blocking prenylation in the face of inflammation and rheumatoid arthritis, diseases that normally carry increased risks of atherosclerosis. Moreover, reduced prenylation of RHO proteins is frequently cited as a mechanism for the antiatherogenic properties of statins.
Acknowledgments
We thank Stephen Ordway for editing the manuscript and Maria Heyden and Drs Pernilla Jirholt, Galia Nyström, and Lillemor Mattsson Hultén for advice and technical assistance.
Sources of Funding: This study was supported by a Starting Investigator Grant from the European Research Council; by grants from the Swedish Cancer Society the Swedish Medical Research Council, the Swedish Children's Cancer Fund, Västra Götalandsregionen, and the Ingabritt and Arne Lundberg's Research Foundation (to Dr Bergo); by the Swedish Foundation for Strategic Research (to Drs Borén and Bergo); and by National Institutes of Health grants AG035626-09 and HL090553 (to Dr Young).
Footnotes
Permissions: Requests for permissions to reproduce figures, tables, or portions of articles originally published in Circulation can be obtained via RightsLink, a service of the Copyright Clearance Center, not the Editorial Office. Once the online version of the published article for which permission is being requested is located, click Request Permissions in the middle column of the Web page under Services. Further information about this process is available in the Permissions and Rights Question and Answer document.
Disclosures: None.
References
- 1.Zhang FL, Casey PJ. Influence of metal ions on substrate binding and catalytic activity of mammalian protein geranylgeranyltransferase type-I. Biochem J. 1996;320(pt 3):925–932. doi: 10.1042/bj3200925. [DOI] [PMC free article] [PubMed] [Google Scholar]
- 2.Hall A. G proteins and small GTPases: distant relatives keep in touch. Science. 1998;280:2074–2075. doi: 10.1126/science.280.5372.2074. [DOI] [PubMed] [Google Scholar]
- 3.Heasman SJ, Ridley AJ. Mammalian Rho GTPases: new insights into their functions from in vivo studies. Nat Rev Mol Cell Biol. 2008;9:690–701. doi: 10.1038/nrm2476. [DOI] [PubMed] [Google Scholar]
- 4.Hori Y, Kikuchi A, Isomura M, Katayama M, Miura Y, Fujioka H, Kaibuchi K, Takai Y. Post-translational modifications of the C-terminal region of the rho protein are important for its interaction with membranes and the stimulatory and inhibitory GDP/GTP exchange proteins. Oncogene. 1991;6:515–522. [PubMed] [Google Scholar]
- 5.Solski PA, Helms W, Keely PJ, Su L, Der CJ. RhoA biological activity is dependent on prenylation but independent of specific isoprenoid modification. Cell Growth Differ. 2002;13:363–373. [PMC free article] [PubMed] [Google Scholar]
- 6.Connor AM, Berger S, Narendran A, Keystone EC. Inhibition of protein geranylgeranylation induces apoptosis in synovial fibroblasts. Arthritis Res Ther. 2006;8:R94. doi: 10.1186/ar1968. [DOI] [PMC free article] [PubMed] [Google Scholar]
- 7.Nagashima T, Okazaki H, Yudoh K, Matsuno H, Minota S. Apoptosis of rheumatoid synovial cells by statins through the blocking of protein geranylgeranylation: a potential therapeutic approach to rheumatoid arthritis. Arthritis Rheum. 2006;54:579–586. doi: 10.1002/art.21564. [DOI] [PubMed] [Google Scholar]
- 8.Greenwood J, Steinman L, Zamvil SS. Statin therapy and autoimmune disease: from protein prenylation to immunomodulation. Nat Rev Immunol. 2006;6:358–370. doi: 10.1038/nri1839. [DOI] [PMC free article] [PubMed] [Google Scholar]
- 9.Martin G, Duez H, Blanquart C, Berezowski V, Poulain P, Fruchart JC, Najib-Fruchart J, Glineur C, Staels B. Statin-induced inhibition of the Rho-signaling pathway activates PPARalpha and induces HDL apoA-I. J Clin Invest. 2001;107:1423–1432. doi: 10.1172/JCI10852. [DOI] [PMC free article] [PubMed] [Google Scholar]
- 10.Jain MK, Ridker PM. Anti-inflammatory effects of statins: clinical evidence and basic mechanisms. Nat Rev Drug Discov. 2005;4:977–987. doi: 10.1038/nrd1901. [DOI] [PubMed] [Google Scholar]
- 11.Kumai T, Matsumoto N, Koitabashi Y, Takeba Y, Oonuma S, Sekine S, Tadokoro M, Kobayashi S. Pleiotropic effects of 3-hydroxy-3-methylgl-utaryl-coenzyme A reductase inhibitors: candidate mechanisms for anti-lipid deposition in blood vessels. Curr Med Chem Cardiovasc Hematol Agents. 2005;3:195–201. doi: 10.2174/1568016054368223. [DOI] [PubMed] [Google Scholar]
- 12.Takemoto M, Liao JK. Pleiotropic effects of 3-hydroxy-3-methylglutaryl coenzyme a reductase inhibitors. Arterioscler Thromb Vasc Biol. 2001;21:1712–1719. doi: 10.1161/hq1101.098486. [DOI] [PubMed] [Google Scholar]
- 13.Veillard NR, Braunersreuther V, Arnaud C, Burger F, Pelli G, Steffens S, Mach F. Simvastatin modulates chemokine and chemokine receptor expression by geranylgeranyl isoprenoid pathway in human endothelial cells and macrophages. Atherosclerosis. 2006;188:51–58. doi: 10.1016/j.atherosclerosis.2005.10.015. [DOI] [PubMed] [Google Scholar]
- 14.Kotamraju S, Williams CL, Willams CL, Kalyanaraman B. Statin-induced breast cancer cell death: role of inducible nitric oxide and arginase-dependent pathways. Cancer Res. 2007;67:7386–7394. doi: 10.1158/0008-5472.CAN-07-0993. [DOI] [PubMed] [Google Scholar]
- 15.Takemoto M, Node K, Nakagami H, Liao Y, Grimm M, Takemoto Y, Kita-kaze M, Liao JK. Statins as antioxidant therapy for preventing cardiac myocyte hypertrophy. J Clin Invest. 2001;108:1429–1437. doi: 10.1172/JCI13350. [DOI] [PMC free article] [PubMed] [Google Scholar]
- 16.Ostrowski SM, Wilkinson BL, Golde TE, Landreth G. Statins reduce amyloid-beta production through inhibition of protein isoprenylation. J Biol Chem. 2007;282:26832–26844. doi: 10.1074/jbc.M702640200. [DOI] [PubMed] [Google Scholar]
- 17.Khan OM, Ibrahim MX, Jonsson IM, Karlsson C, Liu M, Sjogren AK, Olofsson FJ, Brisslert M, Andersson S, Ohlsson C, Hultén LM, Bokarewa M, Bergo MO. Geranylgeranyltransferase type I (GGTase-I) deficiency hyperactivates macrophages and induces erosive arthritis in mice. J Clin Invest. 2011;121:628–639. doi: 10.1172/JCI43758. [DOI] [PMC free article] [PubMed] [Google Scholar]
- 18.Nofer JR, Remaley AT, Feuerborn R, Wolinnska I, Engel T, von Eck-ardstein A, Assmann G. Apolipoprotein A-I activates Cdc42 signaling through the ABCA1 transporter. J Lipid Res. 2006;47:794–803. doi: 10.1194/jlr.M500502-JLR200. [DOI] [PubMed] [Google Scholar]
- 19.Nofer JR, Feuerborn R, Levkau B, Sokoll A, Seedorf U, Assmann G. Involvement of Cdc42 signaling in apoA-I-induced cholesterol efflux. J Biol Chem. 2003;278:53055–53062. doi: 10.1074/jbc.M305673200. [DOI] [PubMed] [Google Scholar]
- 20.Argmann CA, Edwards JY, Sawyez CG, O'Neil CH, Hegele RA, Pickering JG, Huff MW. Regulation of macrophage cholesterol efflux through hydroxymethylglutaryl-CoA reductase inhibition. J Biol Chem. 2005;280:22212–22221. doi: 10.1074/jbc.M502761200. [DOI] [PubMed] [Google Scholar]
- 21.Yano M, Matsumura T, Senokuchi T, Ishii N, Murata Y, Taketa K, Motoshima H, Taguchi T, Sonoda K, Kukidome D, Takuwa Y, Kawada T, Brownlee M, Nishikawa T, Araki E. Statins activate peroxisome proliferator-activated receptor gamma through extracellular signal-regulated kinase ½ and p38 mitogen-activated protein kinase-dependent cyclooxygenase-2 expression in macrophages. Circ Res. 2007;100:1442–1451. doi: 10.1161/01.RES.0000268411.49545.9c. [DOI] [PubMed] [Google Scholar]
- 22.Ishibashi Y, Matsui T, Takeuchi M, Yamagishi S. Rosuvastatin blocks advanced glycation end products-elicited reduction of macrophage cholesterol efflux by suppressing NADPH oxidase activity via inhibition of geranylgeranylation of Rac-1. Horm Metab Res. 2011;43:619–624. doi: 10.1055/s-0031-1283148. [DOI] [PubMed] [Google Scholar]
- 23.Hansson GK, Hermansson A. The immune system in atherosclerosis. Nat Immunol. 2011;12:204–212. doi: 10.1038/ni.2001. [DOI] [PubMed] [Google Scholar]
- 24.Symmons DP, Gabriel SE. Epidemiology of CVD in rheumatic disease, with a focus on RA and SLE. Nat Rev Rheumatol. 2011;7:399–408. doi: 10.1038/nrrheum.2011.75. [DOI] [PubMed] [Google Scholar]
- 25.Gan X, Kaplan R, Menke JG, MacNaul K, Chen Y, Sparrow CP, Zhou G, Wright SD, Cai TQ. Dual mechanisms of ABCA1 regulation by geranyl-geranyl pyrophosphate. J Biol Chem. 2001;276:48702–48708. doi: 10.1074/jbc.M109402200. [DOI] [PubMed] [Google Scholar]
- 26.Sjogren AK, Andersson KM, Liu M, Cutts BA, Karlsson C, Wahlstrom AM, Dalin M, Weinbaum C, Casey PJ, Tarkowski A, Swolin B, Young SG, Bergo MO. GGTase-I deficiency reduces tumor formation and improves survival in mice with K-RAS-induced lung cancer. J Clin Invest. 2007;117:1294–1304. doi: 10.1172/JCI30868. [DOI] [PMC free article] [PubMed] [Google Scholar]
- 27.Ishibashi S, Brown MS, Goldstein JL, Gerard RD, Hammer RE, Herz J. Hypercholesterolemia in low density lipoprotein receptor knockout mice and its reversal by adenovirus-mediated gene delivery. J Clin Invest. 1993;92:883–893. doi: 10.1172/JCI116663. [DOI] [PMC free article] [PubMed] [Google Scholar]
- 28.Babaev VR, Patel MB, Semenkovich CF, Fazio S, Linton MF. Macro-phage lipoprotein lipase promotes foam cell formation and atherosclerosis in low density lipoprotein receptor-deficient mice. J Biol Chem. 2000;275:26293–26299. doi: 10.1074/jbc.M002423200. [DOI] [PubMed] [Google Scholar]
- 29.Paigen B, Morrow A, Holmes PA, Mitchell D, Williams RA. Quantitative assessment of atherosclerotic lesions in mice. Atherosclerosis. 1987;68:231–240. doi: 10.1016/0021-9150(87)90202-4. [DOI] [PubMed] [Google Scholar]
- 30.Purcell-Huynh DA, Farese RV, Jr, Johnson DF, Flynn LM, Pierotti V, Newland DL, Linton MF, Sanan DA, Young SG. Transgenic mice expressing high levels of human apolipoprotein B develop severe atherosclerotic lesions in response to a high-fat diet. J Clin Invest. 1995;95:2246–2257. doi: 10.1172/JCI117915. [DOI] [PMC free article] [PubMed] [Google Scholar]
- 31.Furuhashi M, Tuncman G, Görgün CZ, Makowski L, Atsumi G, Vaillan-court E, Kono K, Babaev VR, Fazio S, Linton MF, Sulsky R, Robl JA, Parker RA, Hotamisligil GS. Treatment of diabetes and atherosclerosis by inhibiting fatty-acid-binding protein aP2. Nature. 2007;447:959–965. doi: 10.1038/nature05844. [DOI] [PMC free article] [PubMed] [Google Scholar]
- 32.Garber DW, Kulkarni KR, Anantharamaiah GM. A sensitive and convenient method for lipoprotein profile analysis of individual mouse plasma samples. J Lipid Res. 2000;41:1020–1026. [PubMed] [Google Scholar]
- 33.Takeshita S, Kaji K, Kudo A. Identification and characterization of the new osteoclast progenitor with macrophage phenotypes being able to differentiate into mature osteoclasts. J Bone Miner Res. 2000;15:1477–1488. doi: 10.1359/jbmr.2000.15.8.1477. [DOI] [PubMed] [Google Scholar]
- 34.Folch J, Lees M, Sloane Stanley GH. A simple method for the isolation and purification of total lipids from animal tissues. J Biol Chem. 1957;226:497–509. [PubMed] [Google Scholar]
- 35.Ståhlman M, Pham HT, Adiels M, Mitchell TW, Blanksby SJ, Fagerberg B, Ekroos K, Borén J. Clinical dyslipidaemia is associated with changes in the lipid composition and inflammatory properties of apolipoprotein-B-containing lipoproteins from women with type 2 diabetes. Diabetologia. 2012;55:1156–1166. doi: 10.1007/s00125-011-2444-6. [DOI] [PubMed] [Google Scholar]
- 36.Bergo MO, Gavino BJ, Hong C, Beigneux AP, McMahon M, Casey PJ, Young SG. Inactivation of Icmt inhibits transformation by oncogenic K-Ras and B-Raf. J Clin Invest. 2004;113:539–550. doi: 10.1172/JCI18829. [DOI] [PMC free article] [PubMed] [Google Scholar]
- 37.Tsuchiya S, Yamabe M, Yamaguchi Y, Kobayashi Y, Konno T, Tada K. Establishment and characterization of a human acute monocytic leukemia cell line (THP-1) Int J Cancer. 1980;26:171–176. doi: 10.1002/ijc.2910260208. [DOI] [PubMed] [Google Scholar]
- 38.Smoak KA, Aloor JJ, Madenspacher J, Merrick BA, Collins JB, Zhu X, Cavigiolio G, Oda MN, Parks JS, Fessler MB. Myeloid differentiation primary response protein 88 couples reverse cholesterol transport to inflammation. Cell Metab. 2010;11:493–502. doi: 10.1016/j.cmet.2010.04.006. [DOI] [PMC free article] [PubMed] [Google Scholar]
- 39.Zhang Y, Zanotti I, Reilly MP, Glick JM, Rothblat GH, Rader DJ. Overexpression of apolipoprotein A-I promotes reverse transport of cholesterol from macrophages to feces in vivo. Circulation. 2003;108:661–663. doi: 10.1161/01.CIR.0000086981.09834.E0. [DOI] [PubMed] [Google Scholar]
- 40.Kämmerer I, Ringseis R, Biemann R, Wen G, Eder K. 13-Hydroxy linoleic acid increases expression of the cholesterol transporters ABCA1, ABCG1 and SR-BI and stimulates apoA-I-dependent cholesterol efflux in RAW264.7 macrophages. Lipids Health Dis. 2011;10:222. doi: 10.1186/1476-511X-10-222. [DOI] [PMC free article] [PubMed] [Google Scholar]
- 41.Chinetti G, Gbaguidi FG, Griglio S, Mallat Z, Antonucci M, Poulain P, Chapman J, Fruchart JC, Tedgui A, Najib-Fruchart J, Staels B. CLA-1/SR-BI is expressed in atherosclerotic lesion macrophages and regulated by activators of peroxisome proliferator-activated receptors. Circulation. 2000;101:2411–2417. doi: 10.1161/01.cir.101.20.2411. [DOI] [PubMed] [Google Scholar]
- 42.Bujold K, Rhainds D, Jossart C, Febbraio M, Marleau S, Ong H. CD36-mediated cholesterol efflux is associated with PPARgamma activation via a MAPK-dependent COX-2 pathway in macrophages. Cardiovasc Res. 2009;83:457–464. doi: 10.1093/cvr/cvp118. [DOI] [PubMed] [Google Scholar]
- 43.Libby P. Inflammation in atherosclerosis. Nature. 2002;420:868–874. doi: 10.1038/nature01323. [DOI] [PubMed] [Google Scholar]
- 44.Levin MC, Jirholt P, Wramstedt A, Johansson ME, Lundberg AM, Trajkovska MG, Ståhlman M, Fogelstrand P, Brisslert M, Fogelstrand L, Yan ZQ, Hansson GK, Björkbacka H, Olofsson SO, Borén J. Rip2 deficiency leads to increased atherosclerosis despite decreased inflammation. Circ Res. 2011;109:1210–1218. doi: 10.1161/CIRCRESAHA.111.246702. [DOI] [PubMed] [Google Scholar]
- 45.Kanters E, Pasparakis M, Gijbels MJ, Vergouwe MN, Partouns-Hendriks I, Fijneman RJ, Clausen BE, Förster I, Kockx MM, Rajewsky K, Kraal G, Hofker MH, de Winther MP. Inhibition of NF-kappaB activation in macrophages increases atherosclerosis in LDL receptor-deficient mice. J Clin Invest. 2003;112:1176–1185. doi: 10.1172/JCI18580. [DOI] [PMC free article] [PubMed] [Google Scholar]
- 46.Kanters E, Gijbels MJ, van der Made I, Vergouwe MN, Heeringa P, Kraal G, Hofker MH, de Winther MP. Hematopoietic NF-kappaB1 deficiency results in small atherosclerotic lesions with an inflammatory phenotype. Blood. 2004;103:934–940. doi: 10.1182/blood-2003-05-1450. [DOI] [PubMed] [Google Scholar]
- 47.Rosenson RS, Brewer HB, Jr, Davidson WS, Fayad ZA, Fuster V, Goldstein J, Hellerstein M, Jiang XC, Phillips MC, Rader DJ, Remaley AT, Rothblat GH, Tall AR, Yvan-Charvet L. Cholesterol efflux and atheroprotection: advancing the concept of reverse cholesterol transport. Circulation. 2012;125:1905–1919. doi: 10.1161/CIRCULATIONAHA.111.066589. [DOI] [PMC free article] [PubMed] [Google Scholar]
- 48.Tall AR, Costet P, Wang N. Regulation and mechanisms of macrophage cholesterol efflux. J Clin Invest. 2002;110:899–904. doi: 10.1172/JCI16391. [DOI] [PMC free article] [PubMed] [Google Scholar]
- 49.Tall AR. Cholesterol efflux pathways and other potential mechanisms involved in the atheroprotective effect of high density lipoproteins. J Intern Med. 2008;263:256–273. doi: 10.1111/j.1365-2796.2007.01898.x. [DOI] [PubMed] [Google Scholar]
- 50.Berrougui H, Grenier G, Loued S, Drouin G, Khalil A. A new insight into resveratrol as an atheroprotective compound: inhibition of lipid peroxidation and enhancement of cholesterol efflux. Atherosclerosis. 2009;207:420–427. doi: 10.1016/j.atherosclerosis.2009.05.017. [DOI] [PubMed] [Google Scholar]
- 51.Owen JS. Role of ABC1 gene in cholesterol efflux and atheroprotection. Lancet. 1999;354:1402–1403. doi: 10.1016/S0140-6736(99)00297-4. [DOI] [PubMed] [Google Scholar]
- 52.Navab M, Reddy ST, Van Lenten BJ, Fogelman AM. HDL and cardiovascular disease: atherogenic and atheroprotective mechanisms. Nat Rev Cardiol. 2011;8:222–232. doi: 10.1038/nrcardio.2010.222. [DOI] [PubMed] [Google Scholar]
- 53.Forman BM, Ruan B, Chen J, Schroepfer GJ, Jr, Evans RM. The orphan nuclear receptor LXRalpha is positively and negatively regulated by distinct products of mevalonate metabolism. Proc Natl Acad Sci U S A. 1997;94:10588–10593. doi: 10.1073/pnas.94.20.10588. [DOI] [PMC free article] [PubMed] [Google Scholar]
- 54.Yang SH, Chang SY, Tu Y, Lawson GW, Bergo MO, Fong LG, Young SG. Severe hepatocellular disease in mice lacking one or both CaaX prenyltransferases. J Lipid Res. 2012;53:77–86. doi: 10.1194/jlr.M021220. [DOI] [PMC free article] [PubMed] [Google Scholar]
- 55.Zipp F, Waiczies S, Aktas O, Neuhaus O, Hemmer B, Schraven B, Nitsch R, Hartung HP. Impact of HMG-CoA reductase inhibition on brain pathology. Trends Pharmacol Sci. 2007;28:342–349. doi: 10.1016/j.tips.2007.05.001. [DOI] [PubMed] [Google Scholar]
- 56.Landrier JF, Thomas C, Grober J, Duez H, Percevault F, Souidi M, Linard C, Staels B, Besnard P. Statin induction of liver fatty acid-binding protein (L-FABP) gene expression is peroxisome proliferator-activated receptor-alpha-dependent. J Biol Chem. 2004;279:45512–45518. doi: 10.1074/jbc.M407461200. [DOI] [PubMed] [Google Scholar]
Associated Data
This section collects any data citations, data availability statements, or supplementary materials included in this article.
Supplementary Materials
Supplementary Figure 1 (A) Quantification of Oil Red O staining of lipid lesions in aortic root sections expressed as percent of total aortic root area. Right panel, representative photographs of Oil Red O–stained aortic root sections. Scale bar, 50 μm. The mice were fed a high-fat diet for 12 weeks. (B) Quantification of necrosis in aortic root sections. The mice were fed a high-fat diet for 24 weeks. Right panel, photographs of Oil Red O–stained aortic root lesions; areas of necrosis are indicated. Scale bar, 20 μm (C) Quantification of TUNEL positive cells in aortic root lesions from mice shown in panel B. Right panel, representative immunoflouresence images. Thymus was used as a positive control. Scale bar, 20 μm (D) Cholesterol and triglycerides levels in FPLC-fractionated plasma pooled from 10 mice per genotype. The mice were fed a high-fat diet for 24 weeks.
Supplementary Figure 2 (A) Average diameter of BM and IP macrophages in suspension. (B) Average circularity of BM and and IP macrophages in suspension. Values were obtained in a Vi-Cell XR cell counter (Beckman Coulter).
Supplementary Figure 3 HPLC- and mass spectrometry–based lipidomic analysis of cholesterol esters (A); ceramide (CER) and glucosylceramide (gluCER) (B); phosphatidylcholine (PC), phosphetidylethanolamine (PE), and sphingomyelin (SM) (C) in BM microphages before and after a 36-h incubation with acLDL (50 μg/ml). * P < 0.05 and ** P < 0.01.
Supplementary Figure 4 (A) ApoA1-mediated cholesterol efflux in BM macrophages incubated with DMSO, FTI (10 μM), and GGTI (10 μM) (n = 3–4/treatment). (B) HDL-mediated cholesterol efflux in BM macrophages incubated with DMSO, FTI, and GGTI (n = 2/treatment).
Supplementary Figure 5 (A) TUNEL staining of BM macrophages incubated for 24 h with 50 μg acLDL. Etoposide (25 μM) was used as a positive control. Right panel, representative immunofluorescence images. Scale bar, 10 μm. (B) Levels of lactate dehydrogenase (LDH; cytotoxicity assay) in cell culture media of BM macrophages from the efflux phase of the cholesterol efflux assay (n = 3/genotype). (C) Basal cholesterol efflux of BM macrophages incubated with etoposide (25 μM) or DMSO during the equilibration and efflux phases of the cholesterol efflux assay (n = 3 Pggt1b∆/∆ and 4 Pggt1b+/+ cell lines).
Supplementary Figure 6 (A) Immunohistochemical staining of SR-BI in aortic root sections of mice fed a high-fat diet for 12 weeks. Scale bar, 10 μm (B) Quantification of SR-BI stainingaortic root lesions (n = 10/genotype).
Supplementary Figure 7 (A) Taqman analyses showing gene axpression in BM macrophages incubated with lentiviruses expressing shRNAs for Abca1, Abcg1, Cd36, and Scarb1, or containing a scrambled (SCR) sequence (n = 2/treatment). (B, C) Basal (B) and HDL-mediated (C) cholesterol efflux in BM macrophages incubated with lentiviruses described A (n = 6–9/treatment). * P < 0.05.
Supplementary Figure 8 (A) Basal cholesterol efflux in THP-1 human macrophages incubated with DMSO or GGTI (10 μM) for 48 h. Values are the mean of two independent experiments performed in triplicate. (B) TaqMan analysis showing gene expression in THP-1 macrophages incubated with DMSO or GGTI (10 μM) for 48 h (n = 4/treatment). (C) Western blots of lysates from THP-1 macrophages incubated with DMSO or GGTI for 48 h. The experiment was repeated three times with similar results. * P < 0.05 and ** P < 0.01.
Supplementary Figure 9 (A) Western blots showing levels of GTP-bound and total RHOA, RAC1, and CDC42 in lysates of BM macrophages. (B) Taqman analyses showing gene expression in Pggt1b∆/∆ BM macrophages incubated with lentiviruses expressing shRNAs targeting RHOA, RAC1, and CDC42, or containing a scrambled (SCR) sequence (n = 3/treatment). (C) Basal cholesterol efflux in BM macrophages incubated with DMSO, ROCK inhibitor, and PAK kinase inhibitor (n = 6–8/genotype). * P < 0.05, ** P < 0.01, and *** P < 0.001.