Abstract
In this work, we present a faceted-search based approach for visualization of anatomy by combining a three dimensional digital atlas with an anatomy ontology. Specifically, our approach provides a drill-down search interface that exposes the relevant pieces of information (obtained by searching the ontology) for a user query. Hence, the user can produce visualizations starting with minimally specified queries. Furthermore, by automatically translating the user queries into the controlled terminology our approach eliminates the need for the user to use controlled terminology. We demonstrate the scalability of our approach using an abdominal atlas and the same ontology. We implemented our visualization tool on the opensource 3D Slicer software. We present results of our visualization approach by combining a modified Foundational Model of Anatomy (FMA) ontology with the Surgical Planning Laboratory (SPL) Brain 3D digital atlas, and geometric models specific to patients computed using the SPL brain tumor dataset.
Keywords: Faceted search, ontology, visualization of 3D anatomy, patient specific visualizations
1 Introduction
Three-dimensional (3D) digital atlases are promising approaches to represent and capture the spatial information of anatomy as demonstrated in the works by Golland et al (1999) and Moore et al (2007). Approaches such as in Golland et al (1999) enable a user to visualize different parts of the anatomy using geometric models created from segmented structures in the images. The works in Estevez et al (2010) and Petersson et al (2009) showed that the visualization of 3D anatomy is extremely beneficial as a learning aid. The work by Kikinis (1996) employed such visualizations for guiding and planning of precise surgical interventions. Joint visualization of multiple modality images as in Moore et al (2007) can help to better characterize the underlying disease and assist in treatment planning and clinical decision making.
However, digital atlases on their own do not capture the complete semantic information about the functional organization or the relation of various anatomical structures. Ontologies have been successfully used in conjunction with digital atlases to capture the semantic information by Rubin et al (2009), to better annotate neuroimaging data as in the work of Turner et al (2010), to enable anatomical reasoning by the work by Rubin et al (2004), for visual annotation in Hon̈he et al ´ (1995); Hon’he et al (2001), and to provide assistance to users for visualizing the anatomy as in the work of Kub et al (2008). There has been a lot of work in developing biomedical ontologies and annotation tools for textual and image data by the National Center for Biomedical Ontologies NCBO (2012). Some examples of such tools include the work by Jonguet et al (2009) for annotating journal articles with names from ontologies, faceted search-based tools for searching specific biomedical documents using textually annotated concepts by Ranabahu et al (2011), and a three dimensional segmentation and annotation tool for microscopy images as in Jinx (2012). The work by Pieper et al (2008) is complimentary to our work in 3D Slicer which combines several ontologies with a digital atlas for contextual search. 3D Slicer by Fedorov et al (2012) is an opensource software tool that supports several image analysis methods including registration, segmentation, and visualization of radiological images. In addition to visualization, a user can also combine several databases to integrate and extract a variety of useful information as described in the work by Keator et al (2008). Search interfaces that combine ontologies with digital atlases can aid in several problems including learning and understanding of anatomy, hypothesis driven information search for specific research problems, improving patient treatment and care by integrating multiple information sources both textual and image-based in one framework and in treatment planning for surgical interventions.
In this work, we combine ontology of anatomy with a digital anatomy atlas and provide a simple to use, interactive 3D visualization framework using textual queries. Like prior works, our work uses the ontology to extract descriptive information for the anatomical parts and associates them to the 3D geometric models. Additionally, our approach uses the extracted information to help the user to refine their queries and produce flexible visualizations without them having the knowledge of the exact terminology for the given anatomy. Using our approach, the user can also combine patient specific information such as geometric models of tumor with the atlas for visualization. To our knowledge our work is one of the first approaches that enables faceted visualization of three dimensional anatomy together with patient specific visualizations and shows relevant textual data extracted for a query.
Fig. 1 shows an example of our faceted search-based visualization where the user can employ drill-down search to produce the desired visualization. In this example, the user starts with a simple query, namely, “tumor”, and then refines the query to show the functional systems adjacent to the tumor. As shown, the neuroanatomical structures belonging to the various systems are displayed along with the tumor. Some of the structures such as amygdala and hippocampus are occluded. We implemented our work as an extension module called faceted visualizer by Veeraraghavan et al (2012) in freely available software 3DSlicer (2012).
Fig. 1.
Example of drill-down search based visualization starting from a simple query “tumor” followed by specialization of the same query using the facet “adjacent Systems”.
We identified the following two criteria to produce a flexible visualizer. First, the visualizer interface should be easy to use so that the users can create visualizations without having complete knowledge of the controlled terminology. Second, the system should scale to a variety of queries ranging from simple ones such as about individual parts (e.g.”caudate nucleus”) to complex ones that are composed of multiple parts (e.g.”motor system”), or combination of different queries and their specializations (e.g. “arterial supply” of “motor system”). We address the issue of an easy to use interface by employing faceted search and the second issue by supporting a wide variety of queries such as simple, specialized, complex, and combination queries separated by “+” operators. Details of the query categories are described in Section 4.
2 Materials
In this work, we used the Surgical Planning Laboratory’s SPL Brain Atlas by Talos et al (2009). The brain atlas consists of 154 three dimensional geometrical models of various neuroanatomical structures. The geometrical models were obtained by segmentation of the same parts using MRI images of a healthy male. The atlas also provides a color file that maps the voxel color labels used in the models to anatomically meaningful names so that the model names can be directly compared with the atoms and their associated terms in an anatomy ontology. We combined the atlas with a sqlite3 Database version of the Foundational Model of Anatomy (FMA) ontology by Rosse and Mejino-Jr. (2003). The FMA is a reference ontology for anatomy where the neuroanatomical parts are represented using a taxonomy consisting of several relations. Although the FMA ontology contains the different anatomical parts corresponding to various functional neuroanatomical systems, it doesn’t completely represent their hierarchical organization; examples of this deficit include the motor system and visual system. We augmented the ontology to complete such functional organization. We also combined patient specific geometric models of tumor with the digital atlas. We used the SPL Brain tumor dataset Talos et al (2009) which consists of ten different patients with different grades of glioma and glioblastoma-multiforme in various locations in the brain.
3 Background
3.1 Faceted Search
Faceted search is a technique that simplifies the search experience for users by presenting appropriate information which in turn enables the users to refine their queries starting from a simple one. The work in Koren et al (2008) was one of the first works to employ faceted search for text-based navigation. Faceted search has also been used by the work in Hearst and Soica (2009) to search for documents in digital libraries, by Curtell et al (2006) to search for images from image databases, and by Teevan et al (2008) in web-services. Central to faceted search are “facets” which represent a particular way for organizing the information. Often it is possible to use different combination of facets to obtain the same search result. Furthermore, the facets can be organized as a flat or hierarchical list and every term in the collection can be assigned to one or more facets. There are two important motivations for using faceted search. First, it is known that people prefer to specify as little as required in the query for searching and they are often willing to interact with the search interface to get the desired information Curtell et al (2006). Second, faceted search enables users to get at the same information in multiple ways, thereby, supporting a wider range of end user tasks.
3.2 Challenges for Flexible Visualization of Anatomy using Faceted Search
The goal of our approach is to enable a user to create a variety of visualizations using easy to use steps. To facilitate easy querying, the system must expose appropriate information that can help a user to refine or modify their queries. The first challenge is to determine what information constitutes facets. In our work, we take advantage of the structured organization of data in the ontology to extract the facets. Specifically, we identify two types of facets, namely, the relational and atomic facets. Relational facets are essentially free “predicate” part of a term which is composed of (“subject”, “predicate”, “object”). The atomic facets are the atoms (“subject” or “object”) part of a term. While all predicates can be used as a facet, not all atoms extracted for a query are relevant as its facets. We categorize only those atoms that constitute a sub-part of anatomical part query as they are useful for query refinement. For example, for the query “limbic system”, the atom “Hippocampus” resulting from the relation (limbic system, regional-part, Hippocampus) can lead to query refinement for visualization, whereas, the atom “FMAID6509” from the relation (limbic system, FMAID, FMAID6509) contains no useful information for further refinement. FMAID refers to the identifying label for each atom contained in the FMA ontology.
The second challenge results from the fact that the users may not necessarily know the controlled terminology used in the ontology to obtain a particular visualization. For example, a user may use the query “Pineal gland” instead of “Pineal body” for visualization of the same part. Our approach addresses this problem by converting the user queries into the correct controlled terminology by using the ontology. For instance, it uses the “synonym” predicate to find the correct mapping for the query “Pineal gland” against the ontology and converts them into the appropriate controlled query “Pineal body”. Another related problem is that for a given query, the correct visualization may require a recursive search to extract all the relevant models in the atlas. An example of such a query is “diencephalon” which consists of a number of parts that are organized in a hierarchical fashion. Recursive search through the terms can result in loops and it is important for the algorithm to recognize loops and prevent searches through loops.
The goal of our work is to ultimately visualize the appropriate geometric models for a given query. Hence, it is important to connect the correct geometric models with the corresponding atoms and their terms in the ontology. We solve this problem by automatically matching the model names with the corresponding atoms in the ontology using a two step matching procedure as described in Section 4.
4 Methods
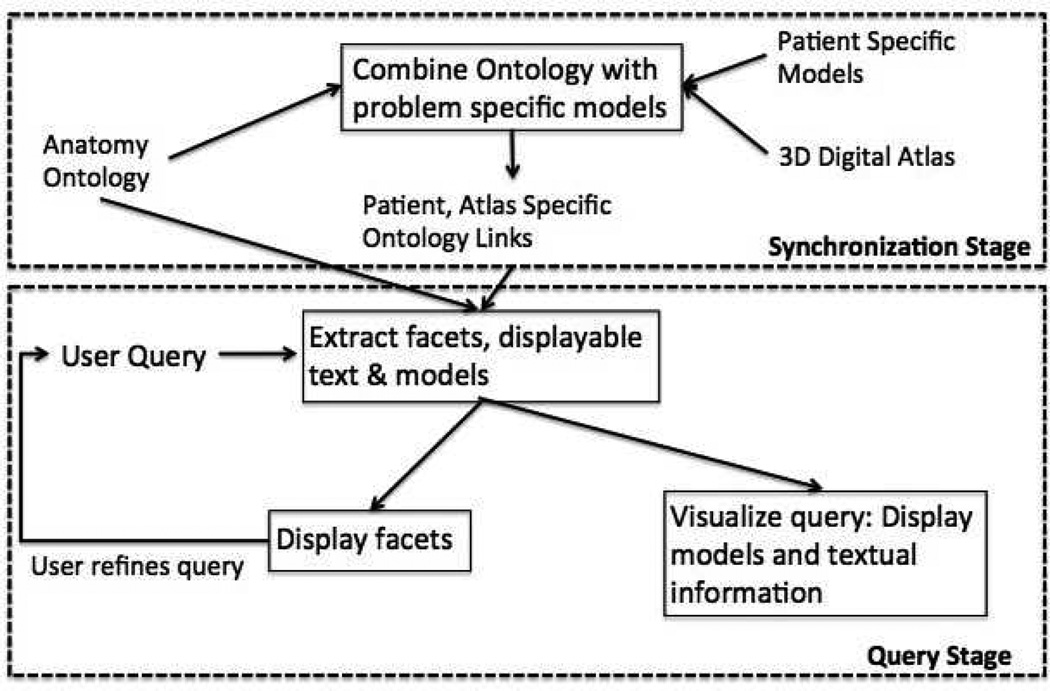
Fig. 2 shows an overview of our approach which consists of a synchronization stage followed by a query processing stage. The synchronization step is performed in each new session of the faceted visualizer. A new session for the visualizer is initiated with each new instance of the 3D Slicer. At each instance, a 3D scene consisting of various geometric models in a digital atlas, patient modes, and images are loaded into the 3D Slicer scene. A new instance of the visualizer also requires the user to load an ontology. In the synchronization stage, all the geometric models added to the 3D Slicer scene are matched with the atoms and terms in the loaded ontology to find corresponding atoms for the models. It is assumed that the models use descriptive anatomic names (e.g. “Glioblastoma multiforme tumor” for a patient specific model, “xx Putamen xx” for models depicting neuroanatomic parts). When either the ontology or the models in the atlas are modified, the synchronization step helps the visualizer to automatically find the correct correspondences for the models in the ontology. However, any changes made to either the ontology or the digital atlas while a specific session is in progress will not be recognized in that session. In the query processing stage, the user queries are processed using a hierarchical search on the ontology. The search extracts all the related terms to the query from which the appropriate facets, any textual information related to the query, and the visualization models are obtained.
Fig. 2.
Overview of faceted search-based query visualization.
4.1 Terminology
-
–
Facets are small pieces of data that represent a particular way of organizing the information. In this work, we use two types of facets, namely, atomic facets (e.g., thalamus) and relational facets (e.g., arterial supply). Atomic facets constitute the atoms that are sub-parts of an anatomical part. Relational facets are the predicates that connect two atoms using a tuple ({“Subject”, “Predicate”, “Object”}).
-
–
Three-dimensional geometric model is a volumetric representation of an anatomical structure. The geometric models are computed from the volumetric segmentation of a specific anatomical part or tumor from an image volume.
-
–
Hierarchical search is a type of search where the terms are searched recursively until there are no more remaining terms for recursive search. As the search recursion happens on the anatomy hierarchy, we refer to this search as the hierarchical search.
4.2 Format constraints for digital atlas and ontology
The faceted visualization module relies heavily on the underlying infrastructure of the 3DSlicer’s visualization tools. To ensure correct visualization, our work currently supports only 3D geometric models represented using 3D Slicer constructs and data structures. Specifically, the geometric models using Visualization ToolKit (VTK Schroeder et al (2006). Second, 3DSlicer currently supports only 3D radiological images. Hence, our work applies only to atlases that are derived from 3D image series and does not support individual two dimensional images such as pathology slide specimens. Third, we require that all the geometric models representing the various anatomic structures in the digital atlas and patient specific models have descriptive names that correspond to the same structure (e.g. Putamen, Right lateral ventricle, Glioblastoma multiforme tumor). Anatomically meaningful names allows the algorithm to find the corresponding atoms in the ontology through querying. For querying in this work we assume that the ontology is represented as a SQL database using the tuple < S,P,O > where S is the subject, P the predicate, and O the object. Querying is performed using SQL constructs. However, in the future, we plan to extend the querying capabilities by using an OWL ontology such as the National Information Framework (NIF) standard ontology Bug et al (2008) in which case the format constraints on the ontology can be relaxed. While we require the model names conform to anatomy names, the model names do not have to match exactly with the atoms in the ontology.
4.3 Synchronization: Dynamic Linking of Three Dimensional Atlas, Patient Models, and Ontology
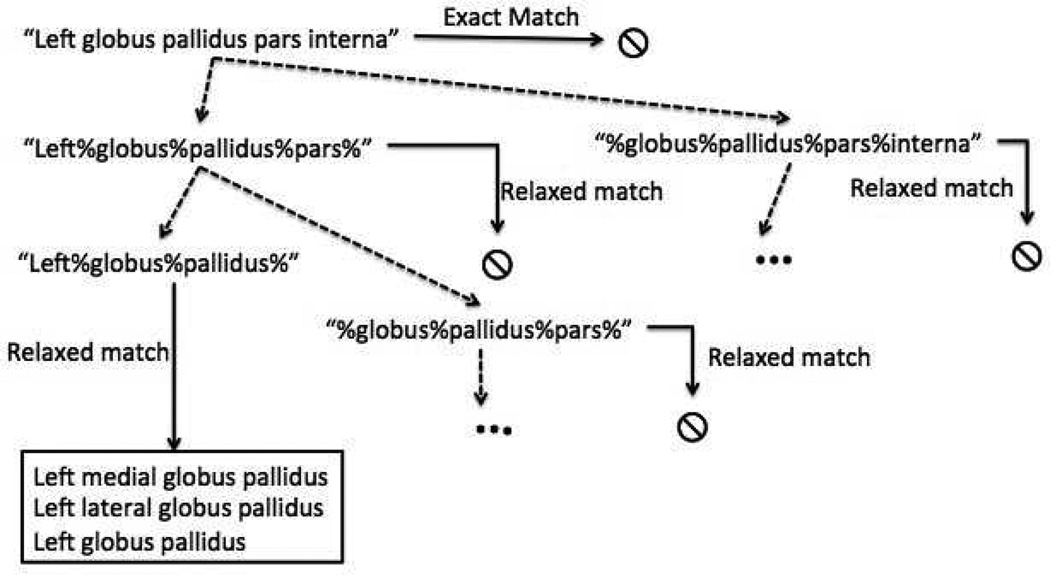
This is the first step in our approach where the three dimensional geometric models corresponding to the various anatomic structures are matched against the atoms in the ontology. The corresponding atoms in the ontology for a given model are found by querying the ontology and finding the closest matching atom. As model names may not match exactly with the atoms in the ontology, we employ a two-step search consisting of (a) exact string match in the first step followed by (b) relaxed string match in the second. Exact matching uses a query of the form select * from res where subject = “string” while relaxed matching uses a query of the form select * from res where subject like “%string%”. Patient specific model names must also use descriptive names to help find the corresponding term (ex. Glioblastoma multiforme tumor) if present in the ontology.
Fig. 3 shows the steps involved in matching a model in the digital atlas named “Left globus pallidus pars interna” with an atom from the ontology. As shown, first the exact string match for the same model name is performed ignoring the case and appropriately handling the white spaces. Relaxed string matching is performed when the exact string matching fails. As shown in Fig. 3, relaxed string matching recursively uses smaller sequence of words to find the matching terms from the ontology. The relaxed string matching stops at a given branch when at least one term with a matching atom is found or when the shortest subsequence length for the model name is reached (i.e., number of words in the subsequence is zero).
Fig. 3.
Example illustration of steps involved in finding matching models with terms in ontology.
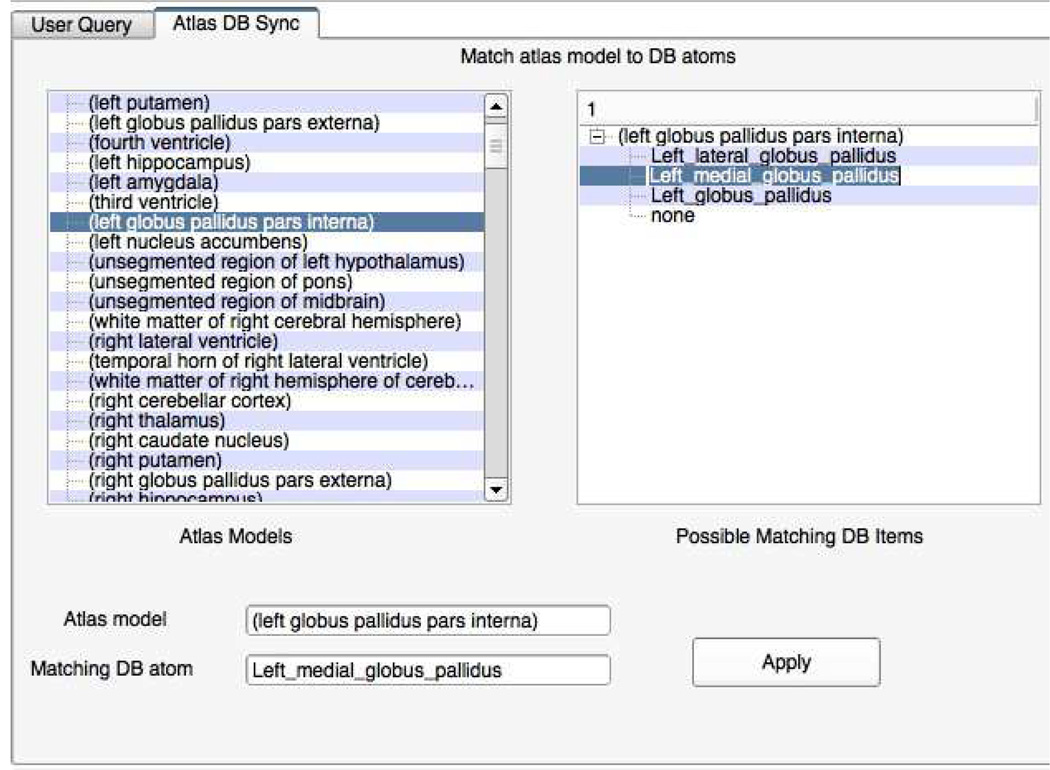
Relaxed matching will often result in multiple matching terms. For example, as shown in Fig. 3 shows three different matching atoms from the ontology for the model name “Left globus pallidus pars interna”. In the current framework, we leave the user to resolve the corresponding atom from along the different choices. Fig. 4 shows the application interface where the user can select the matching atoms for the model names. One way to eliminate multiple searches will be to automatically ignore generic matching strings such as “left”, “right” etc.,from the search. In the future, we plan to extend the search functionality to automatically recognize such generic adjectives and eliminate them from the search. The patient and atlas models that do not match with any atoms in the ontology are added to a separate list which can be directly visualized through user queries. Only difference is that queries for those models will not generate additional information or facets. The result of the synchronization step is a geometric model-ontology map that contains the corresponding models and atoms.
Fig. 4.
Application interface for linking models in the digital atlas with ontology.
Each geometric model is matched to a unique atom from the ontology. As mentioned in the previous paragraph, multiple matches are resolved to an unique one by the user. As there are 154 models in the SPL Brain atlas, each one of them will be matched to 154 unique atoms in the ontology. However, a search resulting from a user query will try to extract all the relevant geometric models for visualization. For example, although there is no specific matching model for the query Limbic lobe, the hierarchical search will extract all the geometric models that are part of the same query. Hence, even with a small set of geometric models, one can produce a large number of visualizations for a variety of queries. Similarly, a matching atom is usually associated with multiple terms in the ontology all of which will be recovered to reveal the facets or to guide hierarchical querying.
4.4 Additions to the FMA ontology and Relations used from the Ontology
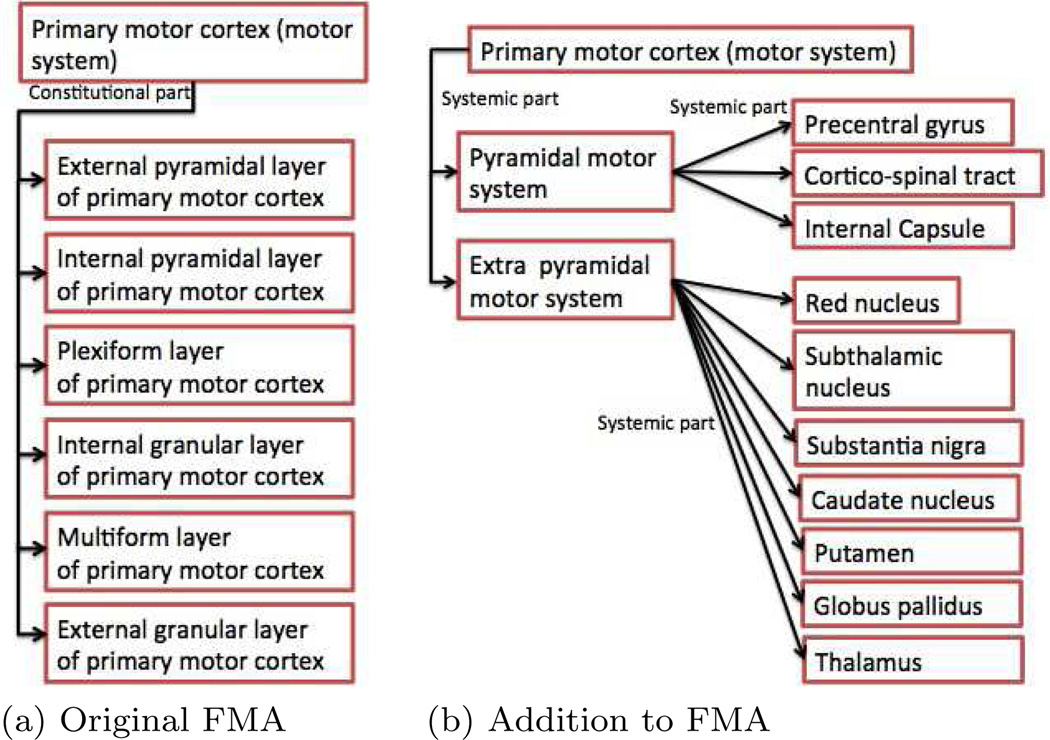
The FMA ontology represents the various anatomical parts and their relation to other anatomical parts using structural relations such as “is-a”, “part-of”, “systemic-part”, and “regional-part” predicates. Additionally, it also employs predicates such as “arterial-supply” and “venous-supply” that expresses the connections of anatomical parts. We augmented the FMA ontology to complete the functional organization of the different systems using “systemic-part” and “regional-part” predicates. Specifically, we added relations to complete the organizational hierarchy of the limbic system, the motor system, and the visual system. For example, the original version of the FMA ontology represents the motor system as shown in Fig. 5(a) that lacks all the individual neuroanatomic structures that constitute the motor system. We added relations to complete the organization of the motor system. Our addition to the ontology resulted in a representation of the motor system as shown in Fig. 5(b). We made similar additions to the limbic and visual system. We used an sqlite3 Database representation of the FMA ontology. Hence, any additions to the database could be done trivially using SQL constructs.
Fig. 5.
Organization of motor system shown in the original FMA and with our modification to the FMA.
The FMA ontology has a total of seventy nine different relations that connect various terms. In our work, we categorize these relations into structural hierarchical relations, spatial relations, input-output relations, and miscellaneous. The set of relations under each category is shown in the Table. 1. The structural hierarchical relations are used for recursive search on the ontology to extract the related geometric models while the remaining relation types are used to facilitate faceted search. In other words, an input-output relation such as sends output to can be used as a facet to qualify a user query (ex. amygdala). We allow all the relations found as a result of a search to be used for querying.
Table 1.
List of relations from FMA used in the faceted visualizer.
| Relation Type | Relations | Type of queries |
|---|---|---|
| Structutal Hierarchical Relations |
regional_part (of), constitutional_part (of) systemic_part(of), member (of), subclass (of), patt (of), develops from |
Used for recursive search |
| Spatial Relations | bounded_by, bounds, contained in, contains, surrounds, surrounded_by, has_buundary, efferent_to, afferent_to, continuous_with, continues_with_distally, continues_with_proximally, articulates_with, adjacent_to segmental_composition (of) |
Used as facets for specialized queries |
| Input-Output relations |
segmental_supply (of), secondary_segmental_supply (of), receives_attachment attaches_to, sends_output_to, luput_from_receives_input_from nerve_supply (of), venous_drainage (of), arterial_supply (of) tributary (of), lymphatic_drainage (of) branch(of), primary_segmental supply (of), |
Used as facets for specialized queries |
| Miscellaneous | gives_rise_to, type, origin (of), germ_origin, muscle_origin (of), fascicular_architecture, polarity, physical_State, State_of_determination, homonym_of, synonym, definition, comment, non_english_equivalent, FMAID, RadLexId, inherent_3D_shape, cell_appendage_type, has_mass, adheres_to, dimension, Talariach, Talariach_ID |
Used as facets for Specialized queries |
4.5 Faceted Search-Based User Query Visualization
This step is triggered every time a user types in a query. Given a user query, all the relevant displayable models are extracted using a hierarchical search on the ontology1. Using recursion, the hierarchical search ensures that all the sub-parts of an anatomical structure that are organized as a taxonomy in the ontology are touched.
To support a wide variety of queries, we categorize queries as simple, compound, specialized, and complex. A simple query refers to an individual structure while a compound query refers to a group of structures (ex. diencephalon). However, for the purpose of the search, both the simple and compound queries are treated identically with the difference that a compound query will typically result in a hierarchical search. A specialized query is a refinement of a simple or compound query e.g.,amygdala;inputs. A complex query is composed of a combination of simple, compound or specialized queries. A complex query is indicated by a “+” inserted in between queries. An example of a complex query composed of simple and specialized sub-query is “caudate nucleus;sends output to + tumor”.
To extract the relevant terms for a given query, the query is first categorized as being a simple, complex or specialized query. Complex queries are split into multiple simple, compound or specialized sub-queries. A simple or compound query will result in a search that matches the “Subject” or “Object” parts of terms in the ontology. A specialized query will result in a search that matches the “Subject” and “Predicate” or “Object” and “Predicate” part of terms in the ontology by automatically splitting a query into its “Subject” and “Predicate” part. For each sub-query in a complex query, the relevant facets, textual information and displayable models are extracted and displayed. The textual information is displayed in a “comments” field while the facets are organized for each sub-query and displayed for refinement by the user. The user can select any number of facets to refine a given query. Each facet selection in turn generates a specialized query. Multiple facet selection will generate a complex query with individual specialized queries. The algorithm for the faceted search-based visualization is in the Appendix A.
The hierarchical search focuses on extracting the individual anatomic parts belonging to a specific queried structure (e.g.,diencephalon, motor system). Our work assumes that the relations that reveal the structural organization of the various parts are contained in a small subset of relations that we call the structural hierarchical relations. Hence, the recursive search is performed only on the terms connected to the query or sub-query of a recursion by those relations. This greatly reduces the computational complexity of the hierarchical search. Additionally, the algorithm eliminates loops in the search by keeping track of how each part item in the search list was obtained i.e.,whether a given part was obtained from a parent or through child. We refer to the “Subject” part of the relation as the parent and the “Object” part of the relation as child. For example, if a part “thalamus” was reached from its subject “diencephalon” through a “constitutional-part” relation, subsequent searches of “thalamus” will ignore terms that contain “xx-part-of” predicate.
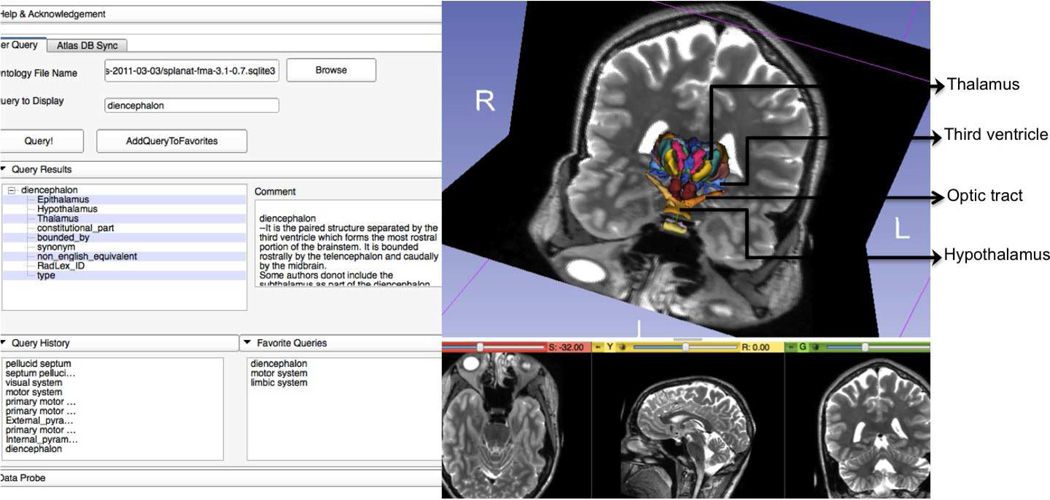
The hierarchical search stops on a given branch when no more structural hierarchical relations result from the search. Given the set of atoms, the corresponding model names are retrieved from the geometric model-ontology map. The search using the base query is used to extract all the relevant facets and text. An example result of a user query is shown in Fig. 6. As shown, the geometric models, relevant facets, and textual information are all displayed. A clear advantage of our hierarchical search based visualization is that the user search query always recovers the underlying hierarchical organization from the ontology regardless of whether the geometric atlas has a flat or hierarchical organization of the models corresponding to the different anatomical parts. Additionally, our approach helps to produce visualizations using very flexible search mechanism. For instance, the same visualization can be created from very different user queries. In other words, there is no restriction on what keywords a user must employ to produce a desired visualization as long as the keywords are entailed by the underlying ontology.
Fig. 6.
Interface for visualizing user queries showing facets, related textual results, geometric models overlaid on 3D image, and additional information such as favorite queries.
The visualization interface provides an option for the user to store queries in the favorite query list. The favorite query list stores all the geometric models that should be displayed for the same query thereby, enabling the algorithm to skip the computationally expensive hierarchical search when that query is reused. The algorithm only needs to perform the search with the base query to extract the facets and the related text. Finally, the algorithm stores the recently used queries and exposes the same queries through the application interface to enable the user to select from the recently used queries for visualization. Fig. 6 shows a snapshot of the interface. Also shown in Fig. 6 are the facets, related text, the favorites’ and the recent query list.
4.6 Computational Complexity of the Hierarchical Search
A typical query results in N different terms each of which can potentially be recursed to obtain N additional terms. Note that a simple query is a special case of a compound query which results in a query depth of utmost one. This results in a computation complexity of O(Nd) where d is the depth of the hierarchical search. However, we make the exponential complexity of the search more tractable by using only a small set of relations that signify a part or structural relation. Additionally, our algorithm keeps track of forward or backward traversals so that the search is performed only in one direction which in turn prevents looping. The afore-mentioned relational constraint and direction based search greatly reduces the depth and the number of branches produced for a given search and results in a significantly lower computational complexity than the worst case exponential complexity for the search.
4.7 Combining Patient Specific Models with the Digital Atlas for Patient Specific Visualizations
We obtain patient specific visualizations by combining patient specific geometric models with the 3D digital atlas and the ontology. First, one or more patient specific image volumes are aligned to the 3D atlas volume through registration. Any image registration algorithm can be used. In our work, we used the affine registration algorithm using mutual information by Mattes et al (2003) implementation available in the 3D Slicer Blezek and Miller (2010) followed by B-spline deformable image registration in 3D Slicer Miller and Lorenson (2008). Once the patient image volume is aligned with the atlas volume, the atlas labels and the various geometric models for the various parts can be directly transferred to the patient volume. Any patient specific segmentations such as tumors are computed on the registered patient volume. In our work, we used our implementation of the grow cut segmentation in 3D Slicer Veeraraghavan and Miller (2010) for obtaining 3D segmentation of various patient specific structures. Using the volumetric segmentation, 3D geometric models of the same structures were generated. As all segmentations and 3D volumes are generated on the resampled volumes, the patient specific models can be visualized along with additional anatomical structures from the 3D atlas.
The patient specific models are named using anatomically meaningful names so that their names can be matched to the various atoms in the ontology or queried by the user. Models for which no matching atoms are found in the ontology are stored in a separate list and tagged by their names so that upon a query, those models can be directly displayed instead of generating a hierarchical search on the ontology. For the patient specific geometric models, one can use problem specific facets in addition to any facets retrieved by searching from the ontology. Currently, the problem specific facets are hard-coded. In the future, we plan to modify this so that a user can enter the relevant facets upon initialization. In this work, we employ patient specific visualization to facilitate a treatment planning work flow for neuroanatomy. Hence, we use the following two facets for tumor geometric models: (a) adjacent structures, and (b) adjacent systems. A specialized search using adjacent structures will retrieve the neuroanatomical structures that are adjacent or intersecting a tumor and adjacent systems will retrieve the neuroanatomical systems (motor, limbic, visual etc) that are adjacent to the tumor.
4.8 Using Novel Atlases and Ontologies with the Faceted Visualizer
The faceted visualizer heavily relies on the visualization infrastructure provided by the 3DSlicer. Hence, for appropriate visualization, we require that the geometric models used in the digital atlases conform to the model constraints of the 3DSlicer. The first step in using a 3D digital atlas is to ensure that its models and the atlas are represented in the native format used by the 3D Slicer. More concretely, 3D Slicer represents its various objects, namely, the image volumes, geometric models, transforms, etc., using a utkMRMLNode structure that can store image volumes as utkMRMLScalar Volume N-ode, geometric models as either utkMRMLModelNode or utkMRMLModelHierarchyNode. This conversion can be done from the 3D segmented image volume containing the various structures from which 3D geometric models can be computed. 3D Slicer provides functionalities for automatically computing the geometric models. The remaining step is to ensure that the label names used to represent the various geometric models have meaningful anatomic names. This can be done by automatically associating the name from a colormap corresponding to each label color. For example, the Allen 3D human brain atlas Allen (2013) stores the names of the various anatomical structures along with their color in a comma separated values colormap file2. The current implementation of the faceted visualizer expects the digital atlas to be in the native 3D Slicer format. However, when an atlas with segmented structures is available as a 3D image volume along with a color map, it is possible to automatically convert them into the appropriate representation. We plan to address the issue of auto-reconfiguration of atlases in the future.
In this work, we used the SPL abdominal atlas with the faceted visualizer. Both the 3D abdominal and the SPL 3D Brain atlases are in the 3D Slicer format. The only difference between the two atlases was that whereas all the geometric models in the case of the SPL 3D Brain atlas were represented by a 3D Slicer data structure called utkMRMLModelHierarchyNode, the geometric models in the SPL 3D abdominal atlas were represented by a different structure, namely, utkMRMLMod-elNode. The faceted visualizer module searches for model nodes both the utkMRMLModelHierarchyNode and the utkMRMLModelNode that contain geometric models with descriptive names (by matching with the ontology). Hence no reconfiguration was necessary in terms of extensive programming effort to enable the faceted visualizer to work with new abdominal atlas.
The framework can also adapt to novel ontologies as the visualizer works by matching the model names with the various atoms in the ontology. As long as the names of atoms (i.e. subject or object portion of terms in the ontology) can be matched to the model names, a new ontology that expresses different meanings and functional relationships between the various anatomical parts can be used without significant modifications to the framework. However, as mentioned earlier, the framework relies on the structural hierarchical relations for recursion. When the meaning of these relations change or different relations express recursive organization in the new ontology, such changes will need to be expressed in the faceted visualizer. This however, is a trivial step that needs to be done only once per ontology.
5 Results
We evaluated our approach using the SPL 3D digital brain atlas by Talos et al (2009) with a modified FMA ontology developed by Rosse and Mejino-Jr. (2003). We tested the visualization of patient specific models together with the models in the geometric atlas by using the segmented geometric models computed from the SPL brain tumor dataset by Kaus et al (2007). We tested our approach using a variety of user queries ranging from simple ones for individual anatomical parts to complex queries composed of functional systems, specialized queries and patient specific models.
We also tested the joint visualization of the patient specific models together with the digital atlas by generating visualizations for a simple treatment planning scenario where one might want to visualize the various neuroanatomical structures and systems adjacent to a tumor. To facilitate such a visualization, we created two facets for the tumor structures, namely, adjacent structures and adjacent systems. Upon selecting the afore-mentioned facets, the visualizer tries to find all the relevant structures close to the tumor and displays them.
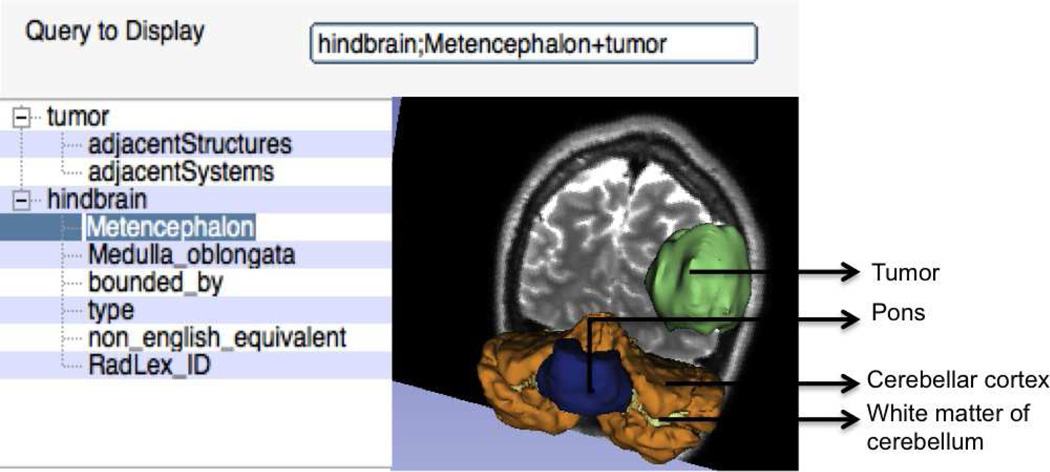
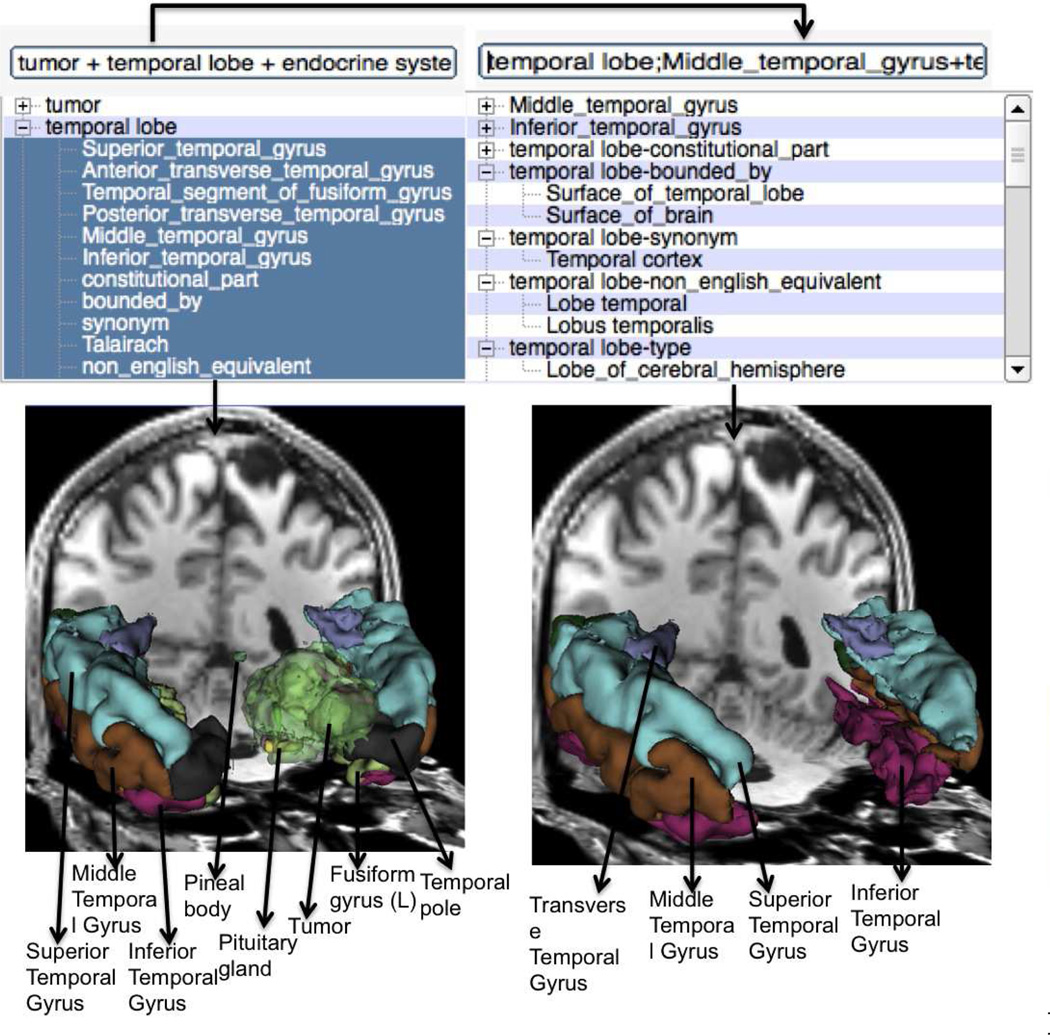
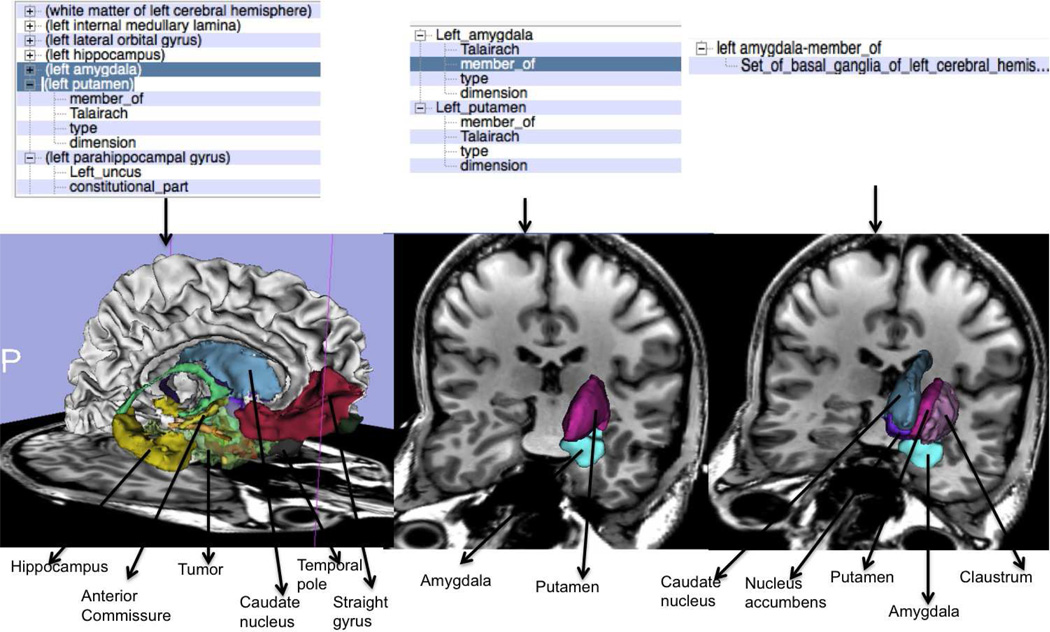
Fig. 7 shows an example visualization of a complex query composed of a simple and specialized queries, namely, tumor and metencephalon. The tumor and the metecephalon part of the hindbrain are overlaid on the T1-weighted MRI atlas image that was registered with T1-weighted MRI patient image. Fig. 8 shows an example visualization initially using three different sub-queries followed by a query that uses thirteen different facet based specializations on the query “temporal lobe”. In the shown results, the visualization of the “temporal part of fusiform gyrus” is missing as no equivalent atlas model was found for the same atom. The displayed image shows the tumor with higher transparency compared to the other structures for better visualization of the anatomical structures. We tested the faceted specialization based queries with more than seventy different sub-queries and obtained visualization results under a minute on a four core, 2GHz laptop, Intel i7 laptop. Fig. 9 shows the result of refining queries using the facets through multiple iterations. As shown, starting from a query that displays the neuroanatomical structures adjacent to a tumor, the user can iteratively refine these queries to extract a fact tuple amygdala; member of; Set of basal ganglia of left cerebral hemisphere and visualize the same query. In other words, the user can use the facet-based search to deduce fact tuples from the ontology even without knowing the definitions or the terms used in the ontology. Clearly the revealed facets and the deduced facts depend on the definitions of the different regions and anatomic structures in the ontology. However, by navigating through the facets, the user can deduce the facts as well as visualize the anatomical structures corresponding to the same facts. We also tested the scalability of the visualizer with respect to the number of sub-queries and facets that could be used for visualization. So far we did not find any limit in this number.
Fig. 7.
Visualization of complex query composed of a simple and specialized queries:”tumor+hindbrain;metencephalon”.
Fig. 8.
Using multiple sub-queries and facets for visualization.
Fig. 9.
Refining queries through multiple drill-down selections.
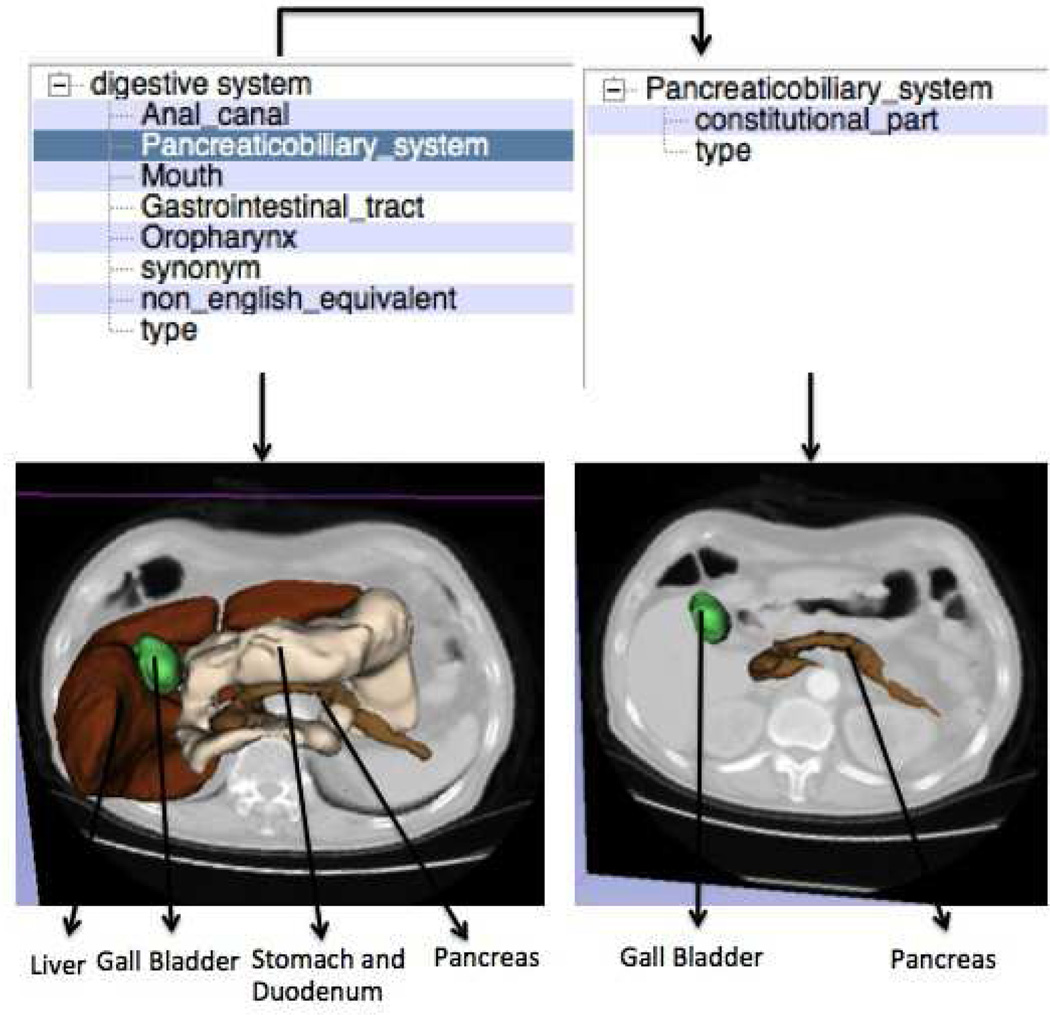
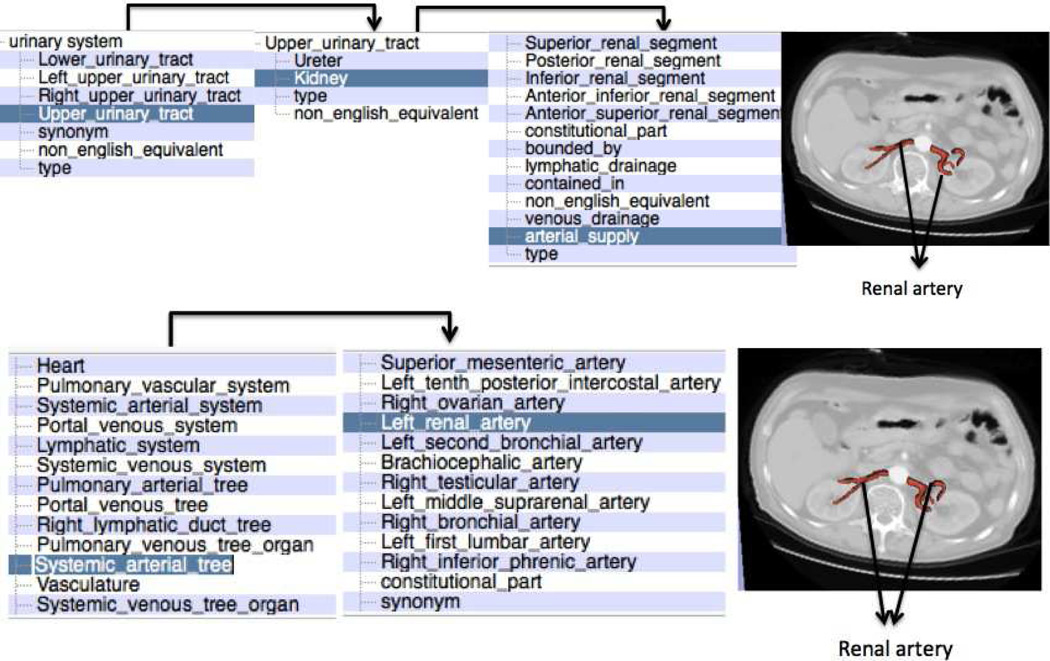
In addition to the neuroanatomy atlas, we tested the scalability of our approach to a novel atlas by testing the visualization using the SPL abdominal atlas by Talos et al (2008). The atlas was derived from a CT scan of a normal patient using semi-automatic image segmentation followed by three-dimensional model construction. The atlas consists of 54 models of various anatomical parts in the abdomen. The switch required very minimal modifications as mentioned in the previous subsection 4.8. Fig. 10 shows the result of visualizing the query “digestive system” followed by query refinement. One thing to note in this visualization is that the query “digestive system” is automatically translated into the corresponding controlled terminology “alimentary system” to produce the desired visualization.Fig. 11 shows how two completely different searches followed by query refinement can be used to obtain the same visualization of renal artery. The user can also deduce the different facts that produce the same visualizations by following the facet-based search.
Fig. 10.
Faceted search-based visualization on abdominal atlas. Visualization of colon and ileum are disabled to better view the other structures.
Fig. 11.
Using faceted search to produce the same visualization from different queries.
5.1 Discussion and Future Work
We tested our visualizer with a variety of queries on two different digital atlases and found that the visualizer supports a wide range of user queries ranging from simple to complex. There is no real limit on the number of sub-queries or facets that a user can use in a given search. The more the number of sub-queries the longer is the computational time required to produce the desired visualization. We tested with upto ten subqueries consisting of compound anatomical structures with several anatomical parts and found the visualizer to produce the desired visualization in under a minute on a four core, 2GHz Intel i7 laptop. Similarly, we have tested the visualizer with more than sixty facets which would result in seventy sub-queries and obtained a visualization within a minute.
A nice feature of the faceted visualization approach is that starting from a single query, the user can refine their search by navigating through the facets to deduce the individual fact tuples from the ontology as well as produce very flexible visualizations without having much knowledge about the exact terminology used in the ontology or a complete knowledge of the anatomical terms. Additionally, textual results displayed in the comments field can provide additional information when used in the context of learning. Furthermore, the ability to produce the same visualization through multiple searches highlights the flexibility of faceted search and the flexibility that a user can have in deducing different facts about a specific atom or anatomical part.
Our implementation of the faceted visualizer relies heavily on the infrastructure of the 3D Slicer and therefore imposes some format constraints on the digital atlases that can be used with the visualizer. Specifically, we currently require the digital atlases to be represented using data structures native to the 3D Slicer as discussed in the previous section 4. This is a format limitation of our work. In the future we plan to address this issue by automatically converting the 3D segmentations of the various structures in an atlas contained in a 3D image volume to the appropriate data structures in conjunction with a color map file that maps the various label colors used for the segmented structures to their appropriate anatomic names. Similarly, the faceted visualizer requires the ontology to be represented as a sqlite3 database which it accesses using SQL queries to search and produce a desired visualization for a user query.
Every time an ontology or the 3D digital atlas is loaded into the visualizer, it automatically tries to match the various anatomical geometric models with the terms in the ontology thereby doing synchronization in each session. While this may be construed as a limitation, this approach also enables the system to adapt to changes made to the ontology or the digital atlas. Resynchronization at each session allows our approach to adapt to ongoing changes in the ontology. Additionally, this resynchronization will potentially enable the faceted visualizer to work with a different ontology which may contain the same neuroanatomical terms but different relations that express their functions. However, once an ontology and the atlas are loaded in a faceted visualizer session, to load a different ontology or atlas, one needs to restart the session.
In this work, we employ the hierarchical search algorithm to extract all the relevant facets and displayable models for a given query. First, this algorithm can be computationally intensive owing to the recursive search. We address this problem to some extent by making use of specific structural relations that trigger a recursive search for the terms connected by those relations and using a favorite queries list that stores the displayable models for the queries in the same list. However, these relations are pre-specified and when using a different ontology that expresses different functionality for those terms using different relations, those relations will need to be “hard-coded” into the visualizer. This is a limitation of the current approach. In the future, we plan to address this limitation by using the querying capabilities of NCBO’s ontology search engines like the Neuroscience Information Framework which uses a NIF standard ontology (NIFSTD) Bug et al (2008). The NIF standard ontology uses OWL-RDF constructs to represent the various terms and concepts. The NIF also provides a search functionality that can be accessed through simple http queries using which one can retrieve results using generic relations like sub-classes, super-class, parts, and children. Furthermore, combining the search capability with tools like the NCBO’s Annotator Jonguet et al (2009) or the terminizer Terminizer (2009) will enable our faceted visualizer to support very generic queries as those queries can automatically be converted to standard terminology that can be used with the NIF search engine. In terms of modification, our approach will only replace the search engine with simple web queries.
Currently, our approach is limited to using one ontology with one digital atlas. It is conceivable that multiple digital atlases can store complementary/// information and it might be useful to combine the different atlases to produce a unified visualization. Combining multiple, complementary ontologies can help users to obtain more wholesome views of their queries and also help to expand the knowledge related to specific queries. We plan to address this issue in the future.
Finally, our faceted visualizer tool is available for free under a permissible open source BSD license for use by general public. It is available as an extension module in the opensource 3DSlicer software. Details of how to download the 3DSlicer software, the FMA ontology, and the digital atlases is provided in the following section.
6 Information Sharing Statement
Faceted visualizer is available for download as an extension module for 3D Slicer. It can be downloaded and installed using the Extension Manager tool that comes with every installation of 3D Slicer software. The documentation for the faceted visualizer is available from: http://www.slicer.org/slicerWiki/index.php//Documentation/4.1/Modules/FacetedVisualizer. The FMA ontology along with the our additions is available as a SQL database file for download from http://slicer.kitware.com/midas3/item/3094. The 3D Slicer software is a free, open source software package for visualization and medical image analysis. Its available for download from http://download.slicer.org/. 3D Slicer and the faceted visualizer is distributed under a permissive BSD-style open source license. The datasets, namely, the SPL 3D Brain atlas and the SPL 3D Abdominal atlas are available for free from: http://nac.spl.harvard.edu/pages/Downloads. Our software has been tested with the 2011 and the 2008 SPL-PNL version of the Multi-modality MRI-based atlas of the brain and the 2011 version of the CT atlas of the abdomen.
9 Conclusions
In this work, we presented a faceted search-based approach for visualizing neuroanatomy by combining an anatomy ontology with three dimensional digital atlas. Faceted visualization of anatomy can be used for visualizing patient specific anatomy with the general 3D anatomy for surgical planning, as an educational tool for learning anatomy or to evaluate the prognosis of a patient undergoing treatment. Our approach provides a simple querying interface and supports automatic synchronization of a three dimensional atlas with the ontology without requiring extensive design and explicit synchronization by the user. We showed results of visualization for queries ranging from simple ones consisting of individual parts or functional systems to complex ones consisting of combination of simple and specialized queries. We also demonstrated the scalability of our approach to a novel atlas by producing visualizations from an abdominal atlas combined with the same ontology.
7 Acknowledgments
This work was supported in part by the NIH NCRR NAC P41-RR13218 and is part of the National Alliance for Medical Image Computing (NAMIC) funded by the National Institutes of Health through the NIH Roadmap for Medical Research, Grant U54 EB005149. The authors also thank the reviewers whos’ comments and suggestions greatly helped to improve the manuscript.
A Algorithm for Faceted Search
Algorithm 1: Faceted Search-Based Query Visualization
| Data: User query q | |
|
Result: Facets F = {f1, …, fk}, relevant text T, Displayable models D = {d1, …, d)n} |
|
| 1 | Process query q into query set Q |
| 2 | for each query qj ∈ Q do |
| 3 | {Fj, Tj, Dj} → Process query qj using hierarchical search |
| 4 | F ← F ∪ Fj, T ← T ∪ Tj, D ← D ∪ Dj |
| 5 | end |
| 6 | if D ≠ ∅ then |
| 7 | Visualize models D |
| 8 | end |
| 9 | Display related text T, and Facets F |
| 10 | if User selects items t from facet list F then |
| 11 | for each item ti ∈ t do |
| 12 | if ti is predicate then |
| 13 | Make ti as specialized query of q : qti ← q; ti and add to new query nq ← nq ∪ qti |
| 14 | else |
| 15 | Make ti as simple query and add to new query set, nq ← nq ∪ ti |
| 16 | end |
| 17 | end |
| 18 | Set q ← nq |
| 19 | Go to 1 |
| 20 | end |
Footnotes
In this work, we use displayable and geometric models interchangeably.
The gene expression data is however stored in an online server and it is not clear to the authors how this information can be obtained in a machine readable file for integrating with the faceted visualizer. Our discussion is therefore limited to the anatomical structures alone.
8 Conflict of Interest
The authors declare that they have no conflict of interest.
Contributor Information
Harini Veeraraghavan, Memorial Sloan-Kettering Cancer Center, USA veerarah@mskcc.org.
James V. Miller, GE Global Research, USA millerjv@ge.com
References
- Schroeder W, Martin K, Lorenson B. Visualization ToolKit. Fourth edition. Kitware Inc; 2006. [Google Scholar]
- Bug WJ, Ascoli GA, Grethe JS, Gupta A, Fennema-Notestine C, Laird AR, Larson SD, Rubin D, Sheperd GM, Turner JA, Martone ME. The NIFSTD and BIRNLex vocabularies: Building comprehensive ontologies for neuroscience. Neuroinformatics. 2008;6(3):175–94. doi: 10.1007/s12021-008-9032-z. [DOI] [PMC free article] [PubMed] [Google Scholar]
- Jonquet C, Shah NH, Musen MA. The open biomedical annotator. Summit on Translat Bioinformatics; 2009. pp. 56–60. [PMC free article] [PubMed] [Google Scholar]
- Terminizer. Terminizer. 2009 http://terminizer.org/
- 3DSlicer. 3D Slicer. 2012 http://www.slicer.org/
- Allen Human Brain Atlas. http://www.brain-map.org/
- Blezek D, Miller JV. Fast affine registration. 2010 http://www.slicer.org/slicerWiki/index.php/Modules:AffineRegistration-Documentation-3.6.
- Miller JV, Lorenson B. Deformable B spline registration. 2008 http://www.slicer.org/slicerWiki/index.php/Slicer3:Module:Deformable_BSpline_registration.
- Curtell E, Robbins D, Dumais S, Sarin R. Fast, flexible filtering with Phlat; Proceedings of CHI; 2006. pp. 261–270. [Google Scholar]
- Estevez M, Lindgren K, Bergethon P. A novel three-dimensional tool for teaching human neuroanatomy. Anatomy Science Education. 2010;3(6):309–317. doi: 10.1002/ase.186. [DOI] [PMC free article] [PubMed] [Google Scholar]
- Fedorov A, Beichel R, Kalpathy-Cramer J, Finet J, Fillion-Robin J, Pujol S, Bauer C, Jennings D, Fennessy F, Sonka M, Buatti J, Aylward S, Miller J, Pieper S, Kikinis R. 3D Slicer as an image computing platform for the quantitative imaging network. Magn Reson Imaging. 2012;30(9):1323–1341. doi: 10.1016/j.mri.2012.05.001. [DOI] [PMC free article] [PubMed] [Google Scholar]
- Golland P, Kikinis R, Halle M, Umans C, Grimson W, Shenton M, Richolt J. AnatomyBrowser: A novel approach to visualization and integration of medical information. Computer Aided Surgery. 1999;4(3):129–143. doi: 10.1002/(SICI)1097-0150(1999)4:3<129::AID-IGS2>3.0.CO;2-I. [DOI] [PubMed] [Google Scholar]
- Hearst M, Soica E. NLP support for faceted navigation in scholarly collections; Proceedings of 2009 Workshop on Text and Citation Analysis for Scholarly Digital Libraries; 2009. pp. 62–70. [Google Scholar]
- Ho’nhe APK, Pflesser B, Richter E, Reimer M, Scheimann T, Schubert R, Schumacher U, Tiede U. Creating a high-resolution spatial/symbolic model of the inner organs based on the Visbile Human. Medical Image Analysis. 2001;5(3):221–228. doi: 10.1016/s1361-8415(01)00044-5. [DOI] [PubMed] [Google Scholar]
- Hon̈he K, Pflesser B, Riemer M, Schiemann T, Schubert R, Tiede U. A new representation of knowledge concerning human anatomy and function. Nature Medicine. 1995;1(6):506–5011. doi: 10.1038/nm0695-506. [DOI] [PubMed] [Google Scholar]
- Jinx. Jinx. 2012 http://www.bioontology.org/Jinx.
- Jonguet C, Shah N, Musen MA. The open biomedical annotator. AMIA Summit on Translational Bioinformatics; 2009. pp. 56–60. [PMC free article] [PubMed] [Google Scholar]
- Kaus M, Warfield S, Nabavi A, Black P, Jolesz J, Kikinis R. Automated segmentation of brain tumors. 2007 doi: 10.1148/radiology.218.2.r01fe44586. [DOI] [PubMed] [Google Scholar]
- Keator D, Grethe J, Marcus D, Ozyurt B, Gadde S, Murphy S, Pieper S, Greve D, Notestine R, Bockholt H, Papadopoulos P. A national human neuroimaging collaboratory enabled by the biomedical informatics research network. IEEE Trans Inf Technol Biomed. 2008;12(2):162–172. doi: 10.1109/TITB.2008.917893. [DOI] [PMC free article] [PubMed] [Google Scholar]
- Kikinis R. A digital brain atlas for surgical planning, model-driven segmentation, and teaching. IEEE Trans on Visualization and Computer Graphics. 1996;2(3):232–241. [Google Scholar]
- Koren J, Zhang Y, Liu X. Personalized interactive faceted search. Proc. of International Conference on World Wide Web.2008. [Google Scholar]
- Kub A, Prohaska S, Meyer B, Rybak J, Hege HC. Ontology-based visualization of hierarchical neuroanatomical structures. Eurographics Workshop on Visual Computing for Biomedicine; 2008. [Google Scholar]
- Mattes D, Haynor D, Vesselle H, Eubank W. PET-CT image registration in the chest using free-form deformations. IEEE Transactions on Medical Imaging. 2003;22(1):120–128. doi: 10.1109/TMI.2003.809072. [DOI] [PubMed] [Google Scholar]
- Moore E, Poliakov A, Lincoln P, Brinkley J. MindSeer: a portable and extensible tool for visualization of structural and functional neuroimaging data. BMC Bioinformatics. 2007 doi: 10.1186/1471-2105-8-389. [DOI] [PMC free article] [PubMed] [Google Scholar]
- NCBO. National Center for Biomedical Ontologies. 2012 http://www.bioontology.org/technology.
- Petersson H, Sinkvist D, Wang C, Smedby O. Web-based interactive 3D visualization as a tool for improved anatomy learning. Anatomy Science Education. 2009;2:61–68. doi: 10.1002/ase.76. [DOI] [PubMed] [Google Scholar]
- Pieper S, Brown G, Kennedy D, Martone M, Boline J, Ozyurt B, Plesniak W, Halle M, Tang A, Talos F. Query atlas. 2008 http://www.slicer.org/slicerWiki/index.php/Slicer3:Module:QueryAtlas.
- Pohl K, Bouix S, Nakamura M, Rohfling T, McCarley R, Kikinis R, Grimson W, Shenton M, Wells WA. A hierarchical algorithm for MR brain image parcellation. IEEE Transactions on Medical Imaging. 2007;26(9):1201–1212. doi: 10.1109/TMI.2007.901433. [DOI] [PMC free article] [PubMed] [Google Scholar]
- Ranabahu A, Parikh P, Panahiazar M, Sheth A, Logan-Klumpler F. Kino: A generic document management system for biologists using SA-REST and faceted search; IEEE Intl. Conference on Semantic Computing.2011. [Google Scholar]
- Rosse C, Mejino-Jr J. A reference ontology for biomedical informatics: the Foundational Model of Anatomy. Journal of Biomedical Informatics. 2003;36:478–500. doi: 10.1016/j.jbi.2003.11.007. [DOI] [PubMed] [Google Scholar]
- Rubin D, Bashir Y, Grossman D, Dev P, Musen M. Linking ontologies with three-dimensional models of anatomy to predict the effects of penetrating injuries; Proc. International Conference of the IEEE EMBS; 2004. pp. 3128–3131. [DOI] [PubMed] [Google Scholar]
- Rubin D, Talos IF, Halle M, Musen M, Kikinis R. Computational neuroanatomy: ontology-based representation of neural components and connectivity. BMC Bioinformatics. 2009;10(S-2) doi: 10.1186/1471-2105-10-S2-S3. [DOI] [PMC free article] [PubMed] [Google Scholar]
- Talos IF, Jakab M, Kikinis R. SPL abdominal atlas. 2008 http://www.spl.harvard.edu/publications/item/view/1266.
- Talos IF, Wald L, Halle M, Kikinis R. Multimodal SPL brain atlas data. 2009 http://www.spl.harvard.edu/publications/item/view/1565.
- Teevan J, Dumais S, Gutt Z. Challenges for supporting faceted search in large, heterogeneous corpora like the web. Second Workshop on Human-Computer Interaction and Information Retrieval; 2008. [Google Scholar]
- Turner J, Mejino J, Brinkley J, Detwiler L, Lee H, Martone M, Rubin DL. Application of neuroanatomical ontologies for neuroimaging data annotation. Frontiers in Neuroinformatics. 2010;4(10) doi: 10.3389/fninf.2010.00010. [DOI] [PMC free article] [PubMed] [Google Scholar]
- Veeraraghavan H, Miller JV. Grow Cut segmentation. 2010 http://www.slicer.org/slicerWiki/index.php/Modules:GrowCutSegmentation-Documentation-3.6.
- Veeraraghavan H, Miller J, Halle M. Facetedvisualizer. 2012 http://www.slicer.org/slicerWiki/index.php/Documentation/4.1/Modules/FacetedVisualizer.
- Vezhnevets V, Konouchine V. GrowCut – Interactive multi-label N-D image segmentation; Proc. Graphicon; 2005. pp. 150–156. [Google Scholar]


