

Abstract
The main functions of the kidney are to excrete of metabolic waste products and actively reabsorb essential molecules such as amino acids, ions, glucose and water. In humans, a wide range of genetic disorders exists, which are characterized by the wasting of metabolically important compounds. At the cellular level, more than 20 highly specialized renal epithelial cell types located in different segments of the nephron contribute to the reabsorption process. In particular, the cells of the proximal tubules play a crucial role and are uniquely adapted to maximize reabsorption efficiency. The proximal tubular cells accommodate high numbers of transporters and channels by increasing the apical surface area in contact with the primary filtrate by the formation of a brush border, hypertrophy and hyperplasia. This adaptation is evolutionarily conserved and is detected in the primitive pronephric kidney of fish and amphibians as well as the metanephric kidney of higher vertebrates. Surprisingly, the signaling pathways regulating these three processes have remained largely unknown. Here we summarize recent studies that highlight the early phases of kidney development as a critical juncture in establishing proximal tubular size.
Keywords: Fanconi Syndrome, Insulin/Igf Signaling, Lipid Rafts, Metanephros, Pronephros, mTORC1, Xenopus
INTRODUCTION
The kidney is the primary organ involved in filtering metabolic waste products from the blood and excreting them (Figure 1). The most obvious solution towards waste secretion would be a mechanism that actively transports all the unwanted compounds into the urine. While theoretically possible, this would require ab initio knowledge of any molecule that needs to be eliminated from the body. Since this is rather unfeasible, the kidney has adapted an alternative mechanism. The primary filtrate is produced by passive diffusion across the glomerular basement membrane (GBM) and the glomerular slit diaphragm. This size and charge barrier allows the passage of any molecule with a Stokes diameter slightly smaller than a single albumin protein [1]. Subsequently, all the compounds that need to be retained (i.e. amino acids, ions, glucose and water) are actively recovered during their passage through the nephron, the functional unit of the kidney. In a healthy individual, everything that enters the bladder is either toxic or of no physiological value.
Figure 1. The Organization of a Metanephric Kidney.

Cross-section of a metanephros (A) with increasing levels of magnification depicting the localization of an individual nephron within the kidney (B), its overall organization into different segments (C) and a cut open view of a proximal tubule (D). Black arrow illustrates the flow of the primary urine. Inset (E) shows the brush border of an individual proximal tubular cell containing multiple transporters and channels present in the individual microvilli. Arrows indicate the active reabsorption process occurring between the primary filtrate and the cell.
Such a mechanism requires that the nephron is highly efficient in its reabsorption dynamics. This is achieved by two means, the adjustment of the flow rate through the nephron and the maximization of the uptake dynamics (Figure 1). The flow rate in the nephron is determined by the blood pressure, which in turn directly regulates the glomerular filtration rate (GFR). To maintain a constant GFR the blood pressure is adjusted by a feedback mechanism between the vasculature in the glomerulus and the macula densa cells present in the distal convoluted tubule. This juxtaglomerular apparatus senses the reabsorption efficiency and secretes renin to lower the intrarenal blood pressure [2].
The second way to maximize nephron function is increasing the uptake efficiency. This is directly dependent on the number of channels and transporters present on the cell surface of the renal epithelial cells. In particular, proximal tubules, which reabsorb the majority of the biomolecules, electrolytes and water, have increased the surface area exposed to the primary filtrate to accommodate a very large number of channels and transporters. This is achieved in three cellular mechanisms, hypertrophy, hyperplasia and the formation of an apical brush border (Figure 2). Interestingly, there is very little known how these three processes are regulated at the cellular level. Below, we will review the current understanding of the topic. Due to space constraints we will focus on data from humans and mice. In addition, we discuss data from the amphibian pronephros as an established model system for nephron development and how it can assist in revealing the underlying molecular mechanisms.
Figure 2. Cellular Adjustments of Proximal Tubules.
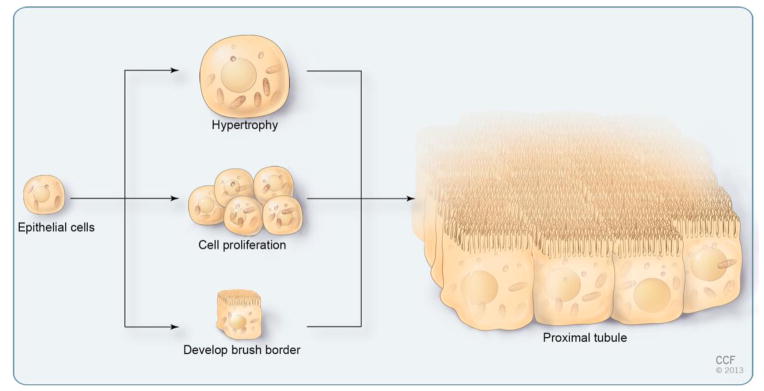
Schematic of a proximal tubular cell undergoing hypertrophy, hyperplasia (cell proliferation) and brush border development. Note that the three cellular adaptations synergize to greatly increase the apical surface area in contact with the primary urine.
The Apical Brush Border
The formation of microvilli, finger-like cytoplasmic protrusions, is a common adaptation to disproportionally increase the apical surface area of a cell. Microvilli are characterized by a core of actin bundles that are linked to the apical domain by a horizontal array of actin filaments called the terminal web. While present in a wide range of cell types, they are particularly abundant in the resorptive epithelia of the intestine and the proximal tubules of the kidney forming a so-called brush border. Patients lacking microvilli (Diarrhea 2 with Microvillus Atrophy, MVID, OMIM#251850) demonstrate that the enrichment of enzymes and transporters in microvilli is vital. These patients are unable to reabsorb nutrients from ingested food and require total parenteral nutrition throughout life [3, 4]. At the molecular level, this disease is caused by mutations in MYO5B, a myosin motor protein that is involved in the trafficking of apical and basolateral proteins [5].
In respect to the brush border of the kidney even less is known. It is generally accepted that the overall transport mechanisms are similar to the one of the intestine [6], yet there are no animal models lacking proximal tubular brush borders. In fact, the MVID mouse model lacking the Myo5B interactor Rab8 has intestinal microvillus atrophy, but rather normal proximal tubules [7]. The main indication for their importance in reabsorption originates from the description of Fanconi Renotubular Syndrome 1 (FRTS1, OMIM #134600), which is characterized by decreased solute and water reabsorption in the proximal tubule of the kidney [8]. In fact, one case report demonstrates widespread absence of brush-borders in the proximal tubules [9]. Unfortunately, the causative mutation for FRTS1 has not yet been identified and it is still unclear, whether the disease is caused by the absence of the proximal tubular brush border or is due to some other underlying condition. Thus, to really address the contribution of the brush border in reabsorption, it will be necessary to specifically ablate the proximal tubular brush border in mice and assess its consequences on kidney function. Moreover, it is noteworthy, that in contrast to hyperplasia and hypertrophy (see below), exaggerated brush border formation does not seem to be a compensatory mechanism for nephron loss.
Hypertrophy
An alternative mechanism to expand the apical surface area of renal epithelial cells is hypertrophy. It is caused by an increase in protein and RNA levels in the absence of DNA replication [10, 11]. The main support for the role of hypertrophy in the kidney is provided from studies on compensatory renal growth due to a reduction in kidney mass. Hypertrophy serves as a biological adjustment to cope with the extra workload and retain the kidney’s function. The remnant kidney increases its mass by virtue of hypertrophy even in the absence of proliferation [10, 12–15]. Hypertrophy can be a result of genetic disorders (e.g. Papillorenal Syndrome [OMIM #120330], a disease caused by a heterozygous mutation in Pax2 resulting in renal hypoplasia) or as a consequence of injury e.g. unilateral nephrectomy or ischemia. At the molecular level, renal epithelial cells undergo cyclin-dependent kinase inhibitor p21-dependent cell cycle arrest at the G1 phase [16, 17]. Concurrently, they increase their protein content, which - at least in part - is controlled by the mTORC1 signaling pathway [18, 19]. This process is reversible and transplantation of an additional kidney converts the hypertrophic kidney back to its normal size and functional state [14]. Interestingly, the actual trigger that senses this increased workload and initiates hypertrophy is still unknown. While several endocrine mediators (e.g. IGF1, VEGF and EGF) are proposed, none has been conclusively linked to compensatory renal growth [20].
Hypertrophy has also been suggested to play an instrumental role in the development of glomeruli and the proximal tubules [11, 21, 22]. Yet, an in depth analysis of this process and its underlying mechanism is still lacking. The process has to be different from compensatory renal growth, since renal epithelial cells in normal kidneys are arrested in the G0 phase of the cell cycle and not in G1 as in the case of injury [23].
Hyperplasia
The third option to maximize the surface area in contact with the primary filtrate is to increase the number of cells present in a nephron (Figure 2). In fact, proliferation plays a very important role in early kidney development. It is the basis of the dramatic increase in its overall size as waves of nephrons are formed and undergo expansion and terminal differentiation [24–26]. De novo nephrogenesis ceases due to the depletion of the nephron precursor cells present in the metanephric cap mesenchyme (around birth in mice and at 36 weeks of gestation in humans) [27–29]. Proliferation in the kidney, however, continues until all the nephrons have attained their final size and organogenesis has been completed [30]. This occurs in the mouse around postnatal day P12-P14, when the number of proliferating, Ki67-positive cells dramatically decreases [23]. An adult kidney is normally devoid of any proliferating cells unless it is injured. In this case, cells re-enter the cell cycle and replenish the lost cells to regain tubular integrity [31, 32]. While it seems most logical that nephron function is suspended or slowed down until the repair process is completed. This, as well as the molecular triggers of the repair process, are still open questions. One particular feature is the inherent growth capacity of renal epithelial cells and not a recruitment of stem cells [31]. Interestingly, this growth is tightly controlled. As soon as the injury has been repaired, cells exit the cell cycle and become dormant once again. This tight regulation is of utmost importance, since uncurbed proliferation can cause diseases such as Renal Cell Carcinoma, Polycystic Kidney Disease or Tuberous Sclerosis [33–35].
Interestingly, with the exception of the loop of Henle, limited information is available for the spatio-temporal distribution of proliferating cells in vivo [36, 37]. This is to a large extent due to technical difficulties visualizing and staging entire nephrons. In the absence of 3-dimensional (3D) nephron reconstruction, it is very challenging to determine whether proliferation is confined to specific growth domains or is stochastic. Similarly, it is nearly impossible to determine the age of a single developing nephron as nephron development in the metanephric kidney is not synchronous, but continuous - with new nephrons arising in the very cortical region and more mature nephrons residing more internally.
One alternative, to study the contribution of proliferation in nephron development is the more primitive pronephric kidney of Xenopus or zebrafish. This kidney form consists of a pair of bilateral nephrons that develop synchronously and are readily accessible for imaging [38–42]. Using the Xenopus model, we can demonstrate that proximal tubules must undergo a burst of proliferation to attain their final size (D.R and O.W., manuscript submitted). This process is regulated by mTORC1 signaling, a classical, evolutionarily conserved size control pathway [43–45]. In fact, interfering with several steps activating mTORC1 signaling, the presence of Insulin/Igf ligands, their trafficking and secretion via the endosomal compartment as well as the clustering of activated Insulin receptors in lipid rafts all results in very stunted pronephric proximal tubules (manuscripts submitted and [46]). Since the pronephric kidney and the individual nephrons of the metanephros are regulated in an evolutionarily conserved fashion [39, 47, 48], it is very likely that the same process holds true for the kidney of higher vertebrates. Moreover, this is not limited to Xenopus. A recent report in zebrafish also indicates proliferation in a proximal domain adjacent to the glomerulus in addition to growth in the pronephric duct and distal tubule [41].
Coordination of Brush Border Development, Hypertrophy and Hyperplasia
As outlined above consistent nephron physiology greatly depends on maximizing the luminal surface by brush border development, hypertrophy and hyperplasia (Figure 2). These three adjustments occur sequentially during the early phases of nephrogenesis and synergize to optimize reabsorption. They, however, need to be established in a particular order. Brush border formation only happens in post-mitotic cells, as it requires a highly specialized apical domain that is exclusively present in terminally differentiated cells. Similarly, hypertrophy normally occurs in cell cycle arrested cells, since cytokinesis obviously counteracts the increase in cell size. The one noteworthy exception is acute kidney injury, where hypertrophy is used as a transient mode to maintain nephron integrity even in the presence of dying proximal tubular cells [15]. Finally, the relationship between brush border development and hypertrophy is unresolved. It could be interconnected, since both processes are dependent on an increase in lipid metabolism. Yet there are no data available that address such interconnectivity. Thus, the most likely scenario is that the proper nephron size is established first by proliferation followed by hypertrophy in combination with brush border formation.
The main outstanding question is to identity the signal(s) that trigger and coordinate all three processes. We believe that mTORC1 signaling is one of the crucial pathways. This is based on our unpublished data from the Xenopus pronephros, but is also supported by studies in mice. Mutants with a conditional removal of Tsc1, a key inhibitory component of the mTORC1 pathway, develop Polycystic Kidney Disease preceded by massive hyperplasia [49]. Other pathways, such as the Hippo signaling [50] or stiffness of the extracellular matrix [51], are likely to contribute. In fact, Hippo signaling is important for kidney development and disease [52–54], but has not yet been implicated in the size control mechanisms of the proximal tubules. We believe that the pronephric kidney will play an instrumental role in this characterization. All three processes, brush border development, hypertrophy and hyperplasia are found in the pronephric proximal tubules [38, 55]. Moreover, experimental manipulation of the pronephros is very efficient and versatile [39, 56] and will help to identify the underlying molecular mechanism(s). This will be very important for understanding the size control mechanisms during normal nephron development. In addition, it will have wider implications on other organ systems, which also exhibit a sophisticated tubular architecture.
Acknowledgments
We would like to thank Amanda Mendelsohn from the Cleveland Clinic Center for Medical Art and Photography for creating the illustrations. Reprinted with permission, Cleveland Clinic Center for Medical Art & Photography © 2013. All Rights Reserved. D.R. was supported by a postdoctoral fellowship from the DFG (RO4124/1–1). Work in the Wessely laboratory is supported by a grant from NIH/NIDDK (5R01DK080745-04) to O.W.
References
- 1.Karnovsky MJ, Ainsworth SK. The structural basis of glomerular filtration. Adv Nephrol Necker Hosp. 1972;2:35–60. [PubMed] [Google Scholar]
- 2.Hall JE. The renin-angiotensin system: renal actions and blood pressure regulation. Compr Ther. 1991;17:8–17. [PubMed] [Google Scholar]
- 3.Davidson GP, Cutz E, Hamilton JR, Gall DG. Familial enteropathy: a syndrome of protracted diarrhea from birth, failure to thrive, and hypoplastic villus atrophy. Gastroenterology. 1978;75:783–790. [PubMed] [Google Scholar]
- 4.Cutz E, Rhoads JM, Drumm B, Sherman PM, Durie PR, Forstner GG. Microvillus inclusion disease: an inherited defect of brush-border assembly and differentiation. N Engl J Med. 1989;320:646–651. doi: 10.1056/NEJM198903093201006. [DOI] [PubMed] [Google Scholar]
- 5.Muller T, Hess MW, Schiefermeier N, Pfaller K, Ebner HL, Heinz-Erian P, Ponstingl H, Partsch J, Rollinghoff B, Kohler H, Berger T, Lenhartz H, Schlenck B, Houwen RJ, Taylor CJ, Zoller H, Lechner S, Goulet O, Utermann G, Ruemmele FM, Huber LA, Janecke AR. MYO5B mutations cause microvillus inclusion disease and disrupt epithelial cell polarity. Nat Genet. 2008;40:1163–1165. doi: 10.1038/ng.225. [DOI] [PubMed] [Google Scholar]
- 6.Ullrich KJ, Fromter E, Murer H. Principles of epithelial transport in the kidney and intestines. Klin Wochenschr. 1979;57:977–991. doi: 10.1007/BF01479983. [DOI] [PubMed] [Google Scholar]
- 7.Sato T, Mushiake S, Kato Y, Sato K, Sato M, Takeda N, Ozono K, Miki K, Kubo Y, Tsuji A, Harada R, Harada A. The Rab8 GTPase regulates apical protein localization in intestinal cells. Nature. 2007;448:366–369. doi: 10.1038/nature05929. [DOI] [PubMed] [Google Scholar]
- 8.Lichter-Konecki U, Broman KW, Blau EB, Konecki DS. Genetic and physical mapping of the locus for autosomal dominant renal Fanconi syndrome, on chromosome 15q15.3. Am J Hum Genet. 2001;68:264–268. doi: 10.1086/316923. [DOI] [PMC free article] [PubMed] [Google Scholar]
- 9.Manz F, Waldherr R, Fritz HP, Lutz P, Nutzenadel W, Reitter B, Scharer K, Schmidt H, Trefz F. Idiopathic de Toni-Debre-Fanconi syndrome with absence of proximal tubular brush border. Clin Nephrol. 1984;22:149–157. [PubMed] [Google Scholar]
- 10.Fine LG, Norman J. Cellular events in renal hypertrophy. Annu Rev Physiol. 1989;51:19–32. doi: 10.1146/annurev.ph.51.030189.000315. [DOI] [PubMed] [Google Scholar]
- 11.Priestley GC, Malt RA. Development of the metanephric kidney. Protein and nucleic acid synthesis. J Cell Biol. 1968;37:703–715. doi: 10.1083/jcb.37.3.703. [DOI] [PMC free article] [PubMed] [Google Scholar]
- 12.Bell PD, Fitzgibbon W, Sas K, Stenbit AE, Amria M, Houston A, Reichert R, Gilley S, Siegal GP, Bissler J, Bilgen M, Chou PC, Guay-Woodford L, Yoder B, Haycraft CJ, Siroky B. Loss of primary cilia upregulates renal hypertrophic signaling and promotes cystogenesis. J Am Soc Nephrol. 2011;22:839–848. doi: 10.1681/ASN.2010050526. [DOI] [PMC free article] [PubMed] [Google Scholar]
- 13.Schwartz MM, Churchill M, Bidani A, Churchill PC. Reversible compensatory hypertrophy in rat kidneys: morphometric characterization. Kidney Int. 1993;43:610–614. doi: 10.1038/ki.1993.89. [DOI] [PubMed] [Google Scholar]
- 14.Churchill M, Churchill PC, Schwartz M, Bidani A, McDonald F. Reversible compensatory hypertrophy in transplanted brown Norway rat kidneys. Kidney Int. 1991;40:13–20. doi: 10.1038/ki.1991.173. [DOI] [PubMed] [Google Scholar]
- 15.Norman JT, Bohman RE, Fischmann G, Bowen JW, McDonough A, Slamon D, Fine LG. Patterns of mRNA expression during early cell growth differ in kidney epithelial cells destined to undergo compensatory hypertrophy versus regenerative hyperplasia. Proc Natl Acad Sci USA. 1988;85:6768–6772. doi: 10.1073/pnas.85.18.6768. [DOI] [PMC free article] [PubMed] [Google Scholar]
- 16.Liu B, Preisig PA. Compensatory renal hypertrophy is mediated by a cell cycle-dependent mechanism. Kidney Int. 2002;62:1650–1658. doi: 10.1046/j.1523-1755.2002.00620.x. [DOI] [PubMed] [Google Scholar]
- 17.Megyesi J, Price PM, Tamayo E, Safirstein RL. The lack of a functional p21(WAF1/CIP1) gene ameliorates progression to chronic renal failure. Proc Natl Acad Sci USA. 1999;96:10830–10835. doi: 10.1073/pnas.96.19.10830. [DOI] [PMC free article] [PubMed] [Google Scholar]
- 18.Chen JK, Chen J, Neilson EG, Harris RC. Role of mammalian target of rapamycin signaling in compensatory renal hypertrophy. J Am Soc Nephrol. 2005;16:1384–1391. doi: 10.1681/ASN.2004100894. [DOI] [PubMed] [Google Scholar]
- 19.Chen JK, Chen J, Thomas G, Kozma SC, Harris RC. S6 kinase 1 knockout inhibits uninephrectomy- or diabetes-induced renal hypertrophy. Am J Physiol Renal Physiol. 2009;297:F585–593. doi: 10.1152/ajprenal.00186.2009. [DOI] [PMC free article] [PubMed] [Google Scholar]
- 20.Cleper R. Mechanisms of compensatory renal growth. Pediatr Endocrinol Rev. 2012;10:152–163. [PubMed] [Google Scholar]
- 21.Davidson AJ. Uncharted waters: nephrogenesis and renal regeneration in fish and mammals. Pediatr Nephrol. 2011;26:1435–1443. doi: 10.1007/s00467-011-1795-z. [DOI] [PubMed] [Google Scholar]
- 22.Fetterman GH, Shuplock NA, Philipp FJ, Gregg HS. The Growth and Maturation of Human Glomeruli and Proximal Convolutions from Term to Adulthood: Studies by Microdissection. Pediatrics. 1965;35:601–619. [PubMed] [Google Scholar]
- 23.Piontek K, Menezes LF, Garcia-Gonzalez MA, Huso DL, Germino GG. A critical developmental switch defines the kinetics of kidney cyst formation after loss of Pkd1. Nat Med. 2007;13:1490–1495. doi: 10.1038/nm1675. [DOI] [PMC free article] [PubMed] [Google Scholar]
- 24.Goedbloed JF. The embryonic and postnatal growth of rat and mouse. I. The embryonic and early postnatal growth of the whole embryo. A model with exponential growth and sudden changes in growth rate. Acta Anat. 1972;82:305–306. [PubMed] [Google Scholar]
- 25.Chang M, Parker EA, Muller TJ, Haenen C, Mistry M, Finkielstain GP, Murphy-Ryan M, Barnes KM, Sundaram R, Baron J. Changes in cell-cycle kinetics responsible for limiting somatic growth in mice. Pediatr Res. 2008;64:240–245. doi: 10.1203/PDR.0b013e318180e47a. [DOI] [PMC free article] [PubMed] [Google Scholar]
- 26.Lui JC, Baron J. Mechanisms limiting body growth in mammals. Endocr Rev. 2011;32:422–440. doi: 10.1210/er.2011-0001. [DOI] [PMC free article] [PubMed] [Google Scholar]
- 27.Hinchliffe SA, Sargent PH, Howard CV, Chan YF, van Velzen D. Human intrauterine renal growth expressed in absolute number of glomeruli assessed by the disector method and Cavalieri principle. Lab Invest. 1991;64:777–784. [PubMed] [Google Scholar]
- 28.Rumballe BA, Georgas KM, Combes AN, Ju AL, Gilbert T, Little MH. Nephron formation adopts a novel spatial topology at cessation of nephrogenesis. Dev Biol. 2011;360:110–122. doi: 10.1016/j.ydbio.2011.09.011. [DOI] [PMC free article] [PubMed] [Google Scholar]
- 29.Hartman HA, Lai HL, Patterson LT. Cessation of renal morphogenesis in mice. Dev Biol. 2007;310:379–387. doi: 10.1016/j.ydbio.2007.08.021. [DOI] [PMC free article] [PubMed] [Google Scholar]
- 30.Goedbloed JF. Embryonic and postnatal growth of rat and mouse. IV. Prenatal growth of organs and tissues: age determination, and general growth pattern. Acta Anat. 1976;95:8–33. [PubMed] [Google Scholar]
- 31.Humphreys BD, Czerniak S, DiRocco DP, Hasnain W, Cheema R, Bonventre JV. Repair of injured proximal tubule does not involve specialized progenitors. Proc Natl Acad Sci USA. 2011;108:9226–9231. doi: 10.1073/pnas.1100629108. [DOI] [PMC free article] [PubMed] [Google Scholar]
- 32.Vogetseder A, Palan T, Bacic D, Kaissling B, Le Hir M. Proximal tubular epithelial cells are generated by division of differentiated cells in the healthy kidney. Am J Physiol Cell Physiol. 2007;292:C807–813. doi: 10.1152/ajpcell.00301.2006. [DOI] [PubMed] [Google Scholar]
- 33.Torres VE, Harris PC. Polycystic kidney disease: genes, proteins, animal models, disease mechanisms and therapeutic opportunities. J Intern Med. 2007;261:17–31. doi: 10.1111/j.1365-2796.2006.01743.x. [DOI] [PubMed] [Google Scholar]
- 34.Henske EP. Tuberous sclerosis and the kidney: from mesenchyme to epithelium, and beyond. Pediatr Nephrol. 2005;20:854–857. doi: 10.1007/s00467-004-1795-3. [DOI] [PubMed] [Google Scholar]
- 35.Jonasch E, Futreal PA, Davis IJ, Bailey ST, Kim WY, Brugarolas J, Giaccia AJ, Kurban G, Pause A, Frydman J, Zurita AJ, Rini BI, Sharma P, Atkins MB, Walker CL, Rathmell WK. State of the science: an update on renal cell carcinoma. Mol Cancer Res. 2012;10:859–880. doi: 10.1158/1541-7786.MCR-12-0117. [DOI] [PMC free article] [PubMed] [Google Scholar]
- 36.Adams DC, Oxburgh L. The long-term label retaining population of the renal papilla arises through divergent regional growth of the kidney. Am J Physiol Renal Physiol. 2009;297:F809–815. doi: 10.1152/ajprenal.90650.2008. [DOI] [PMC free article] [PubMed] [Google Scholar]
- 37.Nakai S, Sugitani Y, Sato H, Ito S, Miura Y, Ogawa M, Nishi M, Jishage K, Minowa O, Noda T. Crucial roles of Brn1 in distal tubule formation and function in mouse kidney. Development. 2003;130:4751–4759. doi: 10.1242/dev.00666. [DOI] [PubMed] [Google Scholar]
- 38.Romaker D, Zhang B, Wessely O. An immunofluorescence method to analyze the proliferation status of individual nephron segments in the Xenopus pronephric kidney. Methods Mol Biol. 2012;886:121–132. doi: 10.1007/978-1-61779-851-1_11. [DOI] [PMC free article] [PubMed] [Google Scholar]
- 39.Wessely O, Tran U. Xenopus pronephros development-past, present, and future. Pediatr Nephrol. 2011;26:1545–1551. doi: 10.1007/s00467-011-1881-2. [DOI] [PMC free article] [PubMed] [Google Scholar]
- 40.Lienkamp SS, Liu K, Karner CM, Carroll TJ, Ronneberger O, Wallingford JB, Walz G. Vertebrate kidney tubules elongate using a planar cell polarity-dependent, rosette-based mechanism of convergent extension. Nat Genet. 2012;44:1382–1387. doi: 10.1038/ng.2452. [DOI] [PMC free article] [PubMed] [Google Scholar]
- 41.Vasilyev A, Liu Y, Hellman N, Pathak N, Drummond IA. Mechanical stretch and PI3K signaling link cell migration and proliferation to coordinate epithelial tubule morphogenesis in the zebrafish pronephros. PloS one. 2012;7:e39992. doi: 10.1371/journal.pone.0039992. [DOI] [PMC free article] [PubMed] [Google Scholar]
- 42.Drummond IA. Kidney development and disease in the zebrafish. J Am Soc Nephrol. 2005;16:299–304. doi: 10.1681/ASN.2004090754. [DOI] [PubMed] [Google Scholar]
- 43.Taniguchi CM, Emanuelli B, Kahn CR. Critical nodes in signalling pathways: insights into insulin action. Nat Rev Mol Cell Biol. 2006;7:85–96. doi: 10.1038/nrm1837. [DOI] [PubMed] [Google Scholar]
- 44.Astrinidis A, Henske EP. Tuberous sclerosis complex: linking growth and energy signaling pathways with human disease. Oncogene. 2005;24:7475–7481. doi: 10.1038/sj.onc.1209090. [DOI] [PubMed] [Google Scholar]
- 45.Laplante M, Sabatini DM. mTOR signaling in growth control and disease. Cell. 2012;149:274–293. doi: 10.1016/j.cell.2012.03.017. [DOI] [PMC free article] [PubMed] [Google Scholar]
- 46.Zhang B, Romaker D, Ferrell N, Wessely O. Regulation of G-protein signaling via Gnas is required to regulate proximal tubular growth in the Xenopus pronephros. Dev Biol. 2013;376:31–42. doi: 10.1016/j.ydbio.2013.01.017. [DOI] [PMC free article] [PubMed] [Google Scholar]
- 47.Raciti D, Reggiani L, Geffers L, Jiang Q, Bacchion F, Subrizi AE, Clements D, Tindal C, Davidson DR, Kaissling B, Brandli AW. Organization of the pronephric kidney revealed by large-scale gene expression mapping. Genome Biol. 2008;9:R84. doi: 10.1186/gb-2008-9-5-r84. [DOI] [PMC free article] [PubMed] [Google Scholar]
- 48.Zhou X, Vize PD. Proximo-distal specialization of epithelial transport processes within the Xenopus pronephric kidney tubules. Dev Biol. 2004;271:322–338. doi: 10.1016/j.ydbio.2004.03.036. [DOI] [PubMed] [Google Scholar]
- 49.Zhou J, Brugarolas J, Parada LF. Loss of Tsc1, but not Pten, in renal tubular cells causes polycystic kidney disease by activating mTORC1. Hum Mol Genet. 2009;18:4428–4441. doi: 10.1093/hmg/ddp398. [DOI] [PubMed] [Google Scholar]
- 50.Tumaneng K, Russell RC, Guan KL. Organ size control by Hippo and TOR pathways. Curr Biol. 2012;22:R368–379. doi: 10.1016/j.cub.2012.03.003. [DOI] [PMC free article] [PubMed] [Google Scholar]
- 51.Schedin P, Keely PJ. Mammary gland ECM remodeling, stiffness, and mechanosignaling in normal development and tumor progression. Cold Spring Harb Perspect Biol. 2011;3:a003228. doi: 10.1101/cshperspect.a003228. [DOI] [PMC free article] [PubMed] [Google Scholar]
- 52.Reginensi A, Scott RP, Gregorieff A, Bagherie-Lachidan M, Chung C, Lim DS, Pawson T, Wrana J, McNeill H. Yap- and Cdc42-dependent nephrogenesis and morphogenesis during mouse kidney development. PLoS Genet. 2013;9:e1003380. doi: 10.1371/journal.pgen.1003380. [DOI] [PMC free article] [PubMed] [Google Scholar]
- 53.Makita R, Uchijima Y, Nishiyama K, Amano T, Chen Q, Takeuchi T, Mitani A, Nagase T, Yatomi Y, Aburatani H, Nakagawa O, Small EV, Cobo-Stark P, Igarashi P, Murakami M, Tominaga J, Sato T, Asano T, Kurihara Y, Kurihara H. Multiple renal cysts, urinary concentration defects, and pulmonary emphysematous changes in mice lacking TAZ. Am J Physiol Renal Physiol. 2008;294:F542–553. doi: 10.1152/ajprenal.00201.2007. [DOI] [PubMed] [Google Scholar]
- 54.Hossain Z, Ali SM, Ko HL, Xu J, Ng CP, Guo K, Qi Z, Ponniah S, Hong W, Hunziker W. Glomerulocystic kidney disease in mice with a targeted inactivation of Wwtr1. Proc Natl Acad Sci USA. 2007;104:1631–1636. doi: 10.1073/pnas.0605266104. [DOI] [PMC free article] [PubMed] [Google Scholar]
- 55.Mobjerg N, Larsen EH, Jespersen A. Morphology of the kidney in larvae of Bufo viridis (Amphibia, Anura, Bufonidae) J Morphol. 2000;245:177–195. doi: 10.1002/1097-4687(200009)245:3<177::AID-JMOR1>3.0.CO;2-F. [DOI] [PubMed] [Google Scholar]
- 56.Jones EA. Xenopus: a prince among models for pronephric kidney development. J Am Soc Nephrol. 2005;16:313–321. doi: 10.1681/ASN.2004070617. [DOI] [PubMed] [Google Scholar]