Abstract
A substudy of a phase I/II, prospective, multicenter clinical trial was carried out to investigate the potential benefit of therapeutic vaccination on hepatitis B e antigen-negative patients with chronic hepatitis B (CHB), treated efficiently with analogues. Patients were randomized in 2 arms, one receiving a hepatitis B virus (HBV) envelope DNA vaccine, and one without vaccination. At baseline, HBV-specific interferon (IFN)-γ–producing T cells were detected in both groups after in vitro expansion of peripheral blood mononuclear cells. Vaccine-specific responses remained stable in the vaccine group, whereas in the control group the percentage of patients with HBV-specific IFN-γ–producing T cells decreased over time. The vaccine-specific cytokine-producing T cells were mostly polyfunctional CD4+ T cells, and the proportion of triple cytokine-producer T cells was boosted after DNA injections. However, these T-cell responses did not impact on HBV reactivation after stopping analogue treatment. Importantly, before cessation of treatment serum hepatitis B surface antigen (HBsAg) titers were significantly associated with DNA or HBsAg clearance. Therapeutic vaccination in CHB patients with persistent suppression of HBV replication led to the persistence of T-cell responses, but further improvements should be searched for to control infection after treatment discontinuation.
Introduction
With more than 350 million of chronic hepatitis B virus (HBV) carriers worldwide, HBV infection remains an important health problem. The ultimate goal of HBV therapy is to obtain a complete viral suppression with long-term nondetection of serum HBV DNA and to cure the infection, i.e., to obtain clearance of serum hepatitis B surface antigen (HBsAg) and anti-HBs seroconversion. Antiviral drugs such as interferon (IFN)-α and nucleos(t)ide analogues (NUC) efficiently suppress viral replication and reduce liver-related mortality. However, treatment with IFN-α has limited positive effects and numerous major side effects.1 The persistence of covalently closed circular HBV DNA, the risk of viral resistance and the long-term duration of therapy are the main limits of NUC. An alternative approach to antiviral treatment is modulation of the immune response that is defective in patients with chronic infection.2 As the adaptive and innate immune responses are known to be involved in viral clearance during acute self-limiting HBV infection,3,4 therapeutic vaccination is a promising future strategy to control chronic viral infection. Since T-cell hyporesponsiveness is associated with high viral load, it has been suggested that reducing viral load before applying vaccine therapy could be a rational strategy to improve the immune response in HBV carriers.5 In a preliminary phase Ib trial in lamivudine resistant patients, we have previously shown encouraging results with 5 injections of a recombinant DNA vaccine encoding two out of the three HBV envelope proteins. A restoration of NK cell functions and HBV-specific T-cell responses was observed, although this was transient.6,7 Interestingly, an anti-HBe seroconversion occurred in the patients with the lowest viral load at the beginning of the trial, highlighting the importance of HBV DNA titers for successful immunotherapy. Analogues such as lamivudine and adefovir dipivoxyl have been shown to enhance T-cell responses concomitantly with a viral load decrease.8,9,10 Based on these observations, a phase I/II, open, prospective, multicenter trial clinical trial involving chronic HBV carriers with effective NUC treatments was designed (ClinicalTrials.gov NCT00536627). Patients were randomized to receive HBV envelope-expressing DNA injections or nothing and antiviral treatments were stopped in both groups 2 weeks after the last DNA injection. The primary endpoint of this trial was vaccine protection against the virological breakthrough that may occur during treatment with analogues and against reactivation after the end of analogue treatment. In this article, we report a substudy analyzing the efficacy of the DNA vaccine to induce an efficient immune response in HBeAg negative (−) patients that were successfully treated by antivirals. We showed that DNA vaccination allowed the maintenance of the number, the diversity and the functionality of envelope-specific T-cell responses and that HBsAg titers account for an important determinant of serological and virological responses. Nevertheless, the presence of an adaptive immune response was not able to prevent HBV reactivation in patients after NUC discontinuation.
Results
Ex vivo HBV-specific T-cell responses in patients
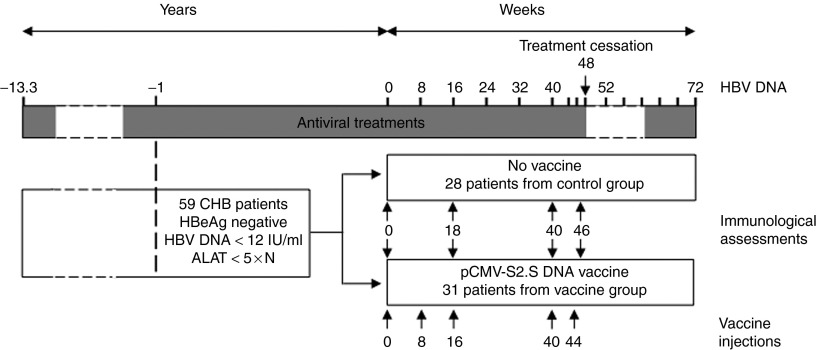
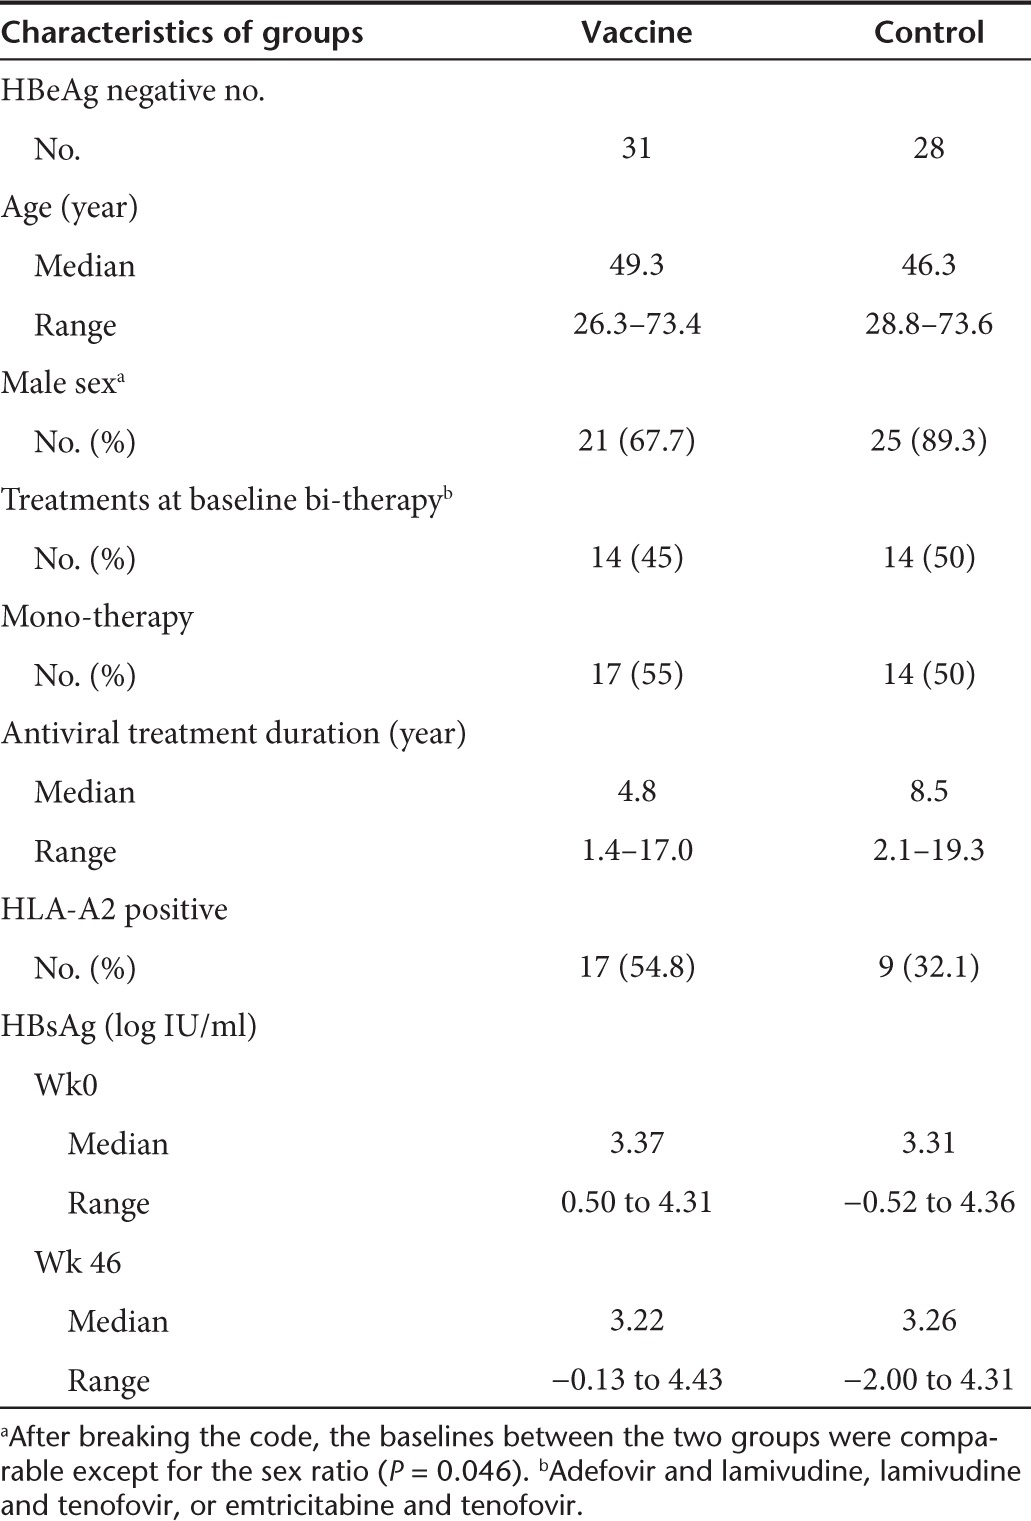
Seventy patients with viral load below 12 IU/ml were randomized to receive five injections of pCMV-S2S DNA (vaccine group) or nothing (control group) on week (W) 0 (baseline), W8, W16, W40, and W44. To avoid a potential impact of the HBeAg status on the immune response, only 31 patients from the vaccine group and 28 patients from the control group that were HBeAg negative were included in this substudy (Figure 1 and Table 1). Among them, 17 and 9 patients expressed the human leucocyte antigen (HLA)-A2 molecule in the vaccine and control groups, respectively (Table 1). The frequencies of circulating HBV-specific T cells were evaluated by tetramer staining (Supplementary Figure S1b). Positive envelope- (52.9% and 55.6%) and core- (47.1% and 55.6%) specific responses were detected at baseline in patients from the vaccine and control group, respectively. However, the frequencies of HBV-specific CD8 responses were rather low (median/range,<0.1%/0.01–0.28) and did not show a significant improvement in vaccinated patients over time (data not shown).
Figure 1.
Treatment and sampling schedule. Antiviral treatments were stopped at W48 for all chronic hepatitis B (CHB) HBeAg negative patients except for 7 and restarted when hepatitis B virus (HBV) DNA level was >120 IU/ml in sera and this was confirmed by a second test 2 weeks later. Some patients were re-treated after the first positive viremia without waiting for the results of retesting according to the physician's decision. Dotted lines represent fluctuating periods of time. Blood samples were collected at W0, W18, W40, and W46 for immunological assessments.
Table 1. Clinical characteristics of the patients included in the substudy.
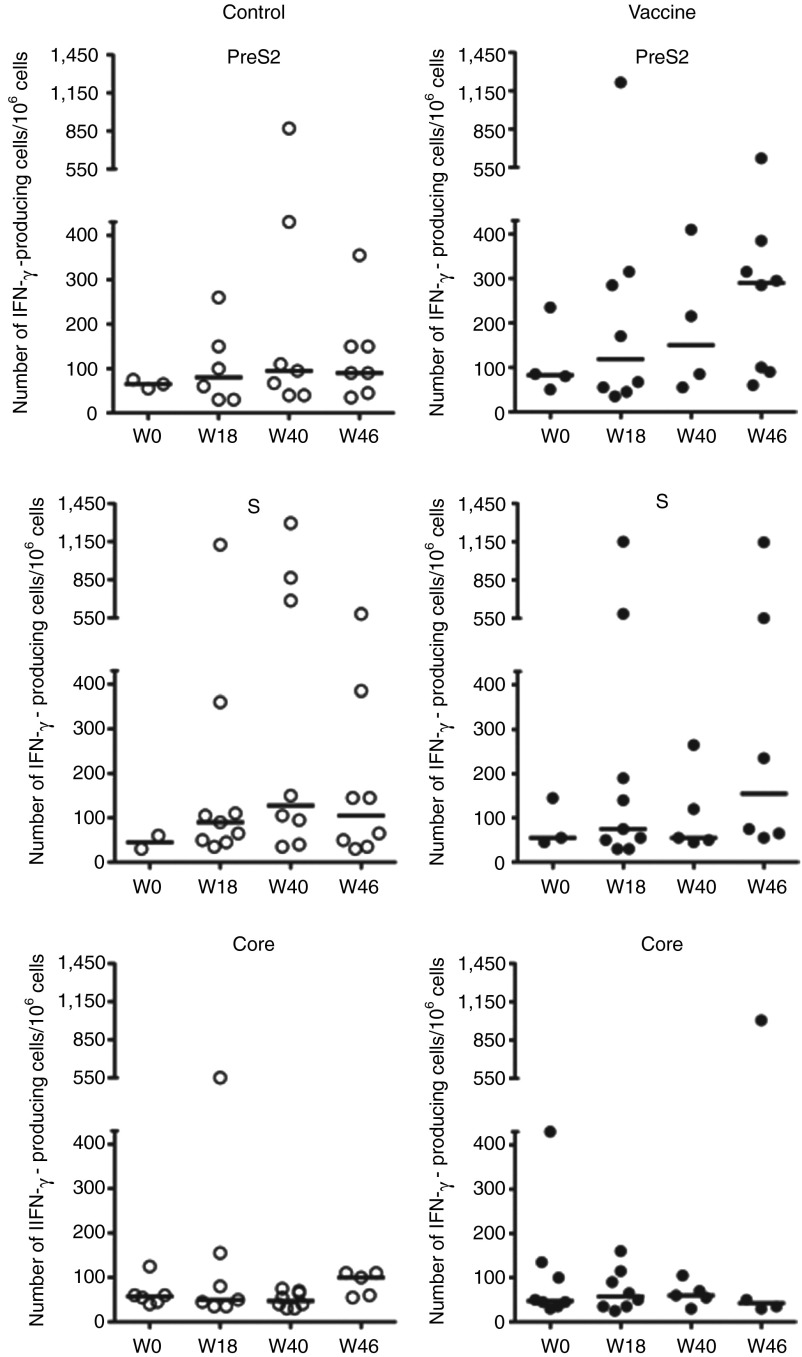
T-cell responses in 59 patients were also assessed using the IFN-γ ELISpot assay, after an ex vivo stimulation of peripheral blood mononuclear cells (PBMCs) with pools of peptides. The peptides encompassed either the preS2 and S domains of the HBV envelope protein and were designed based on the sequence of the immunogens expressed by the DNA vaccine or the core protein of the HBV virus of genotype D. The magnitude, the distribution and the specificity of vaccine-induced T-cell responses against HBV proteins in all patients positive for ELISpot are shown in Figure 2 for the two study groups. At baseline, few patients had circulating core-specific (23.7%, 14/59) and envelope-specific (16.9%, 10/59) IFN-γ–producing T cells, with only two patients having responses directed against both the preS2 and S antigens. The intensity of ex vivo positive T-cell responses to HBV peptide pools was generally weak. At W0, the median of PreS2-, S- and Core-specific IFN-γ–secreting T cells was 65, 45, and 58/106 cells within the control group and 83, 55, and 48 secreting T cells/106 cells within the vaccine group. A slight increase was observed after stimulation with the preS2 peptide pool at W40 and W46 in the vaccine group (median/range, 150/55–410 and 290/60–620, respectively) compared to W0 (median/range, 83/50–235) but did not reach statistical levels (Figure 2, upper right). Core-specific responses remained unchanged in both groups.
Figure 2.
Ex vivo interferon (IFN)-γ production by peripheral blood mononuclear cells (PBMCs) after stimulation with hepatitis B virus (HBV)-derived peptides. HBV-specific IFN-γ–secreting T cells were evaluated by the ELISpot assay at W0, W18, W40, and W46 in PBMCs from control (n = 28; left panels, empty circles) and vaccine (n = 31; right panels, black circles) groups after stimulation with preS2, S or Core peptide pools. Each symbol stands for one patient and only responders are shown. The number of IFN-γ–producing cells is expressed per 106 PBMCs and horizontal black bars represent medians.
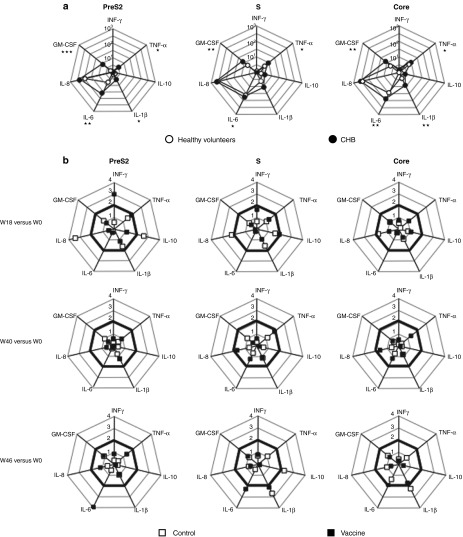
To investigate the vaccine-specific cytokine profile of PBMCs, the cytokine milieu secreted by the cells stimulated in the same conditions as the ELISpot was evaluated using Luminex technology (Figure 3). IL-2, IL-4, and IL-5 cytokine production was never detected (data not shown). The PBMC cytokine profile of 11 CHB patients from each group that were randomly selected was first compared to that from 10 healthy volunteers. Following stimulation with HBV peptide pools of PBMCs of CHB individuals taken at W0 and of healthy volunteers, a secretion of IL-6, GM-CSF, and IL-8 was observed (Figure 3a). However, only the production of IL-6 and GM-CSF met statistical significance in CHB carriers compared to healthy people after HBV-specific stimulation (preS2, P = 0.004 and 0.0002; S, P = 0.033 and 0.006; Core, P = 0.001 and 0.001, respectively). A significant increase of TNF-α was also observed after envelope-derived peptide stimulation of PBMCs from CHB patients (Figure 3a). In addition to these cytokines, the production of IL-1β by PBMCs was significantly enhanced in CHB patients, suggesting that cells from HBV-infected patients tend to produce inflammatory cytokines when stimulated by HBV antigens. In a longitudinal study and compared to baseline, a threefold increase at W18 in IFN-γ production and a fourfold increase at W46 in IL-6 production were observed following stimulation with preS2-derived peptides in the vaccine group but changes remained not statistically different from the control group (Figure 3b, left panels). No significant change in other cytokine concentrations was observed during the follow-up although a production of inflammatory cytokines IL-8 and IL-1β was sporadically noticed in the control group following HBV antigen stimulation.
Figure 3.
Cytokine production by peripheral blood mononuclear cells (PBMCs) after stimulation with HBV peptides. PBMCs were stimulated as described in Figure 2 and the concentrations of IL-1β, IL-10, TNF-α, and of IL-6, IL-8, GM-CSF, IFN-γ cytokines released in the supernatants were determined at 48 and 96 hours, respectively. (a) The values of each axis represent the median concentration of cytokines (pg/ml) after stimulation of PBMCs from a group of healthy volunteers (n = 10; white circles) or from chronic hepatitis B (CHB) patients (n = 22; black circles) taken at W0. P values show statistical differences between patients and healthy volunteers (*P < 0.05; **P < 0.01;***P < 0.001). (b) The changes in cytokine profile after vaccination were calculated as the ratio of the cytokine concentrations found at W18, W40, or W46 and W0. The squares on each axis represent the calculated mean ratio for patients from the vaccine (n = 11; black squares) and control (n = 11; white squares) groups. Ratios greater than 2 (bold lines) are considered as positive.
T-cell proliferative responses were measured by [3H]thymidine incorporation. At baseline, all the 59 HBe-negative patients exhibited a strong proliferative response to purified protein derivative (mean stimulation index (SI) > 70) and tetanus toxoid (mean SI > 38) recall antigens that persisted over time (data not shown). From W0 to W46, responders to the core protein (SI ≥ 8) fluctuated in percentage from 24.1 to 40% and 29.6 to 40.7% in the vaccine and control groups, respectively. Conversely, a positive proliferative response specific to HBV envelope proteins (SI ≥ 3) was detectable in only three patients (8%) in both groups at baseline. During the follow-up, a transient proliferative response in an additional patient from each group toward HBsAg was observed. Overall, there were no significant differences between groups at any time point. Moreover, the DNA immunization was not able to amplify the pre-existing proliferative response found in the vaccine group (data not shown).
Frequency and specificity of in vitro IFN-γ T-cell responses
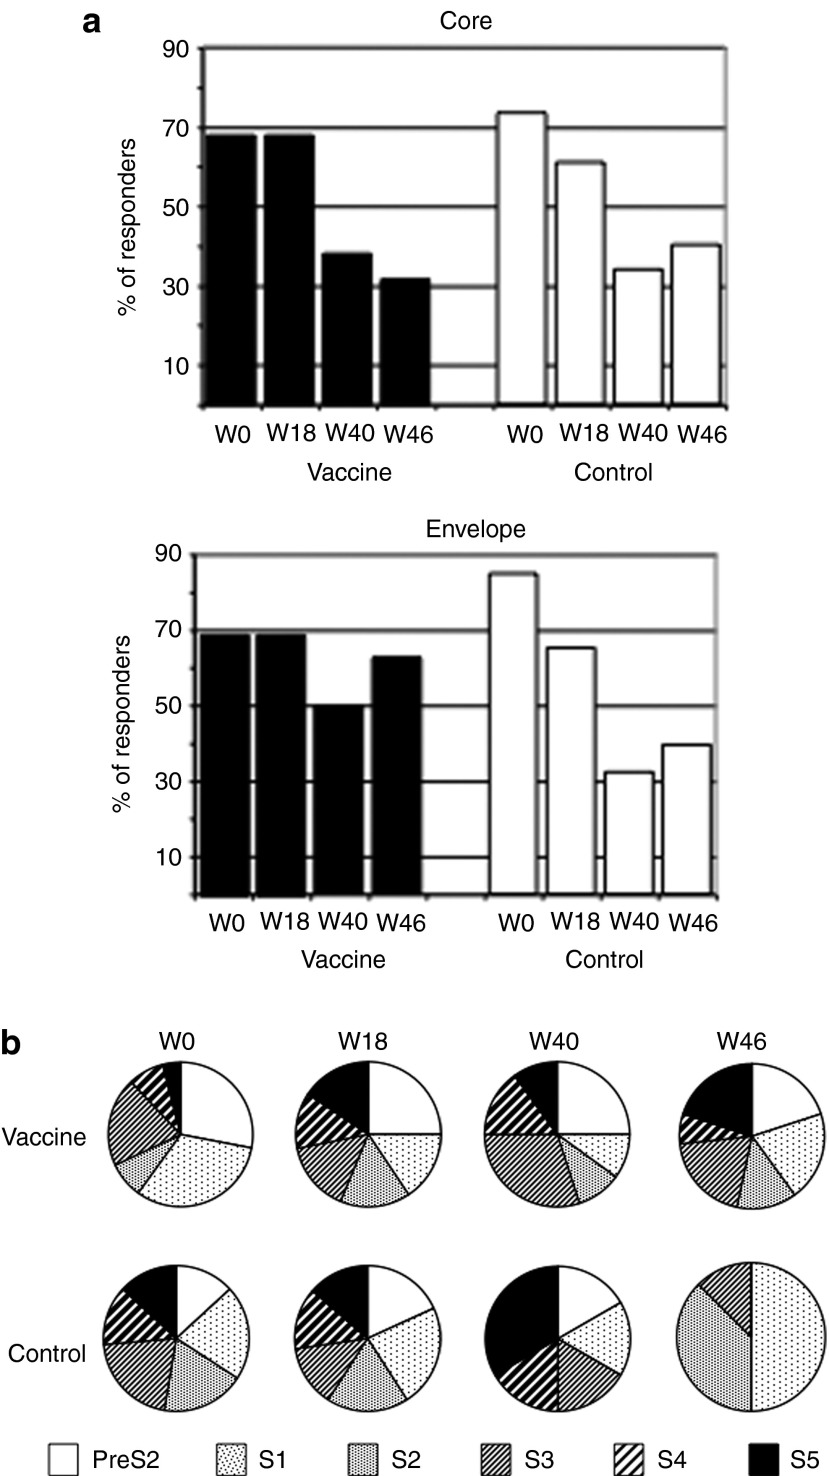
Since HBV-specific responses were hardly detectable ex vivo in patients, short-term T-cell lines were derived from fresh PBMCs stimulated for 10 days with different peptide pools corresponding to the HBV core and envelope (preS2 and S) proteins. At baseline, the in vitro culture greatly improved the frequency of patients with HBV-specific IFN-γ–producing T cells compared to that found after ex vivo stimulation, with around 70% of responders after peptide stimulations (compare Figures 2 and 4a). However, the proportion of patients that responded to the core protein decreased gradually over a 6-month period in both groups (Figure 4a, top). The frequency of patients with IFN-γ–producing T cells after stimulation with the envelope-derived peptide also decreased in the control group from 87% at W0 to 33% at W40 (Figure 4a, bottom). Interestingly, this contrasted to the vaccine group in which the number of responders remained stable over time. To further characterize this sustained response, the fine specificity of the T cells was analyzed by using subpools of the envelope-derived peptides. In spite of variable proportion of T-cell specificities at baseline, the six envelope subpools of peptides derived from the vaccine sequence were recognized in both groups (Figure 4b). All preS2 and S subpools gave rise to IFN-γ secretion at the four time points studied in the vaccine group whereas the number of pools able to generate a T-cell response declined gradually in the control group with only 3 S subpools recognized at W46. These results suggest a positive effect of the vaccination on the maintenance of the diversity of envelope-specific memory T cells.
Figure 4.
Percentage of patients with T-cell responses and diversity of responses. Fresh peripheral blood mononuclear cells (PBMCs) from patients taken at different time points were stimulated with peptide pools corresponding to the hepatitis B virus (HBV) capsid (core) and envelope proteins for 10 days and interferon (IFN)-γ–secreting T cells were enumerated by an in vitro ELISpot assay. (a) Percentage of patients with positive IFN-γ ELISpot response (responders) among vaccine (n = 17; black bars) and control (n = 16; white bars) groups over time. (b) Pie charts represent the relative frequency of cells producing IFN-γ following re-stimulation with preS2 and S1-S5 envelope subpools.
Phenotype and functionality of T-cell responses
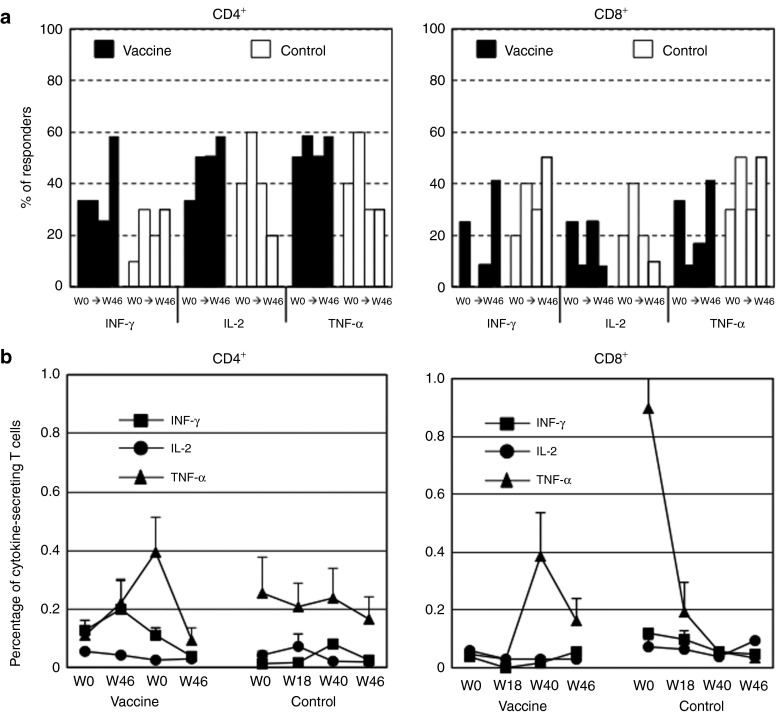
Having established the presence of preS2- and S-specific IFN-γ–producing T cells in patients, a more extensive characterization was performed on available frozen PBMCs from 12 vaccinated and 10 control patients by intracellular staining (Figure 5). At baseline, short-term cultures of PBMCs stimulated with vaccine-derived peptides were unable to activate cytokine-producing CD4+ T cells in half of the patients and CD8+ T cells in 58.3% and 60% of the patients from the vaccine and control groups, respectively (data not shown). Patients with PBMCs responding to the stimulation had predominantly HBV-specific CD4 T cells (Figure 5a). Over time, the percentage of vaccinated patients with CD4+ T cells producing Th1 cytokines had a propensity to increase at W46 after the two last doses of vaccine. This was not the case in the control group where a downward trend was observed from W18 for IL-2 and TNF-α (Figure 5a, left panel). The proportion of patients with positive CD8+ T-cell responses fluctuated over time in both groups but tended to decrease in the vaccine group especially at W18 and re-increase thereafter (Figure 5a, right panel). In the control group, the mean frequency of T-cell responses measured by ICS assay was stable and less than 0.082%, 0.074%, and 0.255% for IFN-γ, IL-2, and TNF-α CD4+ T cells, respectively (Figure 5b, left panel). An increase in the mean percentage of IFN-γ–(0.200%)-at W18 and of TNF-α–(0.395%) producing CD4+ T cells was observed at W40 in the vaccine group. However, this increase remained non significant. The percentage of cytokine-producing CD8+ T cells remained low (<0.1%) (Figure 5b, right panel) except for TNF-α but the observed high concentrations were only attributed to one patient (see Supplementary Figure S2 for analysis at single patient level).
Figure 5.
Production of envelope-specific Th1 cytokines by short-term cell lines. Frozen peripheral blood mononuclear cells (PBMCs) of patients from vaccine (n = 12) and control (n = 10) groups were thawed and stimulated in vitro for 10 days with peptide pools corresponding to the envelope proteins encoded by the vaccine, and T-cell responses were measured by ICS assay. (a) Frequency of patients with envelope-specific IFN-γ–, IL-2–, or TNF-α–secreting CD4+ (left panel) and CD8+ (right panel) T cells analyzed from W0 to W46. Black and white bars represent % of patients with cytokine-producing cells from vaccine and control groups, respectively. (b) IFN-γ, IL-2, and TNF-α production by CD4+ (left panel) and CD8+ (right panel) T cells was evaluated from W0 to W46. Results are expressed as mean frequency of cytokine-positive T cells + SEM.
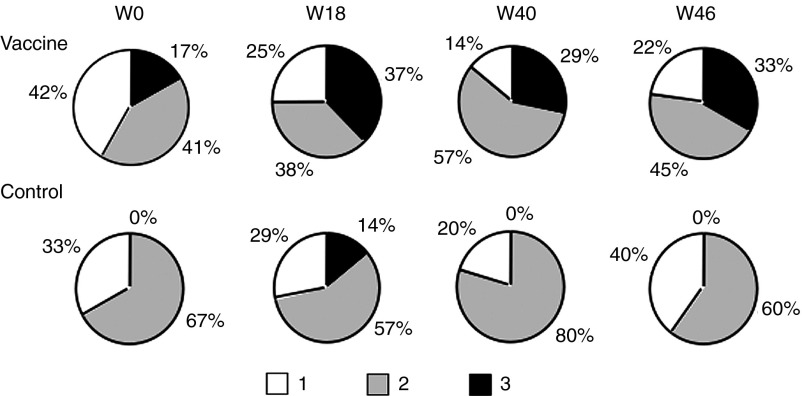
The degree of functionality of the responding cells detected by a polychromatic ICS assay is shown in Figure 6 for both the vaccine and the control groups. At baseline, the contribution of the CD4+ T-cell subset with three functions was totally absent in the control group due to the low frequency of IFN-γ–secreting cells (see Figure 5b and Supplementary Figure S2, left panels). The functional properties of antigen-specific CD4+ T-cell responses differed substantially over time with an increase in the number of patients acquiring CD4+ T cells with 2 and 3 functions in the vaccine group only. These functionalities were boosted after the DNA injections. This effect was notable as early as W18. Cytokine-positive CD8 T cells were only single or double producers (data not shown).
Figure 6.
Evolution of cytokine expression patterns in T cells over time. Pie charts were created taking into account the total CD4+ T-cell responses of 13 and 11 patients from the vaccine and control groups, respectively. Pies stand for the mean fractions of CD4+ T cells able to produce single (white segment), double (gray segment), or triple (black segment) Th1 cytokines (IFN-γ, IL-2, and TNF-α) after stimulation with envelope-derived peptide pools at W0, W18, W40, and W46.
Virological and serological profiles after treatment discontinuation
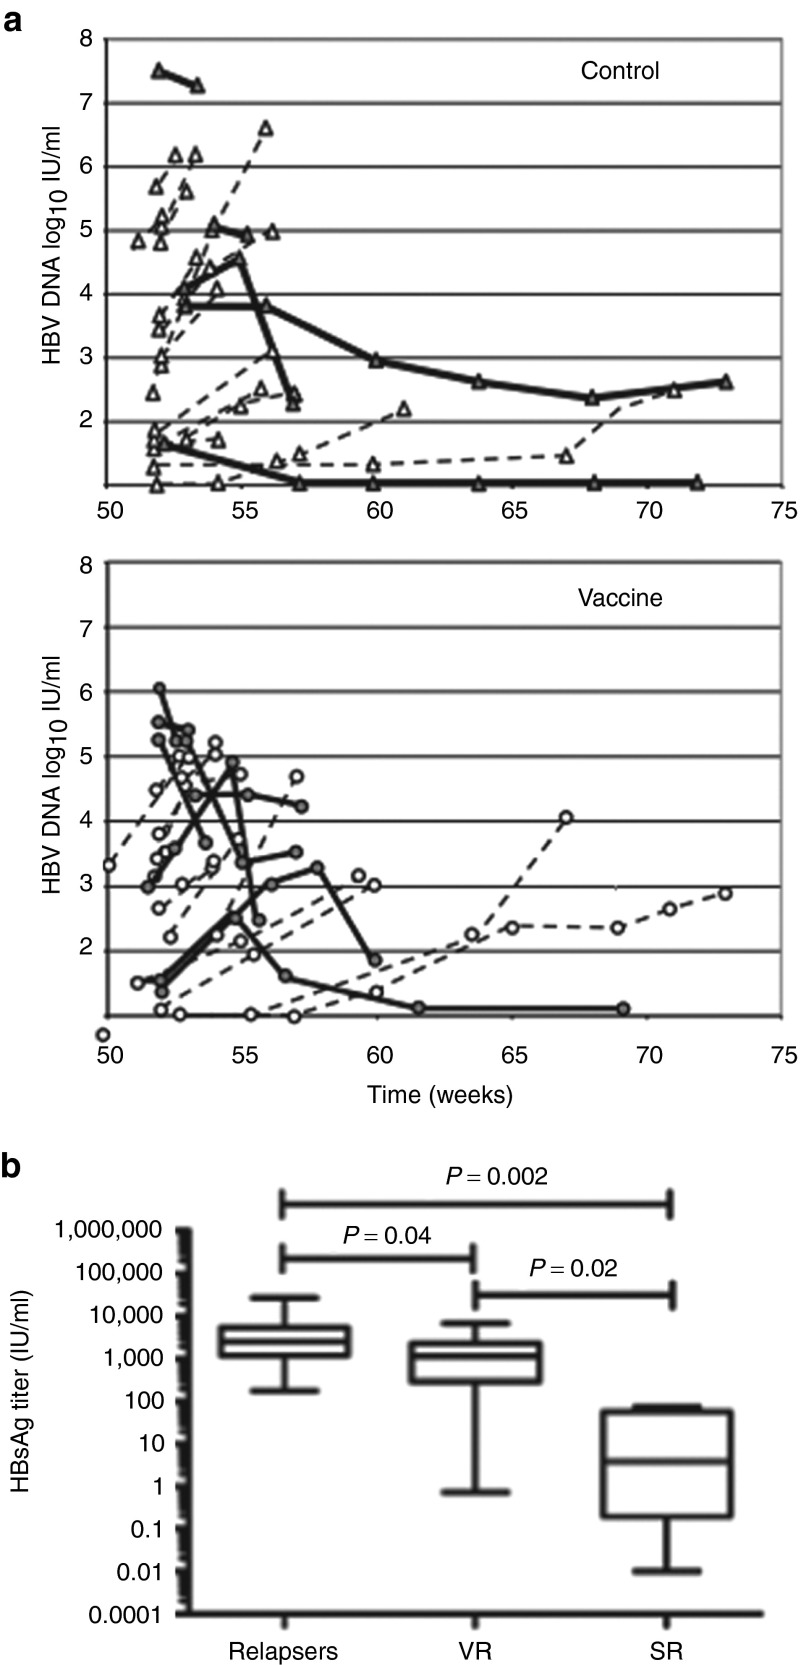
We next asked whether the presence of multifunctional T cells in vaccinated patients could prevent HBV reactivation after cessation of NUC treatments at W48. As stated in the protocol, two and five patients from the control and vaccine group did not stop therapy due to virological breakthroughs between W0 and W46. HBV DNA levels were evaluated every month after NUC discontinuation. Serum HBV DNA was negative at W48 in the remaining patients but became detectable (>12 IU/ml; 1.1 log10 IU/ml) 1 month after treatment discontinuation (Figure 7a, W52). When HBV DNA levels were >120 IU/ml (2.1 log10 IU/ml), viremia was confirmed by a second test 2 weeks later. For 10 patients, HBV DNA level was available at only one time point during the off-therapy period because they resume their antiviral treatment without waiting for confirmation of viremia. If HBV DNA levels continued to increase at a 2-week interval, patients were considered as relapsers and they resumed their NUC treatment. Between W58 and W62, only one patient from each group cleared HBV DNA in serum and stayed negative until W72 but remained HBsAg positive.
Figure 7.
Virological responses after treatment discontinuation. (a) Time course of hepatitis B virus (HBV) DNA levels (log10 IU/ml) in sera of chronic hepatitis B (CHB) patients from the control (n = 20) and vaccine (n = 22) groups after treatment discontinuation at W48. As stated in the protocol, two and five patients from the control and vaccine groups did not stop therapy due to virological breakthroughs between W0 and W46. For 6 and 4 from the control and vaccine groups, HBV DNA level was available at only one time point during the off-therapy period because they resume their antiviral treatment without waiting for confirmation of viremia. Bold lines stand for virological responders (VR) defined as a decline of serum HBV DNA levels on two consecutive measurements. Dotted lines correspond to relapsers. (b) HBsAg titers (IU/ml) in relapsers (n = 29), VR (n = 13), and serological responders (SR; n = 4) at W46.
Remarkably, 36.4% (8/22) patients from the vaccine group demonstrated a decline of serum HBV DNA levels on two consecutive measurements (Figure 7a, bold lines) and were considered as virological responders. By contrast, only 25% (5/20) of patients from the control group displayed a similar trend.
Regarding the biochemical responses, HBV reactivation was associated with a transient and mild increase in alanine aminotransferase (ALT) levels. Only 3 and 2 patients in the vaccine and control group experienced an increase of ALT >5 times upper limit of normal, respectively. ALT values returned to normal levels after the patients had resumed their treatment by W56 and after. Four patients became HBsAg negative (two in each group) between W60 and W72 after they restarted their antiviral treatment. Among them, one patient from the control group even seroconverted to anti-HBs. Notably, the four patients with serological responses or the two patients with HBV DNA clearance were patients with HBsAg titers <100 IU/ml at baseline. HBsAg levels, measured at W46, were significantly lower in patients with HBsAg loss (serological responders, Figure 7b) compared to relapsers and virological responders (20.6 ± 18 versus 4,916 ± 1,206 and 1,713 ± 535; P = 0.002 and P = 0.02, respectively). A significant difference (P = 0.04) was also found between relapsers and virological responders underlying the importance of HBsAg levels as a determinant of virological response.
Discussion
Functional impairment of Th1 and Th2 immunity is a key feature of chronic HBV infection.2 In addition to the clearance of the HBV DNA and histological improvements, NUC treatments have been shown to restore to some extent T-cell immunity in CHB patients8,9,10 but the ultimate goal (i.e., HBsAg/anti-HBs seroconversion) remains to be reached. HBV-specific therapeutic immunization could represent a promising add-on therapy in order to activate or re-activate defective T-cell responses. Our longitudinal study was designed to investigate the efficacy of such treatment in efficiently treated CHB patients. The T-cell responses obtained in this trial were qualitatively and quantitatively different from those obtained in our pilot study. In the first trial,6 the HBsAg-based DNA vaccine was able to induce or re-activate envelope-specific responses, whereas in this study, it only led to their maintenance, but the status of patients was different since they were mainly HBeAg positive and were not treated by NUC. However, in both trials our results confirm that ex vivo HBV T-cell reactivity is weak in the blood of CHB patients.8,11 After in vitro expansion, the percentage of positive T-cell responders to HBV antigens at W0 was higher in this study than in our previous trial (70% versus 30%). This higher rate of positive responders could be either assigned to the antiviral treatment since most of patients were treated by NUC for years or to their HBeAg negative status.9
Most of the HBsAg-specific T cells detected in patients were CD4+ T cells and the vaccine regimen appeared to maintain them and to increase their diversity and their polyfunctionality. This is important in CHB infection where an adequate CD4+ T-cell help is required for efficient CD8+ T-cell responses.12 However, due to the low frequency of responses, robust statistical analysis could not be performed and we can not exclude that these discrepencies may be due to fluctuation in T-cell responses in periphery. In our study, the slight change observed in the CD4 population did not seem to impact on the function and the number of HBV-specific CD8 T cells. Even if we cannot rule out that the CD8 T cells were compartmentalized within the liver, a more rational explanation is that the NUC treatments by controlling the infection, had also decreased the number of available HBV-infected target cells presenting HBV peptides in the liver. This may have resulted in a progressive loss of some T-cell specificities as observed at W40 and W46 in the control group whereas vaccine injections could have maintained the diversity of HBV-envelope T-cell responses in the vaccine group (see Figure 4b). In addition, the expression of Bim was found increased on HBV-specific CD8 T liver cells from CHB patients and was not modulated by long-term antiviral therapy.13,14 The persistent upregulation in the liver of the pro-apoptotic Bim protein could have induced a premature death of the primed T cells.15 As in patients treated with IFN-α, the marked depletion of effector CD8 T cells may limit the recovery of effective antiviral T-cell responses.16
At a first glance, the vaccine therapy did not show a tremendous additive effect to the antiviral therapy when NUC were stopped. A high frequency of responders at baseline could have also perhaps concealed the positive effect of vaccination. Treatment discontinuation was set only 2 weeks after the last vaccine injection. T cells were both at an effector and memory stage at the time of re-encountering the viral antigens. Effector cells probably died due to antigenic overstimulation after the re-increase in viral load at that time. In our study, proliferative responses to HBsAg did not increase in vaccinated patients suggesting that memory cells that were induced by previous vaccine injections had not acquired sufficient proliferative capacity.17 Moreover, the trial was designed at a time when little was known concerning the drawbacks of long-term treatment discontinuation. HBV DNA was detectable in all patients within the first month and peaked between 1 and 2 months of treatment discontinuation. This is in agreement with the recent work of Hadziyannis et al.18 where a similar population of HBeAg negative patients were treated long-term by adefovir and where rebound of viral DNA over 10,000 IU/ml was observed during off-treatment. For safety reasons, stringent criteria were applied to our study. NUC treatment was restarted as soon as the threshold of 120 IU/ml HBV DNA in two consecutive measurements at 15 days apart was reached even though the HBV DNA tended to decrease. This could also contribute to the disappointing results obtained. It should be noted that the actual EASL clinical practice guidelines are to treat patients only when the HBV DNA level is over 2,000 IU/ml.19 In our trial, only a few hepatic flares were observed after therapy withdrawal but most of our patients resumed their antiviral treatment by 2 months after treatment discontinuation. Nevertheless, although non significant, the percentage of patients with a decline in serum HBV DNA levels was higher in the vaccine than in the control group. We can speculate that the sustained and multifunctional immune response detected in the vaccine group could have had a positive effect on the control of viremia. However, no correlation was found between the magnitude of T-cell responses and virological response.
One of the most striking findings is the correlation between control of viremia and HBsAg levels. Our results confirms that an HBsAg level of less than 100 IU/ml before treatment cessation represents a good predictor of subsequent HBsAg loss as previously shown by Hadziyannis et al.18 We also showed that the control of viremia after treatment discontinuation was associated with lower HBsAg levels in our patients. HBsAg levels appear therefore as a convenient tool to predict the outcome of the disease after NUC cessation. It could have been interesting to analyze T-cell responses in patients with no DNA rebound. Unfortunately, PBMCs from the patients of the vaccine group were not available after NUC discontinuation. Sporadic in vitro T-cell responses but no proliferation to the envelope proteins were detected between W0 to W46 in the 2 patients with controlled viremia. Roughly throughout the trial, no significant difference was detected in HBV-specific T-cell responses between patients with or without HBsAg loss. However, T-cell responses were assessed with peptides matching with genotype D (i.e., the vaccine sequence). In France, genotype D is present in around one third of the HBV-infected patients20 meaning that our tools did not perfectly match with the genotype of the viruses present in two third of patients.
Our trial showed that DNA vaccination allowed the maintenance of the number, the diversity and the functionality of T-cell responses and that HBsAg titers account for an important determinant of serological and virological responses. Nevertheless, the combination of DNA vaccination with antiviral long-term treatment was not able to prevent HBV reactivation in patients after NUC discontinuation. In order to be more effective, future immunotherapies should deal with the viral antigen levels, the profound defect of virus-specific T cells present in CHB patients and the numerous inhibitory pathways that take place in the liver to avoid the destruction of this vital organ. Heterologous prime-boost approaches21 combining injection of proteins to induce humoral responses able to decrease the HBsAg levels with the induction and maintenance of HBV-specific CD8 T cells by electroporated DNA or viral vectors could represent a more powerful way to enhance immune responses in CHB.
Materials and Methods
Patient populations and study design. The protocol of the ANRS HB02 VAC-ADN was submitted, registered online at the NIH International Clinical Trials Registry Platform (NCT00536627) and was approved by our institutional ethical committee. This clinical trial was an open, prospective, phase I/II, randomized, multicenter trial conducted from February 2008 to October 2010 in France. An informed consent was obtained from each patient and the study protocol conformed to the ethical guidelines of the 1975 Declaration of Helsinki. Exclusion criteria were coinfection with human immunodeficiency, hepatitis C and D viruses; intravenous drug use or excessive alcohol consumption; past anti-HBV vaccination less than 5 years previously; treatment with immune stimulating molecules in the last year or immunosuppressive treatment; immune-mediated disorder; kidney or demyelinating diseases; Human leucocyte antigen DR15/16 phenotype and pregnancy. Seventy NUC-treated HBsAg-positive patients with chronic hepatitis B, a serum ALT value lower than fivefold the upper limit of normal and with an HBV DNA <12 IU/ml for at least 1 year prior to randomization were enrolled (Figure 1 and Table 1). Patients were randomized to receive pCMV-S2.S DNA vaccine or nothing on day 0 and W8, W16, W40, and W44. The vaccine administration was performed by two intra-deltoid injections of 0.5 mg of vaccine in each muscle. The pCMV-S2.S plasmid and safety of the vaccine regimen have been previously described and indicated that the vaccine was well tolerated.6 The immunological assays were performed before starting therapy at the baseline (W0) and three times during treatment (W18, W40, and W46). Patients stopped their NUC treatment at W48 and were studied up to W72. Qualitative serum HBsAg and HBeAg, quantitative HBV DNA (Abbott RealTime HBVassay, Abbott France S.A.S., Rungis, France or COBAS TaqMan HBV Test, Roche Molecular Diagnostics, Meylan, France; limit of quantification 10 and 12 IU/ml, respectively) and ALT were performed at various time points. Quantitative serum HBsAg (Abbott Architect HBsAg assay, Abbott France S.A.S.; dynamic range 0.05–250.0 IU/ml) was measured at W0 and W46. Peripheral blood mononuclear cells from 10 healthy volunteers unvaccinated for hepatitis B were supplied by the Platform ICAReB (Institut Pasteur, France) from the cohort project approved by the Ile-de-France ethics committee and the Health Research Ministry under the code no. DC 2008–68 and served as negative controls for HBV-specific proliferative responses, ELISpot assays and cytokine production. HLA-A2 patients were identified by incubation of fresh PBMCs with an anti–HLA-A2 PE-labeled antibody (AbD Serotec, Colmar, France).
HBV antigens, synthetic peptides, and pentamers. Purified recombinant HBsAg particles (genotype D) were produced in CHO cells (a gift from Aventis Pasteur, Val de Reuil, France). A recombinant preparation of full-length HBV core antigen (HBcAg) purified from E. Coli was provided by the Center for Genetic Engineering and Biotechnology (Havana, Cuba). Phytohemagglutinin (Becton Dickinson, Franklin Lakes, NJ), purified tetanus toxoid (Aventis Pasteur, Marcy l'Etoile, France) and tuberculin purified protein derivative (Statens Serum Institut, Copenhagen, Denmark) were used as positive controls in proliferation assays.
Overlapping peptides (15 mers with 10-residue overlap) covering the complete preS2 (n = 10), S (n = 30) and capsid (n = 36) proteins from HBV (genotype D) were synthetized with a minimum purity level of 80% and were purchased from PolyPeptide group (Strasbourg, France). In some experiments, five subpools of S peptides (S1 to S5) were used. A pool of 32 control peptides derived from common pathogens from Anaspec (San Jose, CA) was used as a positive control.
Four fluorescent MHC class I pentamers presenting the HBV HLA-A2 epitopes Core 18–27 (FLPSDFFPSV), env 183–191 (FLLTRILTI), env 335–343 (WLSLLVPFV) and env 348–357 (GLSPTVWLSV) of genotype D (Proimmune, Oxford, UK) were used to study the CD8 response. Two HCV HLA-A2 epitopes Core 132–140 (DLMGYIPLV) and NS3 (CINGVCWTV) were used as negative controls (Supplementary Figure S1b). Ex vivo frequencies of pentamer-positive cells exceeding 0.01% of CD8 cells were considered positive.
PBMC isolation and proliferation assays. PBMCs were isolated from fresh heparinized blood by Ficoll-Hypaque density gradient centrifugation. For proliferation assays, PBMCs were cultured in triplicate (1.5 × 10⁵ cells/well) in 96-well round-bottom microplates for 5 days in the presence of HBsAg (3 µg/ml), HBcAg (1 µg/ml), phytohemagglutinin (5 µg/ml), TT (10 µg/ml), purified protein derivative (10 µg/ml) or medium alone.22 On day 5, cultures were labeled by incubation for 8–16 hours with 1 µCi [3H]thymidine/well (specific activity 25 µCi/mmol, Perkin Elmer, Courtaboeuf, France). The proliferative response was evaluated by determining 3H-thymidine uptake with a beta counter (Microbeta, Perkin Elmer). The mean of the triplicates were used for the analysis. The SI was calculated as the ratio of the mean number of counts per minute in the presence and absence of antigen. The specificity of proliferation assays was determined with PBMCs from anti-HBs-antibody-negative healthy volunteers. A response was scored as positive if the ratio was greater than the mean response plus 2 SD in healthy individuals and corresponded to a SI greater or equal to 3 and 8 for HBsAg and HBcAg, respectively.
Enzyme-linked immunosorbent spot assay for IFN-γ release. Nitrocellulose HA or sterile PVDF 96-well plates (Millipore SAS, Molsheim, France) wetted with 35% ethanol and washed were coated with 15 and 10 µg/ml anti–IFN-γ mAb (clone 1-DIK; Mabtech, Nacka Strand, Sweden) in 0.1 M bicarbonate buffer (pH 9.6), respectively. The wells were blocked and washed, then filled, in triplicate, with PBMCs (2 × 10⁵/well) and the appropriate peptide pools (1 µg/ml of each single peptide), or medium alone. After 20 hours of incubation at 37 °C, plates were washed and incubated with 1 μg/ml biotinylated anti–IFN-γ monoclonal antibody (clone 7B6-1; Mabtech) for 2.5 hours at room temperature. Plates were washed and antibody binding was detected as previously described.6 A BioCys enzyme-linked immunosorbent spot (ELISpot) automatic counter was used to score the number of spots. The median of the triplicates was used for the analysis. The specificity and cut-off of ELISpot assays were determined with PBMCs from healthy individuals. A positive ELISpot assay was defined as containing at least 25 IFN-γ–producing cells/million PBMCs in median, and greater than twice as median SFC in nonstimulated wells.
Cytokine profiles. Fresh PBMCs were cultured as in ELISpot assays in 96-well plates with PreS2, S and Core peptide pools, or with medium alone. Supernatant aliquots were harvested at 48 and 96 hours and stored at −80 °C for further analysis. Interleukin (IL)-1β, IL-10, TNF-α and GM-CSF, IL-2, IL-4, IL-5, IL-6, IL-8, IFN-γ concentrations were measured with a human cytokine 10-Plex panel (Invitrogen, Saint-Aubin, France) using a Luminex array reader (Luminex 100IS, Luminex, Millipore, Molsheim, France) at 48 and 96 hours, respectively. At least 100 events were acquired for each cytokine. For each time point, a SI was calculated as the ratio between antigen-stimulated/control cultures. The relative cytokine response was calculated as a ratio between postvaccination and baseline and was considered positive if the ratio was >2.
Short-term culture and flow cytometry analysis. Fresh or frozen PBMCs were stimulated with peptide pools covering the preS2 and S or Core domains of HBV (1 µg/ml of each peptide) in the presence of 20 ng/ml of interleukin IL-7 (Cytheris SA, France) in 24-well plates. Half of the medium was replaced every 2–3 days with complete medium supplemented with recombinant IL-2 (50 IU/ml) (Roche, Meylan, France). After 10 days of culture, T-cell lines were restimulated with or without the corresponding peptides and the production of cytokines evaluated by intracellular staining with anti–IFN-γ, anti–IL-2 and anti–TNF-α monoclonal antibodies, as previously described in detail.23 Data were acquired on a Cyan flow cytometer (Beckman Coulter, Villepinte, France) and analyzed with the FlowJo software (Tree star, Ashland, OR)(Supplementary Figure S1a). To identify the degree of functionality of cells, CD3 T cells were separated into CD4+ and CD8+ T-cell lineages. Within each lineage, the subset of cells that express each functional marker (IFN-γ, TNF-α, and IL-2) was entered into a “Boolean gating” analysis that separately identifies the seven subsets that express each possible combination of functions. The HBV-specific response was evaluated by subtracting background levels of nonspecific cytokine production observed in medium alone. A response was considered positive if the percentage value of the subset of cells with specific secretion of cytokines was at least the value observed with medium alone, and represented at least 0.01% of acquired cells.
Statistical analysis. Frequencies of cytokines producing T cells from groups of patients were compared by using Wilcoxon matched pairs test and Mann–Whitney nonparametric U test when appropriate. The sample size of 31 patients in the vaccine group conferred 80% power, with two-sided P = 0.05, to detect a variation of 102 IFN-γ–secreting cells after immunization and a 22% and 34% difference in the proportion of patients with positive proliferative responses to HBsAg and HBcAg, respectively. Results are given in median (range), unless specified otherwise. HBV DNA was logarithmically transformed for analysis. Clinical data were compared using the χ2 test. For all tests, a value of P < 0.05 was considered statistically significant. Statistical analysis were performed using Prism software (GraphPad, La Jolla, CA).
SUPPLEMENTARY MATERIAL Figure S1. The gating strategy for detection of HBV-specific T cells by (a) intracellular or (b) pentamer staining. Figure S2. Individual kinetics of the production of envelope-specific Th1 cytokines after in vitro stimulation.
Acknowledgments
We gratefully acknowledge JC Aguilar (CIBG, Cuba) for HBcAg and F Buseyne for advice on statistics. We extend special thanks to MN Ungeheuer, V Mellon from ICAReB and physicians for recruiting patients for this study. We also thank Laurence Alain and Ventzislava Petrov-Sanchez for help in the management of the trial, Brigitte Assouline (Cytheris SA) for kindly supplying IL-7 and Katherine Kean for linguistic revision of the text. The trial was sponsored and funded by The National Agency for research on Aids and viral Hepatitis. The study protocol was registered at ClinicalTrials.gov under registration no. NCT00536627. Hélène Fontaine took part in medical congress as auditor and gave oral communication for Bristol-Myers Squibb, Gilead, Roche, Schering-Plough/Merck, Janssen. S.P. has received consulting and lecturing fees from Bristol-Myers Squibb, Boehringer Ingelheim, Tibotec, Vertex, Gilead, Roche, Schering-Plough/Merck, Novartis, Abbott, Sanofi, and Glaxo Smith Kline, and grants from Bristol-Myers Squibb, Gilead, Roche, and Merck/Schering Plough. The authors declare no conflict of interest.
Supplementary Material
References
- Lok AS, McMahon BJ. Chronic hepatitis B. Hepatology. 2007;45:507–539. doi: 10.1002/hep.21513. [DOI] [PubMed] [Google Scholar]
- Boni C, Fisicaro P, Valdatta C, Amadei B, Di Vincenzo P, Giuberti T, et al. Characterization of hepatitis B virus (HBV)-specific T-cell dysfunction in chronic HBV infection. J Virol. 2007;81:4215–4225. doi: 10.1128/JVI.02844-06. [DOI] [PMC free article] [PubMed] [Google Scholar]
- Rehermann B, Nascimbeni M. Immunology of hepatitis B virus and hepatitis C virus infection. Nat Rev Immunol. 2005;5:215–229. doi: 10.1038/nri1573. [DOI] [PubMed] [Google Scholar]
- Dunn C, Peppa D, Khanna P, Nebbia G, Jones M, Brendish N, et al. Temporal analysis of early immune responses in patients with acute hepatitis B virus infection. Gastroenterology. 2009;137:1289–1300. doi: 10.1053/j.gastro.2009.06.054. [DOI] [PubMed] [Google Scholar]
- Boni C, Penna A, Bertoletti A, Lamonaca V, Rapti I, Missale G, et al. Transient restoration of anti-viral T cell responses induced by lamivudine therapy in chronic hepatitis B. J Hepatol. 2003;39:595–605. doi: 10.1016/s0168-8278(03)00292-7. [DOI] [PubMed] [Google Scholar]
- Mancini-Bourgine M, Fontaine H, Scott-Algara D, Pol S, Bréchot C, Michel ML. Induction or expansion of T-cell responses by a hepatitis B DNA vaccine administered to chronic HBV carriers. Hepatology. 2004;40:874–882. doi: 10.1002/hep.20408. [DOI] [PubMed] [Google Scholar]
- Scott-Algara D, Mancini-Bourgine M, Fontaine H, Pol S, Michel ML. Changes to the natural killer cell repertoire after therapeutic hepatitis B DNA vaccination. PLoS ONE. 2010;5:e8761. doi: 10.1371/journal.pone.0008761. [DOI] [PMC free article] [PubMed] [Google Scholar]
- Boni C, Laccabue D, Lampertico P, Giuberti T, Viganò M, Schivazappa S, et al. Restored function of HBV-specific T cells after long-term effective therapy with nucleos(t)ide analogues. Gastroenterology. 2012;143:963–73.e9. doi: 10.1053/j.gastro.2012.07.014. [DOI] [PubMed] [Google Scholar]
- Cooksley H, Chokshi S, Maayan Y, Wedemeyer H, Andreone P, Gilson R, et al. Hepatitis B virus e antigen loss during adefovir dipivoxil therapy is associated with enhanced virus-specific CD4+ T-cell reactivity. Antimicrob Agents Chemother. 2008;52:312–320. doi: 10.1128/AAC.00467-07. [DOI] [PMC free article] [PubMed] [Google Scholar]
- Jiang Y, Ma Z, Xin G, Yan H, Li W, Xu H, et al. Th1 and Th2 immune response in chronic hepatitis B patients during a long-term treatment with adefovir dipivoxil. Mediators Inflamm. 2010;2010:143026. doi: 10.1155/2010/143026. [DOI] [PMC free article] [PubMed] [Google Scholar]
- Webster GJ, Reignat S, Brown D, Ogg GS, Jones L, Seneviratne SL, et al. Longitudinal analysis of CD8+ T cells specific for structural and nonstructural hepatitis B virus proteins in patients with chronic hepatitis B: implications for immunotherapy. J Virol. 2004;78:5707–5719. doi: 10.1128/JVI.78.11.5707-5719.2004. [DOI] [PMC free article] [PubMed] [Google Scholar]
- Zajac AJ, Murali-Krishna K, Blattman JN, Ahmed R. Therapeutic vaccination against chronic viral infection: the importance of cooperation between CD4+ and CD8+ T cells. Curr Opin Immunol. 1998;10:444–449. doi: 10.1016/s0952-7915(98)80119-2. [DOI] [PubMed] [Google Scholar]
- Lopes AR, Kellam P, Das A, Dunn C, Kwan A, Turner J, et al. Bim-mediated deletion of antigen-specific CD8 T cells in patients unable to control HBV infection. J Clin Invest. 2008;118:1835–1845. doi: 10.1172/JCI33402. [DOI] [PMC free article] [PubMed] [Google Scholar]
- Schurich A, Khanna P, Lopes AR, Han KJ, Peppa D, Micco L, et al. Role of the coinhibitory receptor cytotoxic T lymphocyte antigen-4 on apoptosis-Prone CD8 T cells in persistent hepatitis B virus infection. Hepatology. 2011;53:1494–1503. doi: 10.1002/hep.24249. [DOI] [PubMed] [Google Scholar]
- Holz LE, Benseler V, Bowen DG, Bouillet P, Strasser A, O'Reilly L, et al. Intrahepatic murine CD8 T-cell activation associates with a distinct phenotype leading to Bim-dependent death. Gastroenterology. 2008;135:989–997. doi: 10.1053/j.gastro.2008.05.078. [DOI] [PMC free article] [PubMed] [Google Scholar]
- Micco L, Peppa D, Loggi E, Schurich A, Jefferson L, Cursaro C, et al. Differential boosting of innate and adaptive antiviral responses during pegylated interferon-alpha therapy of chronic hepatitis B. J Hepatol. 2013;58:225–233. doi: 10.1016/j.jhep.2012.09.029. [DOI] [PubMed] [Google Scholar]
- Wherry EJ, Blattman JN, Ahmed R. Low CD8 T-cell proliferative potential and high viral load limit the effectiveness of therapeutic vaccination. J Virol. 2005;79:8960–8968. doi: 10.1128/JVI.79.14.8960-8968.2005. [DOI] [PMC free article] [PubMed] [Google Scholar]
- Hadziyannis SJ, Sevastianos V, Rapti I, Vassilopoulos D, Hadziyannis E. Sustained responses and loss of HBsAg in HBeAg-negative patients with chronic hepatitis B who stop long-term treatment with adefovir. Gastroenterology. 2012;143:629–36.e1. doi: 10.1053/j.gastro.2012.05.039. [DOI] [PubMed] [Google Scholar]
- European Association For The Study Of The Liver EASL clinical practice guidelines: Management of chronic hepatitis B virus infection. J Hepatol. 2012;57:167–185. doi: 10.1016/j.jhep.2012.02.010. [DOI] [PubMed] [Google Scholar]
- Halfon P, Bourlière M, Pol S, Benhamou Y, Ouzan D, Rotily M, et al. Multicentre study of hepatitis B virus genotypes in France: correlation with liver fibrosis and hepatitis B e antigen status. J Viral Hepat. 2006;13:329–335. doi: 10.1111/j.1365-2893.2005.00692.x. [DOI] [PubMed] [Google Scholar]
- Michel ML, Deng Q, Mancini-Bourgine M. Therapeutic vaccines and immune-based therapies for the treatment of chronic hepatitis B: perspectives and challenges. J Hepatol. 2011;54:1286–1296. doi: 10.1016/j.jhep.2010.12.031. [DOI] [PubMed] [Google Scholar]
- Mancini-Bourgine M, Fontaine H, Bréchot C, Pol S, Michel ML. Immunogenicity of a hepatitis B DNA vaccine administered to chronic HBV carriers. Vaccine. 2006;24:4482–4489. doi: 10.1016/j.vaccine.2005.08.013. [DOI] [PubMed] [Google Scholar]
- Bayard F, Godon O, Nalpas B, Costentin C, Zhu R, Soussan P, et al. T-cell responses to hepatitis B splice-generated protein of hepatitis B virus and inflammatory cytokines/chemokines in chronic hepatitis B patients. ANRS study: HB EP 02 HBSP-FIBRO. J Viral Hepat. 2012;19:872–880. doi: 10.1111/j.1365-2893.2012.01611.x. [DOI] [PubMed] [Google Scholar]
Associated Data
This section collects any data citations, data availability statements, or supplementary materials included in this article.


