

Abstract
High-bandwidth measurements of the ion current through hafnium oxide and silicon nitride nanopores allow the analysis of sub-30 kD protein molecules with unprecedented time resolution and detection efficiency. Measured capture rates suggest that at moderate transmembrane bias values, a substantial fraction of protein translocation events are detected. Our dwell-time resolution of 2.5 μs enables translocation time distributions to be fit to a first-passage time distribution derived from a 1D diffusion-drift model. The fits yield drift velocities that scale linearly with voltage, consistent with an electrophoretic process. Further, protein diffusion constants (D) are lower than the bulk diffusion constants (D0) by a factor of ∼50, and are voltage-independent in the regime tested. We reason that deviations of D from D0 are a result of confinement-driven pore/protein interactions, previously observed in porous systems. A straightforward Kramers model for this inhibited diffusion points to 9- to 12-kJ/mol interactions of the proteins with the nanopore. Reduction of μ and D are found to be material-dependent. Comparison of current-blockage levels of each protein yields volumetric information for the two proteins that is in good agreement with dynamic light scattering measurements. Finally, detection of a protein-protein complex is achieved.
Introduction
Nanopore sensors have recently emerged as popular tools for structural analysis of proteins and their complexes at the single-molecule level (1). Although a wide palette of established techniques is available for protein analysis, many analytical techniques require chemical modifications that can alter a protein’s structure and/or properties. In contrast, chemical modification is not a prerequisite for nanopore-based analysis. In this method, individual proteins and their complexes are analyzed in solution by monitoring stochastic blockades in the ionic current signal through the pore. Stochastic nanopore sensing has been developed by Bayley et al. for measurements of the interaction kinetics and thermodynamics of protein complexes using α-hemolysin pores (2,3). Stochastic sensing of proteins has also been demonstrated by Martin et al. using synthetic pores (4,5). In other studies, biological and solid-state nanopores have been used to probe polypeptide structure and kinetics (6–9), protein folding/unfolding (10–16), protein charge (17,18), protein size (19,20), protein sequence (21), prion structure (22), and protein-aptamer interactions (23). These studies clearly suggest that nanopores are a valuable tool for protein studies at the single-molecule level.
Numerous protein detection studies using synthetic nanopores in the diameter range 8–55 nm have been reported recently (13,17–19,24,25). A general problem has precipitated from these works: protein molecules translocate far too quickly to be detected. In their recent survey of protein translocation through synthetic nanopores, Plesa et al. concluded that mean protein translocation times (∼1 μs) are faster than detection time limits, which leaves the vast majority of protein translocation events undetected (26). To provide a rationale for these missed events, Plesa and co-workers simulated protein translocation-time distributions derived from 1D drift-diffusion models previously used in DNA and protein translocation studies (13,27–29), using
| (1) |
where heff is the effective height of the pore, D is the protein diffusion constant, and v is the protein drift velocity. Although it can be argued that this 1D model is oversimplified, the model is attractive because it is analytically solvable, allowing biophysical parameters, namely D and v, to be extracted from a particular experiment (30). Using bulk D and v values, Plesa estimated that only the slowest ∼0.1% of translocations of sub-100 kD proteins are observed using >10-nm-diameter synthetic pores and current amplifiers with 10 kHz bandwidths. Indeed, in the first report of protein translocations by Talaga et al., both the D and v values obtained from their fits were three orders of magnitude smaller than their bulk values (i.e., in free solution) (13), as the authors point out. Clearly, insufficient measurement time resolutions present a severe technical obstacle in nanopore-based protein analysis by greatly distorting the obtained experimental values of D and v. Several studies using solid-state nanopores (31) and glass capillaries (32) have since confirmed the importance of increasing time resolution by demonstrating measurements at increasing filter bandwidths up to 100 kHz.
Further evidence for insufficient time resolution is borne by inspection of the observed capture rates of the proteins. The flux of protein arrival into an absorbing pore, J, can be approximated by a diffusion-drift model (30),
| (2) |
where RC is the measured capture rate, C0 is the bulk protein concentration in the chamber, D0 is the bulk diffusion coefficient of the protein, del(C) is the concentration-gradient profile, μ is the electrophoretic mobility of the protein, and E(r) is the electric field as a function of distance r from the pore. The first and second flux terms in Eq. 2 characterize protein diffusion down a concentration gradient and protein drift, respectively, under bias. Although the diffusive term dominates under low-field conditions (i.e., small applied bias), the drift term dominates under nanopore experimental conditions, and should linearly depend on the applied bias. Another approach to describe protein capture is the Smoluchowski rate equation, J = RC/C0 = 2πD0r, where r is effectively the radius of an absorbing hemisphere that extends from the pore mouth (33). For DNA capture into pores, values of r much greater than the pore radius were found (34). Using a similar argument for proteins, a recent compilation of experimental capture rates in the molecular weight range 10–50 kD concluded that observed fluxes are factors of 103–104 lower than the Smoluchowski rate prediction (26). This points to an overwhelming fraction of missed events in nanopore-based protein analysis experiments, issues that in principle can be resolved by increasing the measurement time resolution and protein dwell times. Modifying the experimental parameters, i.e., the pore surface charge (35), and increasing the solution viscosity (36) can increase molecular transport times, although these approaches could potentially compromise the resolution and sensitivity to protein molecules by inhibiting the protein flux into the pore.
Recently, new amplifiers for high-bandwidth current measurements through nanopores have been developed (37,38), and their utility for detecting small nucleic acid biomolecules at bandwidths of >100 kHz has been demonstrated (39,40). The ability to detect small biomolecules in these works is due to a combination of high-bandwidth current detection, the use of small pores, which enhances molecule/pore interactions by increasing molecular confinement within the pore during its transport, and the use of pores in membranes that are <10 nm thick which enhances the signal/noise of the measurement (41).
In this work, we show that high-bandwidth current measurements through nanopores in ultrathin hafnium oxide (HfO2) and silicon nitride (SiN) membranes can be used to efficiently detect sub-30 kD proteins. We compare the transport of two positively charged proteins, proteinase K (ProtK; 28.9 kD, pI 8.9) (42) and RNase A (RNase, 13.7 kD, pI 9.6) (43), through HfO2 and SiN nanopores with similar geometries: a diameter of d = 5.2 nm and effective pore height of heff = 7 nm for the HfO2 pore, and d = 4.8 nm and heff = 6.2 nm for the SiN pore (see the Supporting Material). Fig. 1 a shows an idealized ProtK molecule in flight through a 5-nm-diameter nanopore drawn approximately to scale (electrodes not to scale). To maximize confinement of the proteins that reduce protein mobility within the pore, pore diameters were chosen such that dp/dh < 1.5, where dh is the protein’s hydrodynamic diameter. Upon the addition of ProtK molecules to the cis chamber of the nanopore cell (to which the ground electrode is connected), application of −125 mV to the trans chamber results in spikes that indicate stochastic protein passage through the pore, as seen in the current trace in Fig. 1 b. Analysis of the current versus time trace yields the concatenated set of events shown in the figure. Using a 250 kHz bandwidth, 2- to 2.5-μs minimum dwell times are detectable.
Figure 1.
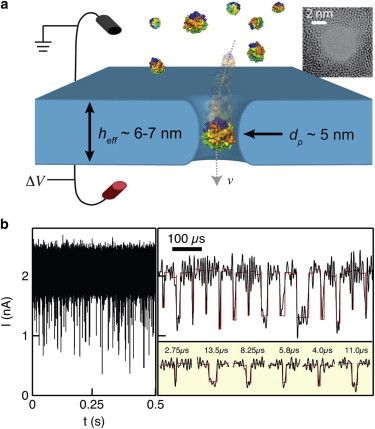
Protein detection using small solid-state nanopores. (a) Space-filling models of ProtK molecules electrophoretically driven through a 5-nm-diameter pore (electrodes not drawn to scale). (Inset) TEM image of a HfO2 pore used in these experiments. (b) Continuous 0.5 s current versus time trace of a 69 nM ProtK solution at V = −125 mV (data sampled at 4.19 MHz and digitally low-pass-filtered at 250 kHz). Concatenated set of analyzed events is shown on right (black), along with OpenNanopore rectangular fits (red). Dwell times for a selection of magnified events are indicated. To see this figure in color, go online.
Materials and Methods
Experimental setup
Ultrathin HfO2 membranes and nanopores in these membranes were fabricated as outlined in a previous study that demonstrated exceptional pore stability over many hours of experiments (40). Similar-sized ultrathin SiN pores (41) were fabricated for comparison using previously reported methods. Before the experiments, pores were treated with heated piranha (3:1 H2SO4/H2O2), followed by hot deionized water. Nanopore chips were then dried under vacuum, assembled in a PTFE cell, and sealed by painting with a quick-curing silicone elastomer gasket to reduce the capacitance to <100 pF (44). Electrolyte solution was then flowed using a syringe to hydrate both chambers (1 M KCl, 10 mM Tris, buffered to pH 8.1). Proteins were added to the cis chamber and thoroughly mixed to the indicated final concentrations. ProtK and RNase A samples were purchased from New England BioLabs (Ipswich, MA) or Thermo Scientific (Waltham, MA). All experiments were carried out at ambient room temperatures (23–25°C). For control experiments with DNA, 100 bp DNA (Fermentas NoLimits, Thermo Scientific) was added to the cis chamber to a final concentration of 500 nM.
Data collection and processing
Nanopore current signal was acquired continuously and digitally at a rate of 4.19 MS/s using a Chimera Instruments (New York, NY) amplifier (39). Before the introduction of a protein sample, several seconds of current data were collected at multiple voltages (ΔV) to verify the pore’s stability by checking that no spikes are observed. Data were digitally low-pass filtered at 250 kHz unless otherwise indicated, and subsequently analyzed using OpenNanopore, an open source translocation analysis software package developed by the Radenovic Group at EPFL (45). The code was modified to allow data import from the Chimera Intruments format. OpenNanopore fits each translocation event with a rectangular pulse (see Fig. 1 b and Supporting Material). Three key parameters are extracted from the data: the dwell time, td, which is the spike duration corresponding to the residence time of the protein in the pore; the current blockage, ΔI, which is the mean current excluded from the pore by the analyte; and the interevent waiting time, δt, from which protein capture rates are extracted.
Results and Discussion
Protein capture
As shown in Fig. 1 b, the addition of protein molecules to the cis chamber results in a stochastic set of current spikes that correspond to the stochastic presence of the protein in the pore. Fig. 2, a and b, shows representative snapshot current traces in the voltage range ±200 mV for ProtK and RNase, respectively. For both proteins, spikes appear only for negative voltages; the rare spikes at positive voltages are due to contamination. Another observation from the snapshot traces is that the spike rate increases with voltage magnitude, after which rates decrease for increasing voltages.
Figure 2.
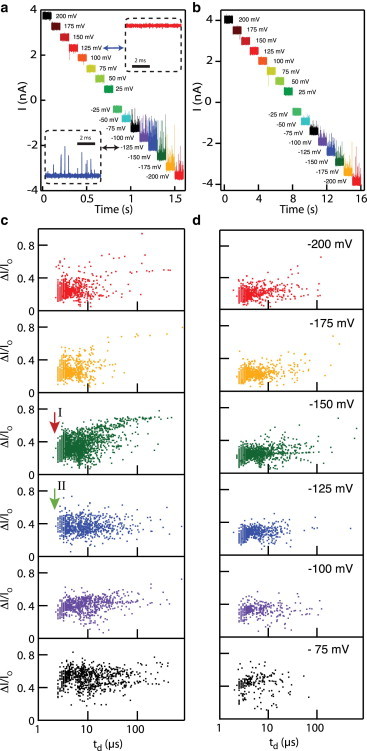
(a and b) Snapshot current traces for RNase (a) and ProtK (b) at various voltages in the range +200 mV to −200 mV ([KCl] = 1 M, pH 8.1, T = 25°C, low-pass filtered at 125 kHz for presentation only). (Insets) Current spikes for V < 0, indicating positive charges for both proteins. (c and d) Dwell time versus fractional current scatterplots for ProtK and RNase at the voltages indicated. Detected events become faster with voltage, and bandwidth limitations are clearly seen by arrows I (red) and II (green), where the ProtK population is more cut off by the 2.5 μs time resolution at −150 mV than at −125 mV, respectively. To see this figure in color, go online.
Although the pore/amplifier combination used here can detect shorter current pulses from proteins compared to combinations used in prior studies, our minimum time resolution of ∼2.5 μs also proves insufficient to detect all protein translocation events. This is illustrated in Fig. 2, c and d, which shows dwell time versus fractional current (ΔI/I0) scatterplots for ProtK and RNase at voltages in the range 75–200 mV, as indicated in the individual plots. Each datapoint on the scatterplot represents ΔI/I0 and td values for a single protein event. The scatterplots indicate a transition to being sharply bandwidth-limited for |ΔV| > 150 mV. This is indicated by the straight-line cutoff at td ∼ 2.5 μs. At this voltage, a majority of events have dwell times that are too short for our time resolution. For |ΔV| < 150 mV, however, the data appear significantly less bandwidth-limited, as we observe a bounded distribution instead of a strict cutoff (compare red and green arrows in Fig. 2 c). We also see that for the smaller of the two proteins, RNase, events are faster than ProtK events for similar voltages.
A quantitative representation is provided in Fig. 3 a, where normalized capture rates, RC/C0, are plotted for both proteins at various applied voltages. As shown in Eq. 2, flux is expected to be diffusion-dominated at a low bias and drift-dominated at increasing bias. As is common in nanopore experiments, we extracted RC values from single-exponential decay fits to our first arrival time distributions (46). Due to signal/noise limitations, we are not able to access the diffusion-dominated regime for protein capture that dominates at |ΔV| ∼ 0 (first term in Eq. 2). However, for both proteins, we find that RC/C0 increases linearly with voltage, then saturates and gradually declines at voltages above |ΔV| > 125 mV. Although this linear increase is expected in the drift-dominated regime (the second term in Eq. 2), declines in capture rates for higher voltages were not expected. However, judging from the shapes of the scatterplots in Fig. 2 for high voltages, these declines are clearly due to experimental limitations: as voltage increases, proteins traverse the pore with higher velocity, and more and more fast events are missed by our detector, resulting in smaller apparent capture rates.
Figure 3.
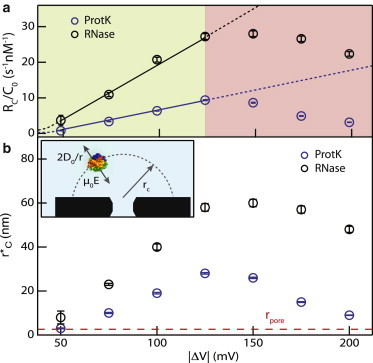
(a) Normalized mean capture rates in a 5.2-nm-diameter HfO2 pore as a function of V. (b) Corresponding Smoluchowski-based capture radii for both proteins (see text). To see this figure in color, go online.
To check whether our obtained protein capture rates are reasonable, we calculate from Smoluchowski-based protein arrival rates the effective radius of an absorbing hemisphere outside the nanopore. Rearranging the Smoluchowski rate equation, we calculate the effective radius, rC∗, of a perfectly absorbing pore, i.e., rC∗ = RC/(2πD0C0). We find that rC∗ > rp (Fig. 3 b, red dashed line) for all voltage values. The rationale for this result comes from the fact that the applied voltage creates an electric field outside the pore that assists the capture of charged biomolecules. Using a similar argument as for DNA (47), as a protein molecule undergoes Brownian diffusion near the pore, at some distance, r, from the pore, the electrophoretic drift velocity term overweighs the diffusional velocity term, i.e., μ0E > 2D0/r (where 2D0/r is the diffusional velocity term in the 1D direction opposite to the pore direction). This is depicted in the inset of Fig. 3 b, where rC is the hemisphere around which diffusional and electrophoretic terms are equal. Remarkably, our finding that rC∗ > rp is the first such result, to our knowledge, among protein detection works reported in the literature. Although rC∗ increases for increasing voltages at |ΔV| < 125 mV because of an increasing drift component outside the pore, it decreases with increasing voltage because of increasingly fast events. For comparison, in the work by Plesa et al., for proteins similar in size to those in our study, capture radii were found to be three to four orders of magnitude smaller than the pore radius (26)! These infinitesimal effective radii are a combined result of insufficient bandwidth and the use of pore sizes larger than those used in our study, as discussed in the Introduction.
Protein transport
Our investigation of the capture process revealed efficient protein detection. However, it remains to be seen whether our obtained dwell-time distributions are sufficient to distinguish differences in translocation patterns between two proteins. Following the work of others (13,28), with a minor correction (29,30), we fit dwell-time distributions to a first-passage-time distribution derived from the 1D drift-diffusion model of Eq. 1, where heff is the effective height of the pore, 7 nm in this case (see the Supporting Material), D is the diffusion coefficient of the protein during its transport through the pore, and v is the drift velocity of the protein. A naive value to use for D is its bulk-solution diffusion constant, D0, which can be estimated using available models to be 87.5 nm2/μs and 124 nm2/μs for ProtK and RNase, respectively (48). However, prior studies of protein diffusion through porous media have yielded diffusion constants that are reduced significantly compared to bulk values. An empirical equation developed by Renkin for protein diffusion in a porous medium is given by (49,50)
| (3) |
where D is the diffusion constant of the protein in the pore, D0 is its diffusion constant in free solution, rs is the Stokes radius of the protein, and rp is the pore radius. We stress that Eq. 3 is only valid in the regime rs/rp < 0.4, i.e., for pores that are at least 2.5 times larger than the proteins (51,52). Although the Renkin equation is clearly not valid for estimating D in our experiments (rs/rp ∼ 0.8–0.9), a gross estimation of D using measured values for rs (see the Supporting Material) reveals that D can be reduced in our pores by as much as two to three orders of magnitude for our proteins.
We point to the Renkin equation, which has been experimentally validated (53), to illustrate that there is no reason to expect D to be equal to its bulk value in the nanopore. In addition, our data shown in Fig. 2 and the data summary in Fig. 3 point to efficient protein detection, indicating that we are capturing a substantial portion of the dwell-time distributions. Therefore, rather than using bulk D values for fitting dwell-time distributions to Eq. 1, we have allowed both D and v to be free parameters. Sample dwell-time distributions for both ProtK and RNase are shown in Fig. 4, a and b, respectively, along with fits to the distributions for both free (calculated, D) and fixed (least-squares optimized, D0) values (see the Supporting Material for complete sets of distributions). We note that the dwell-time distributions show that the durations ofsome events faster than 2.5 μs may be overestimated, resulting in pile-up in the briefest-histogram time bins. Upon integration of the fits to Eq. 1, we can compute the estimated fraction of detected events (Fobs) in each experiment, which ranged from 70% to 90% for ProtK and from 30% to 80% for RNase (see the Supporting Material). Our optimized fits yielded D = 2.0 ± 0.2 nm2/μs for ProtK at all voltages in the range 75–200 mV, smaller by a factor of ∼44 than its bulk D0 value of 87.5 nm2/μs. For RNase, we obtained a consistent value of D = 2.5 ± 1.3 nm2/μs, smaller by a factor of ∼50 than its bulk value of D0 = 124 nm2/μs (48).
Figure 4.
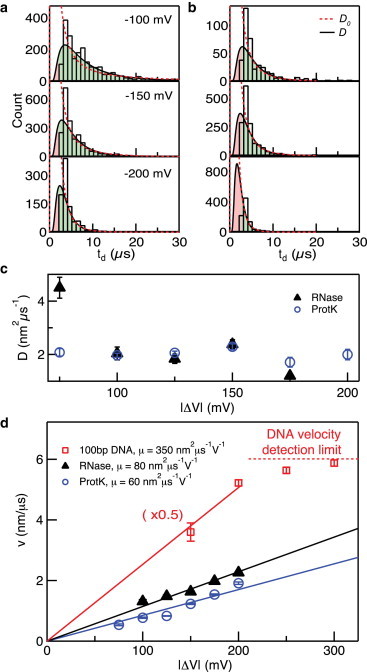
(a and b) Dwell-time distributions for ProtK (a) and RNase (b) at selected voltages, along with fits to Eq. 1 with D and v as free parameters (black line) and constrained fits for bulk D0 values (dashed red line). Missed regimes shaded red in distributions. (c) Diffusion coefficients (D) obtained for the proteins from the fits to Eq. 1. (d) Drift velocity (v) versus voltage (V) for ProtK, RNase, and 100 bp dsDNA. Linear fits are used to extract electrophoretic mobility (μ) values, as indicated in legend. DNA data are scaled by 0.5×, and dashed line represents resolution limits of our system (see text). To see this figure in color, go online.
In addition to extracting the values of D, our fits yield values for the drift velocity, v. Fig. 4, c and d, shows extracted diffusion coefficients (D) and drift velocities (v), respectively, with voltage for ProtK and RNase passing through the same HfO2 pore. Linear dependence was found for both proteins, as expected for an electrophoretic transport process where v = μE. Assuming that the applied voltage drops entirely across the length of the pore, i.e., E ≈ |ΔV|/heff, multiplying the slopes of the lines in Fig. 4 d by heff yields in-pore electrophoretic mobilities of μRNase = 80 ± 2 nm2 μs−1 V−1 and μProtK = 60 ± 3 nm2 μs−1 V−1. Finally, when these mobilities are compared to a 100 bp double-stranded DNA molecule tested through an HfO2 pore with a geometry nearly the same as that of the nanopore used in this study (d = 5 nm, heff = 7 nm; see the Supporting Material), DNA mobility was 350 ± 14 nm2 μs−1 V−1, approximately four times larger than for the proteins (see Fig. 4 d). In addition, D values for the DNA molecule were in the range 4–7 nm2/μs. Although this value for DNA mobility is larger than for the proteins due to its increased charge density, it is still ∼100 times smaller than the free solution drift velocity for 100 bp DNA (3.6–4.5 × 10⁴ nm2 μs−1 V−1) (54), indicating restricted mobility through the pore due to confinement and wall interactions (40). Finally, determination of the drift velocity for DNA at voltages >200 mV proved challenging due to the insufficient time resolution of our system: with a contour length of ∼30 nm for 100 bp DNA and a 2.5 μs time resolution, detection of drift velocities >12 nm/μs is difficult (Fig. 4 d, red dashed line).
Generally, the connection between the mobility and the diffusion constant of a charged object is given by the Einstein-Smoluchowski relation (qD = μkBT). Given this relationship and prior evidence of reduced D in porous systems, we suggest that a possible mechanism for the reduced D is pore-protein interaction. For a molecule to move a distance comparable to its diameter along the pore, we assume that it hops over a free energy barrier, U. Furthermore, we take U as the net binding energy between the protein molecule and the pore. During transport of a protein molecule through a small pore, interactions with the pore walls may effectively inhibit the diffusion coefficient, D, within the pore from its bulk value (D0) according to
| (4) |
In this simplistic Kramers model, D is reduced by interactions with the pore, yet confinement effects are assumed to be independent of applied voltage. This assumption is reasonable for a weakly charged protein in the low-voltage regime. Solving for U using the reduced D values of 2.0 ± 0.2 nm2/μs and 2.5 ± 1.3 nm2/μs for ProtK and RNase, respectively, we obtain protein-pore interaction energies of 9 ± 0.25 kJ/mol for ProtK and 9.5 ± 1.3 kJ/mol for RNase. In a similar way, for the SiN pore, our obtained D values of 1.4 ± 0.5 nm2/μs and 0.9 ± 0.3 nm2/μs for ProtK and RNase yield interaction energies of 10 ± 0.9 kJ/mol and 12 ± 0.8 kJ/mol, respectively (see the Supporting Material). Remarkably, irrespective of the pore material, D values were nearly 50 times smaller than their bulk D0 values (as indicated above).
As stated previously, our presented model in Eq. 4 assumes independence of D from applied voltage. Furthermore, in our fit of dwell-time distributions to Eq. 1, D and v were both free parameters, and no assumptions or constraints were imposed on their limits or trend. To investigate this, we present in Fig. 5 a scatterplot of calculated mobilities, μ∗, for each experiment conducted (given by vheff/ΔV) versus obtained D values. Data are included from several nanopores of similar dimensions, as indicated in the legend. Apart from a single data point corresponding to RNase at −75 mV (Fig. 5, red dashed circle), our data show D and μ∗ values that are robust to within 50% for each pore, which does not contradict our model in Eq. 4.
Figure 5.
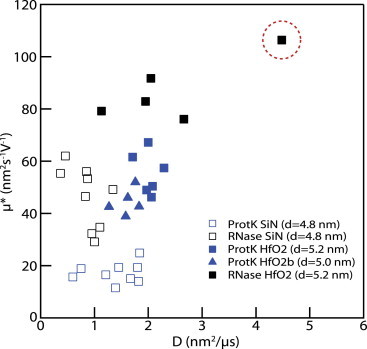
Scatterplots of in-pore electrophoretic mobilities, calculated for each experiment as μ∗ = vheff/ΔV, versus in-pore diffusion coefficients, D (where D and v, are extracted from two-parameter fits to Eq. 1; see text). Compiled results for experiments in different HfO2 and SiN pores and different voltages are shown. Apart from an outlier for RNase at −75 mV (dashed circle), the data suggest voltage-independent values of μ and D in the range tested. To see this figure in color, go online.
Protein volume measurements
Extracting volumetric information using resistive pulse measurements is a decades-old technique. In the 1970s, DeBlois and Bean developed a quantitative theory for obtaining volumetric particle information from resistive pulse data (55). Since then, Ito et al. (56) have applied this theory for measuring particle diameters that are a factor of 2–3 smaller than the pore diameter. Later, Han et al. (57) applied the theory for measuring proteins that are a factor of 4–5 smaller than the pore diameter. Borrowing on this theory, protein diameters can be estimated from the current-blockage data based on
| (5) |
where dm is the protein diameter, dp is the pore diameter, and ΔI/I0 is the ratio of the statistical mean blocked current for each experiment to the mean open-pore current level, respectively. Note that the term (heff + 0.8dp) is used as a correction factor, because in our case dp ≈ heff (55).
Distributions of ΔI/I0 for both ProtK and RNase at ΔV = −125 mV are shown in Fig. 6 for two different experiments in two pores of different composition but similar geometry. For the HfO2 pore studied (Fig. 6 a), we observed two distinct populations, with a minor population (5–10%) attributed to stuck or aggregated proteins occurring at higher ΔI/I0 values. Therefore, double-Gaussian distributions were used to fit to the ΔI/I0 distributions, although the mean ± SE width of the ΔI/I0 dominant distributions were used for our calculations. Volumes of the proteins based on a Vorlume solvent-accessible model are also indicated in the figure, along with to-scale Protein Data Bank structures (58). Applying Eq. 5, our measurements yield 4.8 ± 0.45 nm and 4.1 ± 0.45 nm for ProtK and RNase, respectively. For comparison with the SiN pore, our measurements yield 4.6 ± 0.35 nm and 4.2 ± 0.35 nm for ProtK and RNase, respectively. Error bars for these calculations were based on the half-width at half-maximum (HWHM) for the distributions. Independent measurements of the hydrodynamic radii (see the Supporting Material) yielded 4.76 ± 0.05 nm and 3.68 ± 0.03 nm for ProtK and RNase, respectively (see the Supporting Material). We were somewhat surprised to find that these values are within the error of our nanopore measurements. Moreover, the derived volumes deviate in the two pores by 5% for both ProtK and RNase, which can be attributed to subtle differences in nanopore geometry. Further, considering the small differences in geometry between the two pores, it is evident that pore material composition does not significantly impact volumetric measurement.
Figure 6.
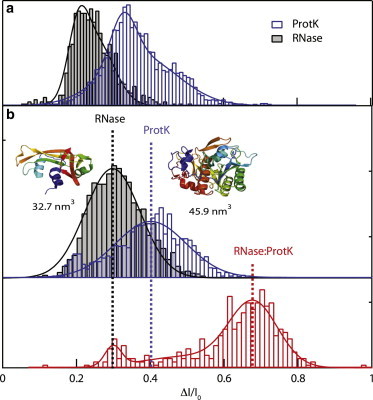
Volumetric measurement of proteins using nanopores. (a) Fractional current amplitude distributions for RNase and ProtK in an HfO2 pore at −125 mV. (b) Fractional current blockage for the same proteins in an SiN pore (upper), and PDB-based cartoons of the proteins and their corresponding Vorlume-based solvent-accessible volumes. When the proteins are mixed at equal stoichiometry, a third peak with a deeper fractional blockage emerges, corresponding to an RNase/ProtK complex (red, lower). To see this figure in color, go online.
Further confirmation of our volumetric measurements is given by our pore-based detection of a ProtK/RNase complex. To obtain the complex, we have added to the cis chamber a preformed sample of ProtK and RNase with 1:1 stoichiometry. Although the two proteins are both positively charged, the complex is known to form, as RNase is a common substrate for ProtK-based RNase digestion. After confirmation using dynamic light-scattering experiments that the complex forms at 1 M KCl (see the Supporting Material), the nanopore experiments shown in Fig. 6 b reveal a third ΔI/I0 level that is deeper than the levels of the individual proteins. Since complex formation is not quantitative, some uncomplexed proteins may be present in the sample, and the population fits well to a three-Gaussian distribution (see Fig. 6 b, red curve), although the dominant population represents the complex. For the complex, we obtain D and v values of 0.04 ± 0.006 nm2/μs and 1 ± 0.9 nm2 μs−1 V−1, both parameters over an order of magnitude smaller than the corresponding values for the isolated proteins (see the Supporting Material). This can be explained by the fact that the complex is slightly larger than the pore dimensions, which sterically retards its transport through the pore. Although previous studies have yielded translocation signatures of complexed or aggregated proteins, to our knowledge this is the first to observe a completely separate population due to a protein complex (20,57,59).
Conclusions
We have demonstrated here that by combining a high-bandwidth current measurement platform with small and ultrathin solid-state nanopores, sub-30 kDa proteins and their complexes can be efficiently detected and analyzed. ProtK and RNase A, two proteins of different molecular weight and isoelectric points, were compared in this study both to each other and to a complex of the two proteins. A comparison of our capture-rate data to results summarized by Plesa et al reveals an effective capture radius that is larger than the pore diameter, indicating efficient detection that worsens above a critical voltage of −125 mV due to bandwidth limitations. Application of a 1D diffusion-drift model to the dwell-time distributions revealed distinctly different in-pore electrophoretic mobilities and diffusion coefficients for the two proteins. Diffusion is reduced by nearly two orders of magnitude in the confinement of the pore, in qualitative agreement with Renkin theory. We have suggested a straightforward Kramers model that accounts for reduced diffusion via interaction of the protein with the pore. Our model yields similar energies of interaction on the order of 10 kJ/mol for similar-geometry pores fabricated in SiN and HfO2. Further, in-pore electrophoretic mobilities extracted for the two proteins consistently reveal higher mobilities for RNase than for ProtK, as confirmed in SiN and HfO2 pores. However, mobility values are reduced by one to two orders of magnitude for all biomolecules tested here, as also found in DNA transport through larger pores to be due to hydrodynamic forces (60). Electro-osmotic flow (EOF) can indeed impact translocation, and it was previously observed to be the driving factor for protein translocation, even against electrophoresis (18). However, similar to SiN pores, at the pH in our experiment, HfO2 has a weak negative surface-charge density (<0.02 C/m2) (61), which corresponds to <0.15 e/nm2. We therefore expect convective effects from electro-osmosis to be insignificant compared to electrophoretic forces on sample proteins. Further, although varying the pH can be used to assess more quantitatively the charge properties of the protein (57), such methods also affect the charge properties of the pore (18), which needs to be independently investigated. Finally, volumetric measurements of the two proteins using Coulter theory developed by DeBlois and Bean show that measured protein diameters coincide well with hydrodynamic diameters obtained from dynamic light-scattering measurements. Although further experiments with various proteins are necessary to establish the robustness of this volumetric measurement, discrimination of isolated proteins from their RNase/ProtK complexes highlights the protein size sensitivity of our measurements. Future experiments may focus on measurement of other proteins, detection of conformational changes in proteins, the effects of electrolyte strength and pH on the measurements, and strategies to reduce the capacitance-induced noise of our membranes to enable higher-bandwidth measurements.
Acknowledgments
We thank Doug Mankiewicz from Brookhaven Instruments for light-scattering measurements, Carolyn Shasha for assistance with analysis code, and Brant Rumberger for proofreading the manuscript.
This work was funded by grants from the National Institutes of Health (R21-HG006873 to M.W. and R01-HG005871 and R01-HG002776 to M.M.), the National Science Foundation (DMR 1105362 to M.M.), and the Air Force Office of Scientific Research (FA9550-10-1-0159 to M.M.). The authors declare the following competing financial interest(s): JKR is a principal in Chimera Instruments.
Supporting Material
References
- 1.Movileanu L. Single-molecule detection of proteins using nanopores. In: Barth F.G., Humphrey J.A.C., Srinivasan M.V., editors. Frontiers in Sensing: From Biology to Engineering. Springer-Verlag; Vienna, Austria: 2012. pp. 363–381. [Google Scholar]
- 2.Gu L.Q., Braha O., Bayley H. Stochastic sensing of organic analytes by a pore-forming protein containing a molecular adapter. Nature. 1999;398:686–690. doi: 10.1038/19491. [DOI] [PubMed] [Google Scholar]
- 3.Xie H.Z., Braha O., Bayley H. Single-molecule observation of the catalytic subunit of cAMP-dependent protein kinase binding to an inhibitor peptide. Chem. Biol. 2005;12:109–120. doi: 10.1016/j.chembiol.2004.11.013. [DOI] [PubMed] [Google Scholar]
- 4.Siwy Z., Trofin L., Martin C.R. Protein biosensors based on biofunctionalized conical gold nanotubes. J. Am. Chem. Soc. 2005;127:5000–5001. doi: 10.1021/ja043910f. [DOI] [PubMed] [Google Scholar]
- 5.Sexton L.T., Horne L.P., Martin C.R. Resistive-pulse studies of proteins and protein/antibody complexes using a conical nanotube sensor. J. Am. Chem. Soc. 2007;129:13144–13152. doi: 10.1021/ja0739943. [DOI] [PubMed] [Google Scholar]
- 6.Sanchez-Quesada J., Ghadiri M.R., Braha O. Cyclic peptides as molecular adapters for a pore-forming protein. J. Am. Chem. Soc. 2000;122:11757–11766. [Google Scholar]
- 7.Sutherland T.C., Long Y.-T., Lee J.S. Structure of peptides investigated by nanopore analysis. Nano Lett. 2004;4:1273–1277. [Google Scholar]
- 8.Movileanu L., Schmittschmitt J.P., Bayley H. Interactions of peptides with a protein pore. Biophys. J. 2005;89:1030–1045. doi: 10.1529/biophysj.104.057406. [DOI] [PMC free article] [PubMed] [Google Scholar]
- 9.Wolfe A.J., Mohammad M.M., Movileanu L. Catalyzing the translocation of polypeptides through attractive interactions. J. Am. Chem. Soc. 2007;129:14034–14041. doi: 10.1021/ja0749340. [DOI] [PubMed] [Google Scholar]
- 10.Goodrich C.P., Kirmizialtin S., Movileanu L. Single-molecule electrophoresis of β-hairpin peptides by electrical recordings and Langevin dynamics simulations. J. Phys. Chem. B. 2007;111:3332–3335. doi: 10.1021/jp071364h. [DOI] [PubMed] [Google Scholar]
- 11.Oukhaled G., Mathé J., Auvray L. Unfolding of proteins and long transient conformations detected by single nanopore recording. Phys. Rev. Lett. 2007;98:158101. doi: 10.1103/PhysRevLett.98.158101. [DOI] [PubMed] [Google Scholar]
- 12.Stefureac R.I., Lee J.S. Nanopore analysis of the folding of zinc fingers. Small. 2008;4:1646–1650. doi: 10.1002/smll.200800585. [DOI] [PubMed] [Google Scholar]
- 13.Talaga D.S., Li J.L. Single-molecule protein unfolding in solid state nanopores. J. Am. Chem. Soc. 2009;131:9287–9297. doi: 10.1021/ja901088b. [DOI] [PMC free article] [PubMed] [Google Scholar]
- 14.Freedman K.J., Jürgens M., Kim M.J. Chemical, thermal, and electric field induced unfolding of single protein molecules studied using nanopores. Anal. Chem. 2011;83:5137–5144. doi: 10.1021/ac2001725. [DOI] [PubMed] [Google Scholar]
- 15.Merstorf C., Cressiot B., Pelta J. Wild type, mutant protein unfolding and phase transition detected by single-nanopore recording. ACS Chem. Biol. 2012;7:652–658. doi: 10.1021/cb2004737. [DOI] [PubMed] [Google Scholar]
- 16.Rodriguez-Larrea D., Bayley H. Multistep protein unfolding during nanopore translocation. Nat. Nanotechnol. 2013;8:288–295. doi: 10.1038/nnano.2013.22. [DOI] [PMC free article] [PubMed] [Google Scholar]
- 17.Fologea D., Ledden B., Li J. Electrical characterization of protein molecules by a solid-state nanopore. Appl. Phys. Lett. 2007;91:539011–539013. doi: 10.1063/1.2767206. [DOI] [PMC free article] [PubMed] [Google Scholar]
- 18.Firnkes M., Pedone D., Rant U. Electrically facilitated translocations of proteins through silicon nitride nanopores: conjoint and competitive action of diffusion, electrophoresis, and electroosmosis. Nano Lett. 2010;10:2162–2167. doi: 10.1021/nl100861c. [DOI] [PubMed] [Google Scholar]
- 19.Han A., Schürmann G., Hegelbach N.G. Sensing protein molecules using nanofabricated pores. Appl. Phys. Lett. 2006;88:093901. [Google Scholar]
- 20.Yusko E.C., Prangkio P., Mayer M. Single-particle characterization of Aβ oligomers in solution. ACS Nano. 2012;6:5909–5919. doi: 10.1021/nn300542q. [DOI] [PMC free article] [PubMed] [Google Scholar]
- 21.Nivala J., Marks D.B., Akeson M. Unfoldase-mediated protein translocation through an α-hemolysin nanopore. Nat. Biotechnol. 2013;31:247–250. doi: 10.1038/nbt.2503. [DOI] [PMC free article] [PubMed] [Google Scholar]
- 22.Jetha N.N., Semenchenko V., Marziali A. Nanopore analysis of wild-type and mutant prion protein (PrPC): single molecule discrimination and PrPC kinetics. PLoS ONE. 2013;8:e54982. doi: 10.1371/journal.pone.0054982. [DOI] [PMC free article] [PubMed] [Google Scholar]
- 23.Niedzwiecki D.J., Iyer R., Movileanu L. Sampling a biomarker of the human immunodeficiency virus across a synthetic nanopore. ACS Nano. 2013;7:3341–3350. doi: 10.1021/nn400125c. Erratum in ACS Nano. 2013. 7:3731. [DOI] [PMC free article] [PubMed] [Google Scholar]
- 24.Kowalczyk S.W., Kapinos L., Dekker C. Single-molecule transport across an individual biomimetic nuclear pore complex. Nat. Nanotechnol. 2011;6:433–438. doi: 10.1038/nnano.2011.88. [DOI] [PubMed] [Google Scholar]
- 25.Oukhaled A., Cressiot B., Pelta J. Dynamics of completely unfolded and native proteins through solid-state nanopores as a function of electric driving force. ACS Nano. 2011;5:3628–3638. doi: 10.1021/nn1034795. [DOI] [PubMed] [Google Scholar]
- 26.Plesa C., Kowalczyk S.W., Dekker C. Fast translocation of proteins through solid state nanopores. Nano Lett. 2013;13:658–663. doi: 10.1021/nl3042678. [DOI] [PMC free article] [PubMed] [Google Scholar]
- 27.Li J., Talaga D.S. The distribution of DNA translocation times in solid-state nanopores. J. Phys. Condens. Matter. 2010;22:454129. doi: 10.1088/0953-8984/22/45/454129. [DOI] [PMC free article] [PubMed] [Google Scholar]
- 28.Talaga D.S., Li J. Single-molecule protein unfolding in solid state nanopores. J. Am. Chem. Soc. 2009;131:9287–9297. doi: 10.1021/ja901088b. Erratum in J. Am. Chem. Soc. 2013. 135:13220. [DOI] [PMC free article] [PubMed] [Google Scholar]
- 29.Ling D.Y., Ling X.S. On the distribution of DNA translocation times in solid-state nanopores: an analysis using Schrödinger’s first-passage-time theory. J. Phys. Condens. Matter. 2013;25:375102. doi: 10.1088/0953-8984/25/37/375102. [DOI] [PMC free article] [PubMed] [Google Scholar]
- 30.Muthukumar M. CRC Press; Boca Raton, FL: 2011. Polymer Translocation. [Google Scholar]
- 31.Pedone D., Firnkes M., Rant U. Data analysis of translocation events in nanopore experiments. Anal. Chem. 2009;81:9689–9694. doi: 10.1021/ac901877z. [DOI] [PubMed] [Google Scholar]
- 32.Li W., Bell N.A.W., Keyser U.F. Single protein molecule detection by glass nanopores. ACS Nano. 2013;7:4129–4134. doi: 10.1021/nn4004567. [DOI] [PubMed] [Google Scholar]
- 33.Smoluchowski M.v. Attempt on a mathematical theory for coagulation kinetics. Z. Phys. Chem. 1917;92:129–168. [Google Scholar]
- 34.Grosberg A.Y., Rabin Y. DNA capture into a nanopore: interplay of diffusion and electrohydrodynamics. J. Chem. Phys. 2010;133:165102. doi: 10.1063/1.3495481. [DOI] [PubMed] [Google Scholar]
- 35.Di Fiori N., Squires A., Meller A. Optoelectronic control of surface charge and translocation dynamics in solid-state nanopores. Nat. Nanotechnol. 2013;8:946–951. doi: 10.1038/nnano.2013.221. [DOI] [PMC free article] [PubMed] [Google Scholar]
- 36.Fologea D., Uplinger J., Li J. Slowing DNA translocation in a solid-state nanopore. Nano Lett. 2005;5:1734–1737. doi: 10.1021/nl051063o. [DOI] [PMC free article] [PubMed] [Google Scholar]
- 37.Rosenstein J.K., Wanunu M., Shepard K.L. Integrated nanopore sensing platform with sub-microsecond temporal resolution. Nat. Methods. 2012;9:487–492. doi: 10.1038/nmeth.1932. [DOI] [PMC free article] [PubMed] [Google Scholar]
- 38.Chen C.H., Yemenicioglu S., Theogarajan L. A CMOS enhanced solid-state nanopore based single molecule detection platform. Conf. IEEE Eng. Med. Biol. Soc. 2013;2013:164–167. doi: 10.1109/EMBC.2013.6609463. [DOI] [PubMed] [Google Scholar]
- 39.Venta K., Shemer G., Drndić M. Differentiation of short, single-stranded DNA homopolymers in solid-state nanopores. ACS Nano. 2013;7:4629–4636. doi: 10.1021/nn4014388. [DOI] [PMC free article] [PubMed] [Google Scholar]
- 40.Larkin J., Henley R., Wanunu M. Slow DNA transport through nanopores in hafnium oxide membranes. ACS Nano. 2013;7:10121–10128. doi: 10.1021/nn404326f. [DOI] [PMC free article] [PubMed] [Google Scholar]
- 41.Wanunu M., Dadosh T., Drndić M. Rapid electronic detection of probe-specific microRNAs using thin nanopore sensors. Nat. Nanotechnol. 2010;5:807–814. doi: 10.1038/nnano.2010.202. [DOI] [PubMed] [Google Scholar]
- 42.Ebeling W., Hennrich N., Lang H. Proteinase K from Tritirachium-album Limber. Eur. J. Biochem. 1974;47:91–97. doi: 10.1111/j.1432-1033.1974.tb03671.x. [DOI] [PubMed] [Google Scholar]
- 43.Tanford C., Hauenstein J.D. Hydrogen ion equilibria of ribonuclease1. J. Am. Chem. Soc. 1956;78:5287–5291. [Google Scholar]
- 44.Tabard-Cossa V., Trivedi D., Marziali A. Noise analysis and reduction in solid-state nanopores. Nanotechnology. 2007;18:305505. [Google Scholar]
- 45.Raillon C., Granjon P., Radenovic A. Fast and automatic processing of multi-level events in nanopore translocation experiments. Nanoscale. 2012;4:4916–4924. doi: 10.1039/c2nr30951c. [DOI] [PubMed] [Google Scholar]
- 46.Meller A., Branton D. Single molecule measurements of DNA transport through a nanopore. Electrophoresis. 2002;23:2583–2591. doi: 10.1002/1522-2683(200208)23:16<2583::AID-ELPS2583>3.0.CO;2-H. [DOI] [PubMed] [Google Scholar]
- 47.Wanunu M., Morrison W., Meller A. Electrostatic focusing of unlabelled DNA into nanoscale pores using a salt gradient. Nat. Nanotechnol. 2010;5:160–165. doi: 10.1038/nnano.2009.379. [DOI] [PMC free article] [PubMed] [Google Scholar]
- 48.He L., Niemeyer B. A novel correlation for protein diffusion coefficients based on molecular weight and radius of gyration. Biotechnol. Prog. 2003;19:544–548. doi: 10.1021/bp0256059. [DOI] [PubMed] [Google Scholar]
- 49.Renkin E.M. Filtration, diffusion, and molecular sieving through porous cellulose membranes. J. Gen. Physiol. 1954;38:225–243. [PMC free article] [PubMed] [Google Scholar]
- 50.Iberall A.S., Schindler A.M. A kinetic theory, near-continuum model for membrane transport. Ann. Biomed. Eng. 1973;1:489–497. doi: 10.1007/BF02367272. [DOI] [PubMed] [Google Scholar]
- 51.Stewart Kent K. Thin film dialysis. In: Anfinsen C.B., editor. Advances in Protein Chemistry. Academic Press; New York: 1977. pp. 135–182. [DOI] [PubMed] [Google Scholar]
- 52.Cervera J., Ramirez P., Mafe S. Incorporating ionic size in the transport equations for charged nanopores. Microfluid. Nanofluid. 2010;9:41–53. [Google Scholar]
- 53.Nikaido H., Rosenberg E.Y. Effect of solute size on diffusion rates through the transmembrane pores of the outer membrane of Escherichia coli. J. Gen. Physiol. 1981;77:121–135. doi: 10.1085/jgp.77.2.121. [DOI] [PMC free article] [PubMed] [Google Scholar]
- 54.Stellwagen N.C., Gelfi C., Righetti P.G. The free solution mobility of DNA. Biopolymers. 1997;42:687–703. doi: 10.1002/(SICI)1097-0282(199711)42:6<687::AID-BIP7>3.0.CO;2-Q. [DOI] [PubMed] [Google Scholar]
- 55.DeBlois R.W., Bean C.P. Counting and sizing of submicron particles by the resistive pulse technique. Rev. Sci. Instrum. 1970;41:909–916. [Google Scholar]
- 56.Ito T., Sun L., Crooks R.M. Simultaneous determination of the size and surface charge of individual nanoparticles using a carbon nanotube-based Coulter counter. Anal. Chem. 2003;75:2399–2406. doi: 10.1021/ac034072v. [DOI] [PubMed] [Google Scholar]
- 57.Han A., Creus M., Staufer U. Label-free detection of single protein molecules and protein-protein interactions using synthetic nanopores. Anal. Chem. 2008;80:4651–4658. doi: 10.1021/ac7025207. [DOI] [PubMed] [Google Scholar]
- 58.Cazals F., Kanhere H., Loriot S. Computing the volume of a union of balls: a certified algorithm. ACM Trans. Math. Softw. 2011;38:3. [Google Scholar]
- 59.Freedman K.J., Bastian A.R., Kim M.J. Solid-state nanopore detection of protein complexes: applications in healthcare and protein kinetics. Small. 2013;9:750–759. doi: 10.1002/smll.201201423. [DOI] [PubMed] [Google Scholar]
- 60.van Dorp S., Keyser U.F., Lemay S.G. Origin of the electrophoretic force on DNA in solid-state nanopores. Nat. Phys. 2009;5:347–351. [Google Scholar]
- 61.Kosmulski M. Attempt to determine pristine points of zero charge of Nb2O5, Ta2O5, and HfO2. Langmuir. 1997;13:6315–6320. [Google Scholar]
Associated Data
This section collects any data citations, data availability statements, or supplementary materials included in this article.