

Abstract
The programmed formation of specific tissues from embryonic stem cells is a major goal of regenerative medicine. To identify points of intervention in cardiac tissue formation, we performed an siRNA screen in murine embryonic stem cells to identify ubiquitin system genes that repress cardiovascular tissue formation. Our screen uncovered an F-box protein, Fbxl16, as a repressor of one of the earliest steps in the cardiogenic lineage: FLK1+ progenitor formation. Whereas F-box proteins typically form SCF ubiquitin ligases, shotgun mass spectrometry revealed that FBXL16 instead binds protein phosphatase 2A (PP2A) containing a B55 specificity subunit (PP2AB55). Phosphoproteomic analyses indicate that FBXL16 negatively regulates phosphorylation of the established PP2AB55 substrate, vimentin. We suggest that FBXL16 negatively regulates the activity of B55α-PP2A to modulate the genesis of FLK1+ progenitor cells.
Recent attention has been directed toward understanding how embryonic stem cell (ESC)1 differentiation in vitro can be manipulated to generate large quantities of specific cell types for the repair of damaged tissues, such as myocardium (1, 2). Though the field of stem cell biology has recently made significant advances in this direction, it has become clear that a complex interplay of multiple signaling networks guides stem cell fate, and thus it will be necessary to develop a deeper understanding of how ESC signaling networks are deployed during differentiation to harness the full therapeutic potential of ESCs (3).
A less well-characterized example of a cellular network that governs ESC biology and differentiation is the ubiquitin-proteasome system (UPS), which constitutes a major mechanism for the post-translational regulation of protein function and stability in all eukaryotic cells. For example, ubiquitination of H2A by RING1Β/RNF2, a core member of the polycomb repressive complex, has been shown to contribute to the stable maintenance of ESC identity (4, 5). The UPS plays a critical role in numerous regulatory pathways that are germane to stem cell biology, including those involved in cell proliferation, cell differentiation, and cell death. We hypothesized that critical regulatory switches modulated by the UPS are likely to exist in the complex molecular choreography that enables an ESC to differentiate into a broad range of target cell types. By analogy to DNA damage signaling by p53, hypoxia signaling by HIF-1α, and WNT signaling by β-catenin, these might involve the selective stabilization and accumulation of transcription factors or other molecules that specify cell fate (6–9). For example, consider hypoxic signaling by HIF-1α. In oxygenated cells, HIF-1α is hydroxylated on proline, which specifies binding to a ubiquitin ligase, leading to its continuous, rapid turnover. However, upon oxygen starvation, HIF-1α is not ubiquitinated and degraded but accumulates to switch on a battery of genes that reprogram metabolism and promote the formation of blood vessels. We sought to test whether constitutive degradation of a cardiogenic factor restricts cardiogenesis in ESCs by screening for components of the UPS that, upon their depletion by siRNA, lead to excess differentiation of ESCs into cardiovascular progenitor cells. Although this process occurs spontaneously in ESCs that have been cultured in the absence of leukemia inhibitory factor, normally only a very small fraction of ESCs convert into cardiovascular tissue (1). This limits the potential usefulness of ESCs or induced pluripotent stem cells to generate cells such as cardiomyocytes for the repair of damaged heart muscle. The results of the studies outlined here implicate the F-box protein FBXL16 as a repressor of cardiovascular progenitor cell differentiation.
F-box proteins are best known for their role as substrate receptors of SCF ubiquitin ligases (10). However, a few examples of F-box proteins that do not assemble into SCF ubiquitin ligases have been described. Yeast RCY1 forms a complex with SKP1 that modulates endosome to Golgi transport but does not assemble with yeast CUL1 (11). In human cells, it has been reported that FBXO45 associates with PAM, a ring-finger ubiquitin ligase, rather than forming an SCF complex (12). However, whether FBXO45 forms an SCF complex remains controversial, given that degradation of the FBXO45 substrate p73 is dependent on CUL1 (13), and we identified FBXO45 as a CUL1-binding protein (14). Here we identify FBXL16 as a mammalian F-box protein that does not appear to assemble into an SCF ubiquitin ligase. Instead, FBXL16 was found to bind and regulate the function of protein phosphatase 2A (PP2A), a heterotrimeric serine phosphatase that has diverse biological functions including modulation of TGFβ signaling and cell cycle control (15). Our findings uncover both a putative regulator of PP2A and an unexpected noncanonical function for an F-box protein, and they may enable the development of cell-based therapies for the repair of damaged myocardium.
EXPERIMENTAL PROCEDURES
Screen Design
Mouse ESCs expressing GFP under the control of the αMHC promoter (16) were plated in all wells of gelatin-coated 384 multiwell plates, and each well (except for the outside two rows and columns around the perimeter, to minimize edge effects) was treated with a pool of four siRNAs (Qiagen, Valencia, CA) targeting a single member of the UPS. The total area of GFP expression (a metric for cardiomyocyte differentiation for this cell line) was then measured via automated microscopy on a Molecular Devices ImageXpress Automated Acquisition and Analysis System after the ESCs had been allowed to differentiate for 12 days. All siRNA pools were tested in duplicate wells that were located in different regions of the same plate. The threshold for classifying an siRNA as a positive hit was that GFP expression in each of the duplicate wells had to exceed that seen for control luciferase siRNA-treated wells as well as the mean GFP expression observed for the respective plate by ≥2 standard deviations (S.D.). We also considered candidates when one duplicate exceeded the comparators by ≥3 S.D. and the other by ≥1 S.D. Positive hits were subject to a secondary screen that employed the individual siRNAs constituting the active pools from the primary screen.
Cell Culture
αMHC-GFP reporter ESCs, DTC26 (kindly provided by Dr. Richard Lee (16)), were propagated on 0.1% gelatin coated plates in ESC medium consisting of high-glucose Dulbecco's modified essential medium supplemented with 15% ESC qualified FCS, leukemia inhibitory factor (Chemicon, Temecula, CA), l-glutamine, sodium pyruvate, nonessential amino acids, β-mercaptoethanol, and Pen/Strep. For the preliminary screen these cells were placed on 75-cm2 collagen IV-coated flasks (BD Biocoat, San Jose, CA) at ∼4 million cells per flask for 4 days in minimum essential medium α containing 10% FCS (as well as other components of ESC medium, with the exception of leukemia inhibitory factor) prior to being replated on 0.1% gelatin coated μclear 384-well plates (Greiner, Monroe, NC) at a density of 5625 cells per well in differentiation medium and subsequently treated with siRNA. Differentiation medium consisted of phenol-red free high-glucose Dulbecco's modified essential medium supplemented with 15% FCS (lot tested from Hyclone to be permissive for cardiomyocyte differentiation in vitro), l-glutamine, sodium pyruvate, nonessential amino acids, β-mercaptoethanol, and 0.5 mm ascorbic acid. The medium was changed in each well 48 h after siRNA treatment and daily thereafter.
FLK-GFP reporter ESCs, DTC29 (kindly provided by Janet Rossant (17)), were propagated in ESC medium as described above, but in the presence of a feeder cell layer. Differentiation of the FLK1-GFP ESC line was performed on collagen IV-coated six-well plates (BD Biocoat) at a density of 800,000 cells per well in medium consisting of Dulbecco's modified essential medium/F12 medium, 2% ESC qualified FCS (Hyclone), B27 supplement (Invitrogen, Logan, UT), 10 ng/ml receptor grade EGF (Millipore, Billerica, MA), l-glutamine, sodium pyruvate, nonessential amino acids, and β-mercaptoethanol.
Mouse 3T3 and human 293 cells were propagated in Dulbecco's modified essential medium supplemented with 10% FCS, l-glutamine, and Pen/Strep. Retrovirus packaging and infection were carried out as described elsewhere (18). Sequences encoding the myc epitope were fused to the 5′ end of the coding sequence of Fbxl16 cDNA (Open Biosystems clone ID 40130660), and retrovirus encoding myc-FBXL16 was then used to infect 3T3 cells to generate the stably expressing DTC 113 line.
Nanog reporter ESCs were kindly provided by Dr. Michael Elowitz, California Institute of Technology, Pasadena, CA.
siRNAs, Plasmids, and Transfection
The siRNA library was purchased from Qiagen and transfected at 100 nm. Product numbers and targeted gene sequence information for all siRNAs used in screening are included in supplemental Table S1. Luciferase (control) siRNA was purchased from Dharmacon (catalog number d-002050–01-20). Oct4 siRNA was purchased from Invitrogen (Stealth RNAi catalog number 16111296, NM 013633). Dharmafect I transfection reagent was used for all siRNA transfections (Dharmacon, Lafayette, CO). Cells were in siRNA containing medium for 48 h, but on the day after transfection an equal volume of serum-containing medium was added to each culture to maintain proper growth conditions for ESCs. siRNA transfections directed against more than one gene utilized a 100 nm final concentration per gene targeted.
Manufacturer protocols for the Fugene 6 transfection reagent were used in transfecting 293 and mouse ESCs. Mouse ESCs were transfected for two consecutive days to enhance transfection efficiency. Lysates were made from cells harvested 48 h after the initial transfection. The HA-B55α expression vector (RDB 2691) was obtained from Dr. Xuan Liu at the University of California Riverside. The myc-SKP2 expression vector (RDB 2692) was obtained from Dr. Dieter Wolf, Sanford Burnham Institute, San Diego, CA. The myc-FBXL16 expression vector (RDB 2690) was constructed by cloning the full-length murine cDNA sequence into the MSCV vector. Sequences encoding a single myc epitope were appended to the 5′ end of the open reading frame.
Cell Death and Proliferation Assessments
Caspase 3,7 activity was measured using the standard manufacturer protocol for the Promega chemiluminscent Caspase 3,7 activity assay (catalog number G8090) in ESC cultures 3 days after siRNA treatment. Results were normalized to the signal obtained from luciferase siRNA-treated controls. Brdu incorporation into control 3T3 cells was quantitatively measured using the standard manufacturer protocol for the Roche cell proliferation ELISA chemiluminescent assay (catalog number 11669915001) in 3T3 cells after treatment with Fbxl16 siRNA. Alkaline phosphatase activity was measured 4 days after siRNA treatment of mouse ESCs using the Millipore quantitative colorimetric assay kit (catalog number SCR066) per the manufacturer's protocol. Propidium iodide staining was performed on ESCs 3 days after siRNA treatment. After harvesting and washing in PBS, cells were resuspended in propidium iodide buffer (0.05 mg/ml propidium iodide, 0.1% sodium citrate, and 0.1% TritonX-100) and treated with DNase free RNase at a concentration of 0.2 mg/ml for 30 min. Samples were then analyzed by means of flow cytometry to assess cell cycle status.
Immunoblotting
Whole cell lysates were normalized to 50 μg of total protein content per well as quantified by BCA (Pierce). For cytoplasmic and nuclear extract preparation, NE-PER extraction reagent (Thermo) was used according to the manufacturer's recommendation. Samples loaded on 10% denaturing polyacrylamide gels for SDS-PAGE were transferred to nitrocellulose membranes. Standard protocols were then implemented for membrane blocking, incubation with antibodies, and detection with ECL reagent. Primary antibodies used in this study included anti-myc, clone 9E10 (Covance, San Diego, CA, catalog number AFC-150P-1000), anti-Scirr1 rabbit polyclonal (Millipore, Billerica, MA, catalog number AB10223), anti-SKP1 mouse monoclonal (Invitrogen, Carlsbad, CA, catalog number 323800), anti-CUL1 mouse monoclonal (Invitrogen, catalog number 322400), anti-HA rabbit polyclonal (Santa Cruz Biotechnology, Dallas, TX, catalog number sc-805), anti-OCT4 mouse monoclonal (Santa Cruz Biotechnology, catalog number sc-5279), anti-NANOG rabbit polyclonal (Bethyl Labs, Montgomery, TX, catalog number A300–398A), anti-PP2A-A subunit goat polyclonal (Santa Cruz Biotechnology, catalog number sc-6112), anti-PP2A-B55α mouse monoclonal (Santa Cruz Biotechnology, catalog number sc-81606), anti-PP2A-C subunit clone 1D6 (Millipore, catalog number 05–421), anti-phospho-Vimentin Ser56 (Cell Signaling Technology, Danvers, MA, catalog number 3877), anti-Tubulin mouse monoclonal (Sigma, catalog number T5168), anti-Actin mouse monoclonal (Sigma, catalog number A3853), and anti-SP1 rabbit polyclonal (Santa Cruz Biotechnology, catalog number sc-14027). All primary antibodies were used at a dilution of 1:500.
RT-PCR
Total RNA was extracted from tissues using the RNeasy RNA extraction kit (Qiagen) per the manufacturer's protocol. One microgram of total RNA was used for first strand cDNA synthesis using the SuperScript III kit (Invitrogen). cDNA was used as a template for amplification of the respective messenger RNA. HotStarTaq DNA polymerase (Qiagen) PCR was carried out with an initial activation step at 94 °C for 5 min followed by denaturing at 94 °C for 30 s, annealing at 54 °C for 45 s, and extension at 72 °C for 30 s for a total of 28 cycles (Fbxl16, GAPDH), 30 cycles (Flk1), or 33 cycles (Nkx2.5 and Isl1).
Primer sequences used for amplification of mouse messages were as follows:
Fbxl16: forward, gtgctggacaggtgtgtacg; reverse, ctcctccagctcttgcagtt.
Flk1: forward, tctgtggttctgcgtggaga; reverse, gtatcatttccaaccaccc.
Nkx2.5: forward, caagtgctctcctgctttcc; reverse, ggctttgtccagctccact.
Is1: forward, acgtgctttgttagggatgg; reverse, ggctacacagcggaaacact.
GAPDH: forward, ggctcatgaccacagtc; reverse, tcatacttggcaggtttctc.
PCR products were run on a 1.5% agarose gel with ethidium bromide.
Flow Cytometry
Differentiating ESCs were harvested by means of trypsinization followed by resuspension in serum containing medium and plating on a 0.1% gelatin-coated 10-cm tissue culture plate for 30 min to facilitate the removal of feeder cells. At 30 min, medium and nonadherent cells were carefully removed from the plate, harvested via centrifugation, and subsequently resuspended in Hanks Buffered Saline containing 60 μg/ml DNAseI, 0.6 mm magnesium sulfate, 10 mm HEPES pH 7.4, and 2.5 mg/ml BSA prior to analysis for GFP expression. 7AAD viability dye staining (Beckman Coulter) was performed to exclude dead cells from analysis, and c-KIT staining was performed with an APC-conjugated c-KIT antibody (eBioscience, San Diego, CA, catalog number 17–1171-81). Total cell counts prior to analysis were obtained using a hemocytometer. Cells were sorted on a FACSAria and analyzed on a FACSCalibur (Becton Dickinson Immunocytometry Systems). Data were acquired and analyzed with Diva software (Becton Dickinson Immunocytometry Systems).
Mass Spectrometry of Immunoprecipitated Proteins
Whole cell extracts for standard mass spectrometry analysis were prepared with lysis buffer containing 0.2% n-dodecyl-β-D maltoside (Thermo) in 50 mm HEPES pH 7.5, 70 mm KOAc, 5 mm Mg(OAc)2 with complete EDTA-free protease inhibitor mixture (Roche). After cells had been resuspended in lysate buffer, they were placed on a nutator at 4 °C for 30 min. Lysates were then clarified via centrifugation at 4 °C and incubated with antibody-bound magnetic beads from the Miltenyi Biotec, Auburn, CA, tagged protein isolation kit. Immunoprecipitates were then eluted from the magnetic column using 10 m freshly prepared urea in 0.1 m Tris-HCl pH 8.5.
For subsequent mass spectrometry, the eluate was subject to an overnight tryptic digest using standard protocols, and lyophilized peptides were resuspended in 0.2% formic acid (14). Mass spectrometric analysis was carried out using the following conditions: the mass spectrometer was a hybrid LTQ-FT-Ultra (Thermo Scientific), and a 120-min gradient from 5% to 35% acetonitrile in 0.2% formic acid was utilized. Survey full-scan mass spectra were acquired from 400–1600 m/z, with a resolution of 50,000 at 400 m/z. The top 10 most intense ions from the survey scan were isolated and, after the accumulation of 5000 ions, fragmented in the linear ion trap by collision-induced dissociation with an isolation width of 3 Th. The dynamic exclusion list was set with a maximum retention time of 60 s, and preview scan mode was enabled.
Global Peptide and Protein Identification
Thermo RAW files were converted to MGF files using ReAdW4Mascot (v. 20090305a). The MGF files were searched using Mascot (v. 2.2.06). The 293 cell data were searched against the IPI human database v. 3.54, with 75,688 target sequences (including 262 common contaminants) and an equal number of decoy protein sequences. The mouse ESC data were searched against the IPI mouse database v. 3.54, with 56,246 target sequences (including 262 common contaminants) and an equal number of decoy protein sequences. Enzyme specificity was set to fully tryptic with up to two missed cleavages. Carbamidomethylation of cysteine (+57.0215 Da) was specified as a fixed modification. Variable modifications included oxidation of methionine (15.9949 Da, 293 cells and ESCs) and carbamylation of all peptide N termini (+43.0058 Da, ESCs). The precursor mass tolerance was set to 10 ppm, and the fragment ion tolerance was set to 0.5 Da. Mascot results were loaded in Scaffold (v. 3.6.4, Proteome Software Inc., Portland, OR), and filters of 90% peptide probability, a minimum of two peptides, and 90% protein probability were employed. Scaffold estimated the false discovery rate as less than 1% at both the peptide and the protein level using a target decoy rate estimate.
Sample Preparation for Phosphoproteome Analysis
For global phospho-proteomic analysis, cells were lysed in ice-cold 8 m urea, 40 mm NaCl, 50 mm Tris (pH 8), 2 mm MgCl2, 50 mm NaF, 50 mm β-glycerophosphate, 1 mm sodium orthovanadate, 10 mm sodium pyrophosphate, 1X mini EDTA-free protease inhibitor (Roche Diagnostics), and 1X phosSTOP phosphatase inhibitor (Roche Diagnostics). To solubilize protein and ensure complete lysis, samples were sonicated three times for 15 s with 30-s pauses. Approximately 5 × 10⁷ cells were processed for each condition. Total protein was then quantified using a BCA protein assay kit (Thermo Scientific Pierce), reduced by DTT added to a final concentration of 5 mm, and alkylated with 10 mm iodoacetamide. Digestion was carried out by LysC (Wako Chemicals, Richmond, VA) added at a 1:100 enzyme-to-protein ratio and incubation at 37 °C for 2 h. At this time, the lysate was diluted with 50 mm Tris (pH 8) to a final urea concentration of 1.5 m and further digested for 12 h at 37 °C with trypsin (Promega, Madison, WI) at a 1:100 enzyme to protein ratio. Peptides were then acidified with TFA to quench the reaction and desalted using C-18 solid phase extraction columns (Waters, Etten-Leur, The Netherlands). Tandem mass tag (TMT) or iTRAQ labeling was carried out per the manufacturer's directions (TMT, Thermo Scientific Pierce; iTRAQ, Applied Biosystems, Foster City, CA). To confirm BCA measurements, aliquots of total protein were taken from each sample, combined in a 1:1:1:1:1:1 ratio, and analyzed via mass spectrometry. Summed reporter ion ratios from this experiment were used to adjust mixing ratios of the remaining labeled digests, after which the mixed samples were again desalted using solid phase extraction.
Peptide Fractionation
Strong cation exchange was carried out using a polysulfoethylaspartamide column (9.4 × 200 mm; PolyLC) on a Surveyor LC quaternary pump (Thermo Scientific; flow rate of 3.0 ml/min). The following gradient was used for separation: 0–2 min, 100% buffer A; 2–5 min, 0%–15% buffer B; 5–35 min, 15%–100% buffer B. Buffer B was held at 100% for 10 min. The column was washed extensively with buffer C and water prior to recalibration. Buffers were as follows: buffer A (5 mm KH2PO4, 30% acetonitrile (pH 2.65)), buffer B (5 mm KH2PO4, 30% acetonitrile, 350 mm KCl (pH 2.65)), buffer C (50 mm KH2PO4, 500 mm KCl (pH 7.5)). Samples were collected by hand and desalted via solid phase extraction.
Phosphopeptide Enrichment
Phosphopeptides were enriched from each fraction of the polysulfoethylaspartamide column via immobilized metal affinity chromatography using magnetic beads (Qiagen). Following equilibration with water, the beads were treated with 40 mm EDTA (pH 8.0) for 30 min with shaking and washed three times with water. The beads were then incubated with 100 mm FeCl3 for 30 min with shaking and finally were washed three times with 80% acetonitrile/0.15% TFA. Samples were resuspended in 80% acetonitrile/0.15% TFA and incubated with beads for 45 min with shaking. The resultant mixture was washed four times with 1 ml 80% acetonitrile/0.15% TFA and eluted using 1:1 acetonitrile:0.7% NH4OH in water. Eluted phosphopeptides were acidified immediately with 4% formic acid and lyophilized to ∼5 μl.
Mass Spectrometry of Phosphopeptides
Data collection was performed using an ETD-enabled Velos-Orbitrap (Thermo Fisher Scientific). Online reverse-phase chromatography was carried out using a NanoAcquity UPLC system (Waters). Peptides were loaded onto a precolumn (75-μm inner diameter, packed with 5-cm C18 particles; Alltech, Deerfield, IL) for 10 min at a flow rate of 1 μm/min. Samples were then eluted over an analytical column (50-μm inner diameter, packed with 15-cm C18 particles; Alltech) using a 120-min linear gradient from 2% to 35% acetonitrile with 0.2% formic acid and a flow rate of 300 nl/min. Data-dependent top-ten sampling methods were used consisting of one MS1 scan (resolving power = 30,000–60,000) followed by data-dependent Quantmode scans (resolving power = 7500). Quantmode, a recently described gas phase purification method, improves the quantitative accuracy of isobaric labeling by separating the target peptide from interfering peptides (19). In each Quantmode scan, gas phase purification was followed by beam-type collision-activated dissociation (higher-energy collision-activated dissocation) to generate reporter tags which were then mixed with a subsequent collision-activated dissociation fragmentation of the precursor ion. Both populations were then simultaneously analyzed in the Orbitrap. Dynamic exclusion was set for 30 to 45 s using a window of −0.55 Th to 2.55 Th. Precursors with unassigned charge states or charge states of 1 were excluded from analysis. Automatic gain control target values were 1,000,000 for MS1 analysis and 100,000 for Quantmode MS2 analysis. Raw data files are available at ChorusProject.org under the project name “FBXL 16 regulated PP2A-B55alpha” or via the following links: https://chorusproject.org/anonymous/download/experiment/-6588121327762421312 and https://chorusproject.org/anonymous/download/experiment/3463894323331911718. Mass-labeled annotated spectra for all one-peptide protein identifications, as well as all post-translational modifications containing peptide spectrum matches, can be found online with the supplemental data.
Database Searching and False Discovery Rate Estimation
MS/MS data were analyzed using the Coon OMSSA Proteomics Software Suite (COMPASS) (20). The Open Mass Spectrometry Search Algorithm (OMSSA; version 2.1.4) was used to search spectra against peptides resulting from an in silico trypsin digest (allowing three missed cleavages) of the IPI mouse database (v. 3.79) (21, 22). The precursor mass tolerance was set to ±4.5 Da and the monoisotopic mass tolerance was set to ±0.015 Da for fragment ions. Large precursor mass tolerance coupled with post-search filtering based on precursor mass, such as the algorithm employed in FDROptimizer, has been demonstrated to increase the number of peptide identifications (23). Carbamidomethylation of cysteines, TMT on the N terminus, and TMT on lysines were included as fixed modifications, and oxidation of methionines and TMT on tyrosines were set as variable modifications. Results were filtered to a 1% false discovery rate at both the peptide and the protein level (24).
Protein and Peptide Quantification
TMT or iTRAQ quantification was performed using TagQuant within COMPASS (20) This program extracts reporter ion intensities and multiplies them by injection times to determine counts. Purity correction was performed as previously described (25). Tag intensities were normalized to ensure that the total signal from each channel was equal. Reporter ion intensities for each channel were summed for all peptides in a given protein with two exceptions: (i) scans corresponding to peptides found in multiple protein groups were not used for quantification, and (ii) peptides found to be phosphorylated were not used for protein quantification.
Phosphorylation Analysis
Phosphopeptides were filtered to a 1% false discovery rate based on unique peptides. To ensure accurate reporting, phosphorylated peptides and nonphosphorylated peptides were grouped into proteins following previously established criteria (24). The Phosphinator software was used to localize phosphorylation sites to a 95% confidence level (26). Quantitative information from all phosphopeptides with the same sites was summed to achieve accurate quantification for each site.
In screening for differentially phosphorylated peptides, a ≥1.5-fold difference in phosphorylation between samples (in comparison to control) was used to identify candidates of interest. If these candidates satisfied our metric for statistical significance—p < 0.05 and q < 0.05 with initial analysis in 3T3 and mouse ESCs, as well as p < 0.05 and q < 0.2 after analysis to adjust for protein normalization in mouse ESCs—the candidate peptide was considered as differentially phosphorylated.
Recombinant Protein Expression
Full-length Fbxl16 cDNA was cloned into the SKP2-SKP1 pGEX expression vector in place of the SKP2 coding sequence to yield RDB 2693. FBXL16-SKP1 was purified from E. coli as described elsewhere (27).
Serine/Threonine Phosphatase Activity
Both HA-tagged B55α-associated PP2A and myc-FBXL16 associated PP2A were immunoprecipitated using the Miltenyi Biotec protein tag purification kit as described above. Immunoprecipitated holoenzyme was eluted from the magnetic bead column by removing the column from the magnetic stand and adding buffer that contained 20 mm Tris-HCl pH 8.0, 5 mm MgCl2, 100 mm KCl, 0.2 mm EDTA, 0.25 mm AEBSF, 10% glycerol, and 0.2% n-dodecyl-β-D maltoside. The enzyme was then assayed directly for phosphatase activity using the phosphothreonine hexa-peptide, malachite green, and assay buffer from a commercially available kit per the manufacturer's protocol (Millipore, catalog number 17–313). For experiments using β-catenin and cyclin-E phosphopeptides, a final phosphopeptide concentration of 188 μm was used in each reaction (including control phosphopeptide) (27, 28).
RESULTS
Fbxl16 Restrains FLK1+ Cell Differentiation
To identify candidate UPS genes that repress the differentiation of ESCs into cardiovascular tissue, we utilized mouse ESCs that express GFP under the control of the cardiac-specific promoter for α-myosin heavy chain (16). Briefly, ESCs were plated on 384-well plates under conditions permissive for differentiation, transfected in duplicate with pools of siRNA from a custom siRNA library directed toward components of the murine UPS (supplemental Table S1), and imaged 12 days later using an automated epifluorescence microscope to identify wells that exhibited enhanced formation of GFP-positive cardiomyocytes.
Results of the primary screen suggested that siRNA pools that target several mRNAs including Fbxl16 promoted differentiation into cardiomyocytes (supplemental Fig. S1). Because Fbxl16 was the only target for which all four siRNAs in the pool promoted cardiomyocyte differentiation, we selected it for further investigation. Knockdown of Fbxl16 mRNA was confirmed by RT-PCR analysis of ESC cultures following treatment with these siRNAs (supplemental Fig. S2A). Knockdown of FBXL16 protein was also observed in 3T3 cells engineered to stably overexpress myc-tagged FBXL16 (myc-FBXL16; supplemental Fig. S2B).
Because the siRNA treatment was performed at the onset of differentiation, we reasoned that FBXL16 might be repressing early steps in the cardiac lineage. To test this hypothesis, we evaluated the differentiation of a second mouse ESC line that expresses GFP under the control of the promoter for Flk1, a well-established marker for cardiovascular progenitor cells (17, 29). When these cells were treated with Fbxl16 siRNA we observed a significant increase in the total number and proportion of GFP+ (i.e. FLK1+) cells as assessed by flow cytometry (Figs. 1A and 1B). Similar results were obtained with a second siRNA that targets a distinct sequence in Fbxl16 (supplemental Fig. S2C). Because FLK1 expression occurs in a variety of cell types, including endothelial cells, the GFP+ population was then assessed for co-expression of other markers for cardiovascular progenitor cells including Nkx2.5 and Isl-1 mRNAs and c-KIT protein (1, 2). The expression of all three markers was elevated in GFP+ cells isolated from cultures treated with Fbxl16 siRNA, suggesting that the cell population being studied included cardiovascular progenitors (Figs. 1C and 1D). Given that the depletion of Fbxl16 enhanced the formation of FLK1+ cells, we sought to test whether overexpression of Fbxl16 might have the converse effect. However, though transient transfections had limited success, attempts to stably overexpress Fbxl16 in ESCs by means of either transfection or viral transduction were unsuccessful due to reduced ESC clone viability.
Fig. 1.
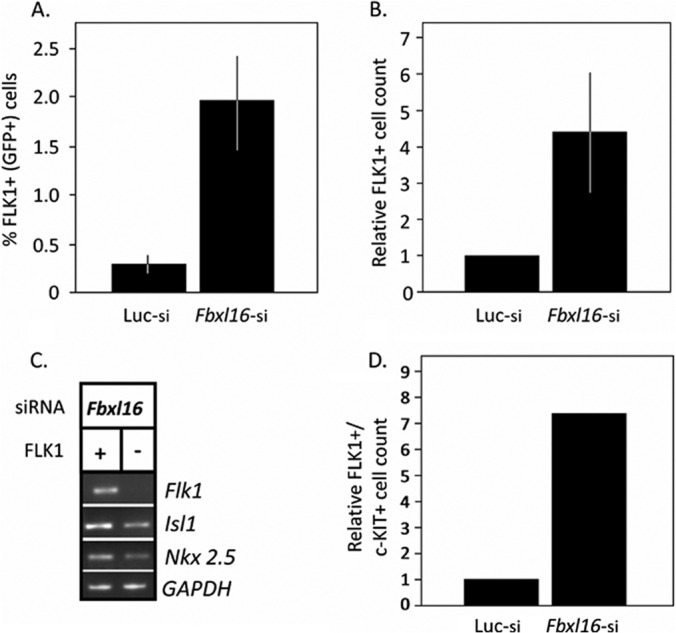
Fbxl16 represses an early event in the cardiogenic lineage. A, B, increased percentage and total number of FLK1+ cells in differentiating ESC cultures upon silencing of Fbxl16. Differentiating ESCs that contain a GFP reporter knocked into one of the two Flk1 loci were harvested 4 days after treatment with the indicated siRNA. Quantification of the GFP signal (used as a surrogate for FLK1+) was performed via flow cytometry, and either the percentage (A) or the total number (relative to luciferase control) (B) of GFP-positive cells is reported. Error bars represent ±1 S.D. C, co-expression of cardiovascular markers in Fbxl16-depleted cells. Sorted FLK1+ (GFP-positive) cells were subjected to semiquantitative RT-PCR to evaluate mRNAs that encode the cardiovascular progenitor markers FLK1, NKX2.5, and ISL1. GAPDH message is shown as a control. D, same as A and B, except that c-KIT was evaluated via antibody staining. The graph shows the total number (relative to luciferase control) of FLK1 and c-KIT double positive cardiovascular progenitor cells in culture after treatment with the indicated siRNA (the mean of two separate experiments is shown; both experiments demonstrated similar results with S.D. = 0.122 calculated for Fbxl16 siRNA-treated cells).
In addition to increasing both the proportion and the total number of FLK1+ cells in culture, Fbxl16 knockdown reduced the total number of cells with a concomitant increase in nonviable, nonadherent cells (supplemental Figs. S2D and S2E). This effect was not due to perturbation of the cell cycle, as assessed by propidium iodide staining or BrdU labeling (supplemental Figs. S2F and S2G). However, caspase 3,7 activity was significantly increased in siRNA-treated cultures (supplemental Fig. S2H). This suggests that the reduction in cell number was due to apoptosis.
Because Fbxl16 suppression resulted in an apparent increase in the differentiation of ESCs to FLK1+ cells, we asked whether the effect was due to an overall loss of stem cell identity. To evaluate this possibility, we examined a number of different markers for stem cell identity (30) in cultures treated with control (luciferase) versus Fbxl16 siRNA (supplemental Fig. S2I). To rule out potential artifacts that might arise from population averaging, we evaluated NANOG expression in single cells by employing murine ESCs that express a NANOG-CFP reporter. FACS analysis of the NANOG-CFP cells revealed little or no loss of NANOG-positive cells in cultures depleted of Fbxl16 mRNA (supplemental Fig. S2J). By contrast, strong depletion of NANOG-positive cells was observed upon treatment with Oct4-specific siRNA. OCT4 and NANOG protein levels were not affected in ESCs depleted of Fbxl16 mRNA (supplemental Fig. S2K). These results suggest that the suppression of Fbxl16 enabled a subpopulation of ESCs to differentiate into FLK1+ cardiovascular progenitors. Because we have not evaluated other markers, we do not know whether depletion of Fbxl16 enhances or reduces differentiation along other lineages unrelated to FLK1+ or enhances the formation of cell types derived from FLK1+ progenitors other than cardiomyocytes.
FBXL16 Does Not Form an SCF Ubiquitin Ligase
We next sought to understand the mechanisms by which FBXL16 functions. Given that FBXL16 is a member of the family of F-box proteins (10) that assemble with CUL1, SKP1, and ROC1/RBX1/HRT1 to form SCF ubiquitin ligases, we anticipated that FBXL16 would form an SCF ubiquitin ligase that targets for ubiquitination and degradation a protein that promotes formation of FLK1+ progenitors. To test this hypothesis, we constructed an expression vector that encoded a myc epitope fused to the N terminus of full-length FBXL16 (myc-FBXL16). As shown in Figs. 2A and 2B, myc-FBXL16 was expressed in stably transfected 3T3 cells and localized to the cytosolic fraction of whole cell lysate. To evaluate the assembly of myc-FBXL16 into SCF complexes, we performed anti-myc immunoprecipitation followed by immunoblotting with antibodies against SCF subunits. As expected, myc-FBXL16 bound SKP1 (Fig. 2C). This interaction was direct because it could be reconstituted with recombinant FBXL16 and SKP1 co-expressed in E. coli (supplemental Fig. S3A). However, to our surprise, FBXL16 exhibited no detectable association with CUL1. This result, though unexpected, is consistent with the absence of FBXL16 from the repertoire of known CUL1-associated proteins (14, 31). By contrast, equivalently tagged F-box protein SKP2 displayed a robust association with both SKP1 and CUL1 (Fig. 2C).
Fig. 2.

FBXL16 is a cytoplasmic protein that binds SKP1 and PP2A but does not bind CUL1. A, expression of myc-FBXL16. Total cell lysate was prepared from 3T3 cells that were either mock-transfected or stably transfected with plasmids that contained the coding sequences for either myc-SKP2 or myc-FBXL16. Lysates were evaluated via SDS-PAGE followed by immunoblot with anti-myc. B, myc-FBXL16 is a cytosolic protein. Cytosolic (Cyt) and nuclear (Nuc) fractions prepared from 3T3 cells stably expressing myc-FBXL16 were fractionated by means of SDS-PAGE and immunoblotted for myc-FBXL16, α-actin (a cytosolic marker), and SP1 (a nuclear marker). C, myc-FBXL16 binds SKP1 and PP2A but not CUL1. Total cell lysates from 293 cells that were either mock-transfected or transfected with plasmids that contained the coding sequences for either myc-SKP2 or myc-FBXL16 were subjected to immunoprecipitation with anti-myc. Immunoprecipitates were fractionated via SDS-PAGE and immunoblotted with antibodies against SKP1, CUL1, and PP2A subunit A. D, FBXL16, but not SKP2, co-immunoprecipitates serine/threonine phosphatase activity. Total cell lysates from 293 cells that were either mock-transfected or transfected with plasmids that contained the coding sequences for myc-SKP2, myc-FBXL16, or HA-B55α (included as a positive control) were subjected to immunoprecipitation with either anti-myc (SKP2 and FBXL16) or anti-HA (B55α). Immunoprecipitates were assayed for their content of serine/threonine phosphatase activity. Error bars represent ±1 S.D.; n = 3 for each sample.
FBXL16: A Novel Regulator of PP2A Holoenzyme
If FBXL16 does not form an SCF ubiquitin ligase, we reasoned that it must impede the formation of FLK1+ cardiac progenitors through a distinct pathway. To investigate FBXL16's mechanism of action, we sought its binding partners. Shotgun mass spectrometry of myc-FBXL16 immunoprecipitates recovered from 293T cells revealed multiple candidates, most of which were also detected in either myc-SKP2 or untagged control immunoprecipitations (supplemental Table S2, 293 Proteins tab). However, 17 proteins were found in the myc-FBXL16 but not the untagged or myc-SKP2 samples (Table I). Consistent with the immunblotting data, CUL1 was not found in the myc-FBXL16 immunoprecipitate, whereas SKP1 was readily detected. Notably, CUL1 was readily identified in a myc-SKP2 immunoprecipitate analyzed in parallel (Table I).
Table I. Identification by shotgun mass spectrometry of proteins that co-immunoprecipitated with myc-FBXL16 or myc-SKP2.
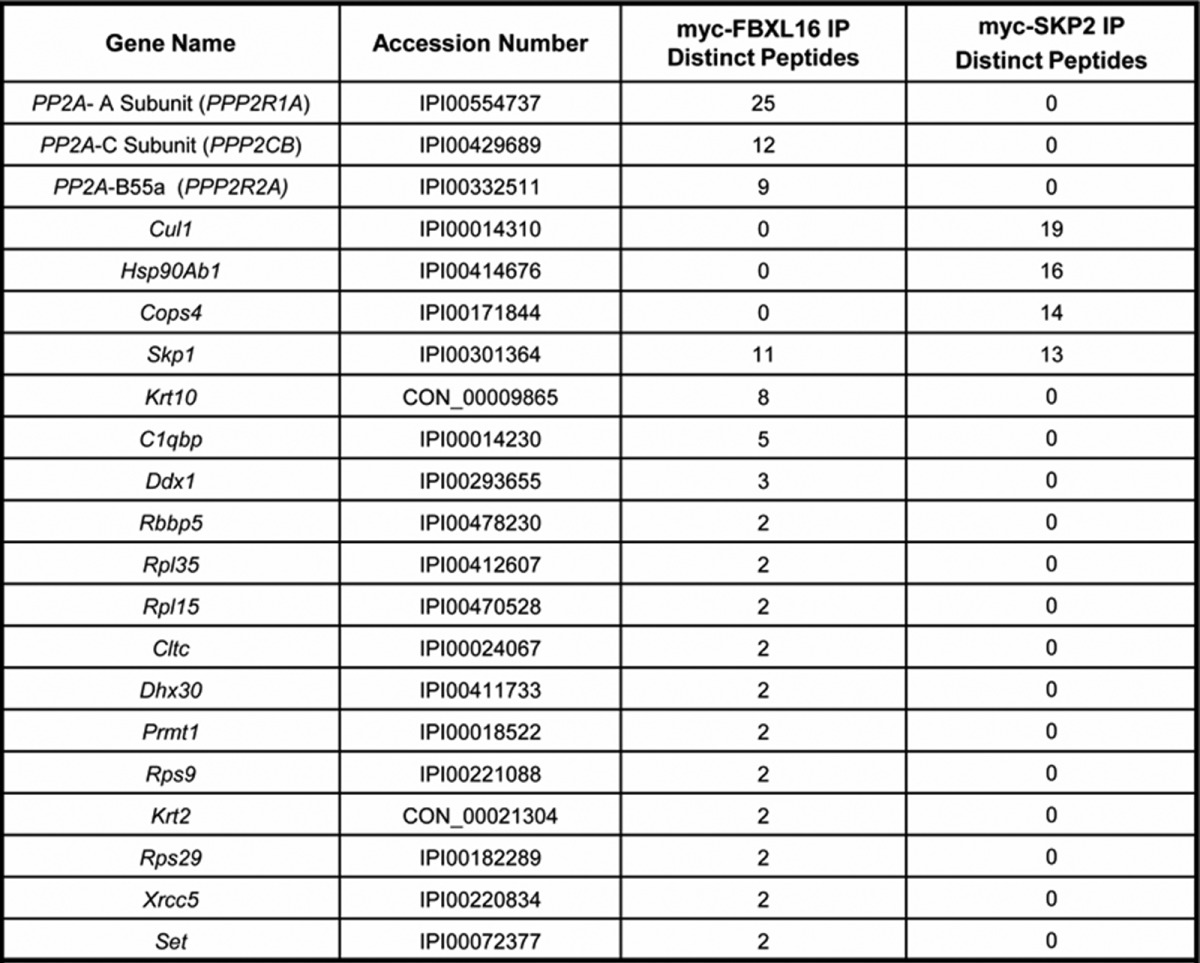
All unique proteins binding to FBXL16 are shown, and the top three candidate proteins bound to SKP2, as rated by the number of spectral counts, are listed. SKP1 is included in this list because it was the only protein that demonstrated abundant associations with both FBXL16 and SKP2, again as rated by spectral counts. None of the candidates listed are found in mock transfected 293 cells. No other PP2A subunits were found to co-immunoprecipitate with FBXL16, and no PP2A subunits were found to co-immunoprecipitate with SKP2. Complete results are shown in the supplementary data.
Strikingly, the FBXL16-associated protein for which the greatest number of peptides was sequenced was PP2A (Table I). PP2A holoenzyme comprises three major subunits, all of which were detected in myc-FBXL16 immunoprecipitates: a catalytic C subunit, a regulatory A subunit, and one of 13 different B subunits that confer substrate specificity (32). Only one of these—B55α (PP2R2A)—was detected with at least two unique peptides in the myc-FBXL16 pull-down. However, we cannot rule out the presence of B55β, B55γ, and B55δ because one of the identified peptides is shared by all four proteins (supplemental Table S2, PP2A subunits and 293 peptide information tabs). Specific association of PP2A's A subunit with FBXL16 was corroborated by immunoblot of myc-FBXL16 and myc-SKP2 immunoprecipitates (Fig. 2C). Likewise, myc-FBXL16 was recovered in immunoprecipitates of HA-tagged B55α (HA-B55α) prepared from 293 cells that overexpressed both proteins, confirming that FBXL16 can bind B55α (supplemental Fig. S3B). PP2A holoenzyme bound to myc-FBXL16 appeared to be functional, in that phosphatase activity was readily detected in myc-FBXL16 but not myc-SKP2 immunoprecipitates (Fig. 2D). Several proteins, including CIP2A, SET, ARPP19, and endosulfine, bind PP2A and inhibit its activity (33–36). SET was identified in the FBXL16 immunoprecipitate, albeit in relatively low amounts (Table I). By contrast, none of the known PP2A subunits or regulators was detected in the untagged control or myc-SKP2 immunoprecipitates (Table I). Importantly, association of FBXL16 with PP2A was not unique to transformed cells, because we also recovered the A, B55α, and C subunits of PP2A in myc-FBXL16 immunoprecipitates isolated from transiently transfected murine ESCs (supplemental Table S2, Mouse ES proteins tab).
To test whether FBXL16 might directly regulate PP2A catalytic activity, we retrieved A-B55α-C heterotrimers from cells via immunoprecipitation of transiently expressed HA-B55α or myc-FBXL16. When these precipitates were normalized based on their content of catalytic C subunit (Fig. 3A), we observed no difference in phosphatase activity toward either a generic substrate (Fig. 3B) or specific peptide substrates (Fig. 3C), including a β-catenin phosphopeptide whose phosphorylation sites are A-B55α-C targets (37). Thus, FBXL16 does not appear to influence directly the active site of the C subunit.
Fig. 3.
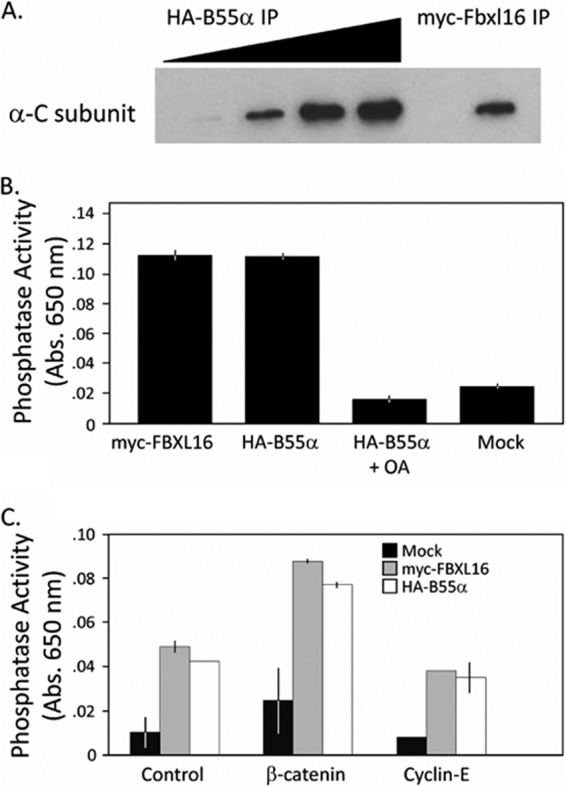
FBXL16 binding to B55α-PP2A does not alter the intrinsic catalytic activity of the enzyme. A, relative level of PP2A catalytic subunit in myc-FBXL16 and HA-B55α immunoprecipitates. Amounts of PP2A catalytic subunit C were estimated through volumetric titration of HA-B55α immunoprecipitate compared with a fixed volume of myc-FBXL16 immunoprecipitate. Samples were fractionated via SDS-PAGE and immunoblotted with antibody against the C subunit. B, robust phosphatase activity is associated with FBXL16. The specific PP2A activity was calculated based on the amount of catalytic subunit (A), and whole cell lysates from 293 cells transfected with either no vector (Mock) or myc-FBXL16 or HA-B55α expression vectors were immunoprecipitated and assayed for serine/threonine phosphatase activity using a commercial PP2A phosphopeptide assay. Error bars represent ±1 S.D.; n = 3 for each sample. OA = okadaic acid, 50 nm final concentration. C, same as B, except that phosphorylated β-catenin (a known substrate of the B55α form of PP2A) and cyclin E (not a described PP2A substrate) peptide substrates were used (37). The peptide substrates employed here are the same as those used in prior ubiquitination studies (27, 28). The commercial PP2A peptide was used as a positive control, and measurements were made in duplicate. Error bars represent ±1 S.D.
Recently, it was shown that Xenopus A-B55α-C heterotrimer is negatively regulated by ARPP19 and endosulfine, but only when the latter is phosphorylated by the protein kinase Greatwall (33, 36). This suggested that our failure to detect an effect of FBXL16 on PP2A catalytic activity could be due to the absence of a critical regulatory modification. Alternatively, FBXL16 might regulate PP2A via a distinct mechanism such as localization or by modulating association with substrates, or FBXL16 might serve exclusively as a substrate for A-B55α-C. To distinguish between these possibilities, we sought to measure PP2A activity in the presence or absence of FBXL16 in a more physiological context. To this end, we performed global phosphopeptide profiling by means of quantitative mass spectrometry (38). Parallel cultures of ESCs were treated with either control siRNA or Fbxl16-specific siRNA. Total cell lysates prepared from these cultures were digested in parallel with trypsin, and the resulting peptides were labeled with different isobaric mass tags. After the labeled isotopomers had been mixed, phosphopeptides were enriched via immobilized metal affinity chromatography prior to analysis by quantitative mass spectrometry. The identification and relative quantification of ∼5600 phosphoisoforms (including peptides for which the exact phosphorylation site was localized and those for which the exact phosphorylation site was not identified (i.e. unlocalized)) were achieved in this analysis (supplemental Table S3). A plot of the distribution of peptide abundance ratios of isoforms that were localized and achieved both a p value of <0.05 and a q value of <0.05 revealed that some phosphoisoforms were increased upon FBXL16 depletion, whereas others were diminished (Fig. 4A). The fraction that was diminished was larger than the fraction that was increased, implying that the net effect of FBXL16 was to antagonize a subpopulation of PP2A, such that in cells in which FBXL16 was depleted, PP2A exhibited higher net activity, resulting in a lower abundance of a subset of its phosphorylated substrates. To test this idea, we performed the same analysis, but this time we compared control cells with cells overexpressing myc-FBXL16. We were unable to perform this analysis in ESCs because of the limited efficiency of transient transfections and reduced viability of ESCs stably transfected with Fbxl16, so 3T3 cells were used instead. The identification and relative quantification of ∼11,500 phosphoisoforms (both localized and unlocalized) were achieved in this analysis (supplemental Table S3). A plot of the distribution of relative abundances of phosphoisoforms that were localized and achieved both a p value of <0.05 and a q value of <0.05 is shown in Fig. 4B. In contrast to the result observed upon Fbxl16 depletion, cells that overexpressed myc-FBXL16 exhibited a modest shift toward higher net phosphorylation.
Fig. 4.

Phosphoproteomic analysis reveals differentially phosphorylated proteins in response to either Fbxl16 overexpression or suppression. A, phosphoisoform profile of Fbxl16-depleted cells. Quantitative iTRAQ mass spectrometry analysis of phosphopepetides was performed on mouse ESCs that were treated with siRNAs directed toward either Fbxl16 or luciferase. Each bin corresponds to phosphoisoforms that were decreased or increased by the indicated fold amount upon treatment with Fbxl16 siRNA relative to luciferase siRNA. The y-axis indicates the number of phosphoisoforms in each bin. The histogram is plotted to emphasize proteins that were found to be differentially phosphorylated by at least 1.5-fold. B, phosphoisoform profile of FBXL16-overexpressing cells. Same as A, except that 3T3 cells that contained a stably integrated control vector or myc-FBXL16 expression vector were compared. C, five candidate PP2A substrates exhibit reciprocal responses to FBXL16 depletion and overexpression. D, validation of vimentin as an FBXL16-modulated phosphoprotein. Total extracts of 3T3 cells stably transfected with control or myc-FBXL16-expression vector were fractionated via SDS-PAGE and immunoblotted with the indicated antibodies. The vimentin antibody specifically recognizes phosphorylation on serine 56.
Both knockdown and overexpression studies are subject to different types of indirect effects that could skew the levels of individual phosphopeptides. Therefore, we reasoned that the most robust candidates for true FBXL16-modulated PP2A substrates would be those that exhibited reciprocal responses to FBXL16 overexpression and knockdown. Five phosphoisoforms met this criterion (Fig. 4C). Four of the five were increased in cells that overexpressed FBXL16 and decreased in cells in which FBXL16 was depleted. This supported our hypothesis that FBXL16 is a negative regulator of a subset of PP2A complexes in vivo. Among the phosphoisoforms that exhibited reciprocal responses to FBXL16 overexpression and depletion was one from the intermediate filament protein vimentin. Notably, phospho-vimentin is a substrate of the A-B55α-C holoenzyme (39). Immunoblotting with an antibody that recognizes phospho-Ser56 of vimentin validated our mass spectrometry finding that overexpression of myc-FBXL16 enhanced phosphorylation of this site (Fig. 4D).
DISCUSSION
FBXL16 Is an F-box Protein That Does Not Form a Stable SCF Complex
The hypothesis motivating the siRNA screen reported here is that ESCs constitutively express UPS proteins that restrain the formation of cardiovascular tissue by promoting the degradation of factors that promote differentiation along the cardiovascular lineage. Our screen identified Fbxl16 as a candidate UPS gene that represses a very early step in the cardiovascular program: the formation of FLK1+ progenitor cells. Although we set out to identify UPS proteins that regulate cardiogenesis, our data suggest that FBXL16 is, unexpectedly, not a component of the UPS. Whereas all tested mammalian F-box proteins can assemble into an SCF complex, we failed to detect the core SCF subunit CUL1 in FBXL16 immunoprecipitates, which is consistent with prior proteomic studies that failed to detect FBXL16 in CUL1 immunoprecipitates (14, 31). Note that although early studies suggested that Fbxo5/Emi1 might not form an SCF complex, we and others have identified it as a CUL1-associated protein (14, 31, 40). It remains formally possible that FBXL16 can form an SCF complex but does so only under certain conditions that were not reproduced in our experiments. Though essentially all well-studied metazoan F-box proteins form SCF complexes, yeast RCY1 and CTF13, like FBXL16, bind to SKP1 but do not assemble with yeast CUL1 (11, 41). Interestingly, FBXL16 does not contain a conserved proline residue that may specify association of F-box proteins with CUL1 (42).
FBXL16 Binds PP2AB55α Complexes
If FBXL16 does not form a stable SCF complex, then what does it do? Our data implicate FBXL16 in the biology of PP2A complexes, in particular those that contain a regulatory subunit of the B55 family (B55α-δ). FBXL16 immunoprecipitates from both 293 and ESCs contain all subunits of the B55-PP2A holoenzyme. The B55α subunit is definitely present, but the B55β, B55γ, and B55δ subunits are ambiguous because one of the peptides that was sequenced is shared by all four proteins. We were unable to identify a single peptide from any one of the other nine B subunit genes, but this might be due to a lower abundance of these proteins in 293 and 3T3 cells. In addition to PP2A holoenzyme, the 293 immunoprecipitates exhibit phosphatase activity. This raises the question, what is the relationship between FBXL16 and PP2A activity? We first considered the possibility that FBXL16 is a substrate of PP2A. However, we did not detect FBXL16 phosphorylation in a phosphoproteome analysis. In addition, given the high ratio of PP2A to FBXL16 peptide counts in the mass spectrometry analysis, it seems unlikely that FBXL16 serves as a substrate. We next considered that FBXL16 might somehow regulate PP2A activity. FBXL16 immunoprecipitates contained robust phosphatase activity, suggesting that FBXL16 does not directly impinge on the active site of the C subunit. Consistent with our observation that FBXL16 does not form a ubiquitin ligase complex that might target B55α for ubiquitin-mediated degradation, neither depletion (supplemental Fig. S3C and supplemental Table S3 (Suppress protein tab)) nor overproduction (supplemental Table S3, Overexpress protein tab) of FBXL16 had an effect on B55α protein levels.
Phosphoproteomic analyses of cells that were either depleted of or overexpressed FBXL16 revealed five proteins that exhibited reciprocal responses to these manipulations. In four of the five cases, the response seen was consistent with FBXL16 serving as a negative regulator of PP2A. One of these five proteins, the intermediate filament protein vimentin, is a known direct target of the PP2AB55α holoenzyme (39) and was confirmed by immunoblotting with a phospho-specific antibody to exhibit increased phosphorylation on its Ser56 residue upon overexpression of FBXL16. Thus, our data point to FBXL16 as a negative regulator of vimentin dephosphorylation by PP2AB55α. It remains unclear whether the activity of FBXL16 is restricted to B55α-containing complexes or might affect other B subunits that were not detected by mass spectrometry. In addition, it is not known whether FBXL16 impedes dephosphorylation of all PP2AB55α substrates or only a particular subset. Finally, the mechanism by which FBXL16 influences PP2AB55α activity is not known. Enzymatic assays revealed that FBXL16 apparently does not inhibit the catalytic site of the B55α holoenzyme. It remains possible that FBXL16 blocks the association of PP2AB55α with protein substrates or influences the subcellular localization of the holoenzyme. Future studies should reveal the specificity of FBXL16's regulatory function and the mechanism by which it exerts its inhibitory effect.
FBXL16 Influences Differentiation of ESCs
Depletion of Fbxl16 from ESCs derepresses a very early step along the cardiomyocyte lineage, leading to increased formation of FLK1+ cells. Analysis of stem cell markers in Fbxl16-depleted ESCs indicates that Fbxl16 is not required to maintain stem cell identity. However, it remains untested whether Fbxl16 promotes or represses differentiation along other lineages besides FLK1+ or affects steps in the cardiomyocyte lineage or other lineages downstream of the FLK1+ progenitor. Our identification of Fbxl16 as a negative regulator of a heterotrimeric PP2AB55α complex implies that B55α stimulates the formation of FLK1+ cells. Although we identified vimentin as an FBXL16-responsive phosphoprotein, the PP2AB55α holoenzyme is likely to have many other substrates, and thus it is unlikely that diminished vimentin phosphorylation by itself accounts for the increased differentiation of ESCs to FLK1+ cells upon Fbxl16 depletion. However, it is of interest to note that vimentin has been implicated in cellular signaling pathways known to affect cell differentiation and has been hypothesized to mediate morphological changes required by cells in order to make such transitions (43–45). Identifying the relevant step(s) and the key substrate(s) targeted by B55 will require more in-depth analysis of factors that specify FLK1+ cells.
Although we focused our attention on Fbxl16, our screen identified other genes that may restrict the differentiation of cardiomyocytes. Importantly, our results suggest that parallel approaches may uncover UPS genes that influence differentiation along other lineages that emerge from ESCs.
PP2A and Cancer
PP2A behaves as a tumor suppressor (46). Most likely, this reflects its ability to counteract growth-promoting signal transduction pathways. Multiple mechanisms restrain PP2A activity and can contribute to cellular transformation, including viral proteins such as the small T antigen of SV40 (47, 48) and endogenous inhibitors including SET (35), CIP2A (34), PME-1 (49), and the closely related ARPP19 and endosulfine proteins (33, 36). Deregulation of SET and CIP2A has been implicated in multiple hematological malignancies (50). Fbxl16 is up-regulated upon silencing of either product (p16INK4A or p14ARF) of the CDKN2A locus (51). Thus, mutation of CDKN2A in human cancer may down-regulate the activity of PP2A complexes that contain B55α. Additionally, the Fbxl16 locus is amplified in a number of cancers, most notably invasive breast carcinoma, where 5% of 489 cases exhibit amplification (cBio Cancer Genomics Portal). Given the findings reported here, it will be interesting to see whether FBXL16 modulates PP2A activity in human cancer.
Supplementary Material
Acknowledgments
We thank Richard Lee and Janet Rossant for providing the αMHC and Flk1 reporter murine ESC lines. We also thank Shirley Pease and members of the Caltech Transgenic and Knockout Core Facility for assistance with murine ESC culture. We also thank Rochelle Diamond and Diana Perez from the Caltech Core Facility for Flow Cytometry for assistance with FACS analysis and Nathan Pierce for his assistance with in vitro protein expression. R.J.D. is an Investigator of the Howard Hughes Medical Institute.
Note Added in Proof
While this manuscript was in revision Tan et al. (2013 Mol. Cell 52, 9–24) reported that Fbxl10, 11, 13, and 16 do not detectably bind Cul1.
Footnotes
Author contributions: N.H. and R.J.D. designed research; N.H., C.M.R., J.B., J.A., R.L.G., and M.J.S. performed research; N.H., C.M.R., and J.B. contributed new reagents or analytic tools; N.H., C.M.R., J.B., S.H., J.J.C., and R.J.D. analyzed data; N.H. and R.J.D. wrote the paper.
* N.H. is a recipient of American Heart Association Scientist Development Grant 10SDG3290029. This work was supported in part by HHMI. The Proteome Exploration Laboratory is supported by the Gordon and Betty Moore Foundation through Grant No. GBMF775 and the Beckman Institute.
 This article contains supplemental material.
1 The abbreviations used are:
- ESC
- embryonic stem cell
- PP2A
- protein phosphatase 2A
- S.D.
- standard deviation
- siRNA
- short interfering RNA
- UPS
- ubiquitin-proteasome system
- TMT
- tandem mass tag.
REFERENCES
- 1. Murry C. E., Keller G. (2008) Differentiation of embryonic stem cells to clinically relevant populations: lessons from embryonic development. Cell 132, 661–680 [DOI] [PubMed] [Google Scholar]
- 2. Passier R., van Laake L. W., Mummery C. L. (2008) Stem-cell-based therapy and lessons from the heart. Nature 453, 322–329 [DOI] [PubMed] [Google Scholar]
- 3. Srivastava D. (2006) Making or breaking the heart: from lineage determination to morphogenesis. Cell 126, 1037–1048 [DOI] [PubMed] [Google Scholar]
- 4. van der Stoop P., Boutsma E. A., Hulsman D., Noback S., Heimerikx M., Kerkhoven R. M., Voncken J. W., Wessels L. F., van Lohuizen M. (2008) Ubiquitin E3 ligase Ring1b/Rnf2 of polycomb repressive complex 1 contributes to stable maintenance of mouse embryonic stem cells. PLoS One 3, e2235. [DOI] [PMC free article] [PubMed] [Google Scholar]
- 5. Wang H., Wang L., Erdjument-Bromage H., Vidal M., Tempst P., Jones R. S., Zhang Y. (2004) Role of histone H2A ubiquitination in Polycomb silencing. Nature 431, 873–878 [DOI] [PubMed] [Google Scholar]
- 6. Gessert S., Kuhl M. (2010) The multiple phases and faces of wnt signaling during cardiac differentiation and development. Circ. Res. 107, 186–199 [DOI] [PubMed] [Google Scholar]
- 7. Huang L. E., Gu J., Schau M., Bunn H. F. (1998) Regulation of hypoxia-inducible factor 1alpha is mediated by an O2-dependent degradation domain via the ubiquitin-proteasome pathway. Proc. Natl. Acad. Sci. U.S.A. 95, 7987–7992 [DOI] [PMC free article] [PubMed] [Google Scholar]
- 8. Lavin M. F., Gueven N. (2006) The complexity of p53 stabilization and activation. Cell Death Differ. 13, 941–950 [DOI] [PubMed] [Google Scholar]
- 9. Tauriello D. V., Maurice M. M. (2010) The various roles of ubiquitin in Wnt pathway regulation. Cell Cycle 9, 3700–3709 [DOI] [PMC free article] [PubMed] [Google Scholar]
- 10. Jin J., Cardozo T., Lovering R. C., Elledge S. J., Pagano M., Harper J. W. (2004) Systematic analysis and nomenclature of mammalian F-box proteins. Genes Dev. 18, 2573–2580 [DOI] [PMC free article] [PubMed] [Google Scholar]
- 11. Galan J. M., Wiederkehr A., Seol J. H., Haguenauer-Tsapis R., Deshaies R. J., Riezman H., Peter M. (2001) Skp1p and the F-box protein Rcy1p form a non-SCF complex involved in recycling of the SNARE Snc1p in yeast. Mol. Cell. Biol. 21, 3105–3117 [DOI] [PMC free article] [PubMed] [Google Scholar]
- 12. Saiga T., Fukuda T., Matsumoto M., Tada H., Okano H. J., Okano H., Nakayama K. I. (2009) Fbxo45 forms a novel ubiquitin ligase complex and is required for neuronal development. Mol. Cell. Biol. 29, 3529–3543 [DOI] [PMC free article] [PubMed] [Google Scholar]
- 13. Peschiaroli A., Scialpi F., Bernassola F., Pagano M., Melino G. (2009) The F-box protein FBXO45 promotes the proteasome-dependent degradation of p73. Oncogene 28, 3157–3166 [DOI] [PMC free article] [PubMed] [Google Scholar]
- 14. Lee J. E., Sweredoski M. J., Graham R. L., Kolawa N. J., Smith G. T., Hess S., Deshaies R. J. (2011) The steady-state repertoire of human SCF ubiquitin ligase complexes does not require ongoing Nedd8 conjugation. Mol. Cell. Proteomics 10, M110.006460. [DOI] [PMC free article] [PubMed] [Google Scholar]
- 15. Wurzenberger C., Gerlich D. W. (2011) Phosphatases: providing safe passage through mitotic exit. Nat. Rev. Mol. Cell Biol. 12, 469–482 [DOI] [PubMed] [Google Scholar]
- 16. Hakuno D., Takahashi T., Lammerding J., Lee R. T. (2005) Focal adhesion kinase signaling regulates cardiogenesis of embryonic stem cells. J. Biol. Chem. 280, 39534–39544 [DOI] [PubMed] [Google Scholar]
- 17. Ema M., Takahashi S., Rossant J. (2006) Deletion of the selection cassette, but not cis-acting elements, in targeted Flk1-lacZ allele reveals Flk1 expression in multipotent mesodermal progenitors. Blood 107, 111–117 [DOI] [PubMed] [Google Scholar]
- 18. Kuo M. L., den Besten W., Bertwistle D., Roussel M. F., Sherr C. J. (2004) N-terminal polyubiquitination and degradation of the Arf tumor suppressor. Genes Dev. 18, 1862–1874 [DOI] [PMC free article] [PubMed] [Google Scholar]
- 19. Wenger C. D., Lee M. V., Hebert A. S., McAlister G. C., Phanstiel D. H., Westphall M. S., Coon J. J. (2011) Gas-phase purification enables accurate, multiplexed proteome quantification with isobaric tagging. Nat. Methods 8, 933–935 [DOI] [PMC free article] [PubMed] [Google Scholar]
- 20. Wenger C. D., Phanstiel D. H., Lee M. V., Bailey D. J., Coon J. J. (2011) COMPASS: a suite of pre- and post-search proteomics software tools for OMSSA. Proteomics 11, 1064–1074 [DOI] [PMC free article] [PubMed] [Google Scholar]
- 21. Geer L. Y., Markey S. P., Kowalak J. A., Wagner L., Xu M., Maynard D. M., Yang X., Shi W., Bryant S. H. (2004) Open mass spectrometry search algorithm. J. Proteome Res. 3, 958–964 [DOI] [PubMed] [Google Scholar]
- 22. Kersey P. J., Duarte J., Williams A., Karavidopoulou Y., Birney E., Apweiler R. (2004) The International Protein Index: an integrated database for proteomics experiments. Proteomics 4, 1985–1988 [DOI] [PubMed] [Google Scholar]
- 23. Hsieh E. J., Hoopmann M. R., MacLean B., MacCoss M. J. (2010) Comparison of database search strategies for high precursor mass accuracy MS/MS data. J. Proteome Res. 9, 1138–1143 [DOI] [PMC free article] [PubMed] [Google Scholar]
- 24. Nesvizhskii A. I., Aebersold R. (2005) Interpretation of shotgun proteomic data: the protein inference problem. Mol. Cell. Proteomics 4, 1419–1440 [DOI] [PubMed] [Google Scholar]
- 25. Shadforth I. P., Dunkley T. P., Lilley K. S., Bessant C. (2005) i-Tracker: for quantitative proteomics using iTRAQ. BMC Genomics 6, 145. [DOI] [PMC free article] [PubMed] [Google Scholar]
- 26. Swaney D. L., Wenger C. D., Thomson J. A., Coon J. J. (2009) Human embryonic stem cell phosphoproteome revealed by electron transfer dissociation tandem mass spectrometry. Proc. Natl. Acad. Sci. U.S.A. 106, 995–1000 [DOI] [PMC free article] [PubMed] [Google Scholar]
- 27. Saha A., Deshaies R. J. (2008) Multimodal activation of the ubiquitin ligase SCF by Nedd8 conjugation. Mol. Cell 32, 21–31 [DOI] [PMC free article] [PubMed] [Google Scholar]
- 28. Pierce N. W., Kleiger G., Shan S. O., Deshaies R. J. (2009) Detection of sequential polyubiquitylation on a millisecond timescale. Nature 462, 615–619 [DOI] [PMC free article] [PubMed] [Google Scholar]
- 29. Kattman S. J., Huber T. L., Keller G. M. (2006) Multipotent flk-1+ cardiovascular progenitor cells give rise to the cardiomyocyte, endothelial, and vascular smooth muscle lineages. Dev. Cell 11, 723–732 [DOI] [PubMed] [Google Scholar]
- 30. Jaenisch R., Young R. (2008) Stem cells, the molecular circuitry of pluripotency and nuclear reprogramming. Cell 132, 567–582 [DOI] [PMC free article] [PubMed] [Google Scholar]
- 31. Bennett E. J., Rush J., Gygi S. P., Harper J. W. (2010) Dynamics of cullin-RING ubiquitin ligase network revealed by systematic quantitative proteomics. Cell 143, 951–965 [DOI] [PMC free article] [PubMed] [Google Scholar]
- 32. Virshup D. M., Shenolikar S. (2009) From promiscuity to precision: protein phosphatases get a makeover. Mol. Cell 33, 537–545 [DOI] [PubMed] [Google Scholar]
- 33. Gharbi-Ayachi A., Labbe J. C., Burgess A., Vigneron S., Strub J. M., Brioudes E., Van-Dorsselaer A., Castro A., Lorca T. (2010) The substrate of Greatwall kinase, Arpp19, controls mitosis by inhibiting protein phosphatase 2A. Science 330, 1673–1677 [DOI] [PubMed] [Google Scholar]
- 34. Junttila M. R., Puustinen P., Niemela M., Ahola R., Arnold H., Bottzauw T., Ala-aho R., Nielsen C., Ivaska J., Taya Y., Lu S. L., Lin S., Chan E. K., Wang X. J., Grenman R., Kast J., Kallunki T., Sears R., Kahari V. M., Westermarck J. (2007) CIP2A inhibits PP2A in human malignancies. Cell 130, 51–62 [DOI] [PubMed] [Google Scholar]
- 35. Li M., Makkinje A., Damuni Z. (1996) The myeloid leukemia-associated protein SET is a potent inhibitor of protein phosphatase 2A. J. Biol. Chem. 271, 11059–11062 [DOI] [PubMed] [Google Scholar]
- 36. Mochida S., Maslen S. L., Skehel M., Hunt T. (2010) Greatwall phosphorylates an inhibitor of protein phosphatase 2A that is essential for mitosis. Science 330, 1670–1673 [DOI] [PubMed] [Google Scholar]
- 37. Zhang W., Yang J., Liu Y., Chen X., Yu T., Jia J., Liu C. (2009) PR55 alpha, a regulatory subunit of PP2A, specifically regulates PP2A-mediated beta-catenin dephosphorylation. J. Biol. Chem. 284, 22649–22656 [DOI] [PMC free article] [PubMed] [Google Scholar]
- 38. Phanstiel D., Unwin R., McAlister G. C., Coon J. J. (2009) Peptide quantification using 8-plex isobaric tags and electron transfer dissociation tandem mass spectrometry. Anal. Chem. 81, 1693–1698 [DOI] [PMC free article] [PubMed] [Google Scholar]
- 39. Turowski P., Myles T., Hemmings B. A., Fernandez A., Lamb N. J. (1999) Vimentin dephosphorylation by protein phosphatase 2A is modulated by the targeting subunit B55. Mol. Biol. Cell 10, 1997–2015 [DOI] [PMC free article] [PubMed] [Google Scholar]
- 40. Pierce N. W., Lee J. E., Liu X., Sweredoski M. J., Graham R. L., Larimore E. A., Rome M., Zheng N., Clurman B. E., Hess S., Shan S. O., Deshaies R. J. (2013) Cand1 promotes assembly of new SCF complexes through dynamic exchange of F box proteins. Cell 153, 206–215 [DOI] [PMC free article] [PubMed] [Google Scholar]
- 41. Kaplan K. B., Hyman A. A., Sorger P. K. (1997) Regulating the yeast kinetochore by ubiquitin-dependent degradation and Skp1p-mediated phosphorylation. Cell 91, 491–500 [DOI] [PubMed] [Google Scholar]
- 42. Schmidt M. W., McQuary P. R., Wee S., Hofmann K., Wolf D. A. (2009) F-box-directed CRL complex assembly and regulation by the CSN and CAND1. Mol. Cell 35, 586–597 [DOI] [PMC free article] [PubMed] [Google Scholar]
- 43. de Bernard M., Moschioni M., Napolitani G., Rappuoli R., Montecucco C. (2000) The VacA toxin of Helicobacter pylori identifies a new intermediate filament-interacting protein. EMBO J. 19, 48–56 [DOI] [PMC free article] [PubMed] [Google Scholar]
- 44. Fuchs E., Weber K. (1994) Intermediate filaments: structure, dynamics, function, and disease. Annu. Rev. Biochem. 63, 345–382 [DOI] [PubMed] [Google Scholar]
- 45. Page M. (1989) Changing patterns of cytokeratins and vimentin in the early chick embryo. Development 105, 97–107 [DOI] [PubMed] [Google Scholar]
- 46. Janssens V., Goris J., Van Hoof C. (2005) PP2A: the expected tumor suppressor. Curr. Opin. Genet. Dev. 15, 34–41 [DOI] [PubMed] [Google Scholar]
- 47. Scheidtmann K. H., Mumby M. C., Rundell K., Walter G. (1991) Dephosphorylation of simian virus 40 large-T antigen and p53 protein by protein phosphatase 2A: inhibition by small-t antigen. Mol. Cell. Biol. 11, 1996–2003 [DOI] [PMC free article] [PubMed] [Google Scholar]
- 48. Yang S. I., Lickteig R. L., Estes R., Rundell K., Walter G., Mumby M. C. (1991) Control of protein phosphatase 2A by simian virus 40 small-t antigen. Mol. Cell. Biol. 11, 1988–1995 [DOI] [PMC free article] [PubMed] [Google Scholar]
- 49. Xing Y., Li Z., Chen Y., Stock J. B., Jeffrey P. D., Shi Y. (2008) Structural mechanism of demethylation and inactivation of protein phosphatase 2A. Cell 133, 154–163 [DOI] [PubMed] [Google Scholar]
- 50. Perrotti D., Neviani P. (2008) Protein phosphatase 2A (PP2A), a drugable tumor suppressor in Ph1(+) leukemias. Cancer Metastasis Rev. 27, 159–168 [DOI] [PubMed] [Google Scholar]
- 51. Sato K., Kusama Y., Tategu M., Yoshida K. (2010) FBXL16 is a novel E2F1-regulated gene commonly upregulated in p16INK4A- and p14ARF-silenced HeLa cells. Int. J. Oncol. 36, 479–490 [PubMed] [Google Scholar]
Associated Data
This section collects any data citations, data availability statements, or supplementary materials included in this article.