

Abstract
The mechanism of activation of the Alternative Lengthening of Telomeres (ALT) pathway of mammalian chromosome end maintenance has remained an unresolved issue. We have discovered that co-depletion of the histone chaperones ASF1a and ASF1b in human cells induced all hallmarks of ALT in both primary and cancer cells. These included the formation of ALT associated PML bodies (APBs), extra-chromosomal telomeric DNA species an elevated frequency of telomeric sister chromatid exchanges (t-SCE) events and inter-telomeric exchange of an integrated tag. The induction of ALT characteristics in this setting led to the simultaneous suppression of telomerase. We identified that ALT induction is positively regulated by RAD17 and BLM, while negatively regulated by EXO1 and DNA2. The induction of ALT phenotypes as a consequence of ASF1 depletion strongly support the hypothesis that ALT is a consequence of a histone management dysfunction.
Introduction
Approximately 5–15% of human cancers employ Alternative Lengthening of Telomeres (ALT) to maintain proliferative potential 1,2. These tumors exhibit molecular hallmarks predictive of ALT activity 3, including the exchange of sequences between telomeres 4, the presence of ALT associated PML (promyelocytic leukemia) bodies (APBs) 5 and extra-chromosomal TTAGGG repeats (ECTR) 6. Despite our knowledge of these hallmarks the question of how ALT is triggered has remained unresolved and hampered by the fact that the in vitro activation of ALT is rare. Recently, some ALT hallmarks were identified in pancreatic neuroendocrine (panNET) and glioblastoma multiforme (GBM) tumors harboring somatic mutations in the histone variant H3.3 and the ATRX (alpha-thalassemia X-linked syndrome protein)-DAXX (death associated protein) chromatin-remodeling complex 7,8. Point mutations and deletion of ATRX, but not DAXX, have also been reported in many ALT cell lines 9,10, however the loss of either appears insufficient to activate ALT 9. Nonetheless, these findings suggested that the mismanagement of histones and changes in chromatin organization represented potential causal factors in ALT induction.
The ASF1 (Anti-Silencing Factor 1) paralogs ASF1a and ASF1b are histone chaperones that assist in the transfer of H3.1-H4 histone dimers to CAF-1 (Chromatin Assembly Factor 1) or H3.3-H4 histone dimers to HIRA (Histone Regulator A) for nucleosome assembly 11,12. Both ASF1a and ASF1b interact with CAF-1, but ASF1a alone interacts with HIRA 13,14. During DNA replication ASF1 associates with the MCM2-7 replicative helicase that disrupts parental histone H3.1 containing nucleosomes ahead of the fork 15. ASF1 then sequesters disrupted histone H3.1-H4 dimers behind the fork for assembly onto nascent DNA strands by CAF-1. ASF1 also transfers newly synthesized histone H3.1-H4 dimers for incorporation into chromatin during DNA replication and regulates the reservoir of histones used for chromatin restoration following replicative stress 16,17. Following co-depletion of ASF1a and ASF1b, replication-coupled disruption of nucleosomes is blocked, which impairs efficient histone transfer at replication forks and stifles S-phase progression. Thus, ASF1 depleted cells accumulate in late S/G2 and RPA2 (replication protein A2) accumulates within PML bodies 15, which is also known to occur in ALT cells.
To investigate the potential link between ASF1 and ALT, we explored whether telomeres would also localize to PML foci that arose after ASF1 knockdown and how this could affect telomere structure and function. We discovered that ASF1 depletion induced the rapid manifestation of ALT hallmarks, such as APBs, ECTR, elevated telomeric sister chromatid exchange (t-SCE) and greater telomere heterogeneity. We identified that ASF1 depletion led to the repression of hTERT (telomerase reverse transcriptase) transcription and diminish telomerase activity, indicating a switch to ALT based telomere maintenance. These data provide the first report of the direct induction of an ALT-like telomere maintenance pathway and an important tool to decipher the mechanism of ALT induction and maintenance.
Results
ASF1 depletion leads to APB formation
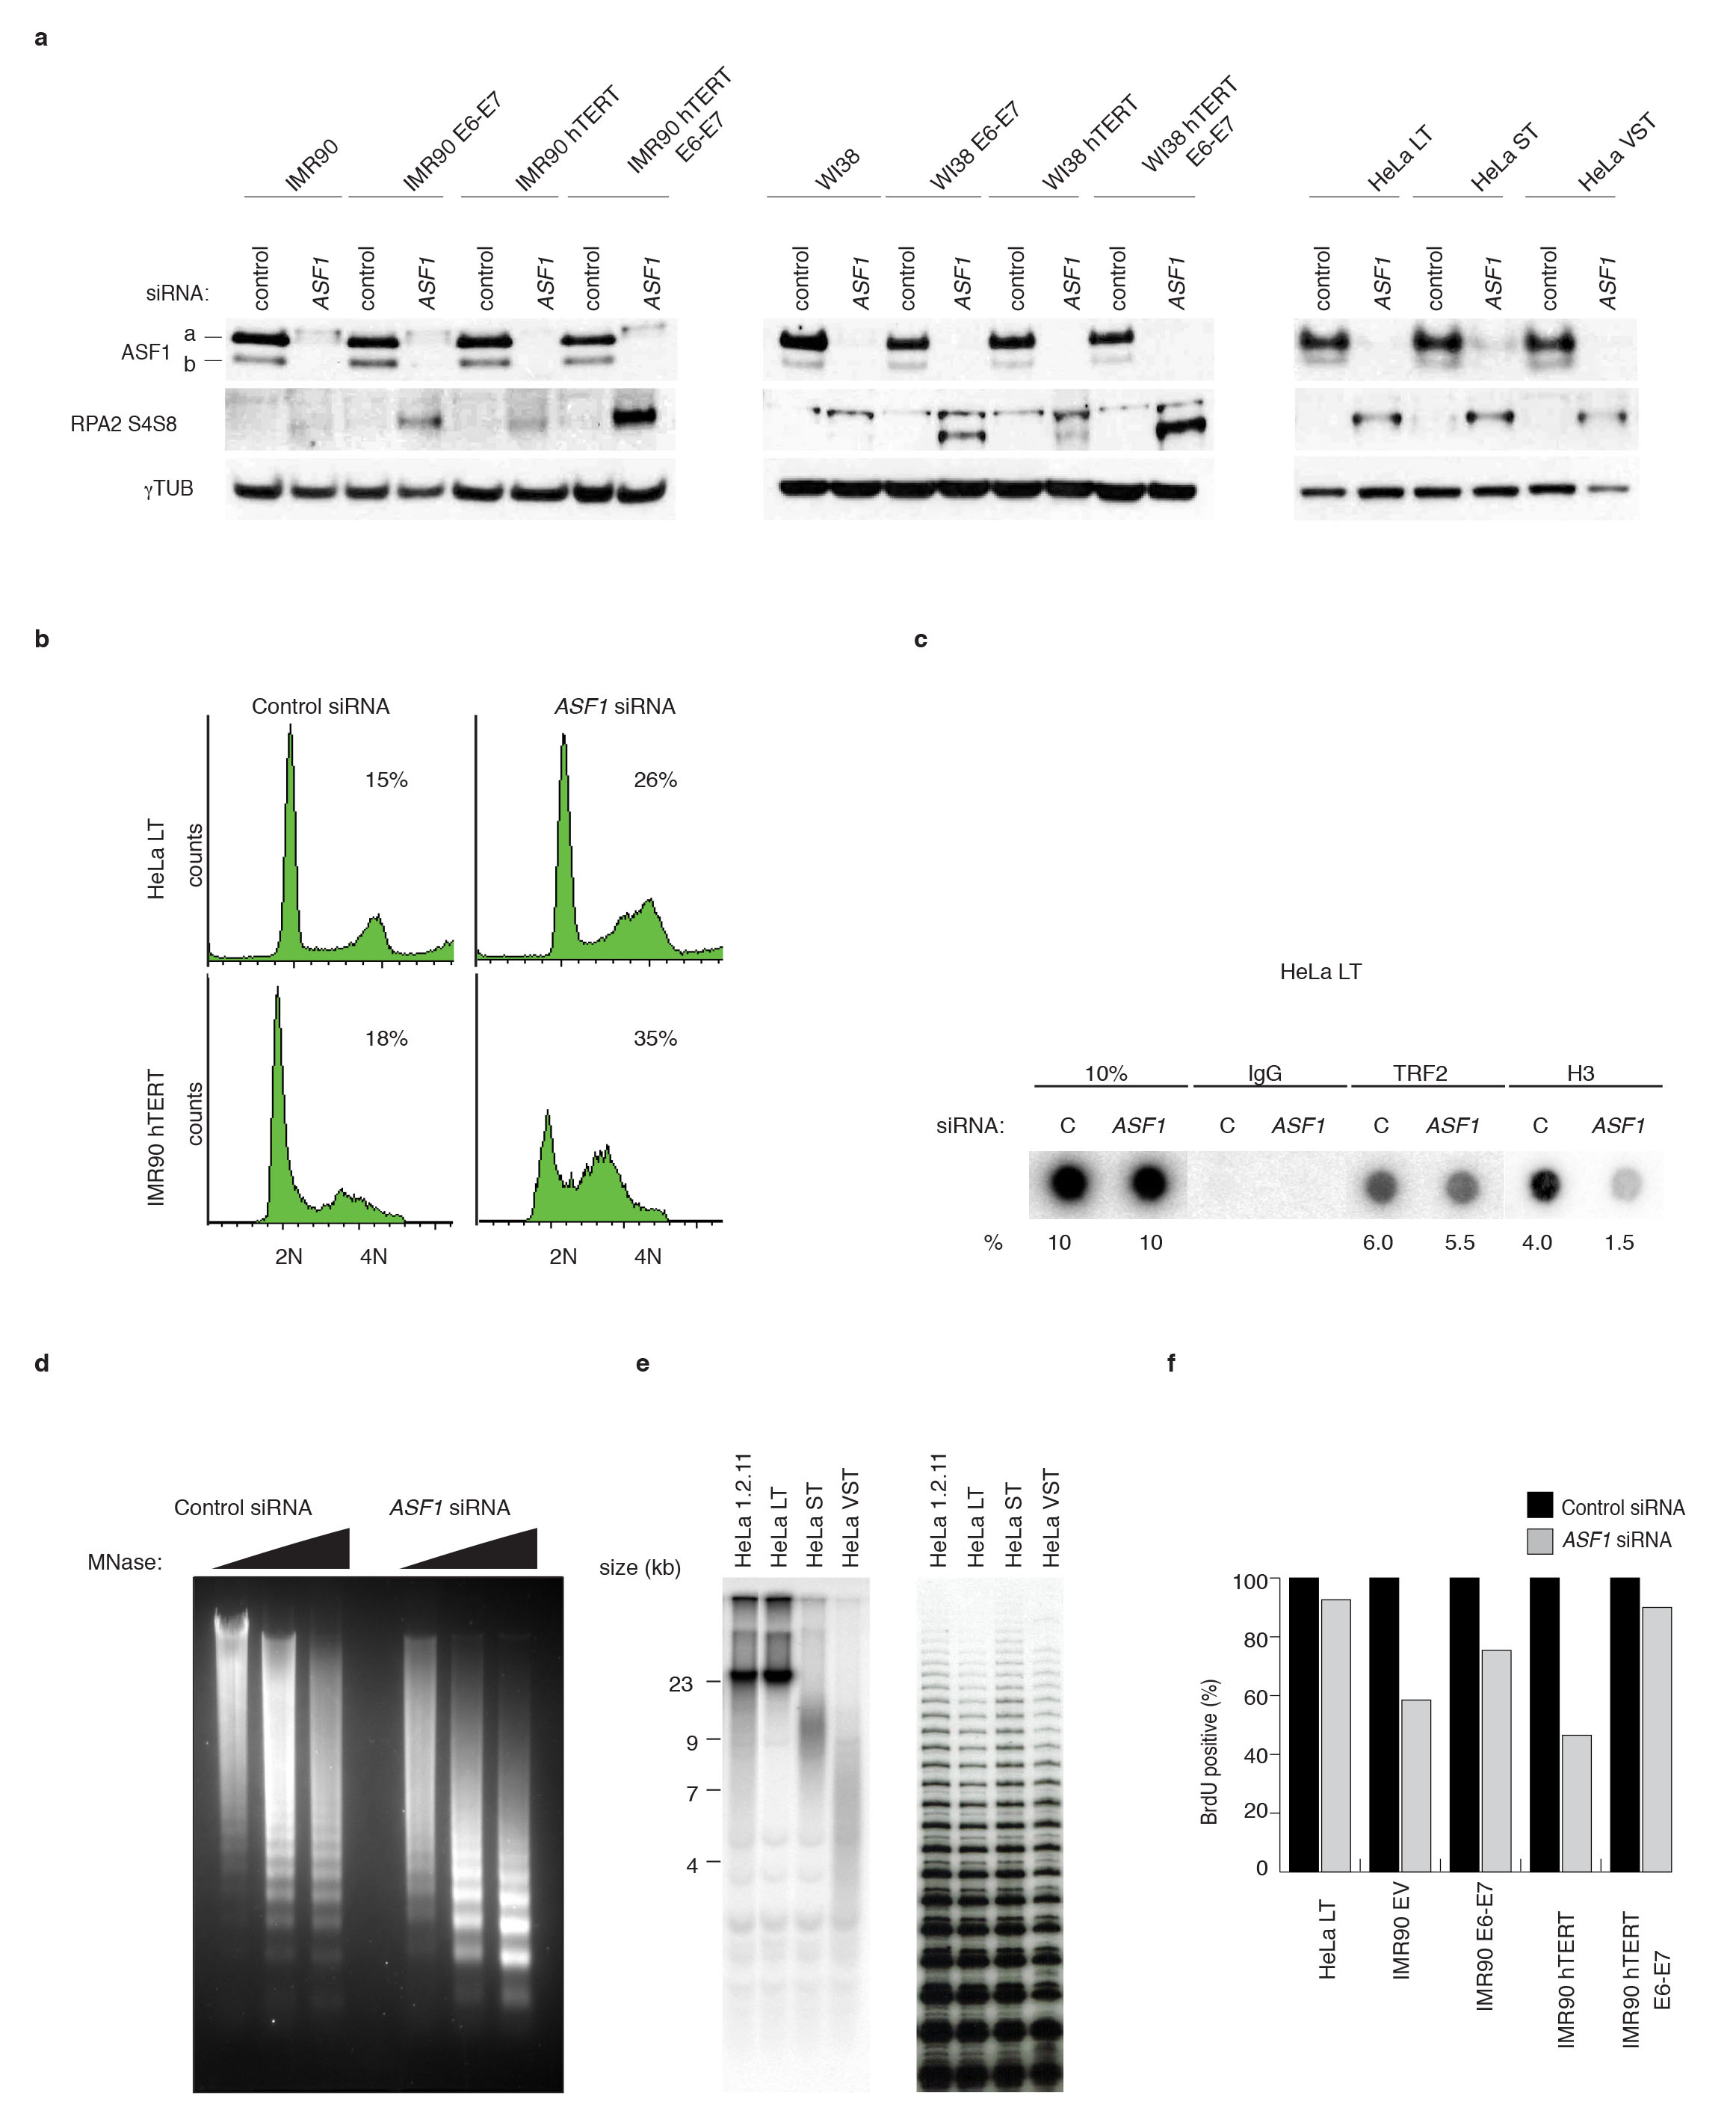
To ascertain whether ASF1 depletion could lead to the accumulation of RPA2 at telomeres we suppressed both ASF1 paralogs with siRNAs in normal and immortalized (by hTERT and HPV E6-E7) primary human lung fibroblasts (IMR90 and WI38) and several HeLa clones. At 72hrs after co-depletion of ASF1a and ASF1b (ASF1 siRNA) we observed accumulation of cells in late S/G2 (ref. 15), with concomitant RPA2 phosphorylation (Supplementary Fig. 1a, b). Chromatin immunoprecipitation (ChIP) of control siRNA and ASF1 siRNA treated cells revealed that ASF1 depletion altered the level of histone H3 at telomeric chromatin (Supplementary Fig. 1c). Micrococcal nuclease (MNase) digestion revealed that ASF1 depletion renders chromatin more accessible, indicative of global chromatin structure changes (Supplementary Fig. 1d). We observed an accumulation of RPA2 that co-localized with bright TTAGGG signals in IMR90-hTERT (Fig. 1a, b), HeLa LT cells with long telomeres (~20kb) (Fig. 1a, b) and in IMR90- and WI38-hTERT-E6-E7 (Supplementary Fig. 2a, b, c). These RPA2 containing TTAGGG foci also localized to PML bodies, indistinguishable from APBs (Fig. 1a; Supplementary Fig. 2a, b, c). TRF2 and BLM localized to these foci (Supplementary Fig. 2b, c). We observed these APB-like foci in ~5% of cells (Fig. 1b), which is directly comparable to their frequency in ALT tumors and cells. No association of RPA2 with telomeres was observed in normal or HPV-immortalized fibroblasts or in HeLa ST or HeLa VST, which have short (~9kb) and very short telomeres (~4kb) (Supplementary Fig. 1e and Supplementary Fig. 2c), but equal telomerase activity (Supplementary Fig. 1e).
Figure 1. ASF1 knockdown induces APBs and t-SCEs.

(a) Confocal IF for RPA2 (red), PML (cyan) was combined with telomeric TTAGGG FISH (green) and counter-stained in DAPI (dark blue). Images are maximum intensity projections of ~10 stacks captured with a 63X objective lens. All panels include the merged channels with DAPI and enlarged sections of the merge with DAPI. siControl refers to a non-targeting scrambled siRNA sequence. siASF1 refers to transfections with siRNAs to co-deplete ASF1a and ASF1b. The scale bar is equivalent to 10 µm. (b) Quantification of APBs. Data represent means of at least 3 experiments ±SDs. The total number of APBs detected and cells counted is indicated above each column. (c) CO-FISH of metaphases from the indicated cells. Leading (red: Alexa-568), lagging (green: Alexa-488) telomeres and metaphase chromosomes (blue: DAPI) are shown. Examples of T-SCEs are indicated by white triangles. The scale bar is equivalent to 10 µm. (d) Quantification of CO-FISH analysis. Data represent means of 4 experiments ±SDs (≥10 metaphases/experiment). P-values of p<0.0001 were obtained from two-tailed Mann-Whitney test using Prism. Number of and percent of telomeres counted and scored are shown.
Telomere recombination following ASF1 depletion
Homology Directed Repair (HDR) is the likeliest telomere maintenance mechanism in ALT and generates t-SCE events. ASF1 depletion led to a reduced rate of BrdU incorporation in IMR90, IMR90-E6-E7 and in IMR90-hTERT cells (Supplementary Fig. 1f). However, in ASF1 depleted HeLa LT and IMR90-hTERT-E6-E7 BrdU incorporation was comparable to control cells, allowing t-SCEs assessment (Supplementary Fig. 1f). In contrast with control cells where t-SCEs were rare, we observed greatly elevated frequencies of t-SCE in HeLa LT and IMR90-hTERT-E6-E7 after ASF1 knockdown (Fig. 1c, d). Though t-SCEs are informative of telomeric recombination in ALT, the inter-telomeric copying of an integrated neomycin (neor) tag provides confirmation of ALT status 3,18. We employed a system where the neor cassette flanked by 800bp of TTAGGG repeats has been integrated into the telomeric region of Bpter (chr. 4 or 5) in HT1080-hTR cells 19 (Fig 2a). After 38 days (~60PDs) of sustained ASF1 knockdown we observed distinct events where the neor tag was either copied or entirely transferred to other chromosomes. We observed clear FISH signals of the neor tag on both Bpter and another distinct chromosome, most likely chromosome 7 (Fig. 2b). This demonstrated copying and amplification of the neor tag within a single metaphase, as initially reported by Reddel and colleagues 18. In addition we observed transfer and duplication of the neor tag to and on chromosome 19 (Fig. 2c, d). While we observed 8 neor tag-movements in 297 ASF1 suppressed metaphases, we failed to detect a single copying or transfer of the tag in 332 control metaphases, eliminating the possibility that the events we observed in the ASF1 samples were stochastic (Fig. 2a). The net increase in the number of tags within single metaphases unequivocally showed the exchange of telomeric DNA from chromosome to chromosome after ASF1 depletion and thus telomere maintenance by recombination.
Figure 2. Copying and transfer of a telomere tag after ASF1 depletion.

(a) Metaphase spread of siControl transfected HT1080 hTR cells at day 38 (~60PDs) after initial transfection. The single integrated neo tag located on chromosome Bpter is shown as green FISH signals and indicted by the adjacent white arrow. Insert shows enlarged partial metaphase of the chromosome containing the neo tag. The scale bar is equivalent to 10 µm. (b-d) Metaphase spreads showing copying and transfer of the neo tag after siASF1 transfected HT1080 hTR cells at day 38 (~60PDs) after initial transfection. (b) The metaphase spread shows the original tag on Bpter and the newly acquired tag on Cpter (white arrows). Insert shows enlarged partial sections of the metaphase with the chromosomes involved. (c) The metaphase spread shows the newly acquired tag on Fter (green arrow). Insert shows enlarged partial sections of the metaphase with the chromosome involved. (d) Intra-telomeric duplication of the newly acquired neo tag on the p and q arms of chromosome Fter (green arrows). A total of 332 and 297 metaphases from siControl and siASF1 transfected HT1080 hTR cells were scored and analyzed, respectively. All chromosomes were counterstained with DAPI but shown in red for clarity.
ASF1 depletion generates extra-chromosomal TTAGGG repeats
ALT cells exhibit a unique telomere metabolism involving recombination, telomere loss and rolling circle amplification (RCA) leading to heterogenous telomere length 1. We sought to assess by telomere restriction fragment (TRF) analysis whether ASF1 depletion altered the distribution of telomeric DNA in telomerase positive cells (Fig. 3a). After ~2 weeks of sustained ASF1 knockdown we observed clear smearing of telomeric signals above and below the bulk telomeric DNA signal, indicating the accumulation of telomeric DNA fragments of larger and smaller sizes (Fig. 3a). The distribution of the telomeric signal on the ASF1 siRNA lanes was similar to those of the Saos-2 and U2OS cells, which have been cultured over countless generations, indicating indicates a potential switch toward heterogeneous telomere length within days of ASF1 knockdown, consistent with ALT induction and telomere recombination.
Figure 3. ASF1 knockdown generates ECTR.

(a) Telomere Restriction Fragment (TRF) analysis of telomeric DNA. Left: Digested DNA (10µg) from independent prolonged ASF1 knockdowns (days 17 and 14 post transfection) in HeLa LT was resolved on a 0.7% TBE agarose gel. DNA from siControl transfected cells, Saos-2 and U2OS cells was resolved in parallel. Right: Lines traces of siControl (black) and siASF1 (red) gel lanes. (b, c) C-circle assays in siControl and siASF1 transfected IMR90-hTERT and HeLa LT. The ALT positive U2OS control is on the left. Negative controls are reactions lacking φ29 or DNA. (d) Quantification of C-circles in siRNA and drug treated HeLa LT (light grey bar) and U2OS (dark grey bar). In both (c) and (d), C-circle levels are calculated relative to those of U2OS cells (dark grey bar, far left of graph). Data represent means ±SDs of at least 3 experiments. *** indicates p-value <0.005, ** indicates p-value <0.05 (two tailed paired students t test). (e) Increasing amounts (0.25, 0.5 and 1 µg) of digested genomic DNA from control and ASF1 depleted IMR90-hTERT and HeLa LT cells were incubated +/- φ29. Arrows indicate T-circle products. (f) Quantification of C-circles in Untreated, DMSO and BIBR-1532 (TERTi) treated control and ASF1 depleted HeLa LT (light grey bar) and IMR90-hTERT cells (dark grey bar). C-circle levels are calculated as relative percentages to those of untreated cells. Data represent means ±SDs of 3 experiments.
The ALT typical ECTR are suggested to be byproducts of telomere recombination and RCA 1. We investigated whether ASF1 depletion generated ECTR that contain single stranded telomeric repeats and are tightly coupled to ALT activity 20. C-circles were readily detectable following ASF1 depletion in IMR90- and WI38-hTERT, IMR90- and WI38-hTERT-E6-E7, HeLa 1.2.11 and HeLa LT cells (Fig. 3b, c, d; Supplementary Fig. 3a, b). We did not detect C-circles in control siRNA treated cells (Fig. 3b, c, d; Supplementary Fig. 3a, b). Double stranded TTAGGG circles, or T-circles 21, were easily detected in ASF1 depleted IMR90-hTERT, IMR90-hTERT-E6-E7 and Hela LT (Fig. 3e; Supplementary Fig. 3c). We visualized single stranded telomeric DNA by native FISH in ASF1 depleted HeLa LT cells (Supplementary Fig. 4a, b), revealing that the great majority of circular and linear single stranded telomeric DNA accumulated within RPA2 containing APBs. Therefore, ASF1 depletion led to the accumulation of ECTR and is consistent with the switch to telomere maintenance by ALT.
Since the induction of these phenotypes was observed only in cells that expressed endogenous or ectopic hTERT, we were concerned that hTERT might be required. We treated both control and ASF1 depleted HeLa LT and IMR90 hTERT with a small molecule inhibitor of hTERT, BIBR-1532 (TERTi), which has been shown to robustly inhibit hTERT activity in vitro and in vivo 22. The induction of C-circles and APBs was unaffected by hTERT inhibition (Fig. 3f; Supplementary Fig. 5a, b). Therefore, while long telomeres emerged as a requirement for ALT induction upon ASF1 suppression, hTERT activity does not appear to be essential.
Repression of hTERT expression upon ASF1 depletion
We compared hTERT gene expression between control and ASF1 depleted HeLa LT, ST and VST cells at 72hrs (Fig. 4a). qPCR analysis revealed a reduction of 50–70% in hTERT mRNA, even though the HeLa clones with short telomeres do not exhibit ALT phenotypes (Fig. 4a). Expression of the telomerase template RNA hTR was not affected and treatment of cells with aphidicolin, to illicit the S-phase checkpoint, did not repress hTERT (Fig. 4a). Since the hTERT expression correlates with its catalytic activity we evaluated hTERT activity in Hela LT and detected a ~50–60% reduction in catalytic activity within 72 hrs of ASF1 depletion (Fig. 4b). However, ASF1 depleted IMR90-hTERT cells that express hTERT from the constitutive CMV promoter maintained telomerase activity even in the presence of ALT features, indicating that silencing occurs at the transcriptional level of the endogenous hTERT promoter (R.O’S. and J.K. unpublished). Comparing global gene expression between control and ASF1 depleted HeLa LT cells at 72hrs applying a ±1.5 fold cut-off we identified 1321 up-regulated and 1285 down-regulated genes after ASF1 depletion, including ASF1a, ASF1b and hTERT (Supplementary Fig. 6a). Many of the up-regulated genes clustered within the TNFα, NFKB and TGFβ inflammatory response pathways, previously implicated in the repression of hTERT 23,24 (Supplementary Fig. 6b, c). We also observed a reduction in the c-MYC expression, one of the principal transcriptional activators of hTERT expression 25, and a simultaneous increase in the expression of the c-MYC agonist MAD1 (Supplementary Fig. 6c). These data lead us to speculate that ASF1 depletion activates a transcriptional signature that represses endogenous hTERT expression.
Figure 4. ASF1 knockdown leads to hTERT repression.

(a) qPCR quantification of hTERT and hTR gene expression in HeLa LT, ST, VST and aphidicolin treated HeLa LT cells. Gene expression is calculated relative to RPLO expression and siControl treated cells. Error bars indicate means of at least 3 experiments ±SDs. (b) TRAP assay of siControl and siASF1 treated HeLa LT cells. hTERT activity from decreasing amounts of protein inputs is shown. hTERT activity is quantified from at least 3 independent experiments. *** indicates p-value <0.005 (two tailed paired students t test).
C-circles and APBs arise from replicative stress
We assessed whether the induction of ALT hallmarks was specific to ASF1 knockdown. The induction of C-circles and APBs was recapitulated by co-depletion of ASF1 with individual siRNAs targeting ASF1a and ASF1b, ruling out potential indirect effects of the Smartpool siRNAs and demonstrating the requirement for suppression of both paralogs (Supplementary Fig. 7a, b, c). Since the chromatin remodeler ATRX and the histone H3.3 chaperone DAXX have recently been implicated in ALT 7,8 we tested whether suppressing them could lead to C-Circle and APB formation. In addition, we also knocked down other major histone chaperones, HIRA and CAF1, individually or in combinations. However, none of the knockdowns yielded C-circles (Fig. 5a, Supplementary Fig. 7d). Thus, of those factors and histone chaperones that we have tested here, only depletion of ASF1 led to the induction of APBs and ECTR.
Figure 5. ALT phenotypes arise from replicative stress due to ASF1 depletion.

(a) Quantification of C-circles in siRNA transfected HeLa LT (light grey bar). C-circle levels are calculated relative to those of U2OS cells (dark grey bar, far left of graph). Data represent means ±SDs of at least 3 experiments. *** indicates p-value <0.005 (two tailed paired students t test). ASF1 refers to co-depletion of ASF1a and ASF1b. CAF1 refers to co-depletion of CAF1a and CAF1b. (b) Western analysis of ASF1, RPA2 and phospho-RPA2 S4/S8 following ASF1 knockdown and drug treatments. (c) Quantitation of C-circle production. Percentage values are calculated relative to ASF1 depleted cells that were left untreated following transfection. Data represent means ±SDs of at least 3 experiments. *** indicates p-value <0.005, ** indicates p-value <0.05 (two tailed paired students t test). Original blots can be found in Supplementary Figure 8. (d) Quantitation of APBs. Percentage values are calculated relative to untreated ASF1 depleted cells. Data represent means ±SDs of at least 3 experiments. The total numbers of cells counted are indicated between brackets above each column. (e) Quantification of C-circle levels in HeLa LT (light grey bar) and U2OS (dark grey bar) after prolonged S-phase arrest, replicative stress and DDR. C-circle levels are calculated as relative percentages to those of untreated cells. Data represent means ±SDs of at least 3 experiments. *** indicates p-value <0.005, ** indicates p-value <0.05 (two tailed paired students t test). (f) Quantification of C-circle levels in U2OS cells after treatment with hydroxyurea. Line of best fit from linear regression analysis is shown in red. C-circle half-life (t=1/2) is also indicated.
Next, we depleted components of the shelterin complex, TRF1, TRF2, and POT1 (ref. 26), as well as MRE11 and NBS1, which are involved in telomere maintenance by ALT and in the DNA damage response 27 (Fig. 5a; Supplementary Fig. 7d). We assayed for the presence of C-circles and APBs but did not detect either (Fig. 5a), excluding the involvement of these factors in de novo ECTR and APB formation.
Since ASF1 primarily functions in replication coupled chromatin assembly and its depletion alters S-phase progression, we hypothesized that if the generation of C-circles and formation of APBs were truly a result of altered replication dynamics owing to ASF1 suppression, then agents that block replication forks and prohibit their repair would also block the induction of ALT. 24hrs after initial siRNA transfection we added hydroxyurea (HU), aphidicolin (APH), both of which block replication fork progression, and the topoisomerase I poison campthothecin (CPT) for an additional 48 hours to ASF1 depleted HeLa LT cells. We monitored RPA2 phosphorylation (RPA2-S4 and S8), C-circles and APBs (Fig. 5b, c, d). HU and APH, but not CPT, drastically diminished C-circles and APBs (Fig. 5c, d), despite enhanced RPA2 phosphorylation. This demonstrated that C-circles and APBs require active replication and that they could be generated by pathways that detect, repair and restart damaged replication forks.
To test for the requirement of detection of damage and initiation of repair, we treated ASF1 depleted cells with the PI3-kinase inhibitor caffeine. This resulted in a near complete abolition of RPA2 phosphorylation, C-circle and APB formation (Fig. 5b, c, d). We sought to address which specific PI3-kinases are involved by treating ASF1 depleted cells with ATR (ATRi; ETP-46464) 28, ATM (ATMi; KU-55933) 29 or DNA-PK (DNA-PKi; NU-7441) 30 inhibitors (Fig. 5b, c, d). ATRi strongly decreased C-circles, the number of APBs and abolished RPA2 phosphorylation. DNA-PKi diminished C-circles and APBs by ~50% and abolished RPA2 phosphorylation. In contrast, ATMi did not alter RPA2 phosphorylation or affect the production of C-circles or APBs. This revealed ATR as the primary PI3-kinase that is activated after ASF1 depletion and demonstrates the requirement for the sensing of replicative stress.
We asked whether the induction of ALT phenotypes could be caused by alternate sources of replicative stress. HeLa LT (and IMR90-hTERT) were synchronized in late S-phase and treated with 3mM HU, 5µM APH, 0.05µM CPT or 50ng/ml bleocin (BLEO), an antibiotic that generates both ssDNA lesions and dsDNA breaks. After 48hrs neither C-circles nor APBs were observed, indicating that the induction of C-circles or APBs is not due to prolonged S-phase arrest or DNA damage per se during replication (Fig. 5e; Supplementary Fig. 7e). In parallel, ALT positive U2OS cells were treated with HU, APH, CPT and BLEO for 48hrs. We detected a significant decrease in C-circle levels following HU and APH treatment, but not with CPT or BLEO treatment (Fig. 5e). We investigated C-circle turnover following HU treatment, since the 3mM dose rapidly blocks cell cycle progression, thereby allowing us to determine the rate of active C-circle turnover. U2OS cells were treated with 3mM HU and the levels of C-circles were ascertained at 3, 6, 12, 24 and 48 hours. We found a substantial loss of C-circles after 48 hours and the rate of reduction was linearly proportional with time (R2=0.86) (Fig. 5f). We therefore calculated the half-life of C-circles to be approximately 1 day (t1/2=24.26 ± 5.7hrs). These data indicate that C-circle production is dependent on the progression of DNA replication and C-circles are rapidly turned over during 1–2 cell cycles, in agreement with another study, in which the production of T-circles was impeded following treatment with HU and APH 31. Our calculation of the active turnover of C-circles is consistent with the observation that C-circle levels rapidly decline upon the inhibition of ALT activity due to overexpression of Sp100 (ref. 20).
This analysis supported our evidence that the ALT like phenotypes we observe were specifically due to ASF1 depletion and strongly implicated replicative stress and the ATR dependent checkpoint machinery in the response to ASF1 depletion and ALT induction.
Kinetics of ALT induction
Examination of the kinetics of C-circle generation and checkpoint activation after ASF1 knockdown revealed that C-circles were detected at 3 days after siRNA delivery and coincided with low levels of phospho-RPA2 and γH2AX (Fig. 6a, b). Prolonged ASF1 suppression by sequential knockdown over a total of 12 days led to the amplification of phospho-RPA2 and γH2AX levels (Fig. 6a, b). Over the course of sustained knockdown, C-circle progressively accumulated (Fig. 6a, c). This coincided with persistent repression of hTERT gene expression (Fig. 6d), suggestive of ongoing ALT activity in the absence of telomerase. We maintained the cells for 12 more days without further siRNA transfection, after which C-circles were still detected at ALT cell levels, despite the recovery of normal ASF1 and hTERT expression and quenching of the DDR (Fig. 6a–d). At 7 days of recovery, when ASF1 expression had substantially increased, the levels of C-circles appeared to plateau (Fig. 6a,c) and the observed decrease in C-circle levels beyond day 7 of recovery was slower than one could expect from simple degradation with the calculated half-life of ~24hrs (red line) (Fig. 6c). This raised the possibility that prolonged absence of ASF1 beyond the establishment of ALT phenotypes could lead to maintenance of this mechanism via epigenetic events. Notably, there has been a growing emphasis on the potential tumorigenic effects of replicative stress, either by impinging on histone recycling 32 or skewing nucleotide pools 3,18,33.
Figure 6. Kinetics of ALT induction and maintenance after ASF1 depletion.

(a) C-Circle analysis during prolonged ASF1 depletion and recovery in HeLa LT cells. (b) Western analysis of phospho-RPA2 S4/S8 and γH2AX during prolonged (12 days) ASF1 knockdown. Cells were allowed to recover for 12 days after final transfection (Recovery). * indicate day of siRNA delivery. Original blots can be found in Supplementary Figure 8. (c) Quantification of C-circle levels during prolonged ASF1 depletion and recovery. The red line represents the projected degradation kinetics based on the half-life calculations in Fig. 4f. (d) qPCR analysis for ASF1a, ASF1b, hTERT and hTR expression in HeLa LT during prolonged ASF1 knockdown and recovery. Gene expression is calculated relative to RPLPO expression and siControl treated cells. Error bars indicate means of at least 3 experiments ±SDs.
Identification of factors required for ALT induction
The capacity to directly induce the hallmarks of ALT allowed the identification of factors required to initiate and maintain ALT. We employed shRNAs to knockdown factors that have previously been implicated in ALT (PML, RAD51, MRE11) or the repair of DNA damage or stalled forks (CtIP, EXO1, DNA2, WRN, BLM, RAD17) and monitored for the suppression or increase of ASF1 siRNA induced C-circles and APBs (Fig. 7a, b, c). TRF2 shRNA suppressed APB formation (Fig. 7b), consistent with the localization of functional telomeres to PML bodies in ALT 34. TRF2 shRNA also diminished C-circles by 60% (Fig. 7c), potentially due to the fusion of telomeres, thereby limiting the accessibility of telomeric DNA for processing. PML shRNA abrogated the induction of APBs and C-circles without altering the accumulation of cells in S-phase or quenching the intra-S DDR (Fig. 7b, c; Supplementary Fig. 8a, b), further underscoring the role of PML as a scaffold for the processing of telomeres in ALT 35. RAD51 shRNA and MRE11 shRNA reduced APB formation by 40% and 75%, respectively (Fig. 7b), consistent with their involvement in ALT 36. Unexpectedly, the levels of C-circles were unaffected suggesting that their might not require MRE11 or RAD51 mediated strand invasion (Fig. 7c). Knockdown of RAD17, a central sensor of the ATR dependent response to replicative stress 37, suppressed C-circles but not APBs (Fig. 7b, c; Supplementary Fig. 8b). RAD17 shRNA also suppressed the activation of the intra-S checkpoint as exhibited by an absence of phospho-RPA2 and γH2AX following ASF1 depletion (Supplementary Fig. 8b). This corroborates our data showing that C-circle production appears linked to the collapse and restart of replication forks within telomeres following defective ASF1 mediated histone transfer and involves the intra-S phase checkpoint machinery. The data also indicate that C-circle and APB formation might be independent events, arising through distinct mechanisms.
Figure 7. Identification of factors required for induction of APBs and C-circles.

(a) Confirmation of shRNA knockdown efficiency by western analysis of extracts from siControl and siASF1 transfected HeLa LT cells infected with shScramble and shRNAs against target proteins. * indicates the individual PML isoforms. Original blots can be found in Supplementary Figure 8. (b) Quantitation of APBs. Percentage values are calculated relative to ASF1 depleted shScramble infected cells. Data represent means ±SDs of at least 3 experiments. The total numbers of cells counted are indicated between brackets above each column. (c) Quantitation of C-circle production. Percentage values are calculated relative to ASF1 depleted shScramble cells. Data represent means ±SDs of at least 3 experiments. *** indicates p-value <0.005, ** indicates p-value <0.05 (two tailed paired students t test). (d) Summary of shRNA analysis of factors involved in induction of C-circles, APBs and DDR. Blue, orange, red and dark red panels represent absence, low levels, normal levels and elevated levels of the corresponding ALT feature. (e) Model for ALT induction at siASF1 dependent stalled replication forks (see text).
We sought to limit the accumulation of ssDNA and RPA2 following ASF1 depletion by targeting nucleases involved in DNA resection. CtIP shRNA did not affect C-circle levels, but did reduce APBs (Fig. 7b, c, d). Surprisingly, both DNA2 shRNA and EXO1 shRNA produced a dramatic increase in the abundance of C-circles and APBs (Fig. 7b, c, d). The absence of either one of these nucleases has been shown to permit opportunistic resection of long tracts of DNA by alternate nucleases like DNA2 and vice versa 38. Thus, EXO1 and DNA2 appear to function in minimizing the effects of defective histone transfer during replication, which would be consistent with recent reports that DNA2 offsets potential genome instability that arises from replicative stress at telomeres 39.
Similarly, knockdown of the RecQ helicase WRN exacerbated C-circles, APB formation and the DDR (Fig. 7b, c, d). In contrast, knockdown of BLM virtually abolished both C-circle and APB formation (Fig. 7b, c, d). BLM shRNA also abrogated focal enrichment of RPA2 at telomeres and intra-S DDR that we typically observed following ASF1 depletion (Supplementary Fig. 8b, c). BLM has emerged as an apical factor in the repair of free DNA ends and stalled replication forks 38,40–42. It has also been identified as a target of ATR kinase activity in response to replicative stress 43 and in the suppression of genome instability upon fragile site activation 44. In addition, BLM also localizes to telomeres to process replication intermediates at telomeres 45. We suggest that BLM plays an early role in the repair of stalled forks that arise after ASF1 depletion. This could be facilitated by recruitment and tethering of BLM to telomeres via an interaction with TRF1 (ref. 46). The annealing of complementary telomeric strands could initiate repair via BLM mediated fork regression 47. BLM could then direct the recruitment of 5’-3’ exonucleases such as EXO1 and DNA2, whose resection activities generate stretches of ssDNA substrates for RPA2 and RAD51 dependent HDR of the fork 38 (Fig. 7e). Should this be the case for ALT, the recent development of small molecule inhibitors of BLM could provide an important tool for therapy development against ALT based cancers and tumors 48.
Discussion
Here we have demonstrated that ASF1 depletion can lead to manifestation of all phenotypes consistent with the activation of telomere maintenance by ALT. These include the de novo appearance of APBs, ECTR, elevated telomeric recombination and greater telomere heterogeneity. The induction of these hallmarks is rapid, occurring within 72hrs after ASF1 depletion. The induction pathway involves the ATR dependent intra-S checkpoint that is activated in the wake of perturbed histone recycling at replication forks. Our data indicate that perturbations in replication due to the absence of ASF1 are a source of instability that generates ALT specific molecular by-products, such as C-circles. We have also identified that ASF1 depletion can lead to the rapid repression of hTERT gene expression, thereby provoking an atavistic switch to telomere maintenance by ALT.
Telomere length constrained the appearance of these hallmarks. This raised the question of why long telomeres are most notably affected by ASF1 depletion. Previous studies have shown that the elongation of telomeres beyond normal homeostatic levels activated telomere-trimming that generated ECTR 19,20,49 and increased the frequency of t-SCE 49. In addition, it is known that telomeres pose additional challenges for the replicative machinery, owing to their G-rich and repetitive nature tending to form higher order secondary structures that impinge on the efficiency and kinetics of DNA replication. Similarly, telomeres have emerged as fragile sites, regions of the genome where replication fork collapse and restart by HDR occurs at elevated frequencies 46,50. Telomeres exhibit a non-canonical irregular nucleosomal spacing 51 and sliding of nucleosomes along the TTAGGG repeat indicates that it is an inherently poor substrate for nucleosome assembly in vitro 52. In addition, human telomeres exhibit reduced histone occupancy when compared to other GC rich genomic regions 53. Therefore, a simple yet parsimonious interpretation of why the observed phenotypes occurs in cells with long telomeres might be that the loss of normal homeostatic mechanisms or merely the presence of very long telomeres renders them primed for ALT. Defective chromatin assembly, such as occurs after ASF1 depletion, compounds these replicative challenges to provoke ALT engagement by telomere recombination. Interestingly, ALT telomeres contain a subset of variant C-type (TCAGGG) repeats 54, further skewing the GC content and telomeric architecture that might impede efficient chromatin assembly and render ALT telomeres more prone to recombination.
Though it was anticipated that ALT was attributed to a hyperactive recombination machinery at telomeres, no mutations in the DNA recombination machinery or telomeric proteins have been identified 9. With the mapping of potential driver mutations to ATRX, DAXX and histone H3.3, there has been a surge of interest in the impact of chromatin dysfunction in ALT cancers 7–10. Yet knockdown of ATRX and DAXX is not sufficient to induce ALT 9 (Fig. 4a) and the correlation of ATRX and DAXX mutation and ALT arises in advanced stages of tumor progression 55. Nonetheless, our data suggest that defective histone management provides a particular replicative complication that at telomeres provokes ALT engagement. While ASF1a and ASF1b are expressed in many ALT cell lines (R.O’S. & J.K. unpublished) it is unknown whether mutations or deletions of either exist in ALT tumors. As ASF1b is required for proliferation and is overexpressed in some cancers 56, deletion of ASF1b seems unlikely. Likewise, ASF1a is unlikely to be deleted since it appears essential for viability 57. In fact, ASF1a has been shown to localize to PML bodies in ALT cells 58. Since DAXX, a histone H3.3 chaperone, is frequently mutated or deleted in ALT tumors, we speculate that ASF1, which competes with DAXX for binding to histone variant H3.3 (ref. 59), could usurp the histone transfer and deposition functions of DAXX in ALT cancers.
How can our observations be reconciled with the fact that ASF1 is expressed in ALT cells? Defective chromatin assembly, as is triggered by ASF1 depletion, could impact the transmission of epigenetic histone modifications 33. Short-term perturbations in ASF1 expression or activity could provide a window for the establishment of epigenetic changes, resulting in ALT specific gene expression patterns that would be propagated even in the absence of the initiating event. In addition, replicative stress has been identified as a potent trigger of catastrophic complex genomic rearrangements that are particular to cancer cells 33,60. Besides rearrangements in telomeric architecture that activate and maintain ALT, we have shown here that the induction of ALT coincides with significant genome wide changes in gene expression. We suggest that only by integrating all these currently disparate aspects of ALT, can we fully understand how ALT is activated and maintained and then ultimately take the next steps towards developing therapies for the treatment of ALT based cancers.
Online Methods
Cell lines
Primary human diploid fibroblasts were obtained from ATCC and cultured in Glutamax-DMEM (Life Technologies) supplemented with 15% fetal bovine serum, at 7.5% CO2 and 3% O2. HeLa LT, ST and VST were derived from the parental HeLa 1.2.11 cell line and cultured in Glutamax-DMEM (Life Technologies) with 10% bovine serum, at 7.5% CO2 and 3% O2. Telomere length and telomerase activity levels were assessed by gel electrophoresis and TRAP assay as in53.
Retroviral infections
Immortalization of IMR90 and WI38 was done by infection with retroviral particles produced by CaPO4 transduction of amphotrophic packaging cell lines with pBABE-Empty, pBABE-hTERT and pLSXN-HPV E6-E7 expression vectors. Stable hTERT expressing cells were selected with puromycin (1µg/ml) and HPV-E6-E7 expressing cells were selected with G418 (600µg/ml) for 5 days.
Lentiviral particle production and infections
All shRNAs were expressed from 3rd generation TRC_pLKO.1 lentiviral vectors 61 that we purchased from OpenBiosystems (ThermoFisher), unless otherwise stated. Viral particles were produced using standard protocols in the Salk Viral Core. All infections were performed with an MOI of 10 in the presence of polybrene (6µg/ml) for 48hrs followed by selection with puromycin (1µg/ml) for 2 more days.
Listed below are the catalogue numbers of shRNA expression vectors used.
| Target | Source, Cat # | Reference |
|---|---|---|
| Control | David Sabatini, Addgene plasmid#1864 | |
| TRF2 | TRCN0000018358 | ref. 62 |
| PML | Gift from R. Everett, Glasgow. | ref. 64 |
| BLM | TRCN0000004906 | |
| RAD17 | TRCN0000018855 | |
| RAD51 | TRCN0000018879 | |
| MRE11 | TRCN0000039872 | |
| CtIP | Gift from T. Hunter, Salk. | ref. 64 |
| WRN | TRCN0000004902 | |
| EXO1 | TRCN0000039789 | |
| DNA2 | Gift from J. Campbell, CalTech. | ref. 65 |
siRNA transfections and treatments
For siRNA knockdown we used the On-Target Plus (OTP) siRNA smartpools from Dharmacon (ThermoFisher). ASF1a; CCCUGAAAUUCCGUAAGUAUU and ASF1b; CCCUUGAGUACCAUUGAUCUU. Briefly, ~700,000 cells were seeded in 10cm dishes containing 9ml growth medium without antibiotics. 2 hrs later cells were transfected. siRNAs and Dharmafect were diluted in OptiMEM (Life Technologies) to a working siRNA concentration of 50nM. We used 5µl and 10µl Dharmafect #1 per 10cm plate of HeLa and primary cells, respectively. Transfection medium was replaced with complete culture media 24 hours later or cells were split for desired application and harvested at 72 hours post transfection.
Cells were synchronized by single thymidine block using 2mM thymidine overnight. Where indicated cells were treated with 15µM aphidicolin (EMD Millipore), 1–3mM hydroxyurea (Sigma), 0.1µM campthothecin (Sigma) and 5ng/ml bleocin (EMD Millipore). Serum was withdrawn to induce cellular quiescence. ATRi (ETP-46464) (Oscar Fernandez-Capetillo, CNIO, Spain), ATMi (KU-55933) (Tocris), DNAPKi (NU-7441) (Tocris) were each used at final concentration of 10µM. Caffeine (Sigma) was used a final concentration of 1mM.
Direct Immunofluorescence
Cells were grown on glass coverslips, washed in PBS and soluble protein was pre-extracted with 0.1% triton for 5 min. Cells were washed once more then fixed with 2% PFA for 10 min. Cells were permeabilized with 0.1% (w/v) sodium citrate for 5 min and incubated with fresh blocking solution (1mg/ml BSA, 10% normal goat serum, 0.1% Tween) for at least 30 mins. Primary antibodies were diluted in blocking solution and added to cells for ~2hrs at RT or overnight at 4°C. Cells were washed 3 times with PBS for 5 min and incubated with goat anti-mouse/rabbit Alexa coupled secondary antibodies (488nm, 568nm, 594nm, 647nm) (Life Technologies) for ~2hrs at RT. Cells were then washed 3 times with PBS. The second wash contained DAPI (0.5µg/ml). Finally, cells were dehydrated in 70% (3 min), 95% (2 min) and 100% (2 min) EtOH, allowed to air dry and mounted on coverslips with Prolong Anti-fade (Life Technologies). Once the Prolong Anti-fade has cured for 24hrs cells were visualized by conventional fluorescence with a 63X objective lens on a Zeiss Axioplan II microscope with ApoTome optical sectioning or in confocal microscopy using a Zeiss LSM 780.
IF antibodies
IF-FISH
After secondary antibody incubation, cells were washed as above but then fixed with 2% PFA for 5 min. PFA was washed off and coverslips dehydrated in EtOH as above. Next, the coverslips were mounted on glass slides with 10µl per coverslip of hybridization mix (70% deionized Formamide, 1 mg/ml of Blocking Reagent [Roche], 10 mM TRIS-HCl pH 7.4) containing Alexa 488-(CCCTAA)n PNA probe. DNA was denatured by setting the slides on a heating block set to 80°C for 10 min and then incubating for at least 4 hours or overnight at RT in the dark. The coverslips were then washed twice for 15 min with Wash Solution A (70% deionized Formamide and 10 mM TRIS-HCl pH 7.2) and twice with PBS for 5 mins at RT. DAPI staining and EtOH dehydration was repeated as above and finally the samples were mounted and analyzed as mentioned above.
Chromosome Orientation FISH
CO-FISH was performed as described in 66, with the variation that cells were incubated with BrdU and BrdC simultaneously for ~12 hours, and hybridization was performed with Alexa 488-(CCCTAA)n and Alexa 568-(TTAGGG)n PNA probes. In brief, cell cultures were incubated with 7.5mM BrdU and 2.5mM BrdC for ~12 hours. After removal of nucleotide analogs, colcemid was added for ~2 hours, cells were harvested by trypsinization, swelled in 75mM KCl and fixed in 70% Methanol: 30% Acetic Acid. Samples are stored at −20°C for days-months. Metaphase chromosomes were spread by dropping onto washed slides, then RNase A (100ug/ml) and pepsin treated. Slides were incubated in 2X SSC containing 0.5µg/ml Hoechst 33342 for 30 min in the dark and irradiated for 40 min in a Stratagene UV Stratalinker 2400. The nicked BrdU and BrdC substituted DNA strands are degraded by a combination of Exonuclease III digestion and heating of the slides in 70% Formamide for 10 min. The slides were then washed in PBS, dehydrated by EtOH washes and allowed to air dry completely. The remaining strands were hybridized with fluorescence labeled DNA probes of different colors, specific either for the positive telomere strand (TTAGGG)n (polymerized by lagging strand synthesis), or the negative telomere strand (CCCTAA)n, (polymerized by leading strand synthesis). Prior to hybridization of the first PNA, DNA is denatured by heating at 80°C for 10 min, as in IF-FISH, and then incubated for 2–3hrs at RT. Slides were washed for 15 min with Wash Solution A, dried and then incubated with the second PNA for 2–3hrs at RT. The slides were then washed again twice for 15 min with Wash Solution A (70% deionized Formamide and 10 mM TRIS-HCl pH 7.2 and finally twice with PBS for 5 mins at RT. DAPI staining and EtOH dehydration was repeated as above and finally the samples were mounted as mentioned above. The resulting chromosomes show dual staining and allow distinction between leading and lagging strands. Metaphase chromosomes were visualized by conventional fluorescence using a 63X objective lens on a Zeiss Axioplan II microscope with ApoTome optical sectioning.
Native FISH to detect single stranded Telomeric DNA
Cells were grown on coverslips were fixed 10min in 2% PFA in PBS, permeabilized for 10min in KCM (120mM KCl, 20mM NaCl, 10mM Tris pH 7.4, 0.1% Triton) and blocked in ABDIL containing RNase A (0.25µg/ml) followed by the standard IF protocol outlined above with the following modifications. Hybridization was performed for a duration of 2hr at RT using 400nM TAMRA LNA G-rich probe (TAM)-GGGTtAGGGttAGgGTTAGGGttAGGGttAGGGtTA-(TAM) (purchased from Exiqon) where small letters represent LNA bases, in hybridization buffer (10% dextran sulfate, 50% deionized formamide and 2mg/ml BSA). Control slides where denatured 5 min at 80°C before hybridization to detect telomeres. Following hybridization the coverslips were washed 2× 15min in 50% formamide / 2x SSC and 3× 5min in 50mM Tris pH7.5, 150mM NaCl, 0.1% Tween 20. DAPI staining and EtOH dehydration was repeated as above and finally the samples were mounted as mentioned above. Cells were visualized by conventional fluorescence using a 63X objective lens on a Zeiss Axioplan II microscope with ApoTome optical sectioning and in confocal microscopy using a Zeiss LSM 780.
Neor FISH
The plasmid backbone pSXneo was labeled with biotin-16-dUTP using the Biotin-Nick Translation Mix (Roche) for 2 hours at 15°C and reaction was stopped with EDTA. The probe was then precipitated with 1000x excess of sheared salmon sperm DNA (Ambion). Metaphase spreads were treated with 100µg/ml RNAse A in 2x SSC buffer, 1 hour at 37°C, rinsed three times in 2x SSC, fixed 2 min in 4% formaldehyde/PBS, rinsed three times in 2x SSC, and dehydrated in graded ethanol series (70%, 90%, 100%). Slides were then denatured 2 min in 70% formamide in 2x SSC at 72°C, cooled in ice-cold 2x SSC and dehydrated in cold ethanol series. Slides were then treated 8 min at 37°C with100ng/ml proteinase K in 20mM Tris-HCl pH 7.5 with 2mM CaCl2, dehydrated and air-dried. The neo probe was resuspended at 5ng/µl in hybridization buffer (50% deionized formamide, 10% dextran sulfate, 2x SSC), denatured 10 min at 98°C and cooled in ice for 5min. Slides were incubated with 35µl of probe and hybridization was carried out over night at 37°C in a humid chamber. Slides were then washed three times 5 min in 50% formamide in 2x SSC at 42°C followed by three washes in 2x SSC at 42°C. Slides were then blocked 10 min at RT in blocking solution (5% BSA, 4x SSC, 0.1% Tween 20). The biotinylated probe was detected by incubating slides with FITC-conjugated avidin DCS (Vector Laboratories, 1:400 in blocking solution) 30min at RT. Slides were finally washed three times 5 min in 4x SSC, 0.1% Tween 20, counterstained with DAPI and mounted in DABCO.
Pulse Field Gel Electrophoresis (PFGE)
Briefly, genomic DNA was purified, digested with AluI and MboI and cleaned up by phenol-chloroform extraction and precipitation. 10µg of digested DNA was then electrophoresed on 1% PFGE grade agarose gels in 0.5× TBE buffer in the presence of ethidium bromide on a CHEF-DR II PFGE system at 6CV/cm; initial switch time 1; final switch time 6 for 16hrs. After electrophoresis the gels were dried at 50°, denatured and hybridized with a P32 end-labeled (CCCTAA)4 oligo probe. All blots were washed and exposed to PhosphoImager screens.
Telomere Restriction Fragment Analysis
Briefly, genomic DNA was purified, digested with AluI and MboI and cleaned up by phenol-chloroform extraction and precipitation. 10µg of digested DNA was then electrophoresed on 0.7% agarose gels at 120 V for 1 h then 38–40 V overnight in 0.5× TBE buffer in the presence of ethidium bromide. After electrophoresis the gels were dried at 50°, denatured and hybridized with a P32 end-labeled (TTAGGG)4 oligo probe. All blots were washed and exposed to PhosphoImager screens.
Chromatin Immunoprecipitation (ChIP)
ChIP was performed as described in O’Sullivan et al53.
Micrococcal Nuclease digestion of chromatin
Micrococcal Nuclease (MNase) digestion of chromatin was performed as described in O’Sullivan53. MNase was purchased from Worthington.
C-Circle Assay
The protocol for C-circle amplification employed was slightly modified from that performed in Henson et al. Briefly, genomic DNA was purified, digested with AluI and MboI and cleaned up by phenol-chloroform extraction and precipitation. DNA was diluted in ultraclean water and concentrations were exhaustively measured to the indicated quantity (generally, 30, 15, 7.5ng) using a Nanodrop spectrophotometer. Samples (10 µl) were combined with 10 µl BSA (NEB; 0.2 mg/ml), 0.1% Tween, 0.2 mM each dATP, dGTP, dTTP and 1 × Φ29 Buffer (NEB) in the presence or absence of 7.5U ΦDNA polymerase (NEB). Samples were incubated at 30°C for 8 h and then at 65°C for 20 min. Reaction products were diluted to 100 µl with 2 × SSC and dot-blotted onto a 2 × SSC-soaked nylon membrane. DNA was UV cross-linked onto the membrane and hybridized with a P32 end-labeled (CCCTAA)4 oligo probe to detect C-circle amplification products. All blots were washed, exposed to PhosphoImager screens, scanned and quantified using a Typhoon 9400 PhosphoImager (Amersham, GE Healthcare). Genomic DNA from ALT positive (U2OS) cells was used as a positive control for C-circle detection and a reference for quantification of C-circles that were detected in other cell lines. In all reactions, when Φ29 was omitted as a negative control, U2OS DNA was used.
Half-Life Calculation
Half-Life (t1/2) was calculated using the standard formula: t1/2 = elapsed time × log 2 by log[starting amount divided by ending amount]
T-Circle Assay
The protocol for T-circle amplification was modified from Zeillinger et al 21. Genomic DNA was prepared as above. Then DNA was denatured at 96 °C for 5 min and annealed to 50 pmol of the telomere-specific primer (CCCTAA)5 for 30–60 min at RT in a buffer containing 200 mM Tris–HCl pH 7.5, 200 mM KCl and 1 mM EDTA in a total volume of 20 µl. Half (10 µl) of the annealed reaction was incubated at 30 °C for 12 h in the presence of dNTPs (0.2 mM each), BSA (NEB; 0.2 mg/ml), 1× Φ29 buffer (NEB) and 7.5U Φ29 DNA polymerase (NEB) in a total volume of 20 µl, and the remaining half was incubated under identical conditions with one exception; the Φ29 DNA polymerase was excluded from the reaction. Both sets of reactions that did or did not include Φ29 were further incubated at 65 °C for 20 min. The samples were then electrophoresed on 0.6% agarose gels at 120 V for 1 h then 38–40 V overnight in 0.5× TBE buffer in the presence of ethidium bromide. After electrophoresis the gels were dried at 50°, denatured and hybridized with a P32 end-labeled (TTAGGG)4 oligo probe. All blots were washed and exposed to PhosphoImager screens.
Flow Cytometry
Cells to be used for flow cytometry were fixed in 70% EtOH and stained directly with propidium iodide (PI) containing RNase A (100ng/ml) for cell cycle analysis or FITC-BrdU (BD Bioscience) according to the protocols outlined in 67.
Whole cell extracts and western blotting
Cells were harvested with trypsin, quickly washed in PBS, counted with Z1 Coulter Particle Counter (Beckman Coulter) and directly lysed in 4X NuPage LDS sample buffer (Life Technologies) at 104 cells per µl. Proteins were gently homogenized using a 25-gauge syringe or benzonase (Novagen), denatured for 10 mins at 68°C and resolved by SDS-Page electrophoresis, transferred to nitrocellulose, blocked in 2–5% BSA and 0.1% Tween for 20 mins and probed. For secondary antibodies, HRP-linked anti-rabbit, mouse or goat (Amersham) was used, and the HPR signal was visualized with Supersignal ECL substrate (Pierce) as per the manufacturer’s instructions. Images in main figures were modified as necessary. The original images of blots can be found in Supplementary Figure 8.
Western antibodies:
| Target | Species | Source, Cat# | Dilution | Reference |
|---|---|---|---|---|
| ASF1a | Rabbit | G. Almouzni,#28134 | 1:1000 | ref. 15 |
| ASF1b | Rabbit | G. Almouzni,#28026 | 1:1000 | ref. 15 |
| TRF1 | Rabbit | J. Karlseder,#6839 | 1:1000 | ref. 53 |
| TRF2 | Rabbit | J. Karlseder,#6841 | 1:1000 | ref. 53 |
| POT1 | Rabbit | Gift from P. Baumann | 1:1000 | |
| MRE11 | Mouse | Genetex,#GTX70212 | 1:2000 | ref. 5353 |
| NBS1 | Mouse | Genetex,#GTX70224 | 1:2000 | ref. 53 |
| RAD17 | Rabbit | Santa Cruz,#sc-5613 | 1:1000 | ref. 53 |
| RAD51 | Rabbit | Santa Cruz,#sc-8349 | 1:500 | ref. 53 |
| CAF1 p150 | Mouse | Abcam,#ab24746 | 1:1000 | ref. 53 |
| CAF1 p60 | rabbit | Bethyl,#A301-084A | 1:1000 | |
| ATRX | Rabbit | Santa Cruz,#sc-15408 | 1:500 | ref. 68 |
| DAXX | Rabbit | Santa Cruz,#sc-7152 | 1:500 | ref. 68 |
| HIRA | Rabbit | Abcam,#ab20655 | 1:500 | |
| RPA2 | Mouse | Abcam,#ab2175 | 1:1000 | |
| RPA2 S4/S8 | Mouse | Bethyl,#A300-245A | 1:1000 | |
| γH2AX | Mouse | Millipore,#05-636 | 1:1000 | ref. 69 |
| H2AX | Rabbit | Abcam,#ab11175 | 1:1000 | |
| γTubulin | Mouse | Sigma,#T6557 | 1:5000 | ref. 53 |
| PML | Rabbit | Bethyl,#A301-167A | 1:500 | |
| CtIP | Rabbit | Santa Cruz,#sc-48415 | 1:1000 | ref. 64 |
| BLM | Rabbit | J. Karlseder,#7099 | 1:1000 | ref. 45 |
| WRN | Mouse | BD Bio,#611169 | 1:200 | ref. 66 |
| EXO1 | Mouse | Thermo,#MS-1534 | 1:200 | |
| DNA2 | rabbit | Abcam,#ab96488 | 1:1000 | ref. 65 |
Transcriptional Analysis
For each condition, RNA was extracted with Trizol Reagent according to manufacturer’s instructions and purified using RNeasy mini kits (Qiagen). Isolated RNA (200ng) was labeled and hybridized to GeneChip Human Gene 1.0 ST arrays (Affymetrix) representing ~36,000 transcript. Cel files were normalized using the Partek Genomics Suite (RMA background correction, quantile normalization, median polishing). Differentially expressed genes were detected using the ANOVA function in the Partek Genomics Suite. To define differentially expressed genes, we used a 1.5-fold cutoff and a P-value adjusted for false discovery rate of <0.05. Hierarchical clustering was performed using the Partek Genomics Suite and expression values for the clusters were standardized by shifting the mean to zero and scaling to standard deviation of 1. Enriched functional groups were identified using the Generanker tool in the Genomatix Genome Analyzer software. For direct qPCR expression analysis, 2µg of RNA was used for generation of first strand cDNA synthesis with the Superscript III RT kit (Life Technologies). cDNA was diluted 10X in pure H2O and 2µl was used per qPCR reaction with the SYBR Green master mix (ABI, Life Technologies) and 10pmol of primers.
qPCR primer sequences
Sequences were designed using the Roche Primer design suite
| Target | Sequence |
|---|---|
| ASF1a_F | CAGATGCAGATGCAGTAGGC |
| ASF1a_R | CCTGGGATTAGATGCCAAAA |
| ASF1b_F | GGTTCGAGATCAGCTTCGAG |
| ASF1b_R | CATGGTAGGTGCAGGTGATG |
| RPLO_F | GGCGACCTGGAAGTCCAACT |
| RPLO_R | CCATCAGCACCACAGCCTTC |
| hTERT_F | GCCTTCAAGAGCCACGTC |
| hTERT_R | CCACGAACTGTCGCATGT |
| hTR_F | GCGTAGGCGCCGTGCTTTTG |
| hTR_R | CCCAACTCTTCGCGGTGGCA |
| MYC_F | TACAACACCCGAGCAAGGAC |
| MYC_R | AGCTAACGTTGAGGGGCATC |
| MXD1_F | AGCTGGGCATTGAGAGGAT |
| MXD1_R | CACGTCAACGTCGATTTCTTC |
| TGFB1_F | GCAGCACGTGGAGCTGTA |
| TGFB1_R | CAGCCGGTTGCTGAGGTA |
| TGFB2_F | CCTTCTTCCCCTCCGAAAC |
| TGFB2_R | AGAGCACCTGGGACTGTCTG |
| TGFBR1_F | AAATTGCTCGACGATGTTCC |
| TGFBR1_R | CATAATAAGGCAGTTGGTAATCTTCA |
| TGFBR2_F | CACCGCACGTTCAGAAGTC |
| TGFBR2_R | TGGATGGGCAGTCCTATTACA |
Supplementary Material
Acknowledgements
We are indebted to H. Pickett (CMRI, Sydney, Australia) for generously sharing HT1080-hTR cells, reagents and for expert advice. We are grateful to Z. You (Washington University, St Louis), J. Campbell (Caltech), R. Everett (University of Glasgow) and Z. Gurard-Levin (Institut Curie), O. Fernandez-Capetillo (CNIO), for sharing reagents. We thank the Salk Institute’s J. Fitzpatrick of the Waitt Advanced Biophotonics Center for imaging assistance. R.O’S. is supported by AFAR and the Glenn Center for Research on Aging. N.A. is supported by a Human Frontier Science Program (HFSP) fellowship. D.H.L. and L.O. are supported by the Glenn Center for Research on Aging. G.A. is supported by la Ligue Nationale contre le Cancer (Equipe labellisée Ligue), PIC Programs, the European Commission Network of Excellence EpiGeneSys (HEALTH-F4-2010-257082), the European Commission ITN FP7-PEOPLE-2008-238176 “Nucleosome 4D”, ERC Advanced Grant 2009-AdG_20090506 “Eccentric”, the European Commission large-scale integrating project FP7_HEALTH-2010-259743 “MODHEP”, ANR “ChromaTin” ANR-10-BLAN-1326-03, ANR-11-LABX-0044_DEEP and ANR-10-IDEX-0001-02 PSL*, ANR “CHAPINHIB” ANR-12-BSV5-0022-02 and Aviesan-ITMO cancer project “Epigenomics of breast cancer”. J.K. is supported by the Salk Institute Cancer Center Core Grant (P30CA014195), the National Institutes of Health (R01GM087476, R01CA174942), the Sabo Trust, the Fritz B. Burns Foundation, by Philip Messinger and the Highland Street Foundation.
Footnotes
Author Contributions:
R.O’S. designed and carried out the experiments and wrote the manuscript. N.A, L.O and C.H. designed and carried out experiments. D.H.L. analyzed microarray data. A.C. provided essential reagents and contributed to the original concept of the project. G.A. provided essential reagents, contributed to the original concept of the project and provided additional support throughout. J.K. designed experiments, supervised the work and wrote the manuscript.
Competing Financial Interest:
The authors declare no competing financial interests.
References
- 1.Cesare AJ, Reddel RR. Alternative lengthening of telomeres: models, mechanisms and implications. Nat Rev Genet. 2010;11:319–330. doi: 10.1038/nrg2763. [DOI] [PubMed] [Google Scholar]
- 2.Heaphy CMC, et al. Prevalence of the alternative lengthening of telomeres telomere maintenance mechanism in human cancer subtypes. Am J Pathol. 2011;179:1608–1615. doi: 10.1016/j.ajpath.2011.06.018. [DOI] [PMC free article] [PubMed] [Google Scholar]
- 3.Henson JD, Reddel RR. Assaying and investigating Alternative Lengthening of Telomeres activity in human cells and cancers. FEBS Letters. 2010;584:3800–3811. doi: 10.1016/j.febslet.2010.06.009. [DOI] [PubMed] [Google Scholar]
- 4.Londoño-Vallejo JA, Der-Sarkissian H, Cazes L, Bacchetti S, Reddel RR. Alternative lengthening of telomeres is characterized by high rates of telomeric exchange. Cancer Res. 2004;64:2324–2327. doi: 10.1158/0008-5472.can-03-4035. [DOI] [PubMed] [Google Scholar]
- 5.Yeager TRT, et al. Telomerase-negative immortalized human cells contain a novel type of promyelocytic leukemia (PML) body. Cancer Res. 1999;59:4175–4179. [PubMed] [Google Scholar]
- 6.Cesare AJA, Griffith JDJ. Telomeric DNA in ALT cells is characterized by free telomeric circles and heterogeneous t-loops. Mol Cell Biol. 2004;24:9948–9957. doi: 10.1128/MCB.24.22.9948-9957.2004. [DOI] [PMC free article] [PubMed] [Google Scholar]
- 7.Heaphy CM, et al. Altered telomeres in tumors with ATRX and DAXX mutations. Science. 2011;333:425–425. doi: 10.1126/science.1207313. [DOI] [PMC free article] [PubMed] [Google Scholar]
- 8.Schwartzentruber J, et al. Driver mutations in histone H3.3 and chromatin remodelling genes in paediatric glioblastoma. Nature. 2012:1–8. doi: 10.1038/nature10833. [DOI] [PubMed] [Google Scholar]
- 9.Lovejoy CAC, et al. Loss of ATRX, genome instability, and an altered DNA damage response are hallmarks of the alternative lengthening of telomeres pathway. PLoS Genet. 2012;8:e1002772–e1002772. doi: 10.1371/journal.pgen.1002772. [DOI] [PMC free article] [PubMed] [Google Scholar]
- 10.Bower KK, et al. Loss of Wild-Type ATRX Expression in Somatic Cell Hybrids Segregates with Activation of Alternative Lengthening of Telomeres. PLoS ONE. 2012;7:e50062–e50062. doi: 10.1371/journal.pone.0050062. [DOI] [PMC free article] [PubMed] [Google Scholar]
- 11.Tyler JK, et al. The RCAF complex mediates chromatin assembly during DNA replication and repair. Nature. 1999;402:555–560. doi: 10.1038/990147. [DOI] [PubMed] [Google Scholar]
- 12.Tagami H, Ray-Gallet D, Almouzni G, Nakatani Y. Histone H3.1 and H3.3 complexes mediate nucleosome assembly pathways dependent or independent of DNA synthesis. Cell. 2004;116:51–61. doi: 10.1016/s0092-8674(03)01064-x. [DOI] [PubMed] [Google Scholar]
- 13.Green EME, et al. Replication-Independent Histone Deposition by the HIR Complex and Asf1. Curr Biol. 2005;15:6–6. doi: 10.1016/j.cub.2005.10.053. [DOI] [PMC free article] [PubMed] [Google Scholar]
- 14.Tang YY, et al. Structure of a human ASF1a-HIRA complex and insights into specificity of histone chaperone complex assembly. Nature Structural & Molecular Biology. 2006;13:921–929. doi: 10.1038/nsmb1147. [DOI] [PMC free article] [PubMed] [Google Scholar]
- 15.Groth A, et al. Regulation of Replication Fork Progression Through Histone Supply and Demand. Science. 2007;318:1928–1931. doi: 10.1126/science.1148992. [DOI] [PubMed] [Google Scholar]
- 16.Groth A, et al. Human Asf1 regulates the flow of S phase histones during replicational stress. Mol Cell. 2005;17:301–311. doi: 10.1016/j.molcel.2004.12.018. [DOI] [PubMed] [Google Scholar]
- 17.Jasencakova Z, et al. Replication stress interferes with histone recycling and predeposition marking of new histones. Mol Cell. 2010;37:736–743. doi: 10.1016/j.molcel.2010.01.033. [DOI] [PubMed] [Google Scholar]
- 18.Dunham MA, Neumann AA, Fasching CL, Reddel RR. Telomere maintenance by recombination in human cells. Nat Genet. 2000;26:447–450. doi: 10.1038/82586. [DOI] [PubMed] [Google Scholar]
- 19.Pickett HA, Cesare AJ, Johnston RL, Neumann AA, Reddel RR. Control of telomere length by a trimming mechanism that involves generation of t-circles. 2009:1–11. doi: 10.1038/emboj.2009.42. [DOI] [PMC free article] [PubMed] [Google Scholar]
- 20.Henson JD, et al. DNA C-circles are specific and quantifiable markers of alternative-lengthening-of-telomeres activity. Nat Biotechnol. 2009;27:1181–1185. doi: 10.1038/nbt.1587. [DOI] [PubMed] [Google Scholar]
- 21.Zellinger B, Akimcheva S, Puizina J, Schirato M, Riha K. Ku suppresses formation of telomeric circles and alternative telomere lengthening in Arabidopsis. Mol Cell. 2007;27:163–169. doi: 10.1016/j.molcel.2007.05.025. [DOI] [PubMed] [Google Scholar]
- 22.Damm K, et al. A highly selective telomerase inhibitor limiting human cancer cell proliferation. EMBO J. 2001;20:6958–6968. doi: 10.1093/emboj/20.24.6958. [DOI] [PMC free article] [PubMed] [Google Scholar]
- 23.Lin SY, Elledge SJ. Multiple tumor suppressor pathways negatively regulate telomerase. Cell. 2003;113:881–889. doi: 10.1016/s0092-8674(03)00430-6. [DOI] [PubMed] [Google Scholar]
- 24.Zhang HH, Cohen SNS. Smurf2 up-regulation activates telomere-dependent senescence. Genes & Development. 2004;18:3028–3040. doi: 10.1101/gad.1253004. [DOI] [PMC free article] [PubMed] [Google Scholar]
- 25.Wu KJK, et al. Direct activation of TERT transcription by c-MYC. Nat Genet. 1999;21:220–224. doi: 10.1038/6010. [DOI] [PubMed] [Google Scholar]
- 26.Palm W, de Lange T. How shelterin protects mammalian telomeres. Annu Rev Genet. 2008;42:301–334. doi: 10.1146/annurev.genet.41.110306.130350. [DOI] [PubMed] [Google Scholar]
- 27.Stracker TH, Petrini JHJ. The MRE11 complex: starting from the ends. Nat Rev Mol Cell Biol. 2011;12:90–103. doi: 10.1038/nrm3047. [DOI] [PMC free article] [PubMed] [Google Scholar]
- 28.Toledo LI, et al. A cell-based screen identifies ATR inhibitors with synthetic lethal properties for cancer-associated mutations. Nature Publishing Group. 2011;18:721–727. doi: 10.1038/nsmb.2076. [DOI] [PMC free article] [PubMed] [Google Scholar]
- 29.Hickson I, et al. Identification and characterization of a novel and specific inhibitor of the ataxia-telangiectasia mutated kinase ATM. Cancer Res. 2004;64:9152–9159. doi: 10.1158/0008-5472.CAN-04-2727. [DOI] [PubMed] [Google Scholar]
- 30.Leahy JJJ, et al. Identification of a highly potent and selective DNA-dependent protein kinase (DNA-PK) inhibitor (NU7441) by screening of chromenone libraries. Bioorg Med Chem Lett. 2004;14:5–5. doi: 10.1016/j.bmcl.2004.09.060. [DOI] [PubMed] [Google Scholar]
- 31.Vannier J-BJ, Pavicic-Kaltenbrunner VV, Petalcorin MIRM, Ding HH, Boulton SJS. RTEL1 Dismantles T Loops and Counteracts Telomeric G4-DNA to Maintain Telomere Integrity. Cell. 2012;149:795–806. doi: 10.1016/j.cell.2012.03.030. [DOI] [PubMed] [Google Scholar]
- 32.Sarkies P, Reams C, Simpson LJ, Sale JE. Epigenetic instability due to defective replication of structured DNA. Mol Cell. 2010;40:703–713. doi: 10.1016/j.molcel.2010.11.009. [DOI] [PMC free article] [PubMed] [Google Scholar]
- 33.Burrell RA, et al. Replication stress links structural and numerical cancer chromosomal instability. Nature. 2014;494:492–496. doi: 10.1038/nature11935. [DOI] [PMC free article] [PubMed] [Google Scholar]
- 34.Jiang W-Q, Zhong Z-H, Henson JD, Reddel RR. Identification of candidate alternative lengthening of telomeres genes by methionine restriction and RNA interference. Oncogene. 2007;26:4635–4647. doi: 10.1038/sj.onc.1210260. [DOI] [PubMed] [Google Scholar]
- 35.Draskovic I, et al. Probing PML body function in ALT cells reveals spatiotemporal requirements for telomere recombination. Proc Natl Acad Sci USA. 2009;106:15726–15731. doi: 10.1073/pnas.0907689106. [DOI] [PMC free article] [PubMed] [Google Scholar]
- 36.Muntoni A, Reddel RR. The first molecular details of ALT in human tumor cells. Human Molecular Genetics. 2005;14 Spec(No. 2):R191–R196. doi: 10.1093/hmg/ddi266. [DOI] [PubMed] [Google Scholar]
- 37.Wang XX, et al. Rad17 Phosphorylation Is Required for Claspin Recruitment and Chk1 Activation in Response to Replication Stress. Mol Cell. 2006;23:11–11. doi: 10.1016/j.molcel.2006.06.022. [DOI] [PubMed] [Google Scholar]
- 38.Nimonkar AV, et al. BLM-DNA2-RPA-MRN and EXO1-BLM-RPA-MRN constitute two DNA end resection machineries for human DNA break repair. Genes & Development. 2011;25:350–362. doi: 10.1101/gad.2003811. [DOI] [PMC free article] [PubMed] [Google Scholar]
- 39.Lin W, et al. Mammalian DNA2 helicase/nuclease cleaves G-quadruplex DNA and is required for telomere integrity. EMBO J. 2013:1–15. doi: 10.1038/emboj.2013.88. [DOI] [PMC free article] [PubMed] [Google Scholar]
- 40.Davies SL, North PS, Hickson ID. Role for BLM in replication-fork restart and suppression of origin firing after replicative stress. Nature Publishing Group. 2007;14:677–679. doi: 10.1038/nsmb1267. [DOI] [PubMed] [Google Scholar]
- 41.Gravel S, Chapman JR, Magill C, Jackson SP. DNA helicases Sgs1 and BLM promote DNA double-strand break resection. Genes & Development. 2008;22:2767–2772. doi: 10.1101/gad.503108. [DOI] [PMC free article] [PubMed] [Google Scholar]
- 42.Cejka P, et al. DNA end resection by Dna2-Sgs1-RPA and its stimulation by Top3-Rmi1 and Mre11-Rad50-Xrs2. Nature. 2010;467:112–116. doi: 10.1038/nature09355. [DOI] [PMC free article] [PubMed] [Google Scholar]
- 43.Davies SLS, North PSP, Dart AA, Lakin NDN, Hickson IDI. Phosphorylation of the Bloom's syndrome helicase and its role in recovery from S-phase arrest. Mol Cell Biol. 2004;24:1279–1291. doi: 10.1128/MCB.24.3.1279-1291.2004. [DOI] [PMC free article] [PubMed] [Google Scholar]
- 44.Chan KL, Palmai-Pallag T, Ying S, Hickson ID. Replication stress induces sister-chromatid bridging at fragile site loci in mitosis. Nat Cell Biol. 2009;11:753–760. doi: 10.1038/ncb1882. [DOI] [PubMed] [Google Scholar]
- 45.Barefield C, Karlseder J. The BLM helicase contributes to telomere maintenance through processing of late-replicating intermediate structures. Nucleic Acids Res. 2012;40:7358–7367. doi: 10.1093/nar/gks407. [DOI] [PMC free article] [PubMed] [Google Scholar]
- 46.Sfeir A, et al. Mammalian Telomeres Resemble Fragile Sites and Require TRF1 for Efficient Replication. Cell. 2009;138:14–14. doi: 10.1016/j.cell.2009.06.021. [DOI] [PMC free article] [PubMed] [Google Scholar]
- 47.Ralf C, Hickson ID, Wu L. The Bloom’s syndrome helicase can promote the regression of a model replication fork. J Biol Chem. 2006;281:22839–22846. doi: 10.1074/jbc.M604268200. [DOI] [PubMed] [Google Scholar]
- 48.Nguyen GH, et al. A Small Molecule Inhibitorof the BLM Helicase Modulates Chromosome Stability in Human Cells. Chem Biol. 2013;20:55–62. doi: 10.1016/j.chembiol.2012.10.016. [DOI] [PMC free article] [PubMed] [Google Scholar]
- 49.Hu J, et al. Antitelomerase Therapy Provokes ALT and Mitochondrial Adaptive Mechanisms in Cancer. Cell. 2012;148:651–663. doi: 10.1016/j.cell.2011.12.028. [DOI] [PMC free article] [PubMed] [Google Scholar]
- 50.Martínez PP, et al. Increased telomere fragility and fusions resulting from TRF1 deficiency lead to degenerative pathologies and increased cancer in mice. Genes & Development. 2009;23:2060–2075. doi: 10.1101/gad.543509. [DOI] [PMC free article] [PubMed] [Google Scholar]
- 51.Makarov VL, Lejnine S, Bedoyan J, Langmore JP. Nucleosomal organization of telomere-specific chromatin in rat. Cell. 1993;73:775–787. doi: 10.1016/0092-8674(93)90256-p. [DOI] [PubMed] [Google Scholar]
- 52.Pisano S, et al. Telomeric nucleosomes are intrinsically mobile. J. Mol. Biol. 2007;369:1153–1162. doi: 10.1016/j.jmb.2007.04.027. [DOI] [PubMed] [Google Scholar]
- 53.O’Sullivan RJ, Kubicek S, Schreiber SL, Karlseder J. Reduced histone biosynthesis and chromatin changes arising from a damage signal at telomeres. Nature Structural & Molecular Biology. 2010;17:1218–1225. doi: 10.1038/nsmb.1897. [DOI] [PMC free article] [PubMed] [Google Scholar]
- 54.Conomos D, et al. Variant repeats are interspersed throughout the telomeres and recruit nuclear receptors in ALT cells. J Cell Biol. 2012;199:893–906. doi: 10.1083/jcb.201207189. [DOI] [PMC free article] [PubMed] [Google Scholar]
- 55.de Wilde RF, et al. Loss of ATRX or DAXX expression and concomitant acquisition of the alternative lengthening of telomeres phenotype are late events in a small subset of MEN-1 syndrome pancreatic neuroendocrine tumors. Mod Pathol –. 2012 doi: 10.1038/modpathol.2012.53. [DOI] [PMC free article] [PubMed] [Google Scholar]
- 56.Corpet A, et al. Asf1b, the necessary Asf1 isoform for proliferation, is predictive of outcome in breast cancer. EMBO J. 2011;30:480–493. doi: 10.1038/emboj.2010.335. [DOI] [PMC free article] [PubMed] [Google Scholar]
- 57.Hartford SAS, et al. Minichromosome maintenance helicase paralog MCM9 is dispensible for DNA replication but functions in germ-line stem cells and tumor suppression. Proc Natl Acad Sci USA. 2011;108:17702–17707. doi: 10.1073/pnas.1113524108. [DOI] [PMC free article] [PubMed] [Google Scholar]
- 58.Jiang W-Q, Nguyen A, Cao Y, Chang AC-M, Reddel RR. HP1-mediated formation of alternative lengthening of telomeres-associated PML bodies requires HIRA but not ASF1a. PLoS ONE. 2011;6:e17036–e17036. doi: 10.1371/journal.pone.0017036. [DOI] [PMC free article] [PubMed] [Google Scholar]
- 59.Elsässer SJ, et al. DAXX envelops an H3.3-H4 dimer for H3.3-specific recognition. Nature. 2012:1–8. doi: 10.1038/nature11608. [DOI] [PMC free article] [PubMed] [Google Scholar]
- 60.Liu P, et al. Chromosome Catastrophes Involve Replication Mechanisms Generating Complex Genomic Rearrangements. Cell. 2011;146:889–903. doi: 10.1016/j.cell.2011.07.042. [DOI] [PMC free article] [PubMed] [Google Scholar]
- 61.Moffat J, et al. A lentiviral RNAi library for human and mouse genes applied to an arrayed viral high-content screen. Cell. 2006;124:1283–1298. doi: 10.1016/j.cell.2006.01.040. [DOI] [PubMed] [Google Scholar]
- 62.Cesare AJ, Hayashi MT, Crabbe L, Karlseder J. The telomere deprotection response is functionally distinct from the genomic DNA damage response. Mol Cell. 2013;51:141–155. doi: 10.1016/j.molcel.2013.06.006. [DOI] [PMC free article] [PubMed] [Google Scholar]
- 63.Everett RD, et al. PML contributes to a cellular mechanism of repression of herpes simplex virus type 1 infection that is inactivated by ICP0. J Virol. 2006;80:7995–8005. doi: 10.1128/JVI.00734-06. [DOI] [PMC free article] [PubMed] [Google Scholar]
- 64.You Z, et al. CtIP links DNA double-strand break sensing to resection. Mol Cell. 2009;36:954–969. doi: 10.1016/j.molcel.2009.12.002. [DOI] [PMC free article] [PubMed] [Google Scholar]
- 65.Duxin JP, et al. Okazaki Fragment Processing-independent Role for Human Dna2 Enzyme during DNA Replication. J Biol Chem. 2012;287:21980–21991. doi: 10.1074/jbc.M112.359018. [DOI] [PMC free article] [PubMed] [Google Scholar]
- 66.Crabbe L, Verdun R, Haggblom C, Karlseder J. Defective telomere lagging strand synthesis in cells lacking WRN helicase activity. Science. 2004;306:1951–1953. doi: 10.1126/science.1103619. [DOI] [PubMed] [Google Scholar]
- 67.Theunissen J-WF, Petrini JHJ. Methods for studying the cellular response to DNA damage: influence of the Mre11 complex on chromosome metabolism. Meth Enzymol. 2006;409:251–284. doi: 10.1016/S0076-6879(05)09015-4. [DOI] [PubMed] [Google Scholar]
- 68.Lewis PW, Elsaesser SJ, Noh K-M, Stadler SC, Allis CD. Daxx is an H3.3-specific histone chaperone and cooperates with ATRX in replication-independent chromatin assembly at telomeres. Proc Natl Acad Sci USA. 2010;107:14075–14080. doi: 10.1073/pnas.1008850107. [DOI] [PMC free article] [PubMed] [Google Scholar]
- 69.Hayashi MTM, Cesare AJA, Fitzpatrick JAJJ, Lazzerini-Denchi EE, Karlseder JJ. A telomere-dependent DNA damage checkpoint induced by prolonged mitotic arrest. Nature Structural & Molecular Biology. 2012;19:387–394. doi: 10.1038/nsmb.2245. [DOI] [PMC free article] [PubMed] [Google Scholar]
Associated Data
This section collects any data citations, data availability statements, or supplementary materials included in this article.