

Abstract
Objectives
Newly developed techniques for understanding brain connectivity have emerged with the application of graph theory-based measures to neuroimaging modalities. However, the cognitive correlates of these measures, particularly in the context of clinical diagnoses like major depression, are still poorly understood. The purpose of this study was to compare four measures of network efficiency derived from novel techniques for understanding white matter connectivity on their associations with aging, depression, and cognition.
Design
Cross-sectional neuroimaging study
Setting
General community
Participants
We recruited 43 healthy comparison subjects and 40 subjects with major depressive disorder who volunteered in response to advertisements.
Measurements
Brain network efficiency measures were generated from diffusion tensor imaging-derived structural connectivity matrices using the Brain Connectivity Toolbox (www.brain-connectivity-toolbox.net). Information processing speed and decision making were assessed with the Trail Making Test and the Object Alternation task, respectively.
Results
All four network efficiency measures correlated negatively with age. In the depressed group, normalized global efficiency was negatively correlated with depression severity while increasing global efficiency was associated with poorer performance on Object Alternation.
Conclusions
Brain network efficiency measures may represent different aspects of underlying network organization depending on the population and behaviors in question.
Objective
Diffusion tensor imaging (DTI) has emerged as a popular way to explore white matter integrity in healthy as well as disease populations. With DTI, white matter tracts can be constructed and virtually dissected to analyze individual differences in structural connectivity. One of the novel ways that DTI tractography has been used recently is in the application of graph theory-based network analysis. In brief, graph theory-based network analysis models ‘the brain as graph’ characterized by nodes (i.e., brain regions) and edges (i.e., functional or structural connections between regions) that connect nodes. Once the brain has been modeled in this manner, various network metrics can be calculated that elucidate the function and organization of the brain as a network (22). For instance, studies using this technique have detected differences in disease populations in the organization of the brain in terms of modules or communities thought to reflect pathological brain changes associated with the disease (9,24). A frequently used measure associated with this technique is network efficiency, a measure of network integration. Network efficiency represents the number of steps required to get information from one part of the derived brain network to another. It is thought that highly efficient networks require very few steps or shorter path lengths, while inefficient networks require multiple steps. There are two ways networks can increase their efficiency, integration and randomization. With network integration, distributed information is easily combined throughout a network with strategically placed connections (22). With network randomization, an increase in randomly placed connections can reduce the path length and thus increase network efficiency.
Network efficiency can be measured using a number of different neuroimaging modalities. Structural brain networks are often created using data from DTI or the structural covariance of gray matter volumes. Functional brain networks can be generated from resting-state functional magnetic resonance imaging (rs-fMRI). One of the first studies to examine the association of age with this concept of network efficiency published by Achard and Bullmore demonstrated reduced efficiency in older adults using rs-fMRI (1). Contrary to this result, using DTI-derived networks, Gong et al demonstrated that global efficiency as a function of network cost (integrated global efficiency) did not decline with age (10). However, a study by Wen et al utilizing similar DTI-based methods confirmed earlier findings by Achard and Bullmore that global network efficiency declines with age (26). Further complicating the picture, in a study looking at gray matter structural covariance networks in three age groups, younger subjects (14–40 years) had lower global efficiencies compared to older subjects (61–80 years) (27).
There are similarly conflicting reports demonstrating alterations in global efficiency in various disease states including depression. In our own recent study using gray matter structural covariance, we found untreated late-life depressed subjects had significant lower global efficiencies compared to healthy elderly subjects (2). Using rs-fMRI to generate functional connectivity graphs, global efficiency was reported to be significantly higher in younger first-episode, depressed subjects compared to healthy comparison subjects (29). In contrast, using DTI-generated networks, it has been shown that global efficiency was reduced in population of remitted geriatric depression subjects compared to healthy elderly control subjects (3). These differences could be due to MRI modalities employed in graph theory analyses and/or the populations evaluated; however, more work needs to be done exploring the types of network efficiency available for interrogation and their associations to study-specific populations in question.
In addition to disease states, studies have revealed that brain network efficiency is associated with aspects of cognitive function in both healthy and clinical populations. Initial studies demonstrated that IQ was positively associated with global efficiency in healthy adults (17,25). Older healthy adults demonstrated that both local and global efficiency (measures of network segregation and network integration, respectively) were positively associated with a composite index of executive function and information processing speed (26). In a study of mild cognitive impairment, Shu and colleagues demonstrated that global efficiency was positively correlated with information processing speed (23). Similar findings have recently been reported in type 2 diabetes (21). Little to no work associating network efficiency metrics and cognition in depression has been reported despite the relatively well-established link between executive function and information processing speed in this population.
While the aforementioned studies have examined altered network efficiency associated with aging, depression across the lifespan, and cognition, it is not clear whether increased network efficiency more closely reflects network integration (as suggested by aging studies) or network randomization (implied by the functional studies of major depression). The purpose of this study was to conceptually evaluate four different measures of network efficiency derived from white matter connectivity analyses on their associations with aging, depression, and cognition. We examined three measures of global efficiency and local efficiency previously documented in the literature and compared a depressed versus never depressed sample ranging from age 30 to 88, on measures of information processing speed and decision making. We hypothesized that if efficiency reflects network integration, then brain network efficiency would be negatively associated with age and depression severity and positively associated with information processing speed and executive function.
Methods
Subject Recruitment
We recruited 40 subjects with major depression and 43 healthy comparison subjects from the greater Chicago area through flyers and local advertisements as part of a larger ongoing neuroimaging study at the University of Illinois at Chicago (UIC). The inclusion criteria for all subjects were 30 years of age and older, medication-naive or anti-depressant free for at least two weeks (in the case of our depressed subjects) and no history of unstable cardiac or neurological diseases. The exclusion criteria included: schizophrenia, bipolar or any psychotic disorders; history of anxiety disorder outside of major depressive episodes; history of head trauma; history of substance abuse; contraindications to MRI such as metal implants. This study was approved by the University of Illinois-Chicago Institutional Review Board, and written informed consent was obtained from each participant.
All eligible subjects were assessed by a trained research assistant with the Structured Clinical Interview for Diagnostic and Statistical Manual of Mental Disorders, Fourth Edition (DSM-IV). The severity of depression was quantified by a board-certified/board-eligible psychiatrist (AK or OA) using the 17-item Hamilton Depression Rating Scale (11). At the time of enrollment, depressed subjects met DSM-IV criteria for MDD and required a score of 15 or greater on the HAM-D. Subjects were also administered the Center for Epidemiologic Studies of Depression (CES-D) scale as an independent measure of depression severity (20). The CES-D was used for correlation analyses as the HAM-D was the measure used in the determination of subject eligibility for depression.
MRI Image Acquisition
All brain MRI data were acquired using a Philips Achieva 3T scanner (Philips Medical Systems, Best, the Netherlands) with 8-element SENSE (Sensitivity Encoding) head-coil. Subjects were fitted with soft ear plugs, positioned comfortably in the coil, and instructed to remain still. Foam pads were used to minimize head motion. For each subject, DTI images were acquired using single-shot spin-echo echo-planar imaging (EPI) sequence (field of view or FOV=240mm; acquired voxel size = 2.21×2.21×2.20mm; reconstructed voxel size = 0.83×0.83×2.2mm; TR/TE=6,994/71ms; Flip angle=90°). Sixty seven contiguous axial slices aligned to the anterior commissure–posterior commissure (AC-PC) line were collected along 32 gradient directions with b=700s/mm2 and one minimally diffusion-weighted scan (the b0 image). Parallel imaging was utilized with p-factor of 2.5 to reduce scan time to approximately 4 minutes.
Network Analysis
To generate brain network data, a pipeline was constructed which integrates multiple image analysis technique based on previously published methods (14,23). Diffusion weighted images were eddy current corrected using the automatic image registration tool in DTI-Studio (http://www.mristudio.org;12) by registering all diffusion-weighted images to their corresponding b0 images. Two eddy current correction (ECC) techniques were employed: rigid body (rotation and translation, 6 parameters) and affine (rotation, translation, scaling and shear, 12 parameters). This was followed by the computation of diffusion tensors then deterministic tractography using the Fiber Assignment by Continuous Tracking (FACT) algorithm built into the DTI-Studio program. For each subject, tractography was first performed by tracking the whole brain, initiating tracts at each voxel. Fiber tracking was stopped when FA value falls below 0.15 or a turning angle becomes larger than 60°.
T1-weighted images were used to generate label maps using the FreeSurfer image analysis suite (http://surfer.nmr.mgh.harvard.edu/) for volumetric segmentation (6–8). Each label map is composed of 87 different gray matter regions of interest (ROIs), which include cortical and subcortical regions as well as the brainstem and cerebellum.
Brain structural networks were generated by counting the number of reconstructed streamlines from the white matter tractography data connecting every pair of gray matter ROIs (i.e. the “nodes”) defined by Freesurfer’s parcellation atlas. The resulting matrices were then analyzed using a set of Matlab-based functions implemented in the Brain Connectivity Toolbox (http://brain-connectivity-toolbox.net/) to generate our measures of global and local network efficiency (22). Three measures of global network efficiency were obtained. Native global efficiency (Enative) was calculated as the global efficiency of the actual network with no thresholding. Normalized global efficiency (Enorm) was the ratio of the Enative to the global efficiency of a random network of equal size and cost to the actual network. Integrated global efficiency (Eint) measured global efficiency as a function of cost. Network cost was calculated as the number of edges in the network as a fraction of all possible edges in the network. Local efficiency (Eloc)is the efficiency of a subnetwork containing a particular node and its network neighbors. Table 1 outlines these metrics in greater detail.
Table 1. Network Efficiency Measures.
Global and local efficiency measures. All three global efficiency measures reflect network integration, while local efficiency reveals network segregation. Results for significant associations with age, depression, and object alternation (OA) performance are summarized.
| Measure | Description | Interpretation | Age | Depression | OA performance |
|---|---|---|---|---|---|
| Native Global Efficiency (Enative) | Efficiency of information transfer in the unthresholded network | Network Integration | ↓ | ---- | ↓ (in MDD) |
| Normalized Global Efficiency (Enorm) | Effiency of information transfer in the unthresholded network divided by the efficiency of a random network of equal size | Network Integration | ↓ | ↓ | ---- |
| Integrated Global Efficiency (Eint) | Efficiency of information transfer in the network as a function of network cost | Network Integration | ↓ | ---- | ↓ (in MDD) |
| Local Efficiency (Eloc) | Efficiency of information transfer between a node and neighboring network nodes | Network Segregation | ↓ ( in prefrontal, temporal cortex) | ---- | ---- |
Neuropsychological Battery
In addition to neuroimaging, subjects completed a comprehensive neuropsychological protocol. Of relevance to the present study were measures of executive function and information processing with timed components. To this end, we focused on the Trail Making Test Part A and B (TMTA; TMTB) and Object Alternation (OA). TMTA, a measure of attention and information processing speed, involves rapidly connecting consecutively numbered circles. TMTB, an executive function task, requires rapidly connecting alternating numbers and letters in sequence (16). Performance is measured in time (i.e., seconds) to completion.
OA is another executive test that relies on the ability to establish and maintain set based on visual and auditory feedback (18,28). OA in the present study was computerized and consisted of the computerized presentation of a red circle and a blue square on each trial. Participants were instructed to find the star hidden under either the red circle or the blue square with aforementioned feedback providing clues as to the object of the game – alternate between the two objects and get the star every trial. OA concluded upon the completion of 10 consecutively correct trials or maxed out at 50 trials. The dependent variables were trials to completion, number of perseverative errors relative to total trials to completion and average reaction time per trial.
Statistical Analysis
Demographic, clinical, and network variables were analyzed for between-group differences using an independent sample t-test for continuous variables and chi-squared test for categorical variables. Levene’s Test for Equality of Variances were used for all t-tests (15). Bivariate correlations were used to analyze the relationship between network efficiency measures and age both regardless of age and by group. Local efficiency correlation analyses – given the number performed in comparison to the global efficiency analyses – were adjusted for multiple comparisons using the false discovery rate (4) with a significance threshold set at q < .05. Additionally, two-tailed partial correlations were used to examine the relationship between network efficiency and depression severity, as well as network efficiency and cognitive function (adjusting for age, sex and predicted verbal IQ) both regardless of and by group distinctions. All statistical analyses were performed in the SPSS software, version 18.0 (SPSS, Somers, NY).
Results
Between-Group Comparisons
The clinical and demographic characteristics are summarized in Table 1. There were no significant differences in age, sex distribution, or predicted verbal IQ scores. There were no significant differences between in any global or local efficiency measures. Depressed subjects performed significantly worse on the OA task with more trials to completion, longer reaction times, and more errors per trial. There were no significant differences on Trails A or B performance.
Global Network Efficiency and Age
The three global efficiency measures were significantly correlated with other (Enative and Enorm: r = .307, p = .005, df = 81; Enative and Eint: r = .809, p < .0001, df = 81; Enorm and Eint: r = .381, p < .001, df = 81). All measures of network efficiency were significantly associated age. Eint demonstrated the largest negative association (r = −.425, p<.0001, df = 81; Figure 1), followed by Enative (r = −.410, p<.0001, df = 81) and normalized global efficiency (r = −.310, p =.003, df = 81). These correlations remained significant by subject group. Thus, in healthy comparison subjects, age was associated with native and integrated global efficiency (r = −.496, p = .001; r = −.416, p = .006, df = 41) and not associated with normalized global efficiency (r = −.299, p = .052, df = 41). In MDD, all three measures were significantly correlated with age (Enative: r = −.348, p = .028; Enorm: r = −.314, p = .048, Eint: r = −.423, p = .007, df = 38).
Figure 1. Integrated global efficiency correlated with age.
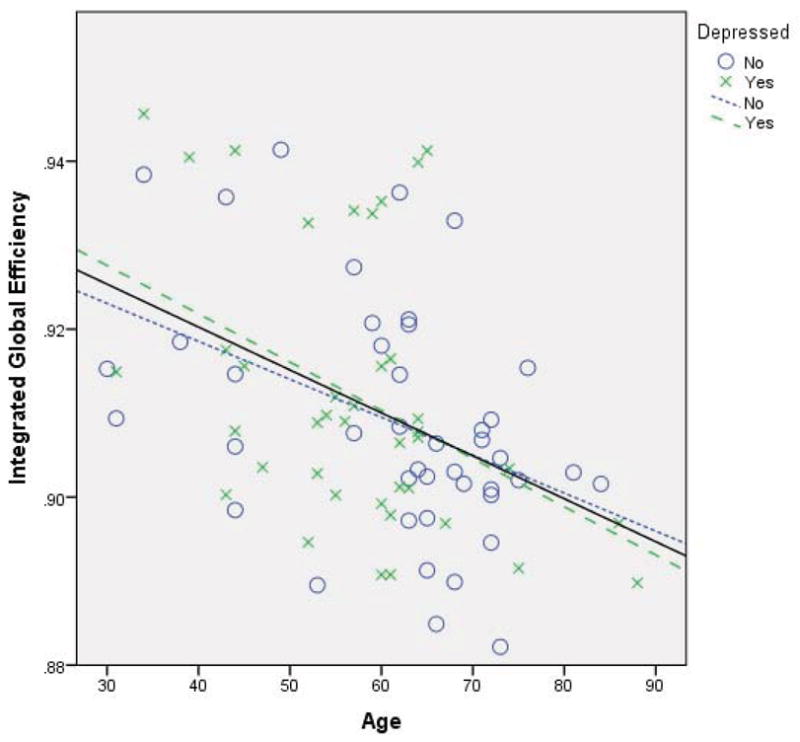
Correlation of age and integrated global efficiency. Age was negatively associated with integrated global efficiency in both subject groups (healthy comparison: dotted line; major depression: dashed line) and the total sample (solid line).
Global Network Efficiency and Depression
Across the entire sample, there were no significant correlations between efficiency measures and depression severity. When analyzed by group, only normalized global efficiency was negatively correlated with depression severity within the depressed sample (r = −.343, p = .033, df = 37).
Global Network Efficiency and Cognitive Function
Integrated global efficiency was significantly associated with OA trials to completion (r = .255, p = .028, df = 72), reaction time (r = .254, p = .029, df = 72), and errors per trial (r = .273, p = .018, df = 72). Native global efficiency was only significantly correlated with OA errors per trial (r = .315, p = .006, df = 72). These overall sample correlations were driven by the depressed group as there were no significant correlations between cognitive and global efficiency measures in healthy comparison subjects. Thus, in the depressed group, both native and integrated global efficiency were significantly associated with OA trials to completion (Enative: r = .370, p = .024, df = 34; Eint: r = .427, p = .009, df = 34) and OA errors per trial (Enative: r = .483, p = .003, df = 34; Eint: r = .427, p = .009, df = 34). There were no significant correlations with any global efficiency measures and TMTA and TMTB.
Local Network Efficiency
Across the total sample, local efficiency correlated with age in predominately temporal regions, as well as bilateral precentral cortex and the right rostral middle frontal gyrus in the dorsolateral prefrontal cortex (Figure 2a). In HC subjects, age was negatively associated with local efficiency in the left entorhinal cortex, right precentral gyrus, and bilateral fusiform gyri (Figure 2b). In MDD subjects, bilateral hippocampal local efficiencies were associated with age (Figure 2c). There were no significant correlations between Eloc and depression severity or cognitive measures.
Figure 2. Local efficiency correlated with age.

Correlation of age and local efficiency on an inferior view of the brain (A: Anterior, P: Posterior, L: Left, R: Right). a) Total sample, b) HC: healthy comparison group, c) MDD: major depression group. All nodes indicated in red, significantly associated nodes after false discovery rate correction are indicated in green. Each node represents a Freesurfer-defined brain region with the node placed at the coordinates of each brain region’s centroid.
Discussion
To our knowledge, this is the first study to examine differential results of specific network efficiency metrics let alone within the context of clinical/cognitive correlates in major depression. Consistent with previous studies (26), we found that global network efficiency declines with age in both healthy controls and depressed subjects. Normalized global efficiency was the only measure to exhibit declines with increasing depression severity and only in depressed subjects. This was despite no between-group differences in this metric. Results may reflect the fact that the normalization associated with this global efficiency measure adjusts for fundamental organizational network properties like randomization; an aspect of network disorganization that may be more prevalent in individuals with depression. By controlling for this randomization, results for normalized global efficiency revealed a negative relationship between depression severity and global efficiency. In contrast, this same depressed group showed a positive relationship between native as well as integrated network efficiency and poor performance on the OA task. This highlights the differential associations of the various global efficiency measures examined in the present study as they relate to clinical populations’ overall behavioral presentation.
In depressed subjects, both Enative and Eint were positively associated with poor performance on the OA task with Eint associated with all aspects of performance and Enative associated with errors relative to total trials only. This provides evidence that in the context of major depression, increased network efficiency is a reflection of a more random network that could explain poor performance. Global network efficiency reflects different aspects of underlying network organization depending on clinical and cognitive context. For example, in depression, increased network efficiency may represent a tendency towards a more random organization. Optimized brain networks have a balance of integration (combining distributed functions) and segregation (separating distributed functions). If additional network connections are not organized according to function, random networks can have increased efficiency or network integration at the cost of decreased network segregation. Further suggestive of this notion is that gamma, a measure of network segregation (22), was negatively correlated with OA trials to completion (r = −.372, p = .026, df = 34) and OA errors per trial (r = −.429, p = .009, df = 34) in depressed subjects.
Focusing on local efficiency, our primary findings demonstrated significant correlations with age – predominately within temporal lobe regions for the entire group. It should be noted, however, that the breakdown of affiliated regions differed based on the presence or absence of a clinically diagnosed depression. For example, local efficiency declined with age in bilateral hippocampal regions in major depression while more subtle alterations in the entorhinal cortex were seen in healthy controls. Previous studies in aging populations would suggest that hippocampal complex findings – particularly as they relate to behavioral manifestations of learning and memory deficits – are only seen in the presence of pathological entities such as dementia and/or depression (13). Our work with network efficiency metrics would suggest that local efficiency measures derived from graph theory may be more sensitive to alterations in hippocampal subregions than more traditional measures of brain structure. The association to learning and memory remains to be determined but holds promise given the strong r-values displayed in our healthy control group. The decreased local efficiency seen in these vulnerable temporal regions can be conceptualized as a reduction in network segregation or less functional specialization. Consistent with this notion, one of the brain regions that declined with age in healthy comparison subjects, the fusiform gyrus, has been shown to exhibit less stimulus-specific activation (namely, faces) with age (19).
In conclusion, while all measures of global efficiency significantly correlated with age, not all measures of global efficiency correlated with behavior. It follows that not all global efficiency metrics derived from graph theory are equivalent. Thus, the interpretation of network-based measures across the lifespan depends on the age and the clinical characteristics of the sample under study as well as the cognitive/affective functions being measured. Furthermore, several local metrics of hippocampal efficiency may prove valuable in preclinical states of pathological aging – an area of increased study with the advent of NIH-based initiatives to understand this predominantly mid-life state (5). In sum, our study highlights the importance of acknowledging the clinical and cognitive context within which networkbased metrics of neuroimaging are to be used in various aging populations.
Table 2. Subject Characteristics.
Subject groups did not differ on age, sex distribution, years of education, or predicted verbal IQ. As expected, depressed subjects had significantly higher depression rating scores (HAMD: Hamilton Rating Scale for Depression; CESD: Center for Epidemiological Studies Depression Scale). There were no differences in global efficiency measures. Cognitive measures are represented by z-scores. Depressed subjects performed signficantly worse on the object alternation (OA) task.
| HC | MDD | t | df | p-value | |
|---|---|---|---|---|---|
| N | 40 | 43 | |||
| Age | 61.3 (13.1) | 57.4 (11.9) | 1.442 | 81 | .153 |
| Gender (M/F) | 17/26 | 13/27 | χ2 = .444 | 1 | .505 |
| Education (years) | 15.7 (3.11) | 14.7 (2.79) | 1.54 | 81 | .128 |
| HAMD | .88 (1.3) | 19.03 (2.83) | −37.06 | 53.75 | <.0001 |
| CESD | 4.53 (4.71) | 31.15 (8.54) | −17.23 | 57.88 | <.0001 |
| Predicted Verbal IQ | 108.68 (11.93) | 105.28 (12.32) | 1.27 | 79 | .21 |
| Native Global Efficiency | 151.76 (36.67) | 165.75 (58.24) | −1.3 | 64.88 | .2 |
| Normalized Global Efficiency | .95 (.03) | .96 (.03) | −1.26 | 81 | .212 |
| Integrated Global Efficiency | .91 (.01) | .91 (.02) | −.882 | 81 | .381 |
| Trail Making Test A | 0 (1.0) | −.07 (1.2) | F = 1.06 | 1,72 | .306 |
| Trail Making Test B | 0 (1.0) | −.11 (1.0) | F = .263 | 1,72 | .61 |
| OA trials to completion | 0.02 (1.0) | .59 (.66) | F = 8.78 | 1,72 | .004 |
| OA reaction time | 0 (1.0) | .51 (.75) | F = 6.44 | 1,72 | .013 |
| OA errors/trial | 0 (.99) | .51 (.81) | F = 5.8 | 1,72 | .019 |
Acknowledgments
Funding Support: There are no conflicts of interest to disclose for any of the authors. This study was supported by research grants from NIMH to Anand Kumar, M.D. (R01 MH-073989) and Olusola Ajilore, M.D., Ph.D. (K23 MH-081175).
Footnotes
Publisher's Disclaimer: This is a PDF file of an unedited manuscript that has been accepted for publication. As a service to our customers we are providing this early version of the manuscript. The manuscript will undergo copyediting, typesetting, and review of the resulting proof before it is published in its final citable form. Please note that during the production process errors may be discovered which could affect the content, and all legal disclaimers that apply to the journal pertain.
Reference List
- 1.Achard S, Bullmore E. Efficiency and cost of economical brain functional networks. PLoS Comput Biol. 2007;3 (2):e17. doi: 10.1371/journal.pcbi.0030017. [DOI] [PMC free article] [PubMed] [Google Scholar]
- 2.Ajilore O, Lamar M, Leow A, et al. Graph theory analysis of cortical-subcortical networks in late-life depression. American Journal of Geriatric Psychiatry. 2013 doi: 10.1016/j.jagp.2013.03.005. [DOI] [PMC free article] [PubMed] [Google Scholar]
- 3.Bai F, Shu N, Yuan Y, et al. Topologically Convergent and Divergent Structural Connectivity Patterns between Patients with Remitted Geriatric Depression and Amnestic Mild Cognitive Impairment. J Neurosci. 2012;32 (12):4307–4318. doi: 10.1523/JNEUROSCI.5061-11.2012. [DOI] [PMC free article] [PubMed] [Google Scholar]
- 4.Benjamini Y, Hochberg Y. Controlling the false discovery rate: a practical and powerful approach to multiple testing. Journal of the Royal Statistical Society, Series B (Methodological) 1995;57:289–300. [Google Scholar]
- 5.Carrillo MC, Brashear HR, Logovinsky V, et al. Can we prevent Alzheimer’s disease? Secondary “prevention” trials in Alzheimer’s disease. Alzheimers Dement. 2013 doi: 10.1016/j.jalz.2012.12.004. [DOI] [PubMed] [Google Scholar]
- 6.Desikan RS, Ségonne F, Fischl B, et al. An automated labeling system for subdividing the human cerebral cortex on MRI scans into gyral based regions of interest. Neuroimage. 2006;31 (3):968–980. doi: 10.1016/j.neuroimage.2006.01.021. [DOI] [PubMed] [Google Scholar]
- 7.Destrieux C, Fischl B, Dale A, et al. Automatic parcellation of human cortical gyri and sulci using standard anatomical nomenclature. Neuroimage. 2010;53 (1):1–15. doi: 10.1016/j.neuroimage.2010.06.010. [DOI] [PMC free article] [PubMed] [Google Scholar]
- 8.Fischl B, van der Kouwe A, Destrieux C, et al. Automatically Parcellating the Human Cerebral Cortex. Cereb Cortex. 2004;14 (1):11–22. doi: 10.1093/cercor/bhg087. [DOI] [PubMed] [Google Scholar]
- 9.GadElkarim J, Schonfeld D, Ajilore O, et al. A Framework for Quantifying Node-Level Community Structure Group Differences in Brain Connectivity Networks. MICCAI. 2012;2:196–203. doi: 10.1007/978-3-642-33418-4_25. [DOI] [PMC free article] [PubMed] [Google Scholar]
- 10.Gong G, Rosa-Neto P, Carbonell F, et al. Age- and gender-related differences in the cortical anatomical network. J Neurosci. 2009;29 (50):15684–15693. doi: 10.1523/JNEUROSCI.2308-09.2009. [DOI] [PMC free article] [PubMed] [Google Scholar]
- 11.Hamilton M. A rating scale for depression. J Neurol Neurosurg Psychiatry. 1960;23:56–62. doi: 10.1136/jnnp.23.1.56. [DOI] [PMC free article] [PubMed] [Google Scholar]
- 12.Jiang H, van Zijl PC, Kim J, et al. DtiStudio: resource program for diffusion tensor computation and fiber bundle tracking. Comput Methods Programs Biomed. 2006;81 (2):106–116. doi: 10.1016/j.cmpb.2005.08.004. [DOI] [PubMed] [Google Scholar]
- 13.Lamar M, Charlton R, Zhang A, et al. Differential associations between types of verbal memory and prefrontal brain structure in healthy aging and late life depression. Neuropsychologia. 2012;50 (8):1823–1829. doi: 10.1016/j.neuropsychologia.2012.04.007. [DOI] [PMC free article] [PubMed] [Google Scholar]
- 14.Leow A, Ajilore O, Zhan L, et al. Impaired Inter-Hemispheric Integration in Bipolar Disorder Revealed with Brain Network Analyses. Biol Psychiatry. 2013;73 (2):183–193. doi: 10.1016/j.biopsych.2012.09.014. [DOI] [PMC free article] [PubMed] [Google Scholar]
- 15.Levene H. Contributions to Probability and Statistics: Essays in Honor of Harold Hotelling. Stanford University Press; 1960. Robust tests for equality of variances; pp. 278–292. [Google Scholar]
- 16.Lezak MD. Neuropsychological Assessment. New York City: Oxford University Press; 1995. [Google Scholar]
- 17.Li Y, Liu Y, Li J, et al. Brain anatomical network and intelligence. PLoS Comput Biol. 2009;5 (5):e1000395. doi: 10.1371/journal.pcbi.1000395. [DOI] [PMC free article] [PubMed] [Google Scholar]
- 18.Mishkin M, est B, axler M, et al. A re-examination of the effects of frontal lesions on object alternation. Neuropsychologia. 1969;7:357–363. [Google Scholar]
- 19.Park J, Carp J, Kennedy KM, et al. Neural broadening or neural attenuation? Investigating age-related dedifferentiation in the face network in a large lifespan sample. J Neurosci. 2012;32 (6):2154–2158. doi: 10.1523/JNEUROSCI.4494-11.2012. [DOI] [PMC free article] [PubMed] [Google Scholar]
- 20.Radloff LS. The CES-D scale: A self-report depression scale for research in the general population. Applied Psychological Measurement. 1977;1(3):385–401. [Google Scholar]
- 21.Reijmer YD, Leemans A, Brundel M, et al. Disruption of the cerebral white matter network is related to slowing of information processing speed in patients with type 2 diabetes. Diabetes. 2013 doi: 10.2337/db12-1644. [DOI] [PMC free article] [PubMed] [Google Scholar]
- 22.Rubinov M, Sporns O. Complex network measures of brain connectivity: uses and interpretations. Neuroimage. 2010;52 (3):1059–1069. doi: 10.1016/j.neuroimage.2009.10.003. [DOI] [PubMed] [Google Scholar]
- 23.Shu N, Liang Y, Li H, et al. Disrupted topological organization in white matter structural networks in amnestic mild cognitive impairment: relationship to subtype. Radiology. 2012;265 (2):518–527. doi: 10.1148/radiol.12112361. [DOI] [PubMed] [Google Scholar]
- 24.Steen M, Hayasaka S, Joyce K, et al. Assessing the consistency of community structure in complex networks. Phys Rev E Stat Nonlin Soft Matter Phys. 2011;84 (1 Pt 2):016111. doi: 10.1103/PhysRevE.84.016111. [DOI] [PMC free article] [PubMed] [Google Scholar]
- 25.van den Heuvel MP, Stam CJ, Kahn RS, et al. Efficiency of functional brain networks and intellectual performance. J Neurosci. 2009;29 (23):7619–7624. doi: 10.1523/JNEUROSCI.1443-09.2009. [DOI] [PMC free article] [PubMed] [Google Scholar]
- 26.Wen W, Zhu W, He Y, et al. Discrete neuroanatomical networks are associated with specific cognitive abilities in old age. J Neurosci. 2011;31 (4):1204–1212. doi: 10.1523/JNEUROSCI.4085-10.2011. [DOI] [PMC free article] [PubMed] [Google Scholar]
- 27.Wu K, Taki Y, Sato K, et al. Age-related changes in topological organization of structural brain networks in healthy individuals. Hum Brain Mapp. 2012;33 (3):552–568. doi: 10.1002/hbm.21232. [DOI] [PMC free article] [PubMed] [Google Scholar]
- 28.Zald DH, Curtis C, Chernitsky LA, et al. Frontal lobe activation during object alternation acquisition. Neuropsychology. 2005;19 (1):97–105. doi: 10.1037/0894-4105.19.1.97. [DOI] [PubMed] [Google Scholar]
- 29.Zhang J, Wang J, Wu Q, et al. Disrupted brain connectivity networks in drug-naive, first-episode major depressive disorder. Biol Psychiatry. 2011;70 (4):334–342. doi: 10.1016/j.biopsych.2011.05.018. [DOI] [PubMed] [Google Scholar]