

Abstract
Arabidopsis CRINKLY4 (ACR4) is a receptor-like kinase (RLK) that consists of an extracellular domain and an intracellular domain (ICD) with serine/threonine kinase activity. While genetic and cell biology experiments have demonstrated that ACR4 is important in cell fate specification and overall development of the plant, little is known about the biochemical properties of the kinase domain and the mechanisms that underlie the overall function of the receptor. To complement in planta studies on the function of ACR4, we have expressed the ICD in Escherichia coli as a soluble C-terminal fusion to the N-utilization substance A (NusA) protein, purified the recombinant protein and characterized the enzymatic and conformational properties. The protein autophosphorylates via an intramolecular mechanism, prefers Mn2+ over Mg2+ as the divalent cation and displays typical Michaelis-Menten kinetics with respect to ATP with an apparent Km of 6.67 ± 2.07 μM and Vmax of 1.83 ± 0.18 nmol/min/mg. Autophosphorylation is accompanied by a conformational change as demonstrated by circular dichroism, fluorescence spectroscopy and limited proteolysis with trypsin. Analysis by nano-liquid chromatography mass spectrometry (nano-LC-MS) revealed 16 confirmed sites of phosphorylation at Ser and Thr residues. Sedimentation velocity and gel-filtration experiments indicate that the ICD has a propensity to oligomerize and that this property is lost upon autophosphorylation.
A fundamental challenge in the developmental biology of higher organisms is striking a balance between cell proliferation, differentiation, and specification in order to undergo proper organogenesis and development. In mammalian systems, receptor tyrosine kinases (RTKs), such as the members of epidermal growth factor (EGF) receptor family, represent a class of proteins which perceive and regulate inter- and intracellular processes pertaining to stem cell proliferation and differentiation (1, 2). The architecture of RTKs consists of an extracellular ligand binding domain, a transmembrane helix, and an intracellular kinase domain. In the classic example, members of the EGF receptor family undergo ligand induced homo- or heterodimerization, followed by intracellular kinase activation via trans phosphorylation (3, 4). Homo- or heterodimerization regulates which downstream signaling pathways are activated through phosphorylation of specific tyrosine residues and recruitment of specific intracellular substrates in response to differential ligand binding (3, 5, 6). Mounting evidence, as in the case of the well characterized Brassinosteroid pathway and the CLAVATA (CLV) pathway, supports the occurrence of ligand induced, receptor mediated signaling involved in plant development similar to RTK signaling in mammalian systems (7, 8). Although >400 putative receptor-like kinases (RLKs) have been identified in the Arabidopsis genome, only a few have been characterized in detail (9, 10).
First described as a growth factor like receptor in maize, CRINKLY4 (CR4) is a RLK involved in the proper formation of the epidermal layer in the leaves and the aleurone monolayer in the kernel (11, 12). The protein consists of an extracellular domain with seven repeating regions (each of 39 amino acids), three cysteine-rich regions which are similar to the extracellular motifs of the tumor necrosis factor receptor, a single transmembrane spanning region, and an active intracellular serine/threonine kinase domain (11, 13, 14). An ortholog in Arabidopsis, ACR4, contains all the architectural features of maize CR4 and functions in a similar manner. ACR4 primarily affects epidermal cell morphology in the ovules and sepal margins of the plant, is required for proper morphogenesis of developing embryos, and is necessary for the proper formation of the epidermal layer in leaves. Seeds from acr4 plants show defects in seed coat development and loss of epidermal and cuticle formation, leading to fusion of tissues (14–17). Recently, ACR4 has been described as a regulator of columella stem cell differentiation in the root apical meristem and lateral root formation in the developing root (18, 19). Loss of ACR4 function results in the proliferation of columella stem cells and a module involving interactions between the CLE40 peptide, ACR4 and a homeobox transcription factor, WOX5, has been proposed as a signaling mechanism that is similar to the CLV signaling pathway that mediates stem cell proliferation and differentiation in the apical meristem (19).
Thus, ACR4 is a RLK whose functions are critical to the development of virtually the entire plant (15–19). Importantly, while genetic and cell biology studies have made it apparent that the RLK is important in cell fate specification, there is little or no knowledge of the biochemical basis of its function and its involvement in regulatory networks. In vitro biochemical and biophysical studies of recombinant proteins can often provide valuable clues towards an understanding of in vivo physiological functions. Indeed, detailed structural and mechanistic studies on a number of recombinantly expressed receptor kinase domains in both animal and plant systems have not only facilitated the development of useful biochemical models to validate in vivo functions but also fostered the development of various protein probes for the dissection of signaling pathways and isolation of interacting proteins. However, such studies require adequate amounts of soluble protein. To this end, we have successfully expressed milligram quantities of the intracellular domain (ICD) of ACR4 in fusion with the NusA protein in an E. coli system. We have characterized the autophosphorylation activity, mapped the autophosphorylation sites by mass spectrometry and demonstrate that the RLK is a member of the RD family of kinases.
Materials and Methods
Construction of ACR4 Intracellular Domain (ICD) Expression Plasmid
The ACR4 intracellular domain, termed JKC (residues 456–895), was cloned into the pET-44b(+) (Novagen) which encodes an N-terminal NusA fusion tag, two 6X His tags, a Thrombin cleavage site, and an Enterokinase cleavage site. The ACR4 JKC was PCR amplified with primer 1 and primer 2 (Table I), cloned between the BamHI and Sal1 restriction sites, and verified by DNA sequencing. The plasmid, termed pNusA:JKC, was used for subsequent protein expression.
Table 1.
Primers used in cloning and mutagenesis experiments
| Primer | Mutation | Sequence (5′ --> 3′) |
|---|---|---|
| 1 | - | GTGGTGGTGGATCCGAGGTACAGATTGAGGAATTG |
| 2 | - | GCGCGTCGACTCAGAAATTATGATGCAAG |
| 3 | K540A | CCACTGTTGCAGTGGCGAGAGCGATAATGTC |
| 4 | D641A | CTCCCGTGATTCACCGGGCCATTAAATCATCAAACATTC |
| 5 | S663A | GCTGATTTTGGTCTCGCCTTACTTGGTCCTGTCG |
| 6 | S670A | CTTGGTCCTGTCGATGCCGGCTCTCCTTTGGC |
| 7 | S672A | CCTGTCGATAGCGGCGCTCCTTTGGCAGAAC |
| 8 | T681A | GAACTACCAGCAGGAGCTCTCGGTTACCTTG |
| 9 | Y684F | GCAGGAACTCTCGGTTTCCTTGATCCCGAGTAC |
| 10 | T681D | GAACTACCAGCAGGAGATCTCGGTTACCTTG |
| 11 | Y684D | GCAGGAACTCTCGGTGACCTTGATCCCGAGTAC |
| 12 | Y684S | GCAGGAACTCTCGGTTCCCTTGATCCCGAGTAC |
| 13 | Y684T | GCAGGAACTCTCGGTACCCTTGATCCCGAGTAC |
| 14 | S663D | GCTGATTTTGGTCTCGACTTACTTGGTCCTGTCG |
| 15 | S670D | CTTGGTCCTGTCGATGACGGCTCTCCTTTGGC |
| 16 | S672D | CCTGTCGATAGCGGCGATCCTTTGGCAGAAC |
Preparation of the kinase inactive mutant plasmid was completed using the QuickChange Multi Site-Directed Mutagenesis Kit (Stratagene) by introducing point mutations into pNusA:JKC plasmid at codons encoding residues required for kinase activity. Mutagenic primer 3 mutated lysine 540 to alanine (K540A) and primer 4 mutated the catalytic aspartate 641 to alanine (D641A). The plasmid, termed pNusA:JKC2m, was subsequently used for expression of the kinase inactive form of the ACR4 ICD, JKC2m. Activation loop mutations were similarly made using mutagenic primers 5 through 16 described in Table I.
Protein Expression and Purification of NusA fused ACR4 JKC Proteins
The ACR4 JKC was expressed as a C-terminal fusion to the NusA solubility tag. Plasmids were transformed into chemically competent BL21 (DE3) pLysS (Promega) E. coli cells. A 500 ml culture was supplemented with ampicillin (100 μg/ml) and grown at 37 °C, with shaking, to an OD600=0.6–0.8. The temperature was then reduced to 20 °C and protein expression induced with isopropyl- 1-thio-β-D-galactopyranoside (IPTG) to a final concentration of 1 mM. After 6h of incubation, the cells were harvested by centrifugation and the cell pellet was used immediately. The pellet was resuspended in 10 ml of Lysis Buffer (1X TBS pH 7.5, 50 mM imidazole, 1% TritonX-100, 1 mM DTT) and supplemented with AEBSF (1 mM final concentration). The cell suspension was sonicated to release soluble fusion protein and the resulting lysate was centrifuged in a microcentrifuge at max speed for 25 min at 4 °C. The lysate was then incubated for 1h at 4 °C in batch mode with 0.5 ml bed volume of Ni2+ IMAC Sepharose High Performance resin (GE Healthcare) equilibrated with Lysis Buffer. After incubation, the lysate/resin mixture was added to a 10 ml disposable chromatography column and the unbound material was allowed to flow through. The resin was then washed with 10 ml of Wash Buffer (1X TBS pH 7.5, 50 mM imidazole, 0.1% TritonX-100, 1 mM DTT) and bound protein was successively eluted with 2ml of Elution Buffer (50 mm Tris-HCl pH 8.0, 150 mM NaCl, 150 mM imidazole, 1 mM DTT). The final concentration of metal-affinity purified protein at this stage is typically greater than 6 mg/ml.
A secondary gel filtration step was used to purify the NusA fusion proteins using an ÄKTA FPLC system (Amersham). The metal affinity enriched fusion proteins were passed through a Superdex G200 Global 10/30 column (GE Healthcare) equilibrated with column buffer (50 mM Tris-HCl pH 8.0, 150 mM NaCl, and 1 mM DTT). Peak fractions corresponding to the fusion protein were collected, pooled, and concentrated. The resulting purified proteins were used in further experiments.
Purification of JKC Proteins without tags
The affinity enriched protein sample (as described above) was treated with 1 U/3.5 mg of Restriction Grade Thrombin (Novagen) for 20 min at room temperature. The cleavage reaction was then loaded onto a MonoQ Global 10/50 column (GE Healthcare) equilibrated with Anion Exchange Buffer (50 mM Tris-HCl pH 8.0, 1 mM DTT). Cleaved ACR4 JKC was eluted off the column by gradient elution with Anion Elution Buffer (50 mM Tris pH 8.0, 1 M NaCl, 1 mM DTT). According to the ExPASy Proteomics Server, the calculated pI of the NusA tag is 4.83 and that of the JKC is 6.47. Peak fractions corresponding to the ACR4 JKC were collected, pooled, and concentrated. The resulting purified proteins were used in subsequent experiments. Note, after cleavage the ACR4 JKC recombinant protein contains 20 extraneous amino acids encoded by the pET-44b(+) vector at the N-terminus.
Antibodies
Polyclonal antibodies to the JKC protein were raised at the Hybridoma Facility at Iowa State University by repeated immunizations of rabbits with the highly purified antigen and purified IgG was prepared from whole serum by affinity chromatography. Monoclonal antibody to the NusA tag was purchased from Novagen (EMD Chemicals, Gibbstown). This antibody specifically detects fusion proteins containing the NusA tag sequence expressed with the pET-44 vector series.
Circular Dichroism (CD) measurements
JKC purified from E. coli (naïve JKC) autophosphorylated JKC (pJKC), and JKC2m were dialyzed overnight at 4 °C in 10 mM Tris- HCl, pH 7.4 and 0.1 mM TCEP and concentrated to an A280 value of approximately 1.0. Far-UV spectrums of each protein were obtained on a Jasco J-710 spectropolarimeter, in a 0.1cm path- length cuvette with excitation wavelengths ranging from 190 nm–260 nm.
Fluorescence Measurements
Naïve JKC, JKC2m, and pJKC were dialyzed in 10 mM Tris- HCl, pH 7.4 and 0.1 mM TCEP and brought to a concentration of A280=0.1 prior to fluorescence scans. Measurements were made in a 1 cm cuvette at room temperature with a Cary Eclipse spectrofluorimeter (Varian). Scans were executed at an excitation wavelength of 280 nm and a band width of 5 nm and a scan speed of 120 nm/min.
Kinase Activity Assays
The optimal buffer condition for kinase activity was determined to be 20 mM BIS-TRIS pH 7.2, 25 mM NaCl, 5 mM MnCl2, 1 mM DTT, 25 μM ATP and a temperature of 30 °C. This was established by performing individual reactions with 2 μg of NusA:JKC protein incubated in varying buffer conditions containing Mn2+ (0.05–50 mM), ATP (1–50 μM), DTT (0–10 mM) and NaCl (0–300 mM), in the pH range 5.8–8.8. All reactions were carried out in a 20 μl volume in the presence of 5 μCi of [γ32P]ATP (6000 Ci/mmol, Perkin-Elmer) and incubated for 1 hr at room temperature. Reactions were terminated by adding 6 μl 4X Laemmli buffer and boiled for 5 min. Proteins were resolved by 10% SDS-PAGE, gels stained with Coomassie Brilliant Blue R-250, and then analyzed by exposure to an autoradiograph film or a phosphorimaging screen.
Assays to determine the autophosphorylation mechanism were performed using the NusA:JKC and JKC proteins. A series of reactions was carried out containing increasing concentrations of NusA:JKC in the range 0.2–3.4 μM (or up to ~2.4 μM in the case of JKC). The protein was incubated in 20 μl reactions of optimized kinase buffer containing 2.5 μCi of [γ-32P]ATP. Reactions were initiated with the addition of the enzyme and incubated for 15 min at room temperature. They were then terminated and treated as above. Protein bands were excised from the gel and radioactivity was determined by scintillation counting. Phosphate incorporation for each sample was calculated based on the radioactive counts and the use of a [γ-32P]ATP standard curve. The data was then used to generate a van’t Hoff plot (log of enzyme activity vs log of enzyme concentration) and the intramolecular nature of the mechanism inferred from the slope of this plot. Kinetic data were fit using the Sigma Plot 11.2 (Systat Software Inc., San Jose, CA) Enzyme Kinetics module (version 1.3) to determine Michaelis-Menten constants by non-linear regression analysis.
In a parallel experiment, autophosphorylation assays were also performed independently with naïve NusA:JKC, JKC2m, or with both proteins incubated together. Incubations of the NusA tag alone or with either protein were used as controls for the assay. Each reaction was carried out with 2 μg of protein in optimized kinase buffer containing 5 μCi of [γ-32P]ATP. Reactions were allowed to proceed for 1h at room temperature and processed as above. To determine if the kinase could phosphorylate other exogenous substrates, naïve NusA:JKC was incubated with 2 μg of Myelin Basic protein (MyBP) and the phosphorylation reaction carried out as described above.
Analysis of Phosphorylation status
Two techniques were utilized to determine the phosphorylation status of JKC2m, naïve JKC and pJKC. One approach utilized the phosphoprotein stain, Pro-Q Diamond (Invitrogen). Approximately 1 μg of each protein was separated by 12% SDS-PAGE. The gel was first fixed for 2× 30 min with solution containing 50 % methanol and 10% acetic acid then washed three times with deionized water. It was then stained with Pro Q diamond stain for 90 min in the dark and then destained using 50 mM sodium acetate buffer pH 4.0 containing 20% acetonitrile. Images of the stained gel were acquired on a Molecular Dynamics Typhoon scanner (Amersham Biosciences) with an excitation source of 532 nm laser and a 580 nm bandpass emission filter.
In the second approach, phosphorylation was assessed by western blot analysis using a polyclonal, anti-phosphothreonine antibody (Cell Signaling Technology, #3981). Briefly, ~1 μg of each protein was separated by 12% SDS-PAGE followed by blotting to a PVDF membrane. The membrane was blocked, probed with the primary antibody (1:1000), washed, and then probed with a secondary anti-rabbit IgG antibody (1:30,000) conjugated to alkaline phosphatase (Sigma). Protein detection was completed using an AP Conjugate Substrate kit (Bio-Rad).
Sample Preparation for LC-MS/MS Analysis
To prepare peptides, the proteins were concentrated by TCA precipitation and resuspended in 4 M urea in 50 mM NH4HCO3, pH 7.8. Proteins were reduced with 10 mM TCEP for 30 min at 50 °C followed by alkylation with 20 mM iodoacetamide for 30 min at room temperature in the dark. 50 mM NH4CO3, pH 7.8 was added to the sample to dilute urea to less than 1 M. The protein was then digested with 1:50 (w/w, enzyme to substrate) Sequencing Grade Modified Trypsin (Promega) overnight at 37 °C. The resulting peptides were desalted on a SOURCE 15 RPC column (GE Healthcare) and eluted in 90% acetonitrile, 0.1% TFA. The eluted peptides were then dried down in a vacuum centrifuge. Phosphopeptides were enriched using the PHOS-Select Ga3+ Silica Spin Column kit (Supelco) according to the kit instructions.
Peptides were eluted into autosampler vials with 60% acetonitrile in 1% formic acid. The quality of the peptide digests was assessed using MALDI-TOF mass spectrometry. The remaining sample was dried, dissolved in 25 μL of aqueous acetonitrile/formic acid (1%/1%), and analyzed by high resolution nano-LC-MS.
High Resolution Mass Spectrometry
The complex peptide mixtures were analyzed using high-resolution nano-LC-MS on a hybrid mass spectrometer consisting of a linear quadrupole ion-trap and an Orbitrap (LTQ-Orbitrap XL, Thermo Fisher Scientific). Chromatographic separations were performed using a NanoLC-1D™ Plus (Eksigent) for gradient delivery and a cHiPLC-nanoflex (Eksigent) containing a 15 cm × 75 μm C18 column (ChromXP C18-CL, 3 μm, 120 Å, Eksigent). The liquid chromatograph was interfaced to the mass spectrometer with a nanospray source (PicoView PV550; New Objective). The mobile phases were 1% formic acid in water (solvent A) and 1% formic acid in acetonitrile (solvent B). After equilibrating the column in 98% solvent A and 2% of solvent B, the samples (5 μL) were injected from vials using the LC-system autosampler at a flow rate of 500 nL/min. The peptides were eluted at 250 nL/min with the following gradient: isocratic at 2% B, 0–3 min; 2% B to 50% B, 3–73 min; 50% to 80%, 73–83 min; isocratic at 80%, 83–86 min; 80% to 2%, 86–87; and isocratic at 2% B, 87–102 min. The total run time, including column equilibration, sample loading, and analysis was 128 min. The survey scans (m/z 350–2000) (MS1) were acquired at high resolution (60,000 at m/z = 400) in the Orbitrap and the MS/MS spectra (MS2) were acquired in the linear ion trap at low resolution, both in profile mode. The maximum injection times for the MS1 scan in the Orbitrap and the LTQ were 50 ms and 100 ms, respectively. The automatic gain control targets for the Orbitrap and the LTQ were 5 × 10⁵ and 3 × 10⁴, respectively. The MS1 scans were followed by six MS2 events in the linear ion trap with collision activation in the ion trap (parent threshold = 1000; isolation width = 2.0 Da; normalized collision energy = 30%; activation Q = 0.250; activation time = 30 ms). Dynamic exclusion was used to remove selected precursor ions (−0.20/+1.0 Da) for 90 s after MS2 acquisition. A repeat count of 1, a repeat duration of 45 s, and a maximum exclusion list size of 500 was used. The following ion source parameters were used: capillary temperature 200 °C, source voltage 3.5 kV, source current 100 μA, capillary voltage 33 V, and the tube lens at 120 V. The data were acquired using Xcalibur, version 2.0.7 (Thermo Fisher). For high resolution targeted analysis, the parent ions from an inclusion m/z list within a retention time window were selected for acquisition of peptide fragmentation spectra at 7500 resolution. MS/MS spectral acquisition was triggered with an isolation width of 4 Da when the signal for the ion of interest exceeded 10,000 counts. The maximum injection times for the MS1 scan in the Orbitrap and the LTQ were both 500 ms, and the maximum injection times for the MSn scan in the Orbitrap and the LTQ were 750 ms and 1000 ms, respectively. The automatic gain control targets for the Orbitrap and the LTQ were 2 × 10⁵ and 3 × 10⁴, respectively for the MS1 scans and 1 × 10⁵ and 1 × 10⁴, respectively for the MSn scans. The MS1 scan was followed by one MS2 event with collision activation in the ion trap (parent threshold = 10000; isolation width = 4.0 Da; normalized collision energy = 30%; activation Q = 0.250; activation time = 30 ms). The following ion source parameters were used: capillary temperature 200 °C, source voltage 3.3 kV, source current 100 μA, capillary voltage 34 V, and the tube lens at 125 V.
Data Analysis
The MS2 spectra were analyzed by searching against the ACR4 sequence and expert manual interpretation. The exact masses of the phosphopeptide and fragmentation ions were calculated using the MS-Product utility within Protein Prospector (http://prospector.ucsf.edu). For database searches, the LC-MS files were processed using MASCOT Distiller (Matrix Science, version 2.3.0.0) with the settings previously described (20). The resulting MS2 centroided files were used for database searching with MASCOT, version 2.1.6, against a custom, in-house database containing the ACR4 using the following parameters: enzyme, trypsin; MS tolerance = 15 ppm, MS/MS tolerance = 0.8 Da with a fixed carbamidomethylation of Cys residues and the following variable modifications: oxidation (Met) and phosphorylation (Ser, Thr, and Tyr); Maximum Missed Cleavages = 9; and 1+, 2+ and 3+ charge states. For analysis of the tandem spectra from spectral acquisitions in the Orbitrap (MS2), the raw files were processed using MASCOT Distiller (Matrix Science, Oxford, UK) with the following settings: 1) MS processing: 200 data points per Da; sum aggregation method; maximum charge state, 3+; minimum number of peaks, 1; 2) MS/MS processing: 200 data points per Da; time domain aggregation method; minimum number of peaks, 10; use precursor charge as maximum; precursor charge and m/z, “try to re-determine charge from the parent scan (tolerance, 1.2 Da)”; charge defaults, 1; maximum charge state, 3) time domain parameters: minimum precursor mass, 300; maximum precursor mass, 16,000; precursor m/z tolerance for grouping, 0.01; maximum number of intermediate scans, 0; minimum number of scans in a group, 1; 4) peak picking: maximum iterations, 500; correlation threshold, 0.60; minimum signal to noise, 2; minimum peak m/z, 50; maximum peak m/z, 100,000; minimum peak width, 0.002; maximum peak width, 0.2; expected peak width, 0.02. The resulting files were used for database searching with a fragment tolerance of 100 mmu; all other search parameters are identical to those described above.
Analytical Ultracentrifugation
Sedimentation velocity analysis of NusA:JKC, naïve and phosphorylated, was performed on an XL-A analytical ultracentrifuge (Beckman Coulter). The purified protein was dialyzed overnight at 4 °C in 10 mM Tris-HCl pH7.4, 50 mM NaCl, and 0.1 mM TCEP. The protein sample was concentrated to an Abs280 = 0.6. 300 μl of the sample was loaded into a preassembled Flow-Through Assembly housing an Epon, 2-channel centerpiece and quartz windows. The rotor and sample cell temperatures were allowed to equilibrate to 20 °C for 2 h. The sample was spun at 40,000 rpm, at 20 °C for a total of 400 scans with a scan rate of 1 scan/min. Boundaries were monitored by recording the absorbance at 280nm. Scan analysis was performed using van Holde - Weischet analysis (21) as implemented in the program Ultrascan 6. Sedimentation coefficients (S20, w) were corrected for 20 °C and water.
Limited Proteolysis
Conformational difference between naïve JKC and pJKC proteins was probed by limited proteolysis using trypsin. The naïve protein was purified as described above and 125 μg of the protein was diluted into 200 μl volume containing 50 mM Tris-HCl pH 8.0, 1 mM CaCl2, 1 mM DTT. Trypsin (Promega) was added at a 1:1000 w/w, protease:substrate and incubated at room temperature. 25 μl aliquots were removed at predetermined time points and the reaction stopped by the addition of 6 μl of 4X SDS sample buffer and boiling for 5 min. For pJKC, 125 μg of the protein was first incubated in a 200 μl reaction containing 1X kinase buffer and 100 μM ATP for 90 min. Subsequently, 5 μl of 2 M Tris-HCl pH 8.0 was added to adjust the pH to 8.0 followed by 1 μl of 0.2 M CaCl2 to a final concentration of 1 mM. The digestion reaction was then carried out as described above. Protein samples (~0.5 μg/lane) were separated by 7% SDS-PAGE and gels were silver stained using the SilverSNAP stain kit from Pierce (Rockford, Ill).
RESULTS
Expression, Purification and Characterization of JKC
The intracellular domain (ICD) of ACR4 (residues 456–895) may be subdivided into the juxtamembrane domain (JM), kinase domain (KD) and the carboxy-terminal domain (CTD). Using the NusA protein as the fusion partner we have expressed and purified milligram quantities of the ICD for biochemical characterization. Fig. 1A shows the SDS-PAGE analysis of protein fractions during various steps in the purification of the NusA:JKC (lane 3) and JKC (lane 5) from E. coli cells (as described in Materials & Methods). Approximately 6 mg of soluble NusA:JKC and <0.25 mg of JKC protein were obtained from a 500 ml culture. Similar yield was obtained for the inactive mutant (JKC2m). The identities of the proteins were confirmed by western blots probed with rabbit polyclonal antibodies raised against the JKC (Fig. 1B) and antibody to the NusA tag (Fig. 1C). These blots validate the homogeneity of the protein preparation and demonstrate the absence of co-purification of non-full length NusA-tagged proteins. The identity of the purified JKC protein was also confirmed by MALDI-MS analysis of tryptic peptides of the excised protein band (data not shown).
Figure 1.

Analysis of protein purification by SDS-PAGE and western blot. (A) 10% SDS-PAGE gel stained with Coomassie Blue stain (B) western blot analysis using polyclonal antibody to the ACR4 kinase domain and (C) western blot analysis using monoclonal antibody to the NusA tag. Lane M, MW standards; lane 1, total protein from E. coli lysate; lane 2, affinity-enriched NusA:JKC; lane 3, NusA:JKC purified by gel filtration; lane 4, thrombin-cleaved NusA:JKC; lane 5, JKC purified by anion-exchange chromatography.
The far-UV CD spectrum of the JKC (Fig. 2A) is similar to that reported for other examples of recombinantly expressed kinase domains of receptor tyrosine kinases (22, 23). The three-dimensional structures of several kinase domains show a number of helices and the observed CD spectrum for naïve JKC (combined with the robust catalytic activity described below) strongly supports the preservation of an ordered structure. Typical α-helical structures display negative bands at 208 nm and 222 nm. The more negative molar ellipticity value at 208 nm could be attributed to contributions from the juxtamembrane and carboxy-terminal regions of the molecule as well as the 20 extraneous amino acids at the N-terminus encoded by the pET-44b(+) vector (see Materials & Methods). Fluorescence spectroscopy (Fig. 2B) shows almost identical profiles for both the mutant and naïve proteins with an emission maximum at 342 nm, consistent with the tryptophan residues being located in similar environments.
Figure 2.

Conformational analysis of JKC proteins. (A) Far-UV CD spectra of the inactive JKC2m, naïve JKC, and autophosphorylated pJKC in 10 mM Tris, pH 7.4 and 0.1 mM TCEP with an A280 value of ~1.0. (B) Intrinsic fluorescence spectra of JKC2m, JKC, and pJKC in the same buffer with an A280 of 0.1. Measurements were made in a 1cm cuvette at room temperature with a Cary Eclipse spectrofluorometer (Varian) at an excitation wavelength of 280 nm.
Preliminary evidence for the ability of the ICD to oligomerize was obtained during the purification of the metal-affinity enriched NusA:JKC protein by size exclusion chromatography. Typically, at the affinity-enrichment step, the protein concentration is > 6 mg/ml and is subsequently diluted to ~ 2 mg/ml (~18 μM) for batch-wise purification by gel filtration on a Superdex G200 column. As shown in Fig. 3, in addition to eluting as a monomer (peak at ~12.5 ml volume), a small proportion of the protein elutes as an aggregate in the void volume. Analysis of these fractions by SDS-PAGE (inset A) indicates that the void volume fraction consists entirely of aggregates of the monomer. An autophosphorylation assay of the aggregate fraction indicated that no kinase activity could be detected in comparison with that of the monomer fraction (inset B). It is also worth noting that the propensity for oligomerization may be concentration dependent since little or no aggregate is observed in gel filtration experiments at protein concentrations below ~1.5 μM (data not shown).
Figure 3.

Gel filtration profile of affinity-enriched NusA:JKC in 50 mM Tris, pH 8.0, 150 mM NaCl during the protein purification scheme. The positions of the aggregate peak in the void volume, the monomer peak and the shoulder are indicated. Insets: (A) SDS-PAGE of void volume (lanes 1–4), monomer (lanes 5–7) and shoulder fractions (lanes 8–9) (B) NusA:JKC isolated from the void volume and monomer fractions were subjected to an in vitro autophosphorylation assay. NusA:JKC from the monomeric fraction was fully active, whereas NusA:JKC from the void volume fraction had little or no activity.
The self-association of naïve NusA:JKC was also monitored by sedimentation velocity experiments. During sedimentation velocity, homogeneous non-interacting molecules will sediment with discrete sedimentation coefficient (S) values whereas interacting molecules that lead to higher order oligomers will show a broad distribution of sedimenting species. Fig. 4A shows the percent distribution of species (plotted as diffusion corrected sedimentation coefficients) along the sedimentation boundary in velocity sedimentation experiment for naïve NusA:JKC. Approximately 60% of the protein sedimented with an S20,w value of 4 with the remaining 40% showing a considerably wider range of much higher S values, commensurate with association to heterogeneous polymeric species. We also analyzed the data by the Van Holde-Weischet method (21) (Fig. 4B). In this analysis, the sedimenting boundary is first divided into a number of segments and the data fit by linear least square analysis to the apparent sedimentation coefficient of each boundary segment. Extrapolation to the y-axis then yields the diffusion-corrected sedimentation coefficient for that boundary segment. Typically, a homogeneous sample would be expected to have the same sedimentation coefficient as a function of time in all parts of the boundary and the extrapolated lines for the various segments should converge to a single value at the y-axis (24). It is also clear by this method of analysis that the naïve protein shows a distinct propensity to aggregate to species with S values >4. The NusA protein is not known to dimerize (25–28) and we also did not see any evidence of dimerization with the recombinantly expressed NusA protein (data not shown). In contrast, after autophosphorylation the protein does not aggregate and shows a predominantly homogeneous monomeric species sedimenting with an S20,w value of ~4 (Fig. 4C, D). We were unable to perform sedimentation velocity experiments with the protein minus the NusA tag owing to inadequate recovery of soluble protein.
Figure 4.

Sedimentation velocity analysis of NusA:JKC (panel A) and autophosphorylatedNusA:JKC (panel C) performed on an XL-A analytical ultracentrifuge using a protein sample with an Abs280 of 0.6. The sample was spun at 40,000 rpm at 20 °C for a total of 400 scans with a scan rate of 1 scan/min. van Holde-Weischet analysis of NusA:JKC and autophosphorylated NusA:JKC, respectively (panels B &D).
Kinase activity of NusA:JKC
Interestingly, as observed for some of the other RLK’s characterized so far (29–31) the recombinantly expressed ACR4 ICD as a NusA fusion protein prefers Mn2+ over Mg2+ as the metal ion for autophosphorylation, although the precise physiological significance of this is not obvious. A linear increase in phosphorylation activity is seen with Mn2+ concentrations ranging from 0.1 to 5 mM, with maximal activity occurring at 5 mM and quenching at higher concentrations of the metal ion (Fig. 5A). A similar linear relationship is seen with Mg2+ but much higher concentrations of Mg2+ are required to achieve activity comparable with Mn2+ as the divalent cation i.e., 1 mM Mn2+ versus 50 mM Mg2+ (Fig. 5A). This is further illustrated in Fig. 5B that shows an autoradiogram of the kinase activity in the presence of 10 mM concentrations of Mg2+, Mn2+ and Ca2+. No activity is observed with Ca2+ and the activity with Mg2+ is significantly less. In the presence of Mn2+ the reaction is completed in 60 min (for JKC as well) (Fig. 5C) at 30 °C at an optimal pH of 7.2 in 20 mM BIS-TRIS buffer containing 1 mM DTT and 25 mM NaCl (Fig. 5D). The enzyme displays typical Michaelis-Menten kinetics with respect to ATP (Fig. 5E) and analysis of the ATP dependence for autophosphorylation by fitting the data to the Michaelis-Menten equation (using the Enzyme Kinetics Module on SigmaPlot 11.2) revealed the Km and Vmax for ATP to be 6.67 ± 2.07 μM and 1.83 ± 0.18 nmol/min/mg, respectively. The apparent Km for ATP is also comparable with that observed for other RLKs (29, 30).
Figure 5.

Optimal conditions for in vitro autophosphorylation activity as described in materials and methods. 2 μg of NusA:JKC was incubated in 20 μl of kinase buffer containing 5μCi of [γ-32P]ATP (6000Ci/mmol). Reactions were terminated by adding SDS sample buffer and proteins were resolved by 10% SDS-PAGE followed by Coomassie Blue staining and phosphorimaging. Left panel (A) Concentration dependence of divalent cations. (B) Comparison of 10mM Mg2+, Mn2+, and Ca2+. (C) Time course of autophosphorylation for NusA:JKC (upper panel) and JKC (lower panel). (D) Effect of reducing agent (DTT), pH, temperature and ionic strength on autophosphorylation. (E) Plot of enzyme velocity vs. ATP concentration. Data were fitted directly to the Michaelis-Menten equation using SigmaPlot 11.2 and the Enzyme Kinetics 1.3 module. The value of the Km for ATP was 6.67 ± 2.07 μM and the Vmax was 1.83 ± 0.18 nmol/min/mg. Data are the mean ± S.E. (n = 4). (F) NusA:JKC can phosphorylate the exogenous substrate MyBP. Lane 1, NusA:JKC and lane 2, NusA:JKC incubated with MyBP.
Since the native substrate for ACR4 kinase is yet to be determined, we used Myelin Basic Protein (MyBP) as a model substrate in an assay to assess the ability of the kinase to phosphorylate exogenous proteins. As indicated in Fig. 5F (lane 2), MyBP is phosphorylated by NusA:JKC.
Autophosphorylation occurs through an intramolecular mechanism
Autophosphorylation reactions of kinases can proceed either through an intramolecular mechanism (first order with respect to enzyme concentration) or an intermolecular mechanism (second order with respect to enzyme concentration). We used two approaches to ascertain the mechanism of activity of NusA:JKC. First, we conducted a series of kinase reactions using increasing concentrations of NusA:JKC in the range 0.1–3.4 μM. As shown in Fig. 6A, the rate of autophosphorylation was linear with respect to enzyme concentration and the amount of phosphate incorporation per molecule remained fairly constant over two-orders of magnitude difference in protein concentration (Fig. 6B). The van’t Hoff analysis (plot of logarithm of phosphorylation rate versus logarithm of enzyme concentration, with the value of the slope indicating the order of the reaction) gave a slope of 1.05 ± 0.05 and a correlation coefficient of 0.97 for the linear regression (Fig. 6C), suggesting an intramolecular mechanism. Similar results were obtained in assays performed with the JKC minus the NusA tag (Fig. 6D–F) and the van’t Hoff plot yielded a slope of ~1.2 (Fig. 6F). Importantly, the lower specific activity of JKC in the concentration range employed (Fig. 6E) and the decreased solubility of the protein at higher concentrations, attests to the stabilizing influence of the NusA tag on the activity of the enzyme. For further confirmation of the intramolecular mechanism, we performed kinase assays by incubating the active NusA:JKC with the inactive mutant JKC2m to determine if the latter could be phosphorylated. As shown in Fig. 7, panel A, the NusA:JKC could undergo autophosphorylation (lane 1) and also phosphorylate the NusA tag (lane 4) but could not phosphorylate the inactive mutant (lane 3). The reduced activity of NusA:JKC in lane 3 may potentially be attributed to the formation of a less active heterodimer between the wild-type and mutant protein. Taken together with the kinetic data, this strongly suggests that the dominant mechanism of autophosphorylation is intramolecular.
Figure 6.

ACR4 autophosphorylates via an intramolecular mechanism. NusA:JKC (A–C) and JKC (D–F) were incubated at increasing enzyme concentrations in an autophosphorylation assay. (A and D) Plot of velocity vs. enzyme concentration. (B and E) Plot of specific activity vs. enzyme concentration. (C and F) van’t Hoff plot of the logarithm of enzyme velocity vs. the logarithm of enzyme concentration. Linear regression of the data in C and F estimates a slope of 1.05 for NusA:JKC and a slope of 1.23 for JKC. In A-F, data are the mean ± S.E (n = 4).
Figure 7.

Intramolecular mechanism established by autophosphorylation assay. Active NusA:JKC and kinase inactive JKC2m were incubated together in an in vitro autophosphorylation assay. Lane 1, active NusA:JKC; lane 2, kinase inactive JKC2m; lane 3, active NusA:JKC and inactive JKC2m; lane 4, NusA:JKC and the NusA tag; lane 5, kinase inactive JKC2m and the NusA tag; lane 6, NusA tag. Proteins were resolved by 10% SDS PAGE and analyzed by phosphorimaging (panel A) and Coomassie Blue staining (panel B).
Mapping of autophosphorylation sites
The data-dependent tandem mass spectrometric analysis of the tryptic peptides and searching against ACR4 protein sequence revealed several phosphopeptides. The identified phosphopeptides encompassed all the subdomains of the ICD (Fig. 8A). Determination of the exact site of phosphorylation within the phosphopeptides was performed by inspection of their fragmentation pattern for specific diagnostic site-determining yn and bn ions (32). As an example, the collisionally induced tandem mass spectrum for the phosphopeptide 533DG(pT)TVAVK540 is shown in Fig. 8B. The most prominent ion is the doubly charged [M+2H-98]2+ species at a m/z of 386.71. This is characteristic of a neutral loss of phosphoric acid by which phosphorylation sites are identified. An unambiguous confirmation of Thr535 as the phosphorylated residue was afforded by the presence of the phosphorylated b3 (theoretical m/z 354.1; observed 354.1) and y6 (theoretical m/z 698.3; observed 698.2) ions, along with non-phosphorylated b2 (theoretical m/z 173.1; observed 173.1) and y5 (theoretical m/z 517.3; observed 517.3) ions. Table II summarizes the site-determining ions for 16 peptides with confirmed phosphorylation at amino acid residues Ser475, Thr478, Thr501, Ser516*, Ser522*, Thr535, Thr536, Ser552, Thr557, Ser563*, Ser644, Ser645, Thr831, Ser837*, Ser875 and Ser888* (Fig. 8A). Five of these confirmed residues, indicated with an asterisk, are also found in the naïve JKC and represent the basal phosphorylation state of the protein expressed in E. coli. One additional phosphorylation site in the naïve protein, is located at either Ser811* or Ser812* in the peptide 788ALAQLMGNPSSEQPILPTEVVLGSSR813 (theoretical mass including phosphate group, 2789.34; observed [M+3H]3+, m/z 930.79). Specific y-series ions were obtained showing phosphorylation at the C-terminal end of the peptide but no site-determining ions were obtained in the fragmentation spectrum to distinguish between the two serine residues.
Figure 8.


(A) Diagram showing the identified phosphorylation sites. Left panel: schematic of the ACR4 ICD showing the boundaries of the JM, KD and CTD. Confirmed phosphorylated residues in the autophosphorylated protein are in red and those that are found in the naïve protein are indicated with an asterisk. Right panel: Amino acid sequence of the ICD showing the N-terminal JM region (boxed rectangle), the central KD with the 35 aa tryptic peptide (underlined) and the activation loop sequence (double underlined) between the DFG and DPE motif (in green), the “RD” motif characteristic of RD-type kinases (in blue) and the CTD (box with dashed lines). Potential phosphorylation sites are numbered in black and the two Ser residues (670 & 672) within the activation loop are circled. (B) Collision-induced low resolution fragmentation spectrum of the phosphopeptide DGpTTVAVK (Mascot ion score 41), encompassing residues 533–540 of the ACR4 sequence. The presence of phosphorylated b3 (theor. m/z 354.1; obs’d 354.1) and y6 (theor. m/z 698.3; obs’d 698.2) ions, along with nonphosphorylated b2 (theor. m/z 173.1; obs’d 173.1) and y5 (theor. m/z 517.3; obs’d 517.3) ions, confirms Thr535 as the site of phosphorylation. The inset panel shows the MS spectrum of the doubly charged protonated molecular ion [M+2H]2+. Isotope clusters are separated by 0.505 Da, confirming the charge state of the peptide.
(C) Mass spectrum of the 35-residue tryptic peptide 657VADFGLSLLGPVDSGSPLAELPAGTLGYLDPEYYR691 supporting a singly-phosphorylated residue with a mass of 3731.81 corresponding to the identification of [M+2H]2+ (m/z = 1866.81) and [M+3H]3+ (m/z = 1244.94) ions.
Table 2.
Site-discriminating ions for phosphorylated residues (in red) in phosphopeptides. The percentage of maximum intensity for each site-discriminating ion in the averaged high resolution CID spectrum are shown in parenthesis (supporting ion information is available for underlined peptide sequences).
| Peptide | b ion | Phosphorylated b ion | y ion | Phosphorylated y ion |
|---|---|---|---|---|
| 471SSKDSAFTK479 | b4 (+1, 0.14) | b5 (+1, 27.6) | Y4 (+1, 1.14) | y5 (+2, 1.62) |
| 474DSAFTKDNGK483 | b4 (--) | b5 (+1, 4.9) | Y5 (+1, 10.7) | y6 (+2, 2.5) |
| 499VFTYEELEK507 | b2 (+1, 6.04) | b3 (+1, 5.77) | Y6 (+1, 12.82) | y7 (+1, 22.62) |
| 508AADGFKEESIVGK520 | b8 (+1, 0.77) | b9 (+1, 1.07) | Y4 (+1, 0.45) | y5 (+1, 0.54) |
| 508AADGFKEESIVGKGSFSCVYK528 | b14 (+2, 0.82) | b15 (+2, 3.92) | Y6 (+1, 6.07) | y7 (+1, 1.85) |
| 533DGTTVAVK540 | b2 (+1, 1.54) | b3 (+1, 1.34) | Y5 (+1, 097) | y6 (+2, 2.91) |
| 533DGTTVAVK540 | b3 (+1, 2.03) | b4 (--) | Y4 (+1, 3.51) | y5 (+1, 1.79) |
| 549QKNSNEFR556 | b3 (+1, 0.31) | b4 (--) | Y4 (+2, 2.50) | y5 (+2, 1.46) |
| 551NSNEFRTELDLLSR564 | b6 (+1, 0.71) | b7 (+1, 2.59) | Y7 (+1, 3.33) | y8 (+1, 0.55) |
| 557TELDLLSR564 | b6 (+1, 3.16) | b7 (+1, 3.64) | Y1 (--) | y2 (--) |
| 641DIKSSNILIDEEHNAR656 | b3 (+1, 2.82) | b4 (+1, 2.63) | Y12 (+3, 8.75) | y13 (+2, 26.46) |
| 641DIKSSNILIDEEHNAR656 | b4 (+1, 3.62) | b5 (--) | Y11 (+2, 9.37) | y12 (+2, 6.06) |
| 826SGSENTEFR834 | b5 (+1, 2.38) | b6 (+1, 0.42) | Y3 (+1, 5.06) | y4 (+1, 5.44) |
| 835GGSWITFPSVTSSQR849 | b2 (--) | b3 (--) | Y12 (+2, 5.39) | y13 (+2, 4.55) |
| 875SLEEEIGPASPGQSLFLHHNF895 | (--) | b1 (--) | Y20 (+2, 0.15) | y21 (--) |
| 875SLEEEIGPASPGQSLFLHHNF895 | b13 (--) | b14 (+1, 0.32) | y7 (+1, 0.48) | y8 (--) |
In addition to these 16 confirmed sites, we identified parent ions with m/z values corresponding to 2 other peptides, each supporting one phosphorylation site. The peptide, 852SSASEGDVAEEEDEGR867 (theoretical mass including phosphate group, 1745.63; observed [M+2H]2+, m/z 873.82) could potentially be phosphorylated at any one of the three serine residues, Ser852, Ser853 or Ser855. However, an exact assignment of the site was not possible since the fragmentation pattern did not reveal the characteristic b and y series of ions. Similarly, the mass spectrum of the 35-residue tryptic peptide, 657VADFGLSLLGPVDSGSPLAELPAGTLGYLDPEYYR691 (Fig. 8C) (theoretical mass including phosphate group, 3731.81; observed [M+3H]3+, m/z 1244.94), while supporting the presence of one phosphorylated residue among the multiple phosphorylation sites (Ser663, Ser670, Ser672, Thr681, Tyr684, Tyr689, Tyr690) did not yield the expected set of diagnostic ions in the fragmentation spectrum and hindered a precise localization of the phosphorylated residue. Nevertheless, we were able to narrow down the location to either Ser670 or Ser672 on the basis of a series of y and b ions without a phosphate group. Thus, Thr681, Tyr684, Tyr689and Tyr690 can be eliminated as potential sites based on the [M+H] y ions y5 (m/z 727.341), y6 (m/z 842.367), y8 (m/z 1118.513), y9 (m/z 1175.533) and y14 (m/z 1614.782). The m/z values clearly indicate the absence of a phosphate group. Similarly, the b ions, b9 (m/z 916.510) and b10 (m/z 973.530) do not support Ser663 as a phosphorylation site (Fig. 8C).
We also assessed the phosphorylation levels of the mutant, naïve and phosphorylated JKC proteins by staining with Pro-Q Diamond, a phosphospecific stain, and western blot analysis using anti-phosphothreonine antibody. Commensurate with data from phosphorylation analysis by mass spectrometry that showed many more phosphorylated residues for the pJKC protein compared with the naïve protein, staining with ProQ Diamond showed a very intense band for the autophosphorylated protein (pJKC) and a much weaker intensity band for the naïve JKC (Fig. 9A). Only a faint band could be seen for the mutant, as would be expected from an inactive protein undergoing little or no phosphorylation. In the western blot analysis with anti-phosphothreonine antibody, pJKC showed a band of high intensity and the naïve protein barely registered a band (Fig. 9B). This correlates well with the observation that all observed phosphorylated sites in the naïve protein are located exclusively on serine residues (Ser516*, Ser522*, Ser563*, Ser 811* or 812*, Ser837* and Ser888*) whereas pJKC has at least six confirmed phosphorylated threonine residues (Thr478, Thr501, Thr535, Thr536, Thr557, Thr831).
Figure 9.

The phosphorylation status of the inactive mutant (JKC2m), naïve JKC (JKC) and the autophosphorylated JKC (pJKC) determined by staining with Pro-Q Diamond (upper panel) and western blot using anti-phosphothreonine antibody (middle panel). The corresponding Coomassie Blue stained gel of the proteins is shown in the lower panel.
ACR4 RLK belongs to the RD family of kinases
Significantly, the large tryptic peptide 657VADFGLSLLGPVDSGSPLAELPAGTLGYLDPEYYR691 also includes the activation loop sequence (the double-underlined residues in between residues DFG and DPE respectively in Fig. 8A). It is known that autophosphorylation of specific residue(s) within the activation segment is a critically important regulatory element, and necessary for kinase activity, in many kinases belonging to the Ser/Thr family subgroup (that includes plant kinases and plant RLKs), and the Tyr kinase family subgroup (33–37). This is a characteristic feature of kinases belonging to the RD family, which contain an Arg residue preceding the invariant catalytic Asp (Fig. 10). Crystal structures of RD kinases indicate that phosphorylation in the activation segment promotes a conformational change driven by electrostatic interactions between the negatively charged phosphorylated residue and a cluster of conserved basic residues, including the Arg residue in the RD motif. This conformational change reorients the catalytic and substrate binding residues and presents an optimal spatial environment for substrate binding and catalysis. The presence of the RD motif in the ACR4 kinase domain and evidence of phosphorylation of a Ser residue in the activation segment strongly suggest that ACR4 RLK is an RD kinase. To further correlate phosphorylation of the activation loop and kinase activity, we conducted autophosphorylation assays with site-directed mutants in which each of the residues Ser663, Ser670, Ser672, Thr681 and Tyr684 was replaced separately with either an alanine, which cannot be phosphorylated (Fig. 11A), or an aspartic acid (Fig. 11B), which mimics phosphorylation. The kinase activity of the S663A mutant was indistinguishable from that of the wild type protein but the S663D mutation abolished all activity, suggesting that a negatively charged amino acid was unacceptable at this position but also simultaneously discounting the likely role of Ser663 as a substrate. With regard to Ser672, the fact that neither mutation, S672A nor S672D, changes the kinase activity makes it quite unlikely that it is a favored phosphorylation site. In contrast, the activity of the S670A mutant is significantly knocked down but vigorously restored in the S670D mutant, even though aspartic acid itself is not a substrate for the kinase. This suggests that a negative charge at position 670 is necessary for kinase activity and that this requirement is fulfilled by phosphorylation of Ser670, the most likely candidate residue for phosphorylation. Interestingly, complete loss of autophosphorylation activity is observed when Thr681 is mutated to either an alanine or an aspartic acid indicating that the loss of activity is not linked to the property of the introduced amino acid but is directly attributable to the removal of Thr residue. Importantly, the fact that even the introduction of a negative charge via an aspartate as a phosphomimetic does not restore kinase activity implicates Thr681 as a structurally important residue (38), in keeping with the tight conservation of this amino acid across a number of RLKs (Fig. 10). However, the conserved threonine, Thr760, in the Symbiosis Receptor Kinase, SYMRK, (39) and Thr468 in the Arabidopsis thaliana somatic embryogenesis receptor-like kinase, AtSERK1, (40) have also been shown to undergo phosphorylation in vitro. The complete loss of activity seen when Tyr684 is replaced with Phe, Asp, Ser or Thr, attests to the importance of non-phosphoamino acid interactions in maintaining the spatial orientations of the activation and catalytic loops in the kinase domain (38).
Figure 10.
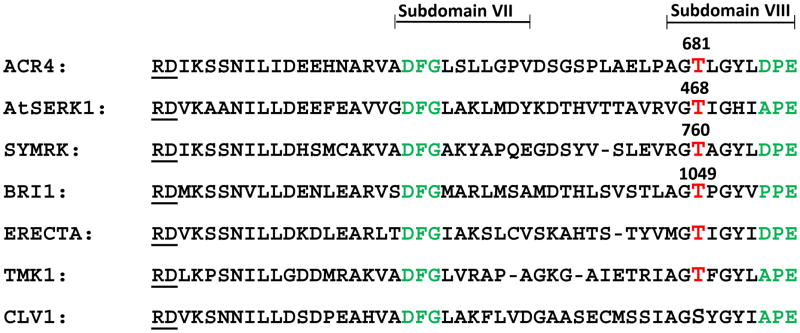
Alignment of the sequences of select RLKs belonging to the RD kinase family showing the Arg residue preceding the invariant Asp in the catalytic subdomain VI, the activation loop sequence in between the “DFG” in subdomain VII and “APE” in subdomain VIII, and the conserved Thr residue. The Gen Bank accession numbers of the sequences are: ACR4 (AB074762), AtSERK1/BAK1 (AT4G33430), SYMRK (AF492655), BRI1 (AT4G39400), ERECTA (AT2G26330), TMK1 (AT1G66150), CLV1 (AT1G75820).
Figure 11.
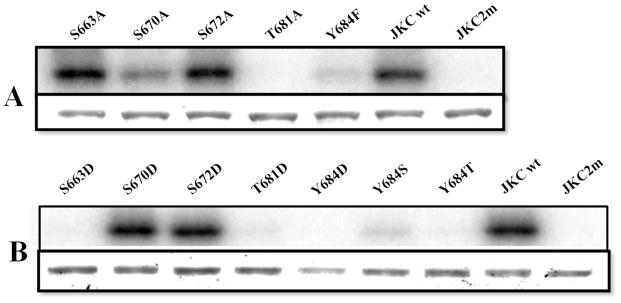
Effect of mutating activation loop phosphorylation sites on kinase activity. (A) Mutations of S663, S670, S672, T681 to Ala and Y684 to Phe (B) Mutations of S663, S670, S672, T681 to Asp and Y684 to Asp, Ser and Thr. Each mutant was purified and subjected to in vitro kinase assay as described in Materials & Methods. Equal amounts of recombinant proteins were loaded and separated by SDS-PAGE followed by autoradiography. In A and B, the top panel shows the autoradiogram and the bottom panel the corresponding Coomassie Blue stained gel. Wild type JKC and the mutant, JKC2m, were used as controls.
Autophosphorylation induces a conformational change
The “conformational plasticity” and structural modifications of kinases in response to phosphorylation and dephosphorylation is well-documented in the literature (41–43). We have addressed structural perturbations propagated through phosphorylation of the JKC using spectroscopy and limited proteolysis, all techniques that are particularly sensitive to conformational changes in proteins (44, 45). Thus, the CD spectrum of pJKC (16 confirmed phosphorylated residues) in the far-UV region (Fig. 3A) is indicative of an alteration in the secondary structure of the protein towards a less compact state in comparison with the naïve form (5 confirmed phosphorylated Ser residues) and the mutant protein that is unlikely to contain any phosphorylated residues based on the Pro-Q Diamond staining described earlier. In addition, numerous studies have demonstrated that tryptophan fluorescence in proteins is a sensitive probe of folding and tertiary structure and quite revealing of changes in the microenvironment of aromatic residues (46, 47). In comparison with the fluorescence spectra of naïve JKC and JKC2m mutant (Fig. 3B), the intensity of the intrinsic tryptophan fluorescence of the pJKC was observed to decrease significantly, accompanied by a blue-shift in the λmax of emission (from 342 nm to 338 nm) and the appearance of a shoulder at 310 nm, attributable to tyrosine fluorescence. Limited proteolysis is also a well-established technique for probing protein conformation and dynamics and relies on the fact that proteolysis occurs at sites with enhanced local flexibility (48–50). Well-folded regions within proteins usually resist protease digestion and, therefore, the protected fragments remaining after trypsin digestion represent stably folded domains. The digestion patterns of naïve JKC and pJKC with trypsin as a function of time (Fig. 12) provide additional evidence of phosphorylation induced conformational change. Whereas with naïve JKC, undigested protein could be detected through the first 10 minutes of incubation with trypsin (Fig. 12A), there was little evidence of undigested protein in the case of pJKC after the first 2.5 to 5 minutes (Fig. 12B) and there was significantly faster accumulation of the ~37 kDa protein, presumably the kinase domain, as indicated by western blot analysis (data not shown).
Figure 12.

Time course of the tryptic digest of (A) naïve JKC and (B) autophosphorylated pJKC. Proteins were incubated at room temperature for the indicated times with a 1:1000 wt:wt ratio of enzyme to substrate followed by SDS-PAGE analysis. Arrow indicates the mobility of the undigested protein and MW is the lane with molecular mass markers of 46 kDa and 30 kDa.
Discussion
In this study we have demonstrated that the ACR4 intracellular domain encodes a functional kinase that undergoes autophosphorylation on 16 confirmed sites, 2 of which occur in the juxtamembrane domain, 10 in the kinase domain and 4 in the carboxy-terminal domain. However, as noted earlier, there is evidence for three other unconfirmed phosphorylation sites. Owing to sub-stoichiometric representation of phosphopeptides, it is quite likely that additional phosphorylated residues may have gone undetected in our LC-MS/MS analysis. Regulation of kinase activity and recruitment of downstream interacting proteins via multiple sites of phosphorylation is a common feature of animal RTKs, as exemplified by EGFR (5, 6, 51). Their occurrence in many plant RLKs (52) suggests a conserved mechanism of control of signal transduction processes across the two kingdoms. In the RTKs, for example, phosphorylated residues in the juxtamembrane and carboxy-terminal regions not only serve a regulatory role (41,53) but act as docking sites for specific signaling molecules such as those containing Src homology 2 (SH2) domains or phosphotyrosine-binding (PTB) domains (54–56). Phosphorylation of Ser/Thr residues also creates binding surfaces for diverse phosphoamino acid binding modules such as the 14–3–3, WW and Forkhead-associated (FHA) (57, 58). The 14–3–3 modules are well represented in the Arabidopsis genome (59–61). An example of the FHA containing module in Arabidopsis is the kinase-associated protein phosphatase (KAPP). KAPP binds to phosphorylated Ser/Thr residues of several plant RLKs such as CLAVATA 1 (CLV1), SERK1, HAESA and FLS2 and acts as a negative regulator of receptor signaling (62–65). The phosphorylated Ser and Thr residues in the ACR4 juxtamembrane and carboxy-terminal domains of ACR4 could very well serve as docking sites for similar interacting proteins.
Many protein kinases also achieve maximal enzymatic activity only after phosphorylation of specific residues in the activation loop sequence that occurs between subdomains VII and VIII of the kinase domain (66). In some RD kinases among plant RLKs, activation loop phosphorylation is essential for both autophosphorylation and substrate phosphorylation. Thus, in BRI1, the mutation T1049A abolishes autophosphorylation and substrate phosphorylation in vitro and the mutant is also unable to rescue the weak bri1-5 Brassinolide insensitive mutant in planta (37). In the activation segment sequence alignment the correspondingly conserved residue in SYMRK (Thr760) is phosphorylated in vitro and the Ala mutant has little or no autophosphorylation or substrate phosphorylation activity (39). Similarly, the conserved Thr468 in AtSERK1 is important for both autophosphorylation and phosphorylation of artificial substrates in vitro (36). The strict conservation of Thr at this position in the activation segment of RD-type RLKs (Fig. 10) suggests that it may be an important in vivo phosphorylation site. In ACR4, the equivalent residue Thr681 does not appear to be phosphorylated by LC-MS/MS analysis but our mutagenesis experiments clearly demonstrate that it is required for in vitro kinase activity. This result, however, does not preclude the possibility of Thr681 being phosphorylated in vivo. Importantly, as in the case of BRI1, SYMRK and AtSERK1, additional phosphorylation sites within the activation segment of RD-type RLKs that are not conserved in the sequence alignment appear to be required for activation and function. Presumably, multiple phosphorylations induce conformational changes that regulate binding sites for ATP and other substrates (67). Intriguingly, in addition to regulating kinase activity, phosphorylations in the activation segment can also facilitate recruitment of downstream partners, as in the case of the interaction between the SH2 domain of the adaptor protein APS and the phosphotyrosines in the activation loop of the insulin receptor kinase (68, 69). In another interesting example, in the extracellular signal-regulated kinase (ERK), phosphorylation-dependent conformational changes in the activation loop affect the subcellular localization of the protein (70)
It appears likely that autophosphorylation induced conformational changes also affect the gross structure of the intracellular domain. Thus, molecular interactions within the JKC, involving both the juxtamembrane and the carboxy-terminal domains, could hold the molecule in a ‘closed’ conformation and the release of these interactions upon phosphorylation, results in a more ‘open’ conformation. Some support for this comes from the limited proteolysis experiment that shows a relatively faster accumulation of the 37 kDa kinase domain after phosphorylation. Indeed, in the case of BRI1, the carboxy-terminal region negatively regulates BRI1 function and deletion of this region enhances kinase activity (71). Even in RTKs, proximal regions to the catalytic domain are known to play vital roles in kinase activation mechanisms. In several receptors such as the ephrin binding receptor (EpH) family, platelet-derived growth factor (PDGF) receptor family and epidermal growth factor receptor (EGFR) family, the juxtamembrane domain is a major regulatory domain (72–75). Similarly, the domain on the carboxyl side of the kinase domain can be autoinhibitory as has been demonstrated for EGFR and the receptor TIE2, an RTK that is activated by angiopoietin-1 (76, 77).
The classical paradigm of receptor kinase function invokes ligand binding, followed by dimerization of the receptor, concomitant conformational change and activation of the kinase domain by cis- (intramolecular) or trans- (intermolecular) autophosphorylation (1, 2). The ligand for ACR4 is as yet unknown, but here we report that the autophosphorylation of NusA:JKC occurs through an intramolecular mechanism, a property associated with similar domains from RLKs such as the XA21 involved in rice disease resistance (78), BRI1 (Brassinosteroid Insensitive 1) an essential receptor controlling plant development (31), and CrRLK1 from the plant Cantharanthus roseus (30). This would suggest that ligand mediated dimerization may not be essential for activation of kinase activity. However, in vivo, alternative modes of activation remain distinctly viable. It is conceivable that ligand binding to the extracellular domain of ACR4 induces a conformational change in its intracellular domain that enables subsequent interaction with a second kinase (membrane bound or soluble) that is capable of trans-phosphorylating at a specific site on the ACR4 intracellular domain and ‘activating‘ an intramolecular autophosphorylation event. In Arabidopsis, candidate proteins that could be involved in such interactions include the CRINKLY4-related (CRR) proteins (13) and the receptor like kinase, ABNORMAL LEAF SHAPE 2 (ALE2) (79). The four CRR proteins found in Arabidopsis, AtCRR1, AtCRR2, AtCRR3 and AtCRK1 share similar structural features with ACR4 but only AtCRK1 encodes a kinase domain with phosphorylation activity in an in vitro assay (13). It is possible that receptor activation and autophosphorylation of ACR4 kinase could be stimulated by heteromeric interactions with the AtCRR proteins. Evidence for the involvement of ACR4 and the AtCRRs in a common signal transduction pathway, perhaps mediated by heterodimerization, comes from the observation that, in vitro, the ACR4 kinase domain can phosphorylate the inactive kinase domain of AtCRR2 (13). Similarly, genetic studies indicate that pathways involving ALE2 and ACR4 might act positively to regulate the specification of the protoderm and/or protoderm specific genes in the formation of leafy organs (79). Intriguingly, in in vitro experiments, the kinase domains of ACR4 and ALE2 can also phosphorylate each other (79).
Our experiments suggest that the intracellular domain of ACR4 possesses an intrinsic propensity to form higher order oligomers, although the precise contributions of the JM region and the CTD remain to be ascertained in future experiments. The fact that the NusA protein itself does not dimerize, rules out the possibility of any influence of the NusA tag on the oligomerization of the JKC. The significance of this observation in the context of ACR4 function remains to be established in more detailed molecular studies both in vitro and in vivo. In animals, in addition to ligand-induced dimerization, RTKs such as NGFR, EGFR and the erythropoietin receptor can exist as preformed dimers even in the absence of ligand (80–84). Furthermore, in the case of EGFR, the juxtamembrane domain is required for dimerization of the cytoplasmic domain (85). Among RLK’s, BRI1 (86–88) and the S-locus receptor kinase (89) have been shown to exist as ligand-independent dimers but structural features contributing to the dimerization process are unknown. The precise mechanism of productive oligomer formation and activation among plant RLKs is not completely understood and could vary among the receptor subclasses. However, in the case of BRI1, biochemical and genetic evidence has been provided for a model in which ligand binding activates a pre-exisiting BRI1 dimer which then associates with the co-receptor BAK1 and transphosphorylates key residues in the kinase domain, followed by reciprocal transphosphorylation of BRI1 by the activated BAK1 (90).
The sedimentation velocity experiments also demonstrate that autophosphorylation of NusA:JKC prevents oligomerization, perhaps attributable to electrostatic repulsions between negatively charged phosphorylated residues on the protein. However, the large size of the NusA tag, and the fact that it also is phosphorylated, precludes an unambiguous interpretation of the precise effect of autophosphorylation on the association-dissociation properties of the intracellular domain.
In conclusion, in this study we describe for the first time the biochemical properties of the intracellular domain of ACR4 and provide key insights into its phosphorylation kinetics. Ongoing and future experiments in our laboratory will address more detailed molecular analyses to delineate the role of the subdomains in ACR4 structure and function, interactions with putative partners, and mutational analysis of phosphorylation sites. Mutating different phosphorylation sites within ACR4 could have strikingly different effects including changes in receptor function, changes in receptor stability/turnover and changes in subcellular localization. Clearly, the identification of the physiological substrates of the kinase and in vivo phosphorylation sites are essential to understanding the signaling pathway mediated by ACR4. Our in vitro studies will complement genetic approaches and contribute to an overall understanding of ACR4 function in plants.
Acknowledgments
We thank Prof. Alan DiSpirito and Dr. Raji Joseph of the Dept. of BBMB and Dr. Suman Kundu (Department of Biochemistry, University of Delhi) for their critical reading of the manuscript. The mass spectrometry at Washington University was supported by NIH grants P41RR00954 and UL 1 RR024992 from the National Center for Research Resources. The expert technical assistance of Petra Erdmann-Gilmore and Alan E. Davis is gratefully acknowledged.
Abbreviations and symbols
- ACR4
Arabidopsis CRINKLY4
- ALE2
ABNORMAL LEAF SHAPE 2
- ATP
adenosine triphosphate
- BRI1
Brassinosteroid insensitive 1
- CR4
maize CRINKLY4
- CD
circular dichroism
- AtCRR
Arabidopsis CRINKLY4 related
- CTD
carboxy-terminal domain
- DTT
dithiothreitol
- EGFR
epidermal growth factor receptor
- ICD
intracellular domain
- JKC
juxtamembrane + kinase + carboxy terminal domain
- pJKC
phosphorylated JKC
- JM
juxtamembrane
- KD
kinase domain
- MyBP
myelin basic protein
- NusA
N-utilization substance A
- PDGF
platelet derived growth factor
- RLK
receptor-like kinase
- RTK
receptor tyrosine kinase
- SERK
somatic embryogenesis receptor-like kinase
- SYMRK
symbiosis receptor kinase
- TCEP
Tris (2-carboxyethyl) phosphine hydrochloride
- UV
ultraviolet
References
- 1.Jiang G, Hunter T. Receptor activation: When a dimer is not enough. Curr Biol. 1999;9:R568–R571. doi: 10.1016/s0960-9822(99)80357-1. [DOI] [PubMed] [Google Scholar]
- 2.Schlessinger J. Cell signaling by receptor tyrosine kinases. Cell. 2000;103:211–225. doi: 10.1016/s0092-8674(00)00114-8. [DOI] [PubMed] [Google Scholar]
- 3.Olayiye M, Neve RM, Lane HA, Hynes NE. The ErbB signaling network: Receptor heterodimerization in development and cancer. EMBO J. 2000;19:3159–3167. doi: 10.1093/emboj/19.13.3159. [DOI] [PMC free article] [PubMed] [Google Scholar]
- 4.Schlessinger J. Ligand-induced, receptor-mediated dimerization and activation of EGF receptor. Cell. 2002;110:669–672. doi: 10.1016/s0092-8674(02)00966-2. [DOI] [PubMed] [Google Scholar]
- 5.Schulze WX, Deng L, Mann M. Phosphotyrosine interactome of the ErbB-receptor kinase family. Mol Sys Biol. 2005:2005.0008. doi: 10.1038/msb410001. [DOI] [PMC free article] [PubMed] [Google Scholar]
- 6.Jones RB, Gordus A, Krall JA, MacBeath G. A quantitative protein interaction network for the ErbB receptors using protein microarrays. Nature. 2006;439:168–174. doi: 10.1038/nature04177. [DOI] [PubMed] [Google Scholar]
- 7.Holbro T, Hynes NE. ErbB receptors: directing key signaling networks throughout life. Annu Rev Pharmacol Toxicol. 2004;44:195–217. doi: 10.1146/annurev.pharmtox.44.101802.121440. [DOI] [PubMed] [Google Scholar]
- 8.Wieduwilt MJ, Moasser MM. The epidermal growth factor receptor family: biology driving targeted therapeutics. Cell Mol Life Sci. 2008;65:1566–1584. doi: 10.1007/s00018-008-7440-8. [DOI] [PMC free article] [PubMed] [Google Scholar]
- 9.Shiu S-H, Bleecker AB. Plant receptor-like kinase gene family: Diversity, Function and Signaling. Science STKE. 2001 doi: 10.1126/stke.2001.113.re22. [DOI] [PubMed] [Google Scholar]
- 10.Heffani YZ, Silva NF, Goring DR. Receptor kinase signaling in plants. Can J Bot. 2004;82:1–15. [Google Scholar]
- 11.Becraft PW, Stinard PS, McCarty DR. CRINKLY4: A TNFR-like receptor kinase involved in maize epidermal differentiation. Science. 1996;273:1406–1409. doi: 10.1126/science.273.5280.1406. [DOI] [PubMed] [Google Scholar]
- 12.Jin P, Guo T, Becraft PW. The maize CR4 receptor-like kinase mediates a growth factor-like differentiation response. Genesis. 2000;27:104–116. doi: 10.1002/1526-968x(200007)27:3<104::aid-gene30>3.0.co;2-i. [DOI] [PubMed] [Google Scholar]
- 13.Cao X, Li K, Suh SG, Guo T, Becraft PW. Molecular analysis of the CRINKLY4 gene family in Arabidopsis thaliana. Planta. 2005;220:645–657. doi: 10.1007/s00425-004-1378-3. [DOI] [PubMed] [Google Scholar]
- 14.Gifford ML, Robertson FC, Soares DC, Ingram GC. Arabidopsis CRINKLY4 function, internalization and turnover are dependent on the extracellular crinkly repeat domain. The Plant Cell. 2005;17:1154–1166. doi: 10.1105/tpc.104.029975. [DOI] [PMC free article] [PubMed] [Google Scholar]
- 15.Tanaka H, Watanabe M, Watanabe D, Tanaka T, Machida C, Machida Y. ACR4, a putative receptor kinase gene of Arabidopsis thaliana, that is expressed in the outer cell layers of embryos and plants, is involved in proper embryogenesis. Plant Cell Physiol. 2002;43:419–428. doi: 10.1093/pcp/pcf052. [DOI] [PubMed] [Google Scholar]
- 16.Gifford ML, Dean S, Ingram GC. The Arabidopsis ACR4 gene plays a role in cell layer organization during ovule integument and sepal margin development. Development. 2003;130:4249–4258. doi: 10.1242/dev.00634. [DOI] [PubMed] [Google Scholar]
- 17.Watanabe M, Tanaka H, Watanabe D, Machida C, Machida Y. The ACR4 receptor-like kinase is required for surface formation of epidermis-related tissues in Arabidopsis thaliana. The Plant Journal. 2004;39:298–308. doi: 10.1111/j.1365-313X.2004.02132.x. [DOI] [PubMed] [Google Scholar]
- 18.De Smet I, Vassileva V, De Rybel B, Levesque MP, Grunewald W, Van Damme D, Van Noorden G, Naudts M, Van Isterdael G, De Clercq R, Wang JY, Meuli N, Vanneste S, Friml J, Hilson P, Jürgens G, Ingram GC, Inzé D, Benfey PN, Beeckman T. Receptor-like kinase ACR4 restricts formative cell divisions in the Arabidopsis root. Science. 2008;322:594–597. doi: 10.1126/science.1160158. [DOI] [PubMed] [Google Scholar]
- 19.Stahl Y, Wink RH, Ingram GC, Simon R. A signaling module controlling the stem cell niche in Arabidopsis root meristems. Curr Biol. 2009 doi: 10.1016/j.cub.2009.03.060. [DOI] [PubMed] [Google Scholar]
- 20.Nittis T, Guittat L, LeDuc RD, Dao B, Duxin JP, Rohrs H, Townsend RR, Stewart SA. Revealing novel telomere proteins using in vivo cross-linking, tandem affinity purification, and label-free quantitative LC-FTICR-MS. Mol Cell Proteomics. 2010;9:1144–1156. doi: 10.1074/mcp.M900490-MCP200. [DOI] [PMC free article] [PubMed] [Google Scholar]
- 21.Van Holde KE, Weischet WO. Boundary analysis of sedimentation velocity experiments with monodisperse and paucidisperse solutes. Biopolymers. 1978;17:1387–1403. [Google Scholar]
- 22.Wente SR, Villalba M, Schramm V, Rosen OM. Mn2(+)-binding properties of a recombinant protein-tyrosine kinase derived from the human insulin receptor. Proc Natl Acad Sci USA. 1990;87:2805–2809. doi: 10.1073/pnas.87.7.2805. [DOI] [PMC free article] [PubMed] [Google Scholar]
- 23.Sierke SL, Cheng K, Kim HH, Koland JG. Biochemical characterization of the protein tyrosine kinase homology domain of the ErbB3 (HER3) receptor protein. Biochem J. 1997;322:757–763. doi: 10.1042/bj3220757. [DOI] [PMC free article] [PubMed] [Google Scholar]
- 24.Hansen JC, Lebowitz J, Demeler B. Analytical ultracentrifugation of complex macromolecular systems. Biochemistry. 1994;33:13155–13163. doi: 10.1021/bi00249a001. [DOI] [PubMed] [Google Scholar]
- 25.Gill SC, Weitzel SE, von Hippel PH. Escherichia coli sigma 70 and NusA proteins. I. Binding interactions with core RNA polymerase in solution and within the transcription complex. J Mol Biol. 1991;220:307–324. doi: 10.1016/0022-2836(91)90015-x. [DOI] [PubMed] [Google Scholar]
- 26.Gill SC, Weitzel SE, von Hippel PH. Escherichia coli sigma 70 and NusA proteins. II. Physical properties and self-association states. J Mol Biol. 1991;220:325–333. doi: 10.1016/0022-2836(91)90016-y. [DOI] [PubMed] [Google Scholar]
- 27.Shin DH, Nguyen HH, Jancarik J, Yokota H, Kim R, Kim S–H. Crystal Structure of NusA from Thermotoga Maritima and Functional Implication of the N-Terminal Domain. Biochemistry. 2003;42:13429–13437. doi: 10.1021/bi035118h. [DOI] [PubMed] [Google Scholar]
- 28.Gopal B, Haire LF, Gamblin SJ, Dodson EJ, Lane AN, Papavinasasundaram KG, Colston MJ, Dodson G. Crystal structure of the transcription elongation/anti-termination factor NusA from Mycobacterium tuberculosis at 1.7 A resolution. J Mol Biol. 2001;314:1087–1095. doi: 10.1006/jmbi.2000.5144. [DOI] [PubMed] [Google Scholar]
- 29.Horn MA, Walker JC. Biochemical properties of the autophosphorylation of RLK5, a receptor-like protein kinase from Arabidopsis thaliana. Biochim Biophys Acta. 1994;1208:65–74. doi: 10.1016/0167-4838(94)90160-0. [DOI] [PubMed] [Google Scholar]
- 30.Schulze-Muth P, Irmler S, Schroder G, Schroder J. Novel type of receptor-like protein kinase from a higher plant (Catharanthus roseus). cDNA, gene, intramolecular autophosphorylation, and identification of a threonine important for auto- and substrate phosphorylation. J Biol Chem. 1996;271:26684–26689. doi: 10.1074/jbc.271.43.26684. [DOI] [PubMed] [Google Scholar]
- 31.Oh MH, Ray WK, Huber SC, Asara JM, Gage DA, Clouse SD. Recombinant brassinosteroid insensitive 1 receptor-like kinase autophosphorylates on serine and threonine residues and phosphorylates a conserved peptide motif in vitro. Plant Physiol. 2000;124:751–766. doi: 10.1104/pp.124.2.751. [DOI] [PMC free article] [PubMed] [Google Scholar]
- 32.Beausoleil SA, Villen J, Gerber SA, Rush J, Gygi SP. A probability based approach for high-throughput protein phosphorylation analysis and site localization. Nat Biotech. 2006;24:1485. doi: 10.1038/nbt1240. [DOI] [PubMed] [Google Scholar]
- 33.Johnson LN, Noble MEM, Owen DJ. Active and inactive protein kinases: Structural basis for regulation. Cell. 1996;85:149–158. doi: 10.1016/s0092-8674(00)81092-2. [DOI] [PubMed] [Google Scholar]
- 34.Johnson LN, Lewis RJ. Structural basis for control by phosphorylation. Chem Rev. 2001;101:2209–2242. doi: 10.1021/cr000225s. [DOI] [PubMed] [Google Scholar]
- 35.Burza AM, Pekala I, Sikora J, Siedlecki P, Malagocki P, Bucholc M, Koper L, Zielenkiewicz P, Dadlez M, Dobrowolska G. Nicotiana tobaccum osmotic stress-activated kinase is regulated by phosphorylation on Ser-154 and Ser-158 in the kinase activation loop. J Biol Chem. 2006;281:34299–34311. doi: 10.1074/jbc.M601977200. [DOI] [PubMed] [Google Scholar]
- 36.Shah K, Vervoort J, de Vries SC. Role of threonines in the Arabidopsis thaliana somatic embryogenesis receptor kinase 1 activation loop in phosphorylation. J Biol Chem. 2001;276:41263–41269. doi: 10.1074/jbc.M102381200. [DOI] [PubMed] [Google Scholar]
- 37.Wang X, Goshe MB, Soderblom EJ, Phinney BS, Kushar JA, Li J, Asami T, Yoshida S, Huber SC, Clouse SD. Identification and functional analysis of in vivo phosphorylation sites of the Arabidopsis BRASSINOSTEROID-INSENSITIVE 1 receptor kinase. The Plant Cell. 2005;17:1685–1703. doi: 10.1105/tpc.105.031393. [DOI] [PMC free article] [PubMed] [Google Scholar]
- 38.Krupa A, Preethi G, Srinivasan N. Structural modes of stabilization of permissive phoshphorylation sites in protein kinases: Distinct strategies in Ser/Thr and Tyr kinases. J Mol Biol. 2004;339:1025–1039. doi: 10.1016/j.jmb.2004.04.043. [DOI] [PubMed] [Google Scholar]
- 39.Yoshida S, Parniske M. Regulation of plant symbiosis receptor kinase through Serine and Threonine phosphorylation. J Biol Chem. 2005;280:9203–9209. doi: 10.1074/jbc.M411665200. [DOI] [PubMed] [Google Scholar]
- 40.Karlova R, Boeren S, van Dongen W, Kwaaitaal M, Aker J, Vervoort J, de Vries S. Identification of in vitro phosphorylation sites in the Arabidopsis thaliana somatic embryogenesis receptor-like kinases. Proteomics. 2009;9:368–379. doi: 10.1002/pmic.200701059. [DOI] [PubMed] [Google Scholar]
- 41.Huse M, Kuriyan J. The conformational plasticity of protein kinases. Cell. 2002;109:275–282. doi: 10.1016/s0092-8674(02)00741-9. [DOI] [PubMed] [Google Scholar]
- 42.Nolan B, Taylor S, Ghosh G. Regulation of protein kinases: Controlling activity through activation segment conformation. Mol Cell. 2004;15:661–675. doi: 10.1016/j.molcel.2004.08.024. [DOI] [PubMed] [Google Scholar]
- 43.Groban ES, Narayanan A, Jacobson MP. Conformational changes in protein loops and helices induced by post-translational phosphorylation. PLoS Comput Biol. 2006;2(4):e32. doi: 10.1371/journal.pcbi.0020032. Epub 2006 Apr 21. [DOI] [PMC free article] [PubMed] [Google Scholar]
- 44.Roesler KR, Rao AG. Conformation and stability of barley chymotrypsin inhibitor-2 (CI-2) mutants containing multiple lysine substitutions. Protein Eng. 1999;12:967–973. doi: 10.1093/protein/12.11.967. [DOI] [PubMed] [Google Scholar]
- 45.Roesler KR, Rao AG. A single disulfide bond restores thermodynamic and proteolytic stability to an extensively mutated protein. Protein Science. 2000;9:1642–1650. doi: 10.1110/ps.9.9.1642. [DOI] [PMC free article] [PubMed] [Google Scholar]
- 46.Laskowicz JR. Principles of Fluorescence Spectroscopy. Plenum Press; New York: 1983. [Google Scholar]
- 47.Barry JK, Selinger DA, Wang C, Olsen O–A, Rao AG. Biochemical characterization of a truncated penta-EF-hand Ca2+ binding protein from maize. Biochim Biophys Acta. 2006;1764:239–245. doi: 10.1016/j.bbapap.2005.10.001. [DOI] [PubMed] [Google Scholar]
- 48.Fontana A, Fassina G, Vita C, Dalzoppo D, Zamai M, Zambonin M. Correlation between sites of limited proteolysis and segmental mobility in thermolysin. Biochemistry. 1986;25:1847–1851. doi: 10.1021/bi00356a001. [DOI] [PubMed] [Google Scholar]
- 49.Polverino P, Frare E, Gottardo R, Dael VH, Fontana A. Partly folded states of members of the lysozyme/lactalbumin superfamily: A comparative study by circular dichrosim spectroscopy and limited proteolysis. Protein Science. 2002;11:2932–2946. doi: 10.1110/ps.0205802. [DOI] [PMC free article] [PubMed] [Google Scholar]
- 50.Kamath N, Karwowska-Desaulniers P, Pflum MKH. Limited proteolysis of human histone deacetylase 1. BMC Biochemistry. 2006;7:22–36. doi: 10.1186/1471-2091-7-22. [DOI] [PMC free article] [PubMed] [Google Scholar]
- 51.Lemmon MA, Schlessinger J. Cell signaling by receptor tyrosine kinases. Cell. 2010;141:1117–1134. doi: 10.1016/j.cell.2010.06.011. [DOI] [PMC free article] [PubMed] [Google Scholar]
- 52.Nuhse TS, Stensballe A, Jensen ON, Peck SC. Phosphoproteomics of the Arabidopsis plasma membrane and a new phosphorylation site database. Plant Cell. 2004;16:2394–2405. doi: 10.1105/tpc.104.023150. [DOI] [PMC free article] [PubMed] [Google Scholar]
- 53.Adams JA. Activation loop phosphorylation and catalysis in protein kinases: is there functional evidence for the autoinhibitor model? Biochemistry. 2003;42:601–607. doi: 10.1021/bi020617o. [DOI] [PubMed] [Google Scholar]
- 54.Yarden Y, Sliwkowski MX. Untangling the ErbB signaling network. Nat, Rev Mol Cell Biol. 2001;2:127–137. doi: 10.1038/35052073. [DOI] [PubMed] [Google Scholar]
- 55.Pawson T, Nash P. Protein-protein interactions define specificity in signal transduction. Genes Develop. 2000;14:1027–1047. [PubMed] [Google Scholar]
- 56.Herbst R, Burden SJ. The juxtamembrane region of MuSK has a critical role in agrin-mediated signaling. EMBO J. 2000;19:67–77. doi: 10.1093/emboj/19.1.67. [DOI] [PMC free article] [PubMed] [Google Scholar]
- 57.Yaffe MB, Elia AE. Phosphoserine/threonine-binding domains. Curr Opin Cell Biol. 2001;13:131–138. doi: 10.1016/s0955-0674(00)00189-7. [DOI] [PubMed] [Google Scholar]
- 58.Li J, Lee G–I, Van Doren SR, Walker JC. The FHA domain mediates phosphoprotein interactions. J Cell Science. 2000;113:4143–4149. doi: 10.1242/jcs.113.23.4143. [DOI] [PubMed] [Google Scholar]
- 59.DeLille J, Sehnke PC, Ferl RJ. The Arabidopsis thaliana 14-3-3 family of signaling regulators. Plant Physiol. 2001;126:35–38. doi: 10.1104/pp.126.1.35. [DOI] [PMC free article] [PubMed] [Google Scholar]
- 60.Rosenquist M, Alsterfjord M, Larsson C, Sommarin M. Data mining the Arabidopsis genome reveals fifteen 14-3-3 genes. Expression is demonstrated for two out of five novel genes. Plant Phys. 2001;127:142–149. doi: 10.1104/pp.127.1.142. [DOI] [PMC free article] [PubMed] [Google Scholar]
- 61.Sehnke PC, DeLille JM, Ferl RJ. Consummating signal transduction: The role of 14-3-3 proteins in the completion of signal-induced transitions in protein activity. The Plant Cell. 2002:S339–S354. doi: 10.1105/tpc.010430. [DOI] [PMC free article] [PubMed] [Google Scholar]
- 62.Williams RW, Wilson JM, Meyerowitz EM. A possible role for kinase-associated protein phosphatase in the Arabidopsis CLAVATA1 signaling pathway. Proc Natl Acad Sci USA. 1997;94:10467–10472. doi: 10.1073/pnas.94.19.10467. [DOI] [PMC free article] [PubMed] [Google Scholar]
- 63.Shah K, Russinova E, Gadella TW, Jr, Willemse J, De Vries SC. The Arabidopsis kinase- associated protein phosphatase controls internalization of the somatic embryogenesis receptor kinase 1. Genes Dev. 2002;16:1707–1720. doi: 10.1101/gad.220402. [DOI] [PMC free article] [PubMed] [Google Scholar]
- 64.Stone JM, Colinge MA, Smith RD, Horn MA, Walker JC. Interaction of a protein phosphatase with an Arabidopsis serine-threonine receptor kinase. Science. 1994;266:793–795. doi: 10.1126/science.7973632. [DOI] [PubMed] [Google Scholar]
- 65.Gomez-Gomez L, Bauer Z, Boller T. Both the extracellular leucine-rich repeat domain and the kinase activity of FLS2 are required for flagellin binding and signaling in Arabidopsis. The Plant Cell. 2001;13:1155–1163. [PMC free article] [PubMed] [Google Scholar]
- 66.Hanks SK, Hunter T. Protein kinases 6. The eukaryotic protein kinase superfamily: kinase (catalytic) domain structure and classification. FASEB J. 1995;9:576–596. [PubMed] [Google Scholar]
- 67.Hubbard SR. Crystal structure of the activated insulin receptor tyrosine kinase in complex with peptide substrate and ATP analog. EMBO J. 1997;16:5572–5581. doi: 10.1093/emboj/16.18.5572. [DOI] [PMC free article] [PubMed] [Google Scholar]
- 68.Moodie SA, Alleman-Sposeto J, Gustafson TA. Identification of the APS protein as a novel insulin receptor substrate. J Biol Chem. 1999;274:11186–11193. doi: 10.1074/jbc.274.16.11186. [DOI] [PubMed] [Google Scholar]
- 69.Hu J, Liu J, Ghirlando R, Saltiel AR, Hubbard SR. Structural basis for recruitment of the adaptor protein APS to the activated insulin receptor. Molec Cell. 2003;12:1379–1389. doi: 10.1016/s1097-2765(03)00487-8. [DOI] [PubMed] [Google Scholar]
- 70.Wolf I, Rubenfeld H, Yoon S, Marmor G, Hanoch T, Seger R. Involvement of the activation loop of ERK in the detachment from cytosolic anchoring. J Biol Chem. 2001;276:24490–24497. doi: 10.1074/jbc.M103352200. [DOI] [PubMed] [Google Scholar]
- 71.Wang X, Li X, Meisenhelder J, Junter T, Yoshida S, Asami T, Chory J. Autoregulation and homodimerization are involved in the activation of the plant steroid receptor BRI1. Developmental Cell. 2005;8:855–865. doi: 10.1016/j.devcel.2005.05.001. [DOI] [PubMed] [Google Scholar]
- 72.Wybenga-Groot LE, Baskin B, Ong SH, Tong J, Pawson T, Sicheri F. Structural basis for autoinhibition of the EphB2 receptor tyrosine kinase by the naive juxtamembrane region. Cell. 2001;106:745–757. doi: 10.1016/s0092-8674(01)00496-2. [DOI] [PubMed] [Google Scholar]
- 73.Griffith J, Black J, Faermon C, Swenson L, Wynn M, Lu F, Lipke J, Saxena K. The structural basis for autoinhibition of FLT3 by the juxtamembrane domain. Mol Cell. 2004;13:169–178. doi: 10.1016/s1097-2765(03)00505-7. [DOI] [PubMed] [Google Scholar]
- 74.Thiel KW, Carpenter G. Epidermal growth factor receptor juxtamembrane region regulates allosteric tyrosine kinase activation. Proc Natl Acad Sci USA. 2007;104:19238–19243. doi: 10.1073/pnas.0703854104. [DOI] [PMC free article] [PubMed] [Google Scholar]
- 75.Hubbard SR. Juxtamembrane autoinhibition in receptor tyrosine kinases. Nat Rev Mol Cell Biol. 2004;5:464–470. doi: 10.1038/nrm1399. [DOI] [PubMed] [Google Scholar]
- 76.Lee NY, Koland JG. Conformational changes accompany phosphorylation of the epidermal growth factor receptor C-terminal domain. Protein Science. 2005;14:2793–2803. doi: 10.1110/ps.051630305. [DOI] [PMC free article] [PubMed] [Google Scholar]
- 77.Niu XL, Peters KG, Kontos CD. Deletion of the carboxy terminus of Tie2 enhances kinase activity, signaling and function: evidence for an autoinhibitory mechanism. J Biol Chem. 2002;277:31768–31773. doi: 10.1074/jbc.M203995200. [DOI] [PubMed] [Google Scholar]
- 78.Liu G–Z, Pi L–Y, Walker JC, Ronald PC, Song W–Y. Biochemical characterization of the kinase domain of the rice disease resistance receptor-like kinase XA21. J Biol Chem. 2002;277:20264–20269. doi: 10.1074/jbc.M110999200. [DOI] [PubMed] [Google Scholar]
- 79.Tanaka H, Watanabe M, Sasabe M, Hiroe T, Tanaka T, Tsukuya H, Ikezaki M, Machida C, Machida Y. Novel receptor-like kinase ALE2 controls shoot development by specifying epidermis in Arabidopsis. Development. 2007;134:1643–1652. doi: 10.1242/dev.003533. [DOI] [PubMed] [Google Scholar]
- 80.Gadella TWJ, Jr, Jovin TM. Oligomerization of epidermal growth factor receptors on A431 cells studied by time-resolved fluorescence imaging microscopy. A stereochemical model for tyrosine kinase receptor activation. J Cell Biol. 1995;129:1543–1558. doi: 10.1083/jcb.129.6.1543. [DOI] [PMC free article] [PubMed] [Google Scholar]
- 81.Livnah O, Stura FA, Middleton SA, Johnson DL, Jolliffe IK, Wilson IA. Crystallographic evidence for preformed dimers of erythropoietin receptor before ligand activation. Science. 1999;283:987–990. doi: 10.1126/science.283.5404.987. [DOI] [PubMed] [Google Scholar]
- 82.Moriki T, Maruyama H, Maruyama IN. Activation of preformed EGF receptor dimers by ligand induced rotation of the transmembrane domain. J Mol Biol. 2001;311:1011–1026. doi: 10.1006/jmbi.2001.4923. [DOI] [PubMed] [Google Scholar]
- 83.Mischel PS, Umbach JA, Eskandari S, Smith SG, Gunderson CB, Zamphigi GA. Nerve growth factor signals via preexisting TrkA receptor oligomers. Biophys J. 2002;83:968–976. doi: 10.1016/S0006-3495(02)75222-3. [DOI] [PMC free article] [PubMed] [Google Scholar]
- 84.Ferguson KM, Berger MB, Mendrola JM, Cho HS, Leahy DJ, Lemmon MA. EGF activates its receptor by removing interactions that autoinhibit ectodomain dimerization. Mol Cell. 2003;11:507–517. doi: 10.1016/s1097-2765(03)00047-9. [DOI] [PubMed] [Google Scholar]
- 85.Aifa S, Aydin J, Nordvall G, Lundtrom I, Svensson SPS, Hermanson O. A basic peptide within the juxtamembrane region is required for EGF receptor dimerization. Exp Cell Res. 2005;302:108–114. doi: 10.1016/j.yexcr.2004.08.032. [DOI] [PubMed] [Google Scholar]
- 86.Russinova E, Borst J–W, Kwaaitaal M, Cano-Delgado A, Yin Y, Chory J, de Vries SC. Heterodimerization and endocytosis of Arabidopsis brassinosteroid receptors BRI1 and AtSERK3 (BAK1) The Plant Cell. 2004;16:3216–3229. doi: 10.1105/tpc.104.025387. [DOI] [PMC free article] [PubMed] [Google Scholar]
- 87.Wang X, Goshe MB, Soderblom EJ, Phinney BS, Kuchar JA, Li J, Asami T, Yoshida S, Huber SC, Clouse SD. Identification and functional analysis of in vivo phosphorylation sites of the Arabidopsis Brassinosteroid-Insensitive1 receptor kinase. The Plant Cell. 2005;17:1685–1703. doi: 10.1105/tpc.105.031393. [DOI] [PMC free article] [PubMed] [Google Scholar]
- 88.Hink MA, Shah K, Russinova E, de Vries SC, Vissar AJ. Fluorescence fluctuation analysis of Arabidopsis thaliana somatic embryogenesis receptor-like kinase and brassinosteroid insensitive 1 receptor oligomerization. Biophys J. 2008;94:1052–1062. doi: 10.1529/biophysj.107.112003. [DOI] [PMC free article] [PubMed] [Google Scholar]
- 89.Giranton JL, Dumas C, Cock JM, Gaude T. The integral membrane S-locus receptor kinase of Brassica has serine/threonine kinase activity in a membranous environment and spontaneously forms oligomers in planta. Proc Natl Acad Sci USA. 2000;97:3759–3764. doi: 10.1073/pnas.070025097. [DOI] [PMC free article] [PubMed] [Google Scholar]
- 90.Wang X, Kota U, He K, Blackburn K, Li J, Goshe MB, Huber SC, Clouse SD. Sequential transphosphorylation of the BRI1/BAK1 receptor kinase complex impacts early events in brassinosteroid signaling. Developmental Cell. 2008;15:220–235. doi: 10.1016/j.devcel.2008.06.011. [DOI] [PubMed] [Google Scholar]