

ABSTRACT
Heteroresistance refers to phenotypic heterogeneity of microbial clonal populations under antibiotic stress, and it has been thought to be an allocation of a subset of “resistant” cells for surviving in higher concentrations of antibiotic. The assumption fits the so-called bet-hedging strategy, where a bacterial population “hedges” its “bet” on different phenotypes to be selected by unpredicted environment stresses. To test this hypothesis, we constructed a heteroresistance model by introducing a blaCTX-M-14 gene (coding for a cephalosporin hydrolase) into a sensitive Escherichia coli strain. We confirmed heteroresistance in this clone and that a subset of the cells expressed more hydrolase and formed more colonies in the presence of ceftriaxone (exhibited stronger “resistance”). However, subsequent single-cell-level investigation by using a microfluidic device showed that a subset of cells with a distinguishable phenotype of slowed growth and intensified hydrolase expression emerged, and they were not positively selected but increased their proportion in the population with ascending antibiotic concentrations. Therefore, heteroresistance—the gradually decreased colony-forming capability in the presence of antibiotic—was a result of a decreased growth rate rather than of selection for resistant cells. Using a mock strain without the resistance gene, we further demonstrated the existence of two nested growth-centric feedback loops that control the expression of the hydrolase and maximize population growth in various antibiotic concentrations. In conclusion, phenotypic heterogeneity is a population-based strategy beneficial for bacterial survival and propagation through task allocation and interphenotypic collaboration, and the growth rate provides a critical control for the expression of stress-related genes and an essential mechanism in responding to environmental stresses.
IMPORTANCE
Heteroresistance is essentially phenotypic heterogeneity, where a population-based strategy is thought to be at work, being assumed to be variable cell-to-cell resistance to be selected under antibiotic stress. Exact mechanisms of heteroresistance and its roles in adaptation to antibiotic stress have yet to be fully understood at the molecular and single-cell levels. In our study, we have not been able to detect any apparent subset of “resistant” cells selected by antibiotics; on the contrary, cell populations differentiate into phenotypic subsets with variable growth statuses and hydrolase expression. The growth rate appears to be sensitive to stress intensity and plays a key role in controlling hydrolase expression at both the bulk population and single-cell levels. We have shown here, for the first time, that phenotypic heterogeneity can be beneficial to a growing bacterial population through task allocation and interphenotypic collaboration other than partitioning cells into different categories of selective advantage.
INTRODUCTION
The increasing antibiotic resistance of bacterial pathogens is of great concern worldwide. The exploration of possible mechanisms of such resistance has led to intensive investigations of heteroresistance: phenotypic heterogeneous resistance to an antibiotic treatment within a clonal population (1–3). In laboratory practice, such resistant subpopulations emerge as resistant colonies grown inside the inhibitory halos in Etest and lead to a gradual decrease in the colony count on agar plates as the antibiotic concentration increases in a population analysis profile (PAP) assay (4).
Heteroresistance is observed in a wide range of microbes (5–7) and often in cases of treatment failures (8, 9); it has been thought to be a prerequisite of resistant subpopulations that lead to full resistance due to their selective advantages upon antibiotic stress (10–12). However, this speculation remains controversial because the “resistant” colonies do not always give rise to resistant progenies or converge to a homotypic fully resistant phenotype after antibiotic selection (7). In addition, the genetic basis of heteroresistance remains obscure, although attempts to discover it have been made (13, 14) and a single resistant gene, mecA, has been reported to be responsible for heteroresistance in Staphylococcus aureus (15).
Although heteroresistance generally refers to a subset of phenotypically resistant cells from antibiotic-sensitive clinical isolates, phenotypic heterogeneity in terms of antibiotic resistance has often been observed in resistant strains. In fact, a sensitive or resistant strain is recognized according to artificial criteria, and the heteroresistance of these strains may share common mechanisms that vary only with the resistance mode. Here, our study was focused on a particular case where a hydrolase was used to construct a simple cellular model: a plasmid containing a gene encoding an extended-spectrum beta-lactamase (ESBL) (a beta-lactam hydrolase), CTX-M-14, was introduced into a commonly used laboratory antibiotic-sensitive Escherichia coli strain, DH5α. We subsequently investigated population-based and single-cell-based performance of the resistant strain under broadly varying antibiotic stresses (concentrations). The hydrolase gene appears to be tightly coupled with growth rate control; antibiotic levels, resistance gene expression, and cell growth form feedback loops exhibiting growth plasticity and adaptation to the changing antibiotic stress.
RESULTS AND DISCUSSION
Host heteroresistance reflects heterogeneous expression of hydrolase genes.
To see if ESBL genes are related to heteroresistance and using PAP, we analyzed four ESBL-bearing clinical isolates from Klebsiella pneumoniae and Escherichia coli, all of which exhibit heteroresistance in the presence of ceftriaxone (Fig. 1a). The behavior of these strains is in accordance with a previous report that a bla OXA-58-like gene-encoded hydrolase was demonstrated to always lead to phenotypic heterogeneous resistance (PHR) (heteroresistance) to carbapenems in Acinetobacter baumannii (1).
FIG 1 .

A plasmid-bearing ESBL gene leads to heteroresistance. (a) PAPs of four clinical isolates. Four isolates were analyzed, including two E. coli (Eco) strains (carrying the CTX-M-14 and TEM-10 ESBL genes) and two K. pneumoniae (Kpn) strains (producing CTX-M-65 and SHV-2). Ceftriaxone was the antibiotic used for all strains. (b) Construction of the plasmid expressing CTX-M-14. (c) Fluorescent image of cells from overnight culture of the resistant strain R4. Growing cells show significant differences in CTX-M-14-GFP expression. The inset shows a histogram of GFP intensity for the same cell population.
To carry the investigation further, we first constructed a molecular model for heteroresistance by introducing a plasmid (pUA66) carrying an ESBL gene, encoding CTX-M-14, into E. coli DH5α. We also inserted the CTX-M-14 gene promoter upstream of the green fluorescence protein (GFP) open reading frame (ORF) (16) (Fig. 1b) so that the fluorescence intensity of GFP directly reflected the expression of the CTX-M-14 gene. The reason we chose the CTX-M-14 gene for the study is based on its widely known prevalence (17, 18) and the fact that there is no trans regulator or cis elements controlling its expression when antibiotics are in action (19). Second, we evaluated heteroresistance and CTX-M-14 gene expression in the resistant host strain, namely, E. coli R4. The PAP curve of R4 for ceftriaxone appears similar to that of the original clinical E. coli isolate from which the CTX-M-14 gene was cloned, with a slight shift toward the left (Fig. 1a). The GFP intensity of the R4 overnight culture had a roughly logarithmic Gaussian distribution in flow cytometry (FCM), ranging from 102 to 105 arbitrary units (AU), with a peak at 1,238 AU (Fig. 1c). Consequently, the CTX-M-14 gene itself was heterogeneously expressed and sufficiently led to detectable heteroresistance at the same time.
Hydrolase gene expression in subpopulations correlates positively with resistance and adaption to variable antibiotic stress.
To further confirm if hydrolase gene expression correlates with resistance, we flow sorted (fluorescence-activated cell sorting [FACS]) the top 7% (named the high-intensity group [HIG]) and the lowest 10% (named the low-intensity group [LIG]) bacterial populations based on their GFP intensity from an overnight culture grown in drug-free medium (Fig. 2a). We used Etest to measure the ceftriaxone MICs of the LIG and HIG, which are 4 µg/ml and >256 µg/ml, respectively (Fig. 2b); this result indicates that higher GFP intensity or more CTX-M-14 hydrolase production corresponds to stronger resistance. To see if plasmid copy number variation contributes to the expression of the hydrolase, we quantified copy numbers of both the plasmid and the CTX-M-14 transcript in the two GFP intensity groups, using real-time PCR and a housekeeping gene, gapA, as a reference; the corresponding fold changes in the copy numbers of the plasmid and the hydrolase transcript for HIG over LIG are 4.89× and 7.67×, respectively (Fig. 2c). The different fold changes reflect variations in plasmid copy number and transcription activity between the two subgroups.
FIG 2 .
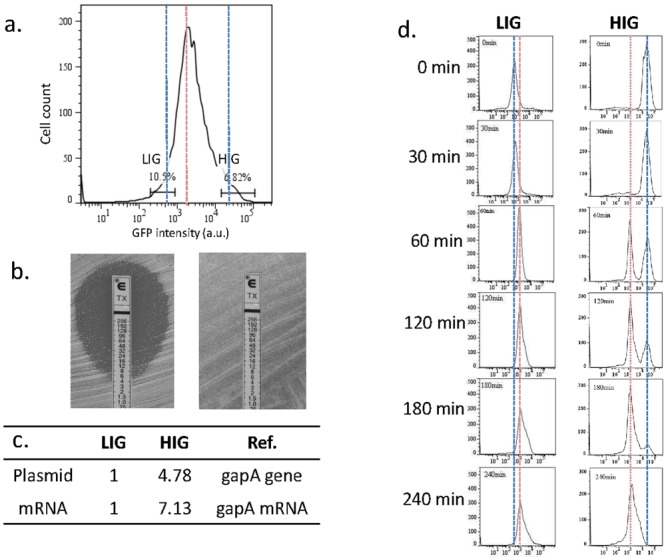
High-intensity group (HIG) and low-intensity group (LIG) cells show differences in resistance to antibiotics. (a) Sorting gates of HIG and LIG cells. (b) Etest of LIG (left) and HIG (right) cells. (c) Copy numbers of the plasmid and CTX-M-14 transcripts in HIG and LIG cells. (d) Dynamic GFP intensity histograms of HIG and LIG cells after sorting. Cells of both subgroups were cultured in antibiotic-free medium and sampled for FCM assay every 30 min for 4 h immediately after sorting. The red dotted line indicates the peak position of the whole population under antibiotic-free conditions, and the blue dotted lines indicate peak positions of the sorted LIG and HIG subpopulations.
Further observation uncovered that the hydrolase gene exhibited quantized expression when we cultured the HIG and LIG cells in antibiotic-free medium immediately after sorting and investigated the dynamic distribution of the expression. The LIG-associated peak at 732 AU eventually switched to the position of the antibiotic-free peak at 1,238 AU in ~30 to 60 min. The initial HIG-associated peak at 23,158 AU faded away in ~4 h and was replaced by the antibiotic-free peak at 1,238 AU, which emerged at ~60 min (Fig. 2d). In both cases, the peaks did not shift continuously but were replaced by peaks characteristic of the antibiotic-free condition.
We further examined the antibiotic effect with hydrolase expression using exponential-phase cells incubated in a series of double dilutions of ceftriaxone for 3 h. Along with the increased ceftriaxone dosage, cell proliferation was suppressed (Fig. 3a). Meanwhile, the average florescence intensities and MIC in Etest for the entire population shared a common trend, ascending gradually but with a constant shoulder at the dosage interval of 8 to 128 µg/ml (Fig. 3b). The result further confirms the correlation between CTX-M-14 expression and resistance.
FIG 3 .

Effects of antibiotic on the GFP intensity of the R4 strain. (a) Growth curves of the R4 strain cultured in medium containing serially diluted ceftriaxone. (b) Average fluorescence intensity (left y axis; a.u., arbitrary units) and MIC measured with Etest (right y axis) at the time point of 3 h of ceftriaxone treatment as shown in panel a. (c) Histograms of GFP intensity after 3 h of ceftriaxone treatment as shown in panel a. The y axis in these histograms indicates the percentage of the maximum cell count (% Max), and the color lines indicate the ceftriaxone concentrations (μg/ml) used. Dotted lines labeled with “L” (low), “M” (moderate), or “H” (high) indicate the positions of the major peaks, which shift rightward as the ceftriaxone concentration increases. (d) Fluorescence images of cells after 2 h of ceftriaxone treatment as shown in panel a.
The distribution of GFP intensities appeared to be fixed at several values, which further confirms the discontinuity of CTX-M-14 hydrolase gene expression. When the antibiotic concentration varied from 2 to 128 µg/ml, fluorescence peaked at 4,580 AU. When the antibiotic concentration reached a higher level, 256 µg/ml and above, several peaks appeared, with a major one at 13,473 AU (Fig. 3c). This observation suggests the existence of complex subpopulations, where their CTX-M-14 hydrolase gene expression is heterogeneous and their proportions adapt to antibiotic dosages.
In addition, our microscopic observation confirms that cellular fluorescence intensity increases with ceftriaxone concentrations and cells grow in a filament-like way in response to higher concentrations (Fig. 3d). However, flow cytometry can detect only the total fluorescent intensity of the bacterial particles, which are often elongated to be severalfold longer than the untreated cells. Although forward scatter (FSC) reflects particle size in flow cytometry, it is not exactly proportional to particle size, and we cannot normalize fluorescence to a single cell unit by simply dividing by the FSC value.
Increased CTX-M-14 hydrolase expression does not provide cells with a selective advantage but is associated with a reduced growth rate.
According to the exclusion rule (12), heteroresistance can be a result of heterogeneous expression of antibiotic hydrolase genes and provides a heterogeneous selective advantage; when treated with antibiotics, the cells with higher resistance are selected and form resistant colonies in inhibitory halos. To test this rule at the single-cell level, we fabricated a PDMS (polydimethylsiloxane) microfluidic device that allows tracing a single bacterial cell and recording cellular activity under different antibiotic stresses. Fluorescence (GFP) intensity can be recorded at each site of the tiled cells instead of the total value of the entire particle in flow cytometry. We started the experiment with R4 culture in exponential phase; 50 randomly selected cells at each ceftriaxone concentration were monitored for 2 h to observe their colony formation, GFP intensity, and growth rate.
We found that almost all cells, even dim cells—expressing CTX-M-14 at a lower level—had excellent viability and displayed heterogeneity in growth rate and GFP intensity at various antibiotic concentrations below 2,048 µg/ml. We did, however, observe cell death at an extreme ceftriaxone concentration, 8,196 µg/ml, when some cells died as determined by fluorescence fade-out or sudden burst after cell wall bulging. Surprisingly, at any antibiotic concentration, brighter cells (higher GFP/CTX-M-14 expression) did not show a significantly higher survival rate than dim ones (Fig. 4a). Although brighter cells often grow slower, and slow-growing cells are statistically more resistant to antibiotics (Fig. 4b), as previously reported (20), we did not observe a direct relationship between cellular GFP intensity and the survival rate: even the brightest cells often faded out, a sign of death. We further constructed a mock plasmid without the CTX-M-14 ORF, but the GFP ORF remained downstream of the CTX-M-14 gene promoter. Due to the loss of the resistance gene, the sensitive strain (named S4) could sustain only ceftriaxone concentrations lower than 128 ng/ml, when cells death became apparent. As expected, the S4 cell survival rate at a ceftriaxone concentration of 128 ng/ml showed no relationship with GFP intensity but negatively correlated with the growth rate (Fig. 4c and d).
FIG 4 .

Survival rates of resistant (R4) and control sensitive (S4) strains at bactericidal ceftriaxone concentrations. (a) Correlation of death rates of R4 cells with their initial GFP intensities after 2 h of ceftriaxone treatment at the minimal bactericidal concentration (8,192 µg/ml). Cells were binned according to their initial GFP intensities. (b) Correlation of death rates of R4 cells with their initial growth rates after the same treatment as for panel a; cells were binned according to their initial growth rates. (c and d) Graphs corresponding to panels a and b for S4 treated at its minimal bactericidal concentration of ceftriaxone (128 ng/ml). Death count (black squares) and survival rate (blue squares) were plotted together.
When cells were treated with a series of ascending ceftriaxone dosages which the R4 strain can sustain, the mean and variance of the GFP intensity of the cell population both increased (Fig. 5a), which is in line with our observations in the flow cytometry experiment. Another major effect of antibiotic treatment was a gradual reduction of the growth rate (Fig. 5a). This observation is in accordance with the growth curves of the bulk cultures subjected to the same series of antibiotic treatments. We have now identified a unique process in R4 when it responds to antibiotic stress. First, the majority of the cells are fast growing, expressing a low level of GFP, i.e., a low-expression phenotype. Second, when subjected to different dosages of ceftriaxone, a subset of cells switch their original phenotype to high expression and slow growing, while others maintain their original low-expression and fast-growth phenotype. Third, the percentage of phenotype-switching cells increases with an elevated antibiotic dosage (Fig. 5b).
FIG 5 .

Single-cell observation of phenotype transition under antibiotic stress. (a) Box charts showing average GFP intensities and growth rates of the R4 strain at the end of 2-h treatment in four escalating ceftriaxone concentrations. For each antibiotic dosage, 50 cells were randomly selected and observed. (b) The distribution of cellular GFP intensity versus the growth rate (frequency in color scale) of R4 cells after the same antibiotic treatment as shown in panel a. (c and d) Corresponding graphs for the S4 strain. (e) Dynamics of growth rate (GR) and GFP intensity (I) of two daughter cells that have departed from a single mother cell. The daughter cell C1 shows an exponentially increasing GFP intensity and reduced growth rate, whereas the daughter cell C2 exhibits a relatively lower GFP intensity but a higher growth rate. (f) Scheme of growth-centric feedback loops that control the expression of hydrolase in a stringent way.
We also noticed a phenotype switch happening during the split of a mother cell into two daughter cells (C1 and C2; Fig. 5e); one (C1) of the daughter cells retained its original growth rate, with a relatively slow accumulation of cellular GFP, while C2 acquired another trend: high expression and slow growth. There seems to be a control on total activity of cellular growth and hydrolase expression.
Let us reexamine the concept of heteroresistance, which originated with colony-based assays (Etest and PAP). In fact, colony formation is not an indicator of individual living cells inoculated on the agar plate, but colony-forming potential depends on differences between the growth rate and the death rate in a probabilistic manner. According to our results at the single cell level, antibiotic concentrations used in such assays do not select for cells with “resistant” phenotypes but lead to a general effect of increased CTX-M-14 expression and decreased growth rate through phenotype switching toward heterogeneity. The gradual reduction of the growth rate decreases the possibility of colony formation and leads to a decreased colony count as the antibiotic dosage increases. Therefore, a clear picture emerges as we take the growth rate into account. On agar plates with antibiotic, some cells switch to the high-expression and slow-growing phenotype and hydrolyze antibiotic in its surrounding space, creating favorable conditions for their fast-growing progenies (although the progenies may have the low-expression phonotype) to form colonies. Since it is not a survival game but a growth game where a clonal population is living through antibiotic stress, we hypothesize that a population-based growth strategy is intrinsic to bacterial species through phenotype diversification and cooperation among progenies, and thus the subpopulations sacrifice some of their energy and other resources, such as replication, to CTX-M-14 gene expression, achieving maximal population survival and propagation.
Phenotypic heterogeneity of clonal populations has been found to be a common phenomenon for a long time (21–23). Heterogeneity is deemed to offer progenies with different selective advantages in case of unpredictable environmental stresses, such as the persister phenotype under extreme antibiotic stress (24, 25). The population has to hedge its bet on different phenotypes and hope that at least one of the phenotypes may survive when the others perish. However, in a harsh environment, it may not be easy for a strain to develop a single phenotype that bears all the characteristics needed to survive that stress; an effective alternative strategy is of essence for the population to allocate different tasks to heterogeneous subpopulations, each with its own capacity/phenotype based on collaborative strategies and opportunity gains among the subpopulations. In our study, we identified two opposite phenotypes, high expression and slow growth being one and low expression and fast growth the other; neither secured life independently, but corporately the whole population managed to obtain its maximal biomass under stresses that are often variable and certainly unpredictable.
Adaptation to variable antibiotic dosages is achieved by stringent control of growth-centric feedback loops.
Since CTX-M-14 expressed by the R4 strain is encoded by a well-studied ESBL gene, whose expression is not antibiotic inducible, one question remains to be addressed: how cell populations control CTX-M-14 gene expression, adapt to different antibiotic dosages, and thus display heteroresistance. If there is a regulator controlling hydrolase gene expression, it must be a common cellular factor in all cells, since all hydrolase-possessing clinical isolates we have tested so far exhibited heteroresistance. Therefore, we ascribe to the growth rate the role of such a regulator, since it has been recognized as a global negative regulator of gene expression (26). When a cell dedicates itself to division and growth, generally speaking, gene expression other than cell reproduction is always repressed. On the contrary, when a cell stops dividing, transcription and translation become active and gene products accumulate. Meanwhile, extensive expression of nonessential genes can also suppress growth due to an overconsumption of cellular energy and resources. Our results support the idea of cross-inhibition between growth and CTX-M-14 expression, i.e., all fast-growing cells express smaller amounts of CTX-M-14 (borne as a nonessential gene by the cells), whereas all high-expression cells are slow growing. There is a third subpopulation, where its cells are neither fast growing nor high expression (Fig. 5b). The reason behind this remains unclear; one of the possibilities is competitive genes that are highly expressed in the cells exerting resistance to antibiotic stress through mechanisms other than CTX-M-14. In addition, cells in the clonal populations vary their plasmid copy numbers not only from cell to cell but also from time to time. The growth rate dependence of expression is particularly pronounced for genes on a plasmid, which replicates independently of the chromosome and accumulates in high copy number in nondividing cells, leading to a collective gene dosage effect on expression. In fact, altering gene dosage is one of the major mechanisms bacteria used to regulate gene expression (26). This is confirmed by our results, in which plasmid copy number in the HIG cells is higher than that in the LIG cells.
We are now able to put together negative feedback connecting three primary variables: antibiotic concentration, growth rate, and hydrolase expression (Fig. 5f). The net negative feedback circuit helps the system to reach a balance; i.e., for each antibiotic concentration, there should be an adaptive growth rate and level of hydrolase expression. To test the regulation effect of the feedback circuit on hydrolase gene expression and the growth rate, we compared the behavior of both the resistant (R4) and sensitive (S4) strains in their endurable ceftriaxone concentration ranges (0 to 64 ng/ml for S4, corresponding to 0 to 2,048 µg/ml for R4) and found that S4 cells did not show an obvious gradient in both growth rate and GFP intensity (Fig. 5c); in other words, cells did not switch to the high-expression and slow-growing phenotype (Fig. 5d) without the link of hydrolase expression.
Nested within the three-parameter circuit, growth rate and hydrolase expression form double-negative feedback (Fig. 5f). In systems biology, such double-negative feedback conveys effects similar to those of positive feedback that augments gene expression on little stimulation (27). In individual cells, expression of genes involved in positive feedback is triggered by intrinsic molecular noise and leads to bi-/multistable expression (28). In our case, such a circuit may represent a major contributor to the quantized GFP expression observed in flow cytometry. A recent report demonstrated similar effects of growth-centric positive feedback that leads to heterogeneity in resistance to other categories of antibiotics and resistance mechanisms (29). Since the growth rate is a critical parameter sensitive to the intensity of environmental stresses, growth-centric control of gene expression may be a general part of the bacterial response to environmental stresses. Under some conditions, such as in biofilm, cells are found to be heterogeneous in growth rate, resistance, and extracellular polymeric substance secretion (30), where growth control may play key roles as well in phenotypic heterogeneity and coordination of population-based strategies for adaptation and survival.
In our study, the growth-centric feedback model provides a basic explanation for the bacterial population’s response to environmental stresses. Through the adaptation circuit, the resistance gene product (CTX-M-14 in our case) is connected to the strength of environmental stresses and is accurately controlled without overconsuming cellular energy and other resources, thus helping the population as a whole to reach its maximal growth or better propagation.
Bacterial cellular and population heterogeneity under environmental stresses has been observed and is proposed to be a result of genetic circuitry (31, 32), expression noise (33, 34), and asymmetry division (35, 36). Our current view suggests the central role of growth control, which can be fine-tuned by several cellular mechanisms, including rRNA biosynthesis (37), plasmid copy number control (38), competitiveness in gene expression, and stringent control of cellular energy. Our study merely provides the simplest case of heteroresistance, where a single hydrolase gene is the only resistance mechanism. In the real world, however, clinical isolates may recruit multiple resistance genes or regulatory elements, such as those encoding outer membrane proteins or efflux pumps, which are essential genes of the host cells and are under stringent regulation as well (39). If a stronger positive feedback loop is present, expression of these resistant genes may remain constant under a wider range of antibiotic concentrations, even leading to on-and-off expression control (40). Thanks to the development of single-cell technology, such as cell-on-a-chip (23), single-molecule detection (41), and fluorescence time-lapse microscopy (42), real-time cell activity can now be traced precisely in both time and space, helping in deciphering the major controlling factors of gene expression and growth.
Our results provide a novel insight into mechanisms by which bacteria adapt to antibiotic stress and a path forward in understanding antibiotic resistance assay and treatment. First, cellular and population heterogeneity of bacterial pathogens may interfere with clinical assays for drug resistance and provides a compelling explanation for poor repeatability of MIC or resistance judgment in some cases. Second, pathogens with weak hydrolase gene expression may appear to be drug sensitive but exhibit strong resistance after antibiotic treatment that may occur rapidly and even lead to treatment failure. Application of resistance gene discovery techniques is of the essence to avoid false-negative results in clinical practice.
Conclusions.
In conclusion, our observations at single-cell resolution provide new insights into bacterial responses to antibiotic stress. Bacterial progenies exhibit typical heterogeneity in both growth rate and stress-related gene expression and deal with environmental stresses in a collaborative way instead of being selected. Control of the growth rate provides opportunities for the expression of stress-related genes and is capable of serving as a critical regulator of these genes. Meanwhile, the growth rate provides a primary response to environmental stresses and thus makes gene expression adaptive to stresses through stringent control of the growth-centric feedback loops. These feedback loops provide a deeper understanding of how bacteria govern heterogeneous phenotypes as an intrinsic strategy to reach maximal population growth under variable environmental stresses. Therefore, we should always keep in mind that growth-controlled cellular and population heterogeneity may interfere with identification of resistant bacterial pathogens and antibiotic treatment in clinical practice.
MATERIALS AND METHODS
Clinical isolates, Etest, and PAP.
All clinical isolates were collected in a multicenter epidemiological study for bacterial resistance in China from 2006 to 2008. Etests (strips provided by bioMérieux) were used according to the CLSI (Clinical and Laboratory Standards Institute) protocol and manufacturer’s instructions with Mueller-Hinton agar plates (BD Difco, USA). The population analysis profile (PAP) assay was performed as previously described (43). Briefly, a colony from an overnight plate of each strain was inoculated and cultured in fresh LB broth for 5 h, and then 10−1, 10−2, 10−4, 10−5, and 10−6 dilutions were prepared in saline. An equal volume (100 µl) of each diluted culture was spread onto LB plates with ceftriaxone or imipenem concentrations of a double-diluted range of 0 to 1,024 µg/ml. Colonies were counted after 48 h of culture, and the log10 CFU/ml value was plotted against the antibiotic concentration. Ceftriaxone was purchased from Roche (People’s Republic of China).
Plasmid construction.
The plasmid pUA66 (kindly provided by Uri Alon from the Weizmann Institute of Science in Israel) is constructed based on low-copy-number pSC101 and bears GFP-mut2 with a strong ribosome binding site as a reporter to measure the rate of transcription initiation (16). The blaCTX-M-14 genes and upstream sequences in eight clinical isolates were completely sequenced. They are 100% identical to that of the CTX-M-14 gene and its upstream sequence (GenBank accession no. EU418916). The 276-bp upstream sequence of the CTX-M-14 ORF was PCR amplified and inserted into BamHI of pUA66 as the promoter for GFP expression. The sequence of both the promoter and CTX-M-14 ORF was PCR amplified and inserted into the BglII site. Then, the plasmid was introduced into DH5α competent cells (Invitrogen, Inc.), a common host cell for subclones derived from E. coli MG1655, and then cultured in LB medium.
FCM and cell sorting.
All flow cytometry (FCM) experiments were performed using a Becton-Dickinson FACSCalibur instrument (with excitation and emission light at 488 nm and 525 ± 12.5 nm, respectively, at a voltage of 650 V for GFP fluorescence). Wild-type DH5α was used as a GFP-negative control. About 105 to 106 cells (events) within a forward and side light scatter gate were assayed for the distribution of GFP expression. FITC gates were used to sort cells with high or low GFP intensity. The sorted cells were collected in fresh LB medium for further analysis or culture. Original data were analyzed using the software program Flowjo (TreeStar, Inc.).
Copy number determination of plasmid and CTX-M-14 transcript.
DNA and RNA of the sorted cells were isolated using a commercial extraction kit (Qiagen bacteria; DNA minikit for DNA isolation and Ambion PureLink RNA minikit for RNA isolation). The relative copy number of the plasmid in each sample was determined by comparing the threshold cycle (CT) value of the CTX-M-14 gene to that of the chromosomal gene gapA using quantitative real-time PCR. All amplifications were performed on an RT-Cycler amplifier (Capitalbio, China) with SYBR green (SYBR Premix Ex and TaqTM II; Takara). The relative mRNA of CTX-M-14 was determined using real-time PCR after being reverse transcribed to cDNA (PrimeScript RT reagent kit; Takara). Primers were as follows: for CTX-M-14, F, 5′ GGC TCA AAG GCA ATA CGA 3′; R, 5′ TTA TCA CCC ACA GTC CAC GA 3′; for gapA, F, 5′ ACT TCG ACA AAT ATG CTG GC 3′; R, 5′ CGG GAT GAT GTT CTG GGA A 3′.
Microfluidic chip and time-lapse microscopy.
A polydimethylsiloxane (PDMS) microfluidic cell-on-a-chip was fabricated with standard soft lithography, basically according to a previous design (44). Briefly, parallel thin rectangle culture chambers were used for observation of single-cell resolution. The chambers inside were supported by a pillar matrix and kept at a height of 1.5 µm to constrain expanding E. coli colonies in monolayers. A feeding channel with a fast flow of fresh LB exchanged nutrition and wastes with the culture chambers by diffusion and controlled ceftriaxone concentrations as well. About 107 cells in exponential phase were resuspended in 50 µl fresh LB and introduced into the culture chambers. Images were obtained every 5 min at points of interests by using a Nikon Ti time-lapse microscopy instrument equipped with a PFS (perfect focus system) focus-maintaining unit and a charge-coupled-device (CCD) camera. The temperature of the device is controlled at 37 ± 1°C. We processed time course images using the ImageJ software program and recorded the fluorescence intensity (AU) and cell length (μm). Because the cells displayed a filamentous shape instead of dividing when treated with ceftriaxone, the doubling time could not be used to describe the growth rate in our study. We therefore defined the growth rate for each time point as dL/(dt ⋅ L), which means the elongation rate of each length unit (where d is differential and L is length of cell).
ACKNOWLEDGMENTS
This study was supported by grants from the Ministry of Science and Technology of the People’s Republic of China (National High-Tech R&D program, 2006AA02Z4A9 and 2012BAI05B02; National 11th & 12th 5-Years Plan major scientific and technological program, 2009ZX10004-201 and 2012ZX10004-206) and the Ministry of Health of the People’s Republic of China (Special Fund for Health-Scientific Research in the Public Interest Program, 201202011).
The funders had no role in study design, data collection and analysis, decision to publish, or preparation of the manuscript.
Xiaorong Wang had full access to all of the data in the study and takes responsibility for the integrity of the data and the accuracy of the data analysis.
Authors made the following contributions: study concept and design, Y.K., J.Y., and Z.G.; acquisition of data, X.W., C.L., T.Z., X.J., L.L., S.A., and J.C.; analysis and interpretation of data, Y.K., X.W., J.Y., and Z.G.; drafting of the manuscript, Y.K., J.Y., X.W., and Z.G.; critical revision of the manuscript for important intellectual content, J.Y., L.R., Q.W., and J.K.B.; statistical analysis, Y.K. and X.W.; obtaining funding, Z.G.; administrative, technical, or material support, Y.K., T.Z., R.F., and N.J.; supervision, Z.G.
Footnotes
Citation Wang X, Kang Y, Luo C, Zhao T, Liu L, Jiang X, Fu R, An S, Chen J, Jiang N, Ren L, Wang Q, Baillie JK, Gao Z, Yu J. 2014. Heteroresistance at the single-cell level: adapting to antibiotic stress through a population-based strategy and growth-controlled interphenotypic coordination. mBio 5(1):e00942-13. doi:10.1128/mBio.00942-13.
REFERENCES
- 1. Fernández Cuenca F, del Carmen Gomez Sanchez C, Caballero-Moyano FJ, Vila J, Martínez-Martínez L, Bou G, Baño JR, Pascual A. 2012. Prevalence and analysis of microbiological factors associated with phenotypic heterogeneous resistance to carbapenems in Acinetobacter baumannii. Int. J. Antimicrob. Agents 39:472–477. 10.1016/j.ijantimicag.2012.01.015 [DOI] [PubMed] [Google Scholar]
- 2. Hung KH, Wang MC, Huang AH, Yan JJ, Wu JJ. 2012. Heteroresistance to cephalosporins and penicillins in Acinetobacter baumannii. J. Clin. Microbiol. 50:721–726. 10.1128/JCM.05085-11 [DOI] [PMC free article] [PubMed] [Google Scholar]
- 3. Tato M, Morosini M, García L, Albertí S, Coque MT, Cantón R. 2010. Carbapenem heteroresistance in VIM-1-producing Klebsiella pneumoniae isolates belonging to the same clone: consequences for routine susceptibility testing. J. Clin. Microbiol. 48:4089–4093. 10.1128/JCM.01130-10 [DOI] [PMC free article] [PubMed] [Google Scholar]
- 4. Lo-Ten-Foe JR, de Smet AM, Diederen BM, Kluytmans JA, van Keulen PH. 2007. Comparative evaluation of the VITEK 2, disk diffusion, Etest, broth microdilution, and agar dilution susceptibility testing methods for colistin in clinical isolates, including heteroresistant Enterobacter cloacae and Acinetobacter baumannii strains. Antimicrob. Agents Chemother. 51:3726–3730. 10.1128/AAC.01406-06 [DOI] [PMC free article] [PubMed] [Google Scholar]
- 5. Nunes AP, Teixeira LM, Iorio NL, Bastos CC, de Sousa Fonseca L, Souto-Padrón T, dos Santos KR. 2006. Heterogeneous resistance to vancomycin in Staphylococcus epidermidis, Staphylococcus haemolyticus and Staphylococcus warneri clinical strains: characterisation of glycopeptide susceptibility profiles and cell wall thickening. Int. J. Antimicrob. Agents 27:307–315. 10.1016/j.ijantimicag.2005.11.013 [DOI] [PubMed] [Google Scholar]
- 6. Rinder H, Mieskes KT, Löscher T. 2001. Heteroresistance in mycobacterium tuberculosis. Int. J. Tuberc. Lung Dis. 5:339–345 [PubMed] [Google Scholar]
- 7. Morand B, Mühlemann K. 2007. Heteroresistance to penicillin in Streptococcus pneumoniae. Proc. Natl. Acad. Sci. U. S. A. 104:14098–14103. 10.1073/pnas.0702377104 [DOI] [PMC free article] [PubMed] [Google Scholar]
- 8. Moore MR, Perdreau-Remington F, Chambers HF. 2003. Vancomycin treatment failure associated with heterogeneous vancomycin-intermediate Staphylococcus aureus in a patient with endocarditis and in the rabbit model of endocarditis. Antimicrob. Agents Chemother. 47:1262–1266. 10.1128/AAC.47.4.1262-1266.2003 [DOI] [PMC free article] [PubMed] [Google Scholar]
- 9. Wong SS, Ho PL, Woo PC, Yuen KY. 1999. Bacteremia caused by staphylococci with inducible vancomycin heteroresistance. Clin. Infect. Dis. 29:760–767. 10.1086/520429 [DOI] [PubMed] [Google Scholar]
- 10. Drlica K, Zhao X. 2007. Mutant selection window hypothesis updated. Clin. Infect. Dis. 44:681–688. 10.1086/511642 [DOI] [PubMed] [Google Scholar]
- 11. Acar M, Mettetal JT, van Oudenaarden A. 2008. Stochastic switching as a survival strategy in fluctuating environments. Nat. Genet. 40:471–475. 10.1038/ng.110 [DOI] [PubMed] [Google Scholar]
- 12. Libby E, Rainey PB. 2011. Exclusion rules, bottlenecks and the evolution of stochastic phenotype switching. Proc. Biol. Sci. 278:3574–3583. 10.1098/rspb.2011.0146 [DOI] [PMC free article] [PubMed] [Google Scholar]
- 13. Holmes NE, Johnson PD, Howden BP. 2012. Relationship between vancomycin-resistant Staphylococcus aureus, vancomycin-intermediate S. aureus, high vancomycin MIC, and outcome in serious S. aureus infections. J. Clin. Microbiol. 50:2548–2552. 10.1128/JCM.00775-12 [DOI] [PMC free article] [PubMed] [Google Scholar]
- 14. Hofmann-Thiel S, van Ingen J, Feldmann K, Turaev L, Uzakova GT, Murmusaeva G, van Soolingen D, Hoffmann H. 2009. Mechanisms of heteroresistance to isoniazid and rifampin of Mycobacterium tuberculosis in Tashkent, Uzbekistan. Eur. Respir. J. 33:368–374. 10.1183/09031936.00089808 [DOI] [PubMed] [Google Scholar]
- 15. Ryffel C, Strässle A, Kayser FH, Berger-Bächi B. 1994. Mechanisms of heteroresistance in methicillin-resistant Staphylococcus aureus. Antimicrob. Agents Chemother. 38:724–728. 10.1128/AAC.38.4.724 [DOI] [PMC free article] [PubMed] [Google Scholar]
- 16. Zaslaver A, Bren A, Ronen M, Itzkovitz S, Kikoin I, Shavit S, Liebermeister W, Surette MG, Alon U. 2006. A comprehensive library of fluorescent transcriptional reporters for Escherichia coli. Nat. Methods 3:623–628. 10.1038/nmeth895 [DOI] [PubMed] [Google Scholar]
- 17. Bush K, Fisher JF. 2011. Epidemiological expansion, structural studies, and clinical challenges of new beta-lactamases from gram-negative bacteria. Annu. Rev. Microbiol. 65:455–478. 10.1146/annurev-micro-090110-102911 [DOI] [PubMed] [Google Scholar]
- 18. Morrissey I, Hackel M, Badal R, Bouchillon S, Hawser S, Biedenbach D. 2013. A review of ten years of the Study for Monitoring Antimicrobial Resistance Trends (SMART) from 2002 to 2011. Pharmaceuticals 6:1335–1346. 10.3390/ph6111335 [DOI] [PMC free article] [PubMed] [Google Scholar]
- 19. Wang XR, Chen JC, Kang Y, Jiang N, An SC, Gao ZC. 2012. Prevalence and characterization of plasmid-mediated blaESBL with their genetic environment in Escherichia coli and Klebsiella pneumoniae in patients with pneumonia. Chin. Med. J. (Engl.) 125:894–900 [PubMed] [Google Scholar]
- 20. Eng RH, Padberg FT, Smith SM, Tan EN, Cherubin CE. 1991. Bactericidal effects of antibiotics on slowly growing and nongrowing bacteria. Antimicrob. Agents Chemother. 35:1824–1828. 10.1128/AAC.35.9.1824 [DOI] [PMC free article] [PubMed] [Google Scholar]
- 21. Levy SF, Ziv N, Siegal ML. 2012. Bet hedging in yeast by heterogeneous, age-correlated expression of a stress protectant. PLoS Biol. 10:e1001325. 10.1371/journal.pbio.1001325 [DOI] [PMC free article] [PubMed] [Google Scholar]
- 22. Kaern M, Elston TC, Blake WJ, Collins JJ. 2005. Stochasticity in gene expression: from theories to phenotypes. Nat. Rev. Genet. 6:451–464. 10.1038/nrg1615 [DOI] [PubMed] [Google Scholar]
- 23. Lidstrom ME, Konopka MC. 2010. The role of physiological heterogeneity in microbial population behavior. Nat. Chem. Biol. 6:705–712. 10.1038/nchembio.436 [DOI] [PubMed] [Google Scholar]
- 24. Lewis K. 2010. Persister cells. Annu. Rev. Microbiol. 64:357–372. 10.1146/annurev.micro.112408.134306 [DOI] [PubMed] [Google Scholar]
- 25. Kussell E, Leibler S. 2005. Phenotypic diversity, population growth, and information in fluctuating environments. Science 309:2075–2078. 10.1126/science.1114383 [DOI] [PubMed] [Google Scholar]
- 26. Klumpp S, Zhang Z, Hwa T. 2009. Growth rate-dependent global effects on gene expression in bacteria. Cell 139:1366–1375. 10.1016/j.cell.2009.12.001 [DOI] [PMC free article] [PubMed] [Google Scholar]
- 27. Ferrell JE., Jr. 2002. Self-perpetuating states in signal transduction: positive feedback, double-negative feedback and bistability. Curr. Opin. Cell Biol. 14:140–148. 10.1016/S0955-0674(02)00314-9 [DOI] [PubMed] [Google Scholar]
- 28. Balázsi G, van Oudenaarden A, Collins JJ. 2011. Cellular decision making and biological noise: from microbes to mammals. Cell 144:910–925. 10.1016/j.cell.2011.01.030 [DOI] [PMC free article] [PubMed] [Google Scholar]
- 29. Deris JB, Kim M, Zhang Z, Okano H, Hermsen R, Groisman A, Hwa T. 2013. The innate growth bistability and fitness landscapes of antibiotic-resistant bacteria. Science 342:1237435. 10.1126/science.1237435 [DOI] [PMC free article] [PubMed] [Google Scholar]
- 30. Chai Y, Chu F, Kolter R, Losick R. 2008. Bistability and biofilm formation in Bacillus subtilis. Mol. Microbiol. 67:254–263. 10.1111/j.1365-2958.2007.06040.x [DOI] [PMC free article] [PubMed] [Google Scholar]
- 31. Pedraza JM, van Oudenaarden A. 2005. Noise propagation in gene networks. Science 307:1965–1969. 10.1126/science.1109090 [DOI] [PubMed] [Google Scholar]
- 32. Choi PJ, Cai L, Frieda K, Xie XS. 2008. A stochastic single-molecule event triggers phenotype switching of a bacterial cell. Science 322:442–446. 10.1126/science.1161427 [DOI] [PMC free article] [PubMed] [Google Scholar]
- 33. Becskei A, Kaufmann BB, van Oudenaarden A. 2005. Contributions of low molecule number and chromosomal positioning to stochastic gene expression. Nat. Genet. 37:937–944. 10.1038/ng1616 [DOI] [PubMed] [Google Scholar]
- 34. Rajala T, Häkkinen A, Healy S, Yli-Harja O, Ribeiro AS. 2010. Effects of transcriptional pausing on gene expression dynamics. PLoS Comput. Biol. 6:e1000704. 10.1371/journal.pcbi.1000704 [DOI] [PMC free article] [PubMed] [Google Scholar]
- 35. Aldridge BB, Fernandez-Suarez M, Heller D, Ambravaneswaran V, Irimia D, Toner M, Fortune SM. 2012. Asymmetry and aging of mycobacterial cells lead to variable growth and antibiotic susceptibility. Science 335:100–104. 10.1126/science.1216166 [DOI] [PMC free article] [PubMed] [Google Scholar]
- 36. Wang X, Lesterlin C, Reyes-Lamothe R, Ball G, Sherratt DJ. 2011. Replication and segregation of an Escherichia coli chromosome with two replication origins. Proc. Natl. Acad. Sci. U. S. A. 108:E243–E250. 10.1073/pnas.1100874108 [DOI] [PMC free article] [PubMed] [Google Scholar]
- 37. Jin DJ, Cagliero C, Zhou YN. 2012. Growth rate regulation in Escherichia coli. FEMS Microbiol. Rev. 36:269–287. 10.1111/j.1574-6976.2011.00279.x [DOI] [PMC free article] [PubMed] [Google Scholar]
- 38. Ohkubo S, Yamaguchi K. 1995. Two enhancer elements for DNA replication of pSC101, par and a palindromic binding sequence of the Rep protein. J. Bacteriol. 177:558–565 [DOI] [PMC free article] [PubMed] [Google Scholar]
- 39. Masi M, Pagès JM. 2013. Structure, function and regulation of outer membrane proteins involved in drug transport in Enterobactericeae [sic]: the OmpF/C-TolC case. Open Microbiol. J. 7:22–33. 10.2174/1874285801307010022 [DOI] [PMC free article] [PubMed] [Google Scholar]
- 40. Ozbudak EM, Thattai M, Lim HN, Shraiman BI, Van Oudenaarden A. 2004. Multistability in the lactose utilization network of Escherichia coli. Nature 427:737–740. 10.1038/nature02298 [DOI] [PubMed] [Google Scholar]
- 41. Müller DJ, Helenius J, Alsteens D, Dufrêne YF. 2009. Force probing surfaces of living cells to molecular resolution. Nat. Chem. Biol. 5:383–390. 10.1038/nchembio.181 [DOI] [PubMed] [Google Scholar]
- 42. Muzzey D, van Oudenaarden A. 2009. Quantitative time-lapse fluorescence microscopy in single cells. Annu. Rev. Cell Dev. Biol. 25:301–327. 10.1146/annurev.cellbio.042308.113408 [DOI] [PMC free article] [PubMed] [Google Scholar]
- 43. Georgios M. 2012. Heteroresistance, p 163-180. In Sudhakar DC, Infection control—updates. InTech, Shanghai, China: http://www.intechopen.com/books/infection-controlupdates/heteroresistance [Google Scholar]
- 44. Tian Y, Luo C, Lu Y, Tang C, Ouyang Q. 2012. Cell cycle synchronization by nutrient modulation. Integr. Biol. (Camb.) 4:328–334. 10.1039/c2ib00083k [DOI] [PMC free article] [PubMed] [Google Scholar]