


Abstract
DNA methylation is an important defense and regulatory mechanism. In mammals, most DNA methylation occurs at CpG sites, and asymmetric non-CpG methylation has only been detected at appreciable levels in a few cell types. We are the first to systematically study the strand-specific distribution of non-CpG methylation. With the divide-and-compare strategy, we show that CHG and CHH methylation are not intrinsically different in human embryonic stem cells (ESCs) and induced pluripotent stem cells (iPSCs). We also find that non-CpG methylation is skewed between the two strands in introns, especially at intron boundaries and in highly expressed genes. Controlling for the proximal sequences of non-CpG sites, we show that the skew of non-CpG methylation in introns is mainly guided by sequence skew. By studying subgroups of transposable elements, we also found that non-CpG methylation is distributed in a strand-specific manner in both short interspersed nuclear elements (SINE) and long interspersed nuclear elements (LINE), but not in long terminal repeats (LTR). Finally, we show that on the antisense strand of Alus, a non-CpG site just downstream of the A-box is highly methylated. Together, the divide-and-compare strategy leads us to identify regions with strand-specific distributions of non-CpG methylation in humans.
INTRODUCTION
DNA methylation is a stable epigenetic mark that is important for gene expression regulation, transposon silencing, imprinting, X chromosome inactivation and other diverse biological processes (1–4). Several techniques have been developed to profile DNA methylomes (5). Using genomic sequencing after bisulfite treatment, such as MethylC-seq (6,7), methylated cytosines can be detected at base pair resolution in a strand-specific manner. Currently, human methylomes generated by whole-genome bisulfite sequencing are available for multiple cell types (8–14).
Mammalian DNA methylation occurs predominantly at CpG dinucleotides. By contrast, DNA methylation in plants is found frequently in both CpG and non-CpG (CHG and CHH, where H is A, C or T) contexts (15,16). Recent studies have revealed substantial non-CpG methylation in a few mammalian cell types, including ESC (8,9,17–19), iPSC (13,18), oocyte (20,21) and brain cells (22,23). A comparative study among different human ESC lines showed that the highly methylated non-CpG sites were conserved at TACAG motif (17).
In Arabidopsis, CHG and CHH methylations are maintained by CMT3 and DRM2, respectively (24). In mammals, knockdown studies have shown that non-CpGs may be methylated by DNMT3a/3b (25), but the details of the establishment, maintenance and biological function of non-CpG methylation are still unclear (3,26). We compared the surrounding DNA motifs of CHG and CHH methylation patterns in human and showed that they were highly correlated in sequence context, indicating that the two methylation patterns are not intrinsically different as is found in Arabidopsis.
CpG sites are thought to be symmetrically methylated on the two strands (9). In contrast, whether asymmetric non-CpG sites can be strand-specifically methylated has not been systematically studied. Lister et al. (8) have shown that non-CpG sites on the antisense strand of a coding gene body appeared to be more highly methylated than those on the sense strand. To gain more detailed insights, we decomposed the genome bodies into different functional regions. We found the strand-specific non-CpG methylation in introns but not in exons. Specifically, intron boundaries showed more significant skew of non-CpG methylation than interior introns. We also show that highly transcribed genes tend to have higher skew scores. Using our sequence-decomposing method, we show that the methylation-prone pattern ACA is more enriched on the antisense strand of introns, indicating that the skewed non-CpG methylation is mainly guided by skewed sequences. Further, we examine strand-specific non-CpG methylation in different groups of transposons. We found that both short interspersed nuclear elements (SINEs) and long interspersed nuclear elements (LINEs) have strand-specific non-CpG methylation. Using our sequence-decomposing method, we show that the strand specificity of both LINE and mammalian interspersed repetitive (MIR) elements can be explained by the skew of ACA sequences. We also find that the TACAG site on the antisense strand of Alu, which is right after the A-box of Alu elements, contributes the most to the skew of non-CpG methylation.
MATERIALS AND METHODS
Divide-and-compare strategy
When investigating any property of a data set, we are interested whether the overall property is only represented by partial elements, or whether different subgroups have different properties. Here we proposed a ‘divide-and-compare’ strategy to evaluate whether a division is useful or redundant when evaluating certain properties of a data set. The ‘divide-and-compare’ strategy comprises two steps: the ‘divide’ step and ‘compare’ step. In the ‘divide’ step, the full data set is divided into several subgroups according to user-defined criteria. Then the properties of different subgroups are compared in the ‘compare’ step. If the subgroups have similar properties, the division is redundant for understanding the property. In contrast, if the subgroups have different properties, the division is useful to gain a clearer understanding of the properties of the subgroups (Figure 1A).
Figure 1.
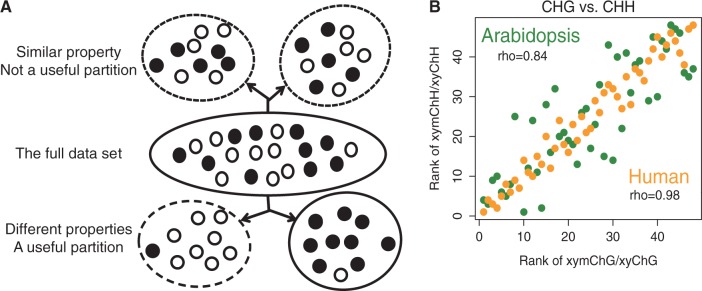
The ‘divide-and-compare’ strategy shows CHG and CHH methylations in human have no essential difference. (A) Schema of the ‘divide-and-compare’ strategy, (B) Spearman’s ranks correlation analysis between CHG and CHH methylation pairs shows the two non-CpG methylation patterns are not essentially different in human as in Arabidopsis. The corresponding pairs are xyChG and xyChH (x, y can be A, C, G or T; H indicates A, C and T are considered collectively). The x- and y-axes show methylation level ranks (1–48, from high to low) of xyChGs and xyChHs in the CHG list and CHH list, respectively. The rhos are calculated by Spearman’s ranks correlation test.
Sequence-decomposing strategy for studying correlations between DNA methylation and sequences
The sequence-decomposing strategy is a specific case of the divide-and-compare strategy. We define the average methylation level as follows:
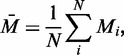 |
where  is the methylation level for ith site measured across
  sites.
When decomposing sites into different words (k-mers), we have
where  , the contribution of the word
  to the average methylation level, is defined as follows:
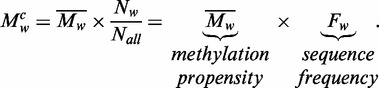 |
Using this decomposing analysis, we can separate the average methylation levels into two parts: the methylation propensity ( ) and the sequence frequency (
 ) for each specific word
  . The methylation propensity of a word
  is the average methylation level of the specific word. Different words have different methylation propensities.
Average methylation levels of each 3-mer pattern ( in the NCH context, where
  ) were calculated for both strands, denoted as
  and
and  , and the sequence frequencies are
  and
and  , respectively. As a result, the average methylation levels of non-CpG sites on one strand can be expressed as
 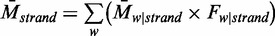 , where
  . The contribution of pattern
  to the average methylation level was defined as
 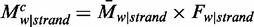 . For each pattern
  , the contribution to the difference of methylation levels between the two strands was defined as
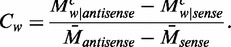
Sequence preference of CHG and CHH methylation
A comparison between CHG and CHH contexts was carried out on 5-mers. A corresponding pair in both CHG and CHH contexts was defined as (xyChG, xyChH), where x, y can be A, C, G or T, h can be A, C or T and H indicates that A, C and T were considered collectively. For example, the pairs would be (AACAG, AACAH), (AACCG, AACCH), (AACTG, AACTH) and so forth. Average methylation levels of the 48 xyChG patterns and 48 xyChH patterns were calculated and ranked from high to low. Then Spearman's rho and P-value were calculated based on the two lists.
Estimate of DNA methylation levels at single sites and gene regions
We selected two representative DNA methylomes in our study, H1 and ADS-iPSC. DNA methylomes of the two cell lines were downloaded from Lister et al. (13) (http://neomorph.salk.edu/ips_methylomes). The DNA methylome of Arabidopsis was obtained from Lister et al. (6). To estimate reliable methylation levels, we only used cytosines with coverage ≥10X. The methylation level of each cytosine was calculated as  . DNA methylation profiles at single-base resolution were calculated by averaging methylation ratios of cytosines with adequate coverage on the selected genes. RefSeq gene models (hg 18) are used as annotation for transcripts.
We examined three distinct regions of introns according to their distances to the splice sites: the 5′ splice site region (5′SS, 5∼125 bp downstream from the donor site), middle intron region (MI, 120 bp in the centre of introns) and the 3′ splice site region (3′SS, 5∼125 bp upstream from the acceptor site). The four bases at the 5′ and 3′ ends of introns were excluded because of strong sequence conservation. Introns shorter than 500 bp were excluded. Promoters were defined as ranging from 500 bp upstream to 100 bp downstream of the transcription starting sites.
For each transcript, methylation levels on both strands in each of the four regions (exon, 5′SS, MI, 3′SS) were calculated as the average methylation ratios of cytosines with adequate read coverage. Transcriptional levels predicted in reads per kilobase of exon model per million (RPKM) for H1 and ADS-iPSC were downloaded from the Web site (13) (http://neomorph.salk.edu/ips_methylomes). Average RPKM values for transcripts in both replicates were used for each cell type. Transcripts with missing data for any of the eight (2 strands × 4 regions) methylation levels and the corresponding RPKM values were discarded. Finally, for each context, we required every available transcript to have these eight values.
Biased DNA methylation analysis
We denoted the methylation levels on the two strands as  and
and  relative to the transcript direction, respectively. We defined the methylation skew score as
 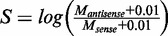 (the small number 0.01 was added to avoid dividing zero). Thus,
  indicates relatively higher methylation on the antisense strand than that on the sense strand and vice versa. Means and standard deviations (SD) were calculated for both strands, and P-values were calculated by two-sided t-tests. The null hypothesis was that the true mean of S is 0. The BIP (bias in percentage) of methylation levels between the two strands was defined as
 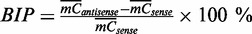 .
.
RESULTS
No distinction between CHG and CHH methylations in human cell lines
In Arabidopsis, CHG and CHH methylations have different sequence preferences (6). In humans, although some studies (8,13,22) have considered CHG and CHH methylations separately, it is not clear whether the two patterns are maintained by different enzymes as in Arabidopsis. To compare the sequence preferences of the two methylation patterns, we examined the average methylation levels of 48 5-mer pairs, xyChG and xyChH (x, y  {A,C,G,T} and h
  {A,T,G}) in both human and Arabidopsis (see Materials and Methods). Our results showed that the methylation level ranks of 5-mers of CHG and CHH contexts were highly correlated in human (rho = 0.98, Spearman’s correlation) compared with those in Arabidopsis (rho = 0.84) (Figure 1B). This suggests that in humans, CHG and CHH methylations have similar sequence preferences, and that they may not be methylated by different methyltransferases as in Arabidopsis. Decomposing the non-CpG sites into CHG and CHH groups and comparing the sequence preferences, we found that CHG and CHH methylation groups are not biologically useful partitions in human cells. Thus, in the following, we merged CHG and CHH contexts into a single CH context.
Strand-specific non-CpG methylation in subregions of gene bodies
As non-CpG methylation is asymmetric, it is of interest to study its strand-specific nature in humans. We examined the distribution of non-CpG methylation on both strands of genes in H1, and separated exons and introns. In introns, non-CpG sites are more highly methylated on the antisense strand than those on the sense strand (Supplementary Figure S1). The skew of non-CpG methylation was not observed in exons. As the skew of non-CpG methylation is more pronounced at intron boundaries, we selected three representative regions of introns for more detailed analyses, including 5′SS, MI and 3′SS (Figure 2a). To quantify the skew of non-CpG methylation, we defined the skew score  (zero indicates no skewness, positive values indicate higher methylation levels on the antisense strand and vice versa; see Materials and Methods). The distribution of skew scores also showed significant skew of non-CpG methylation in introns, especially pronounced at intron boundaries (Figure 2c and Supplementary Figure S1). In contrast, CpG sites did not show such skewed methylation in any region (Figure 2b and Supplementary Figure S1), which is consistent with previous findings. The phenomenon of skewed non-CpG methylation in introns was also observed in ADS-iPSC (Supplementary Figure S3).
Figure 2.

Strand-specific non-CpG methylation in human gene body. (a) Diagram of the four regions analyzed in this study. Three intronic subregions are examined: 5′SS (5∼125 bp downstream of donor site), MI (120-bp region in the center of the intron) and 3′SS (125∼5 bp upstream of acceptor site). (b) Density plots of the skew scores for CpG methylation in different regions. x-axis, skew score. For skew score, 0 indicates no skewness, positive value indicates higher mCpH in antisense strand and negative value indicates the opposite. All the three subregions in intron showed significant skew of non-CpG methylation. P-value, one-tailed t-test. (c) Density plots of the skew score for CpH methylation in different regions. Similar with (b), (d) the skew score of non-CpG methylation in introns are positively correlated with the transcription levels (H1). X-axis, rank of transcription levels from high (left) to low (right). Y-axis shows the skew score. The skew score of each site is the average of 1000 transcripts. (e) Asymmetric sequences in intron guide skewed non-CpG methylation (H1). Context study showed asymmetric sequence guided the skew of non-CpG methylation. Analysis is carried on 3-mer patterns (NCH) in 3′SS of H1. The average methylation levels (mP, upper) of each pattern showed similar methylation levels on both strands. Patterns are ordered by average methylation level. The proportions of these 3-mers in sequence composition (cP, middle) showed asymmetric distribution of sequence. The contributions to methylation levels in the whole (coP = mP × cP, lower) of each 3-mer pattern are shown in bars. The enrichment of non-CpG methylation motifs on the antisense strand makes the higher methylation levels of non-CpG.
Skewed non-CpG methylation in introns is correlated with both transcriptional levels and sequence skew
To understand how the skew of non-CpG methylations might be related with regulatory events, we further investigated the correlations between the transcriptional levels and the skew scores of non-CpG methylation in introns of both H1 and ADS-iPSC. We find that highly transcribed genes are more likely to have higher skew scores in non-CpG methylation (Figure 2d and Supplementary Figure S2). All three subregions of introns showed positive correlation between transcriptional levels and non-CpG methylation scores.
To investigate the difference of non-CpG methylations between the two strands, we used the sequence-decomposing strategy to determine whether 3-mers (NCH) of non-CpG contexts are skewed. Taking the 5′SS in H1 as an example, we calculated the average methylation levels and composition proportions for each word on both strands (Figure 2e). ACA was the most methylated 3-mer on both strands (8.2% on the sense strand, 8.6% on the antisense strand), showing much less methylation difference (4.8% in BIP, see Materials and Methods) than CpH (17.2% in BIP) in this region (Figure 2e, top panel). However, compared with the sequence proportions of all 3-mers, ACA had substantial differences between the strands (10.1% for the sense strand, 14.0% for the antisense strand; 40% in BIP; Figure 2e, middle panel). To evaluate how each pattern may contribute to the difference of methylation levels between the strands, we calculated the contribution of each pattern to the average methylation level on each strand ( ) and the contribution to the average methylation level difference between strands (
 ) (Figure 2e, bottom panel). We found that ACA contributed the most to the differences of the average methylation levels (
 =88.4%) between the strands. Although ACA had nearly the same average methylation levels on two strands, its strong difference in sequence frequencies contributes to the overall difference. Thus, the enrichment of the non-CpG methylation-prone sequence (ACA) in the antisense strand is responsible for the higher methylation level on the antisense strand. The biased non-CpG methylation levels on the two strands are largely guided by the biases in the DNA sequences.
Strand-specific non-CpG methylation in subgroups of transposable elements
About 45% of the human genome is composed of transposons, including three main groups, SINEs, LINEs and long terminal repeats (LTRs) (27). We examined strand-specific DNA methylation in these types of transposable elements. We did not find any group of transposable elements that had strand-specific CpG methylation (Figure 3a). In contrast, both SINEs and LINEs have skewed non-CpG methylation but LTRs not (Figure 3b). In SINEs, the antisense strand is more methylated than the sense strand, and the opposite is true in LINEs.
Figure 3.

Characterize the strand-specific non-CpG methylation in transposons. (a) The strand-specific methylation levels of CpG sites in different transposon groups in ADS-iPSC. Alu elements and MIR elements are two subgroups of SINE elements. Heights of bars and error bars are the means and standard deviations of the average methylation levels in each chromosome. All groups show concordant CpG methylation levels on two strands; (b) the strand-specific methylation levels of CpH sites in different transposon groups in ADS-iPSC. Asterisk indicates P < 0.01. P-value, two-tailed t-test, (c) the methylation propensity (average methylation level) of each 3-mer on two strands of Alu. Error bar, standard deviation of the average methylation levels in each chromosome, (d) the sequence frequencies of each 3-mer on the two strands of Alu elements, (e) the methylation propensity (average methylation level) of each 3-mer on two strands of LINEs, (f) the sequence frequencies of each 3-mer on the two strands of LINEs, (g) the 25 bp position from 5′ end of Alu (antisense strand) shows high non-CpG methylation levels. From the structure of Alu, the high methylated non-CpG position is right after A-box, which is known as binding site of Pol-III together with B-box. The highly methylated non-CpG site is in TACAG context.
We examined how the strand-specific non-CpG methylations in SINEs and LINEs are guided by sequences with our sequence-decomposing strategy. By comparing the methylation levels of 3-mers (NCH) on two strands of SINEs and LINEs, we found that none of the 3-mers showed strand-specific methylation levels in LINEs (Figure 3e), which is similar to the result we found in introns (Figure 2e). However, we found that the methylation-prone pattern ACA is more enriched on the sense strand of LINEs (Figure 3f). In SINEs, the ACA pattern is highly methylated on both sense and antisense strands (Figure 3c). Thus the strand-specific non-CpG methylation could not be explained by the distributions of 3-mers (ACA).
The contrasting methylation levels of ACA on the two strands of SINEs prompted us to examine their methylation patterns. We determined the sequence preference logos for the highly methylated non-CpG sites on the two strands of SINEs. Interestingly, our results showed that for non-CpG methylation, CA is the dominant pattern on the sense strand (Supplementary Figure S4c and d), and the enriched pattern on antisense strand is a conserved sequence of Alu elements (Supplementary Figure S4a,b and e).
There are two main families of SINEs, MIR elements and Alu elements. Alu elements are primate-specific repeats. The conserved sequence of Alu elements motivated us to study strand-specific non-CpG methylation in Alu elements and MIR elements separately. Although both Alu and MIR elements showed higher non-CpG methylation levels on antisense strands than those on sense strands (Figure 3b), the 3-mers patterns showed that the skew of non-CpG methylation on MIR elements could be explained by the enrichment of ACAs on the antisense strand (Supplementary Figure S3). The previous observation of contrasting methylation levels of ACA on two strands of SINEs is mainly due to the contrasting methylation levels of ACA on two strands of Alu (Figure 3c). We further analyzed the conserved sequence of highly methylated non-CpG sites (Supplementary Figure S4) and found that a non-CpG site located 25 bp from the 5′ end on the antisense strand of Alu element is highly methylated (Figure 3g). This site is within a TACAG context and right after the A-box of the Alu, indicating the possible relationship with the binding of RNA polymerase III.
DISCUSSION
We conducted the first comprehensive study of strand-specific non-CpG methylation in human pluripotent cells. The distribution of DNA methylation can be affected by many factors such as protein binding (28), sequence (22), methyltransferase activities (18) among others. Our results showed that CpG methylation is always symmetrically methylated, whereas non-CpG sites are strand-specifically methylated in introns, SINE elements and LINE elements. Even though hydroxymethylcytosine (hmC) could not be distinguished from methylcytosine by the current bisulfite conversion method (29), Yu et al. (30) showed that hmC is unlikely to occur in non-CpG sites; thus, we do not expect hmC to influence our main conclusions. We also showed that the skew of non-CpG methylation in intron is more pronounced at the boundaries and more significant for highly expressed genes. With the divide-and-compare strategy applied to 3-mers (NCH), we determined that the skewed non-CpG methylations in introns, MIR and LINE elements are guided by the unequally enriched ACA sequences on the two strands. Currently, little is known about the biological function of the strand-specific non-CpG methylation.
Nucleotide asymmetry (including AT-skew and GC-skew) is known to be prevalent in both prokaryotes and eukaryotes (31). The core non-CpG methylation pattern ACA enriched on the antisense strand in human introns (Figure 2e) corresponds to the AT-skew phenomenon (32,33). In eukaryotes, AT-skew is thought to be coupled with gene transcription (34) and splicing (33). As the bias is stronger at the extremities of introns than their interior, Zhang et al. (32) attributed such DNA strand asymmetry to the selection pressure on splicing enhancers or silencers. This study suggests that there is a potential epigenetic pressure on the asymmetric sequence as well, especially in introns.
That the skewed non-CpG methylation in introns is correlated with skewed sequences and transcriptional levels could be the result of their coevolution, and these retained characters may be biologically favorable. Non-CpG methylation is known to be enriched in germ cells (20) and ES cells (8), and it is possible that mutations in these cell lines are increased as a result of non-CpG methylation. That the skew of sequences and non-CpG methylation are conserved and correlated could be the result of reciprocal benefit. Because the non-CpG methylation is associated with Dnmt3a/Dnmt3b and Dnmt3L, and is independent of Dnmt1, the lack of non-CpG methylation in somatic cells may be partly caused by much lower levels of Dnmt3L compared with ESCs (25). The sequence preferences and strand-specific distribution of non-CpG methylation in ESCs and iPSCs could be dependent on the properties of Dnmt3L. Also, a recent study showed that the GC-skew in promoters leads to the formation of R-loops that protected the region from being methylated (35), providing evidence that asymmetric sequences could influence the regulation of DNA methylation.
Finally, we found that the 25th site on the antisense strand of Alus from the 5′ end is within a non-CpG context and prone to be methylated, and the position is right after the A-box of Alu elements. As the A-box and B-box of Alus are promoters of RNA polymerase III for the transcription of Alus (27), the methylation of the 25th site potentially affects the transcription of Alu elements. As non-CpG methylation is found to be specifically enriched in embryonic cell lines and oocytes, which are germ line cell types, the high methylation levels of the 25th sites of Alus could be responsible for the silencing of the activities of Alu elements.
SUPPLEMENTARY DATA
Supplementary Data are available at NAR Online.
FUNDING
National Basic Research Program of China [2012CB316503]; NSFC [91010016]; National Institutes of Health (NIH) [ES017166 to M.Q.Z.]. Funding for open access charge: National Basic Research Program of China [2013CB316503].
Conflict of interest statement. None declared.
Supplementary Material
ACKNOWLEDGEMENTS
The authors thank Juntao Gao for helps in editing the manuscript and discussions. They thank Monica Sleumer, Xiaowo Wang and other members of the Center for Synthetic and Systems Biology at Tsinghua University for helpful discussions. They thank Bing Ren and Wei Xie for discussion on some of the results. They also thank Davide Carnevali for help with the analysis of Alu elements.
REFERENCES
- 1.Bird A. DNA methylation patterns and epigenetic memory. Genes Dev. 2002;16:6–21. doi: 10.1101/gad.947102. [DOI] [PubMed] [Google Scholar]
- 2.Cedar H, Bergman Y. Programming of DNA methylation patterns. Annu. Rev. Biochem. 2012;81:97–117. doi: 10.1146/annurev-biochem-052610-091920. [DOI] [PubMed] [Google Scholar]
- 3.Jones PA. Functions of DNA methylation: islands, start sites, gene bodies and beyond. Nat. Rev. Genet. 2012;13:484–492. doi: 10.1038/nrg3230. [DOI] [PubMed] [Google Scholar]
- 4.Smallwood SA, Kelsey G. De novo DNA methylation: a germ cell perspective. Trends Genet. 2012;28:33–42. doi: 10.1016/j.tig.2011.09.004. [DOI] [PubMed] [Google Scholar]
- 5.Laird PW. Principles and challenges of genomewide DNA methylation analysis. Nat. Rev. Genet. 2010;11:191–203. doi: 10.1038/nrg2732. [DOI] [PubMed] [Google Scholar]
- 6.Lister R, O'Malley RC, Tonti-Filippini J, Gregory BD, Berry CC, Millar AH, Ecker JR. Highly integrated single-base resolution maps of the epigenome in Arabidopsis. Cell. 2008;133:523–536. doi: 10.1016/j.cell.2008.03.029. [DOI] [PMC free article] [PubMed] [Google Scholar]
- 7.Cokus SJ, Feng S, Zhang X, Chen Z, Merriman B, Haudenschild CD, Pradhan S, Nelson SF, Pellegrini M, Jacobsen SE. Shotgun bisulphite sequencing of the arabidopsis genome reveals DNA methylation patterning. Nature. 2008;452:215–219. doi: 10.1038/nature06745. [DOI] [PMC free article] [PubMed] [Google Scholar]
- 8.Lister R, Pelizzola M, Dowen RH, Hawkins RD, Hon G, Tonti-Filippini J, Nery JR, Lee L, Ye Z, Ngo QM, et al. Human DNA methylomes at base resolution show widespread epigenomic differences. Nature. 2009;462:315–322. doi: 10.1038/nature08514. [DOI] [PMC free article] [PubMed] [Google Scholar]
- 9.Laurent L, Wong E, Li G, Huynh T, Tsirigos A, Ong CT, Low HM, Kin Sung KW, Rigoutsos I, Loring J, et al. Dynamic changes in the human methylome during differentiation. Genome Res. 2010;20:320–331. doi: 10.1101/gr.101907.109. [DOI] [PMC free article] [PubMed] [Google Scholar]
- 10.Chodavarapu RK, Feng S, Bernatavichute YV, Chen PY, Stroud H, Yu Y, Hetzel JA, Kuo F, Kim J, Cokus SJ, et al. Relationship between nucleosome positioning and DNA methylation. Nature. 2010;466:388–392. doi: 10.1038/nature09147. [DOI] [PMC free article] [PubMed] [Google Scholar]
- 11.Molaro A, Hodges E, Fang F, Song Q, McCombie WR, Hannon GJ, Smith AD. Sperm methylation profiles reveal features of epigenetic inheritance and evolution in primates. Cell. 2011;146:1029–1041. doi: 10.1016/j.cell.2011.08.016. [DOI] [PMC free article] [PubMed] [Google Scholar]
- 12.Hodges E, Molaro A, Dos Santos CO, Thekkat P, Song Q, Uren PJ, Park J, Butler J, Rafii S, McCombie WR, et al. Directional DNA methylation changes and complex intermediate states accompany lineage specificity in the adult hematopoietic compartment. Mol. Cell. 2011;44:17–28. doi: 10.1016/j.molcel.2011.08.026. [DOI] [PMC free article] [PubMed] [Google Scholar]
- 13.Lister R, Pelizzola M, Kida YS, Hawkins RD, Nery JR, Hon G, Antosiewicz-Bourget J, O'Malley R, Castanon R, Klugman S, et al. Hotspots of aberrant epigenomic reprogramming in human induced pluripotent stem cells. Nature. 2011;471:68–73. doi: 10.1038/nature09798. [DOI] [PMC free article] [PubMed] [Google Scholar]
- 14.Ziller MJ, Gu H, Muller F, Donaghey J, Tsai LT, Kohlbacher O, De Jager PL, Rosen ED, Bennett DA, Bernstein BE, et al. Charting a dynamic DNA methylation landscape of the human genome. Nature. 2013;500:477–481. doi: 10.1038/nature12433. [DOI] [PMC free article] [PubMed] [Google Scholar]
- 15.Zemach A, McDaniel IE, Silva P, Zilberman D. Genome-wide evolutionary analysis of eukaryotic DNA methylation. Science. 2010;328:916–919. doi: 10.1126/science.1186366. [DOI] [PubMed] [Google Scholar]
- 16.Feng S, Cokus SJ, Zhang X, Chen PY, Bostick M, Goll MG, Hetzel J, Jain J, Strauss SH, Halpern ME, et al. Conservation and divergence of methylation patterning in plants and animals. Proc. Natl Acad. Sci. USA. 2010;107:8689–8694. doi: 10.1073/pnas.1002720107. [DOI] [PMC free article] [PubMed] [Google Scholar]
- 17.Chen PY, Feng S, Joo JW, Jacobsen SE, Pellegrini M. A comparative analysis of DNA methylation across human embryonic stem cell lines. Genome Biol. 2011;12:R62. doi: 10.1186/gb-2011-12-7-r62. [DOI] [PMC free article] [PubMed] [Google Scholar]
- 18.Ziller MJ, Muller F, Liao J, Zhang Y, Gu H, Bock C, Boyle P, Epstein CB, Bernstein BE, Lengauer T, et al. Genomic distribution and inter-sample variation of non-CpG methylation across human cell types. PLoS Genet. 2011;7:e1002389. doi: 10.1371/journal.pgen.1002389. [DOI] [PMC free article] [PubMed] [Google Scholar]
- 19.Ramsahoye BH, Biniszkiewicz D, Lyko F, Clark V, Bird AP, Jaenisch R. Non-CpG methylation is prevalent in embryonic stem cells and may be mediated by DNA methyltransferase 3a. Proc. Natl Acad. Sci. USA. 2000;97:5237–5242. doi: 10.1073/pnas.97.10.5237. [DOI] [PMC free article] [PubMed] [Google Scholar]
- 20.Tomizawa S, Kobayashi H, Watanabe T, Andrews S, Hata K, Kelsey G, Sasaki H. Dynamic stage-specific changes in imprinted differentially methylated regions during early mammalian development and prevalence of non-CpG methylation in oocytes. Development. 2011;138:811–820. doi: 10.1242/dev.061416. [DOI] [PMC free article] [PubMed] [Google Scholar]
- 21.Kobayashi H, Sakurai T, Imai M, Takahashi N, Fukuda A, Yayoi O, Sato S, Nakabayashi K, Hata K, Sotomaru Y, et al. Contribution of intragenic DNA methylation in mouse gametic DNA methylomes to establish oocyte-specific heritable marks. PLoS Genet. 2012;8:e1002440. doi: 10.1371/journal.pgen.1002440. [DOI] [PMC free article] [PubMed] [Google Scholar]
- 22.Xie W, Barr CL, Kim A, Yue F, Lee AY, Eubanks J, Dempster EL, Ren B. Base-resolution analyses of sequence and parent-of-origin dependent DNA methylation in the mouse genome. Cell. 2012;148:816–831. doi: 10.1016/j.cell.2011.12.035. [DOI] [PMC free article] [PubMed] [Google Scholar]
- 23.Lister R, Mukamel EA, Nery JR, Urich M, Puddifoot CA, Johnson ND, Lucero J, Huang Y, Dwork AJ, Schultz MD, et al. Global epigenomic reconfiguration during mammalian brain development. Science. 2013;341:1237905. doi: 10.1126/science.1237905. [DOI] [PMC free article] [PubMed] [Google Scholar]
- 24.Law JA, Jacobsen SE. Establishing, maintaining and modifying DNA methylation patterns in plants and animals. Nat. Rev. Genet. 2010;11:204–220. doi: 10.1038/nrg2719. [DOI] [PMC free article] [PubMed] [Google Scholar]
- 25.Arand J, Spieler D, Karius T, Branco MR, Meilinger D, Meissner A, Jenuwein T, Xu G, Leonhardt H, Wolf V, et al. In Vivo control of CpG and Non-CpG DNA methylation by DNA methyltransferases. PLoS Genet. 2012;8:e1002750. doi: 10.1371/journal.pgen.1002750. [DOI] [PMC free article] [PubMed] [Google Scholar]
- 26.Dyachenko OV, Schevchuk TV, Kretzner L, Buryanov YI, Smith SS. Human non-CG methylation: are human stem cells plant-like? Epigenetics. 2010;5:569–572. doi: 10.4161/epi.5.7.12702. [DOI] [PMC free article] [PubMed] [Google Scholar]
- 27.Sela N, Kim E, Ast G. The role of transposable elements in the evolution of non-mammalian vertebrates and invertebrates. Genome Biol. 2010;11:R59. doi: 10.1186/gb-2010-11-6-r59. [DOI] [PMC free article] [PubMed] [Google Scholar]
- 28.Stadler MB, Murr R, Burger L, Ivanek R, Lienert F, Scholer A, van Nimwegen E, Wirbelauer C, Oakeley EJ, Gaidatzis D, et al. DNA-binding factors shape the mouse methylome at distal regulatory regions. Nature. 2011;480:490–495. doi: 10.1038/nature10716. [DOI] [PubMed] [Google Scholar]
- 29.Nestor C, Ruzov A, Meehan R, Dunican D. Enzymatic approaches and bisulfite sequencing cannot distinguish between 5-methylcytosine and 5-hydroxymethylcytosine in DNA. Biotechniques. 2010;48:317–319. doi: 10.2144/000113403. [DOI] [PubMed] [Google Scholar]
- 30.Yu M, Hon GC, Szulwach KE, Song CX, Zhang L, Kim A, Li X, Dai Q, Shen Y, Park B, et al. Base-resolution analysis of 5-hydroxymethylcytosine in the mammalian genome. Cell. 2012;149:1368–1380. doi: 10.1016/j.cell.2012.04.027. [DOI] [PMC free article] [PubMed] [Google Scholar]
- 31.Green P, Ewing B, Miller W, Thomas PJ, Green ED. Transcription-associated mutational asymmetry in mammalian evolution. Nat. Genet. 2003;33:514–517. doi: 10.1038/ng1103. [DOI] [PubMed] [Google Scholar]
- 32.Zhang C, Li WH, Krainer AR, Zhang MQ. RNA landscape of evolution for optimal exon and intron discrimination. Proc. Natl Acad. Sci. USA. 2008;105:5797–5802. doi: 10.1073/pnas.0801692105. [DOI] [PMC free article] [PubMed] [Google Scholar]
- 33.Touchon M, Arneodo A, d'Aubenton-Carafa Y, Thermes C. Transcription-coupled and splicing-coupled strand asymmetries in eukaryotic genomes. Nucleic Acids Res. 2004;32:4969–4978. doi: 10.1093/nar/gkh823. [DOI] [PMC free article] [PubMed] [Google Scholar]
- 34.Touchon M, Nicolay S, Arneodo A, d'Aubenton-Carafa Y, Thermes C. Transcription-coupled TA and GC strand asymmetries in the human genome. FEBS Lett. 2003;555:579–582. doi: 10.1016/s0014-5793(03)01306-1. [DOI] [PubMed] [Google Scholar]
- 35.Ginno PA, Lott PL, Christensen HC, Korf I, Chedin F. R-loop formation is a distinctive characteristic of unmethylated human CpG island promoters. Mol. Cell. 2012;45:814–825. doi: 10.1016/j.molcel.2012.01.017. [DOI] [PMC free article] [PubMed] [Google Scholar]
Associated Data
This section collects any data citations, data availability statements, or supplementary materials included in this article.