Abstract
Mesoderm specific transcript (Mest), an imprinted gene associated with fat mass expansion under conditions of positive energy balance, shows highly variable expression (~80-fold) in white adipose tissue (WAT) of C57BL/6J (B6) mice fed an obesogenic diet. Since B6 mice are essentially genetically invariant and Mest is known to be regulated by CpG methylation within its immediate proximal promoter, the large variability in its expression in adipose tissue has the hallmarks of being controlled via an epigenetic mechanism. In this study, bisulfite sequencing and allelic discrimination analyses were performed to determine whether variations in CpG methylation within the Mest promoter were associated with its expression. Results showed no relationship between CpG methylation in the Mest promoter and high versus low expression in either WAT or isolated adipocytes; and, experiments using a single nucleotide polymorphism in the Mest promoter region between B6 and Castaneus mice showed the expected pattern for an imprinted gene with all maternal alleles being methylated. These data suggest that mechanisms independent of the CpG methylation status of the Mest promoter must underlie the control of its expression during adipose tissue expansion.
Keywords: imprinting, methylation, epigenetics, genetics, obesity, adiposity
Introduction
Studies as early as the 1930’s with AxinFu, and more recently with agouti (Avy), have shown that variable expressivity of genes are not always linked to genetics 1-3. The Avy and AxinFu genes are regulated by CpG methylation within an intercisternal A particle that is associated with promoter function 4-6. Non-genetic variations of complex metabolic phenotypes such as obesity have also been described 7, 8. We have identified a number of genes expressed in adipose tissue that are associated with variations in the development of adiposity among individual mice within a genetically invariant mouse population; however, the gene with the most variable expression (~80-fold) was mesoderm specific transcript (Mest)8.
During development the paternal allele of Mest is unmethylated and the maternal allele is methylated within a CpG island encompassing the promoter region and part of exon 1 9, 10. Repression of Mest transcription by methylation of the immediate proximal promoter on the paternal allele has been shown to occur during embryonic metanephric development 11 and in studies with reporter constructs 12, 13. Although the biochemical function of Mest has not been elucidated, it has sequence and structural homology to α/β hydrolases, a family of proteins including lipases and acyltransferases that have a wide variety of catalytic activities 14, 15. MEST has been localized to the endoplasmic reticulum/Golgi apparatus where it may function to promote lipid accumulation under conditions of excess caloric intake 16.
Because of the high variability of adipose tissue Mest expression, its association with susceptibility for the development of diet-induced obesity in the absence of genetic variation and molecular evidence that the methylated state of regulatory elements in the promoter region control transcription, Mest is an ideal target gene to investigate epigenetic regulation of gene expression via methylation. In this study we focused our investigation on determining whether variations of CpG methylation within the immediate proximal Mest promoter are associated with its expression in adipose tissue of mice fed a high fat diet. Bisulfite sequencing analyses of DNA from adipose tissue or adipocytes from adipose tissue with low and high Mest expression showed no evidence of an association between the degree (characteristics) of promoter methylation and Mest gene expression. Additionally, Mest shows the normal allelic methylation pattern for an imprinted gene in both the adipocyte and SV fractions of adipose tissue. Thus, the 80-fold range of Mest expression among individual mice must be determined by a transcriptional mechanism that over-rides the gene dosage effects that would result from a simple loss-of-imprinting.
Methods
Animals
C57BL/6J (B6) and Castaneus (CAST) mice were bred at the Pennington Biomedical Research Center from stocks that originated from The Jackson Laboratory (Bar Harbor, ME, USA). Animal rooms were maintained at 22-24°C with a 12 hour light/dark cycle. Breeders housed in plastic pens with corncob bedding were fed a breeder diet (LabDiet 5015; PMI, St Louis, MO, USA) ad libitum. After weaning, mice were fed a standard low fat chow diet (LabDiet 5053; PMI) ad libitum until 8 weeks of age. At 7 weeks of age mice were singly housed and at 8 weeks of age mice were fed ad libitum a high saturated fat diet (D12331; Research Diets, New Brunswick, NJ, USA) for periods of time ranging from 1 to 4 weeks. Hybrid (CAST X B6)F1 and (B6 X CAST)F1 mice were fed a high saturated fat diet (D12331) for 2 weeks prior to sacrifice and isolation of adipocyte and SV cell fractions for analyses. All protocols have been approved by the Pennington Biomedical Research Center’s Institutional Animal Care and Use Committee.
Tissue fractionation
Inguinal or epididymal adipose tissue was minced and digested with collagenase class I (2 mg/ml; Worthington Biochemical Corp., Freehold, NJ, USA) in prewarmed 37°C HBSS in a shaking water bath for 1 hour at 37°C. The tissue homogenate was filtered through a 100 μm cell strainer (Becton Dickinson Labware, NJ, USA) and the cells isolated by centrifugation at 360 x g for 10 minutes. The pellet containing the stromal-vascular (SV) cells and the upper part (floating) mature adipocytes (AD) were separated and washed 1X with HBSS (5ml) followed by centrifugation at 360x g for 10 min. Supernatants were removed and DNA was isolated from the purified SV and AD cells.
Phenotyping and sample preparation
RNA was isolated from adipose tissue using TRI-Reagent (Molecular Research Center Inc. Cincinnati, OH, USA) with modifications to remove DNA as described by Koza et al 8. Quantitative RT-PCR using TaqMan probes and primers (Applied Biosystems, Foster City, CA, USA) for murine Mest and cyclophilin B (Ppib) was performed as previously described 8. Briefly, purified RNA diluted to 5 ng/ul in RNase-free H20 and pooled adipose tissue RNA that was serially diluted for use as a standard curve and quality control were loaded as 3 ul aliquots onto a 384-well optical assay plate. Following the addition of 7 ul of an assay mix containing ABI One-Step RT-PCR Master Mix Reagents (Applied Biosystems, Foster City, CA) and gene-specific primers and probe quantitative gene expression was analyzed using an ABI 7900HT Sequence Detection System. Analyses of gene expression were performed as single assays and gene expression was normalized to cyclophilin b (Ppib). Probes and primers were used at a concentration of 0.775 uM and 0.2 uM respectively for all reactions. Probe and primer sequences were as follows: Mest: probe, 5′-FAM-CCG CGG TCC ACA GTG TCG ATT CT-BHQ-3′; forward primer, 5′-GAT CCT ATA AAT CCG TAT CCA GAG TTT T-3′; reverse primer, 5′-GGG TAG TGG CTA ATG TGG TCA TC-3′; and for cyclophilin b: probe, 5′-FAM-ATC CTT CAG TGG CTT GTC CCG GCT-BHQ-3′; forward primer, 5′-GGT GGA GAG CAC CAA GAC AGA-3′; reverse primer, 5′-GCC GGA GTC GAC AAT GAT G-3′. DNA for bisulfite sequencing analyses was isolated from adipose tissue, or the AD and SV fractions of adipose tissue by digesting tissue or cells overnight at 55°C in digestion buffer (50 mM Tris pH 8, 100 mM EDTA, 100 mM NaCl and 1% SDS) containing 40 ug/ml proteinase K. DNA was extracted by mixing an equal volume of phenol/chloroform/isoamyl alcohol (25:24:1; Amresco, Solon, CA USA) to the digested tissue/cells and centrifuging in a microfuge at 4°C for 20 min at 20,000 x g to separate the aqueous from the organic phases. The aqueous phase was extracted with an equal volume of chloroform/isoamyl alcohol (24:1; Amresco) and re-isolated from the organic phase after centrifugation as above. DNA was precipitated from the aqueous phase with addition of 2V 100% EtOH, pelleted by centrifugation, washed 1X with 600 ul 70% EtOH, and air dried for 15 min. The DNA pellet was re-solubilized in 300 ul 0.1X Tris-EDTA (TE) buffer (pH 8.0) and re-extracted with phenol/chloroform/isoamyl alcohol (25:24:1) and chloroform/isoamyl alcohol (24:1) as described above. Prior to precipitation of DNA, 50 ul of 3M sodium acetate (pH 5.2) was added to the re-extracted aqueous fraction and the volume was adjusted to 0.5 ml. DNA was precipitated and washed as previously described and the dried DNA pellet was dissolved in 10-20 ul 0.1X TE. DNA concentration and purity was determined using a NanoDrop Analyzer (NanoDrop Technologies, Wilmington, DE, USA).
Bisulfite Sequencing
Bisulfite sequencing was performed essentially as described by Olek et al 17 with some modifications. Purified DNA was denatured at 50°C in the presence of 0.3M NaOH followed by addition of hot low melting temperature agarose. DNA-agarose beads were produced by adding 5 ul aliquots of this mixture into cold mineral oil. The beads were incubated at 50°C for 4 hours in presence of 2.5M sodium metabisulfite/125 mM hydroquinone, washed 4 times (15 min each) with 1 ml 0.5X TE, desulphonated by washing 2X (15 min each) with 0.5 ml 0.2M NaOH, and washed 3X (15 min each) with 1 ml 0.5X TE followed by 2X (15 min each) with dH2O. Primers designed in regions containing no CpGs were be used for the PCR amplification reaction. The primers for each of the 3 genomic regions are as follows: Region I; forward, 5′-GGTAT TTTTA GTGTT AGTTG GGTGG T-3′; reverse, 5′-CCTTA AAAAT CATCT TTCAC ACCTT-3′: Region II; forward, 5′-GAGAT TTATA AGGAA AGAGG GGGTA G-3′; reverse, 5′-ACAAC AAAAA CAACA AACAA CAACT-3′: Region III; forward, 5′-GAGTT GTTGT TTGTT TTTGT TG-3′; reverse, 5′-CAACC TTTAA ATAAA AATTT TTACC TCC-3′. To encompass a SNP polymorphism located +366 bp downstream from the TSS of Mest, an alternative reverse primer with the sequence 5′-CAC CAA ACA TTA CCA AAA TTC TC-3′ was used in the amplification reaction with the forward primer for genomic Region III. PCR amplicons were TA cloned into pCR4-TOPO as described by the manufacturer (Invitrogen Life Technologies, Carlsbad, CA) and individual clones sequenced to detect C/T conversions in non-methylated CpG dyads.
Results
Non-Genetic Variability of Adipose Tissue Mest expression in Mice
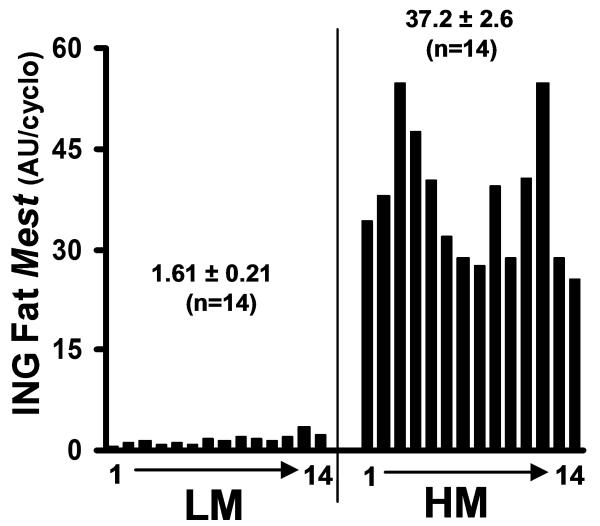
To determine whether differences in CpG methylation are associated with variations of Mest expression in adipose tissue, Mest was measured in RNA from inguinal fat of 112 male B6 mice after feeding a high fat diet for 4 weeks. From this cohort, 14 mice with the lowest (1.61 ± 0.21 AU/cyclo) and highest expression (37.2 ± 2.6 AU/cyclo) were selected for further analyses (Fig 1).
Figure 1.
This figure represents male C57BL/6J mice with the lowest (n=14) and highest (n=14) levels of inguinal (ING) fat Mest expression from a cohort of 112 mice fed a high fat diet for 4 weeks. Mest mRNA was normalized to cyclophilin B. DNA isolated from the ING fat of these mice was used for the bisulfite sequencing analyses experiments in Figure 3.
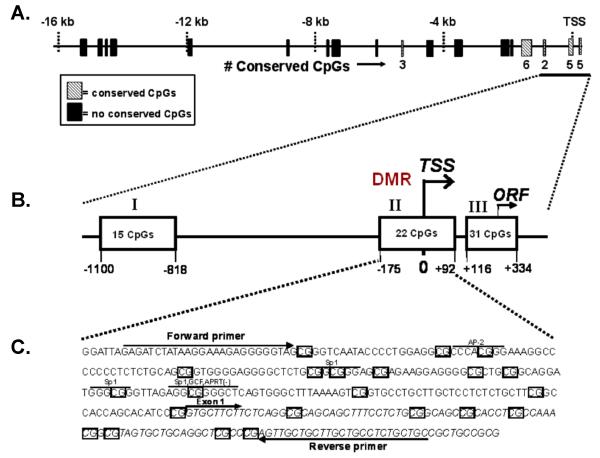
To aid in the identification of genomic regulatory sequences to be analyzed by bisulfite sequencing, conserved genomic regions were identified within ~16 kb of the promoter region of MEST from both mouse and human. This analysis detected at least 18 genomic regions having significant sequence homology with 5 of these regions, including those known to be in the differentially methylated region (DMR) of Mest, having conserved CpG motifs (Fig 2). Three genomic regions (I, −1100 to −818 bp; II, −175 to +92 bp; and III, +116 to +334 bp) within the DMR of the Mest promoter that encompass and are immediately upstream from the transcriptional start site (TSS) and the open reading frame were selected for bisulfite sequence analyses based on high conservation between the human and mouse sequences and density of CpG islands (Fig 2).
Figure 2.
A schematic illustrating: (A) Conserved DNA segments between human and mouse located in a 16 kb genomic region upstream from the transcriptional start site (TSS) of MEST. Hatched boxes indicate genomic regions with conserved CpGs between human and mouse whereas black boxes indicate genomic regions with no conserved CpGs. (B) Genomic regions (I, II and III) were selected for bisulfite sequencing analyses based upon sequence homology and conservation of CpGs between human and mouse. (C) Example of genomic sequence and primers used for bisulfite sequencing analyses of a genomic region encompassing the TSS. The 22 CpGs within this sequence, start of TSS and location of potential promoter binding sites are indicated.
DNA from intact adipose tissue shows no variation in Mest promoter methylation
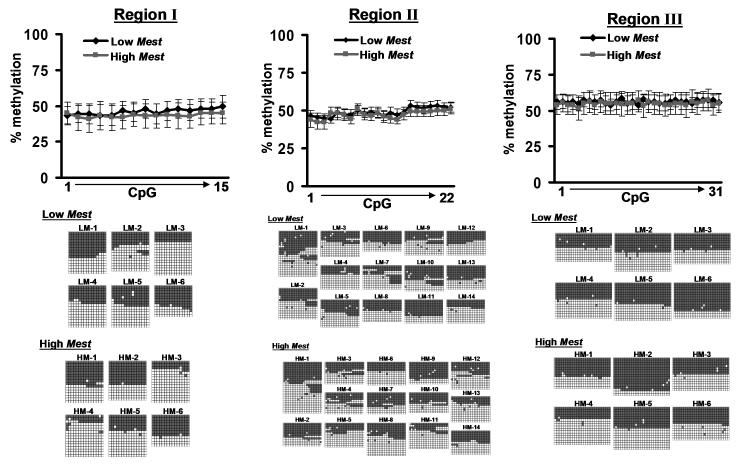
Oligonucleotide primers (see Methods) were designed to amplify Mest promoter regions I, II and III in bisulfite-treated inguinal fat DNA as shown in Figure 2. Bisulfite sequencing results in Figure 3 show the CpG methylation patterns across all 3 Mest promoter regions for each allele as well as the average among the DNA’s selected for the low (LM) and high (HM) Mest expression groups. The data for Mest promoter region II, which encompasses the TSS, contains the average of 14 mice that were selected for the LM and HM groups (Fig. 1) whereas promoter regions I and III used 6 animals per group. A minimum number of 11 clones were sequenced for each DNA. Results showed no association (P≥0.45) between methylation for any of the CpG dyads within the 3 genomic regions of the Mest promoter in DNA isolated from adipose tissue with Mest gene expression (Fig 3). Furthermore, approximately 50% of the alleles were methylated in all of the genomic regions resulting in a pattern consistent for an imprinted gene.
Figure 3.
Bisulfite sequencing analyses of DNA from inguinal fat with low and high Mest expression. DNA from inguinal fat of mice with low (LM) or high (HM) Mest expression corresponding to the data shown in Figure 1 were subjected to bisulfite conversion and sequencing analyses for genomic regions I, II and III (as shown in Figure 2B). DNA was analyzed from at least 6 animals with low and high Mest expression per group with at least 11 clones sequenced per animal. Line graphs show the temporal frequency of methylated CpGs (% methylation) for each genomic sequence. The figures below each line graph indicate the patterns of unmethylated (white squares) and methylated (gray squares) CpGs for each sequenced allele.
Mest promoter methylation patterns differ between adipocytes and SV cells
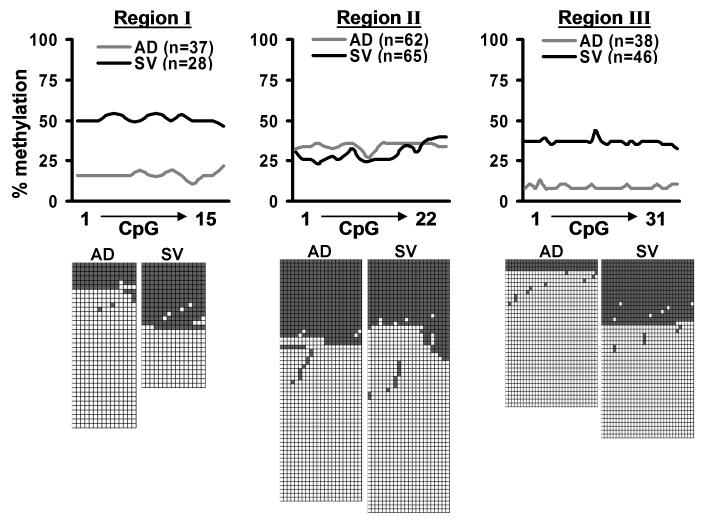
Since adipocytes have been estimated to account for less than 20% of the total number of cells within an adipose tissue depot in rodents 18-20; and, Mest is predominantly expressed in mature adipocytes 8, 21, CpG methylation profiles of the Mest promoter in adipose tissue fractions enriched with adipocytes or stromal-vascular (SV) cells were determined. Initial experiments comparing methylation profiles from pooled adipocyte and SV DNA from fractionated inguinal fat of 7-C57BL/6J male mice (Fig. 4) showed decreased methylation in the adipocyte fraction compared to the SV fraction for Mest promoter regions I (~17% vs ~51%) and III (~9% vs ~37%), but not for region II (~34% vs ~29%). An independent experiment using DNA isolated from adipocyte-enriched and SV fractions of inguinal fat from male A/J mice showed similar patterns of methylation (data not shown). Although the reasons for the enrichment in the number of unmethylated ‘paternal-like’ alleles for Mest promoter regions I and III in adipocytes compared with SV cells is unclear, one explanation is that loss of DNA methylation occurs in selected genomic regions of the Mest promoter within the maternal allele in adipocytes. The apparent under-representation of methylated alleles in Mest promoter regions I and III of adipocytes could indicate a mechanism associated with high variability in Mest expression. An experiment to test this by using purified adipocytes from adipose tissue with low and high Mest expression is described below.
Figure 4.
Comparison of CpG methylation patterns within the Mest promoter in DNA isolated from the adipocyte (AD) and stromal-vascular (SV) fractions of adipose tissue show enhancement of hypomethylated alleles in genomic regions I and III of adipocytes. Pooled inguinal fat from B6 mice fed a chow diet were sub-fractionated into fractions that were enriched for mature adipocytes and SV cells. The graphs show the temporal frequency of CpG methylation (% methylation) of genomic regions I, II and III for each cellular fraction. A minimum of 28 clones were sequenced and analyzed for each of the cellular fractions and the individual alleles showing unmethylated (white boxes) and methylated (gray boxes) CpGs within each genomic region are shown under the line graphs.
Mest expression in adipocytes is not associated with variations in promoter methylation
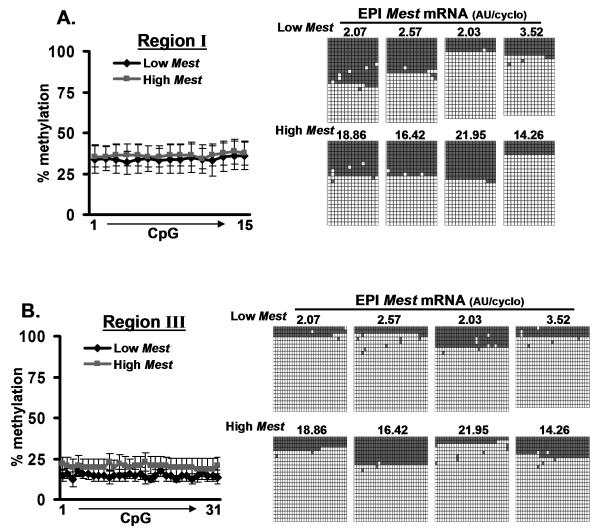
To investigate whether mature adipocytes derived from adipose tissue depots with low or high Mest expression show differences in CpG methylation in Mest promoter regions I and III, experiments were performed using mice fed dietary fat for 1 week since it has been previously shown that a broad range of Mest expression can be induced in adipose tissue of B6 mice in as little as 2 to 7 days 16. Bisulfite sequencing of DNA from adipocytes of epididymal fat from mice with low (n=4; 2.07 to 3.53 AU/cyclo) or high (n=4; 14.26 to 21.95 AU/cyclo) Mest expression selected from a cohort of 46 animals showed no differences in methylation in promoter regions I and III (Fig. 5). Interestingly, consistent with the data shown in Figure 4, adipocytes show a greater than expected number of unmethylated (65.8% and 82.4%) vs methylated alleles (34.2% and 17.6%) for genomic regions I and III of the Mest promoter respectively. It’s possible that the changes in allelic DNA methylation observed in adipocytes, especially in Mest promoter region III, could be associated with an ‘active’ state of the Mest promoter that is primed for transcriptional activation when given the proper stimulus. An alternative explanation could be that the under-representation of methylated alleles is a PCR-generated artifact caused by impurities in the DNA isolated from lipid-containing adipocytes. To test this, an experiment based on allelic discrimination was performed to determine whether the maternal alleles of Mest show evidence of being hypomethylated.
Figure 5.
Enhancement of hypomethylated alleles in adipocytes are not associated with Mest gene expression. Methylation patterns within genomic regions I and III of the Mest promoter were determined in DNA from epididymal (EPI) fat-derived adipocytes from mice with low (n=4) or high (n=4) EPI fat Mest gene expression selected from a cohort of 46 animals fed a high fat diet for 1 week. Line graphs show the temporal patterns of CpG methylation (% methylation) across the genomic regions. Figures on the right-hand side of the of the graphs show the level of Mest mRNA expression of the adipose tissue depot from where adipocytes were derived and the individual alleles sequenced for each DNA with gray squares indicating methylated CpGs and white squares indicating non-methylated CpGs. A minimum of 22 clones were sequenced for each DNA analyzed.
Allelic discrimination analyses indicates that the maternal allele of Mest is not hypomethylated in adipocytes
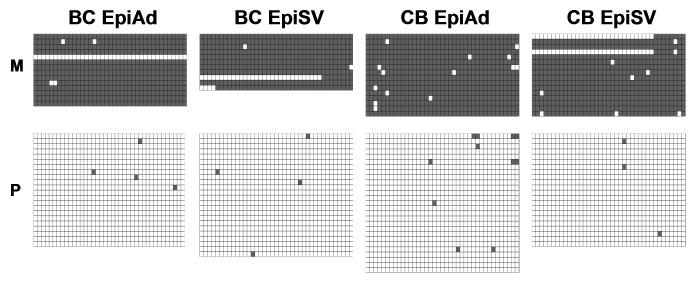
A single nucleotide polymorphism (SNP) with a C>A (effectively a T>A variation in bisulfite converted DNA) variation between B6 and CAST/EiJ (CAST) mice within genomic region III of the Mest promoter (located in position +366 relative to the TSS and within intron 1 of Mest) makes it possible to determine whether loss-of imprinting occurs within maternal alleles of adipocytes. To discriminate maternal from paternal alleles, bisulfite sequencing was performed on DNA from adipocyte and SV cell fractions of epididymal fat from dietary fat-fed male progeny from reciprocal crosses between B6 and CAST. Results comparing allelic lineage and methylation patterns of Mest promoter region III in DNA from adipocytes and SV cells from (B6 X CAST)F1 and (CAST X B6)F1 mice indicate that the maternally-derived allele of Mest was predominantly methylated and the paternally-derived allele was not (Fig. 6). These results suggest that the Mest promoter shows the expected representation of methylated and unmethylated alleles in adipocytes and variations in allelic methylation do not contribute to differences in Mest expression in adipose tissue. The apparent increase in the number of hypomethylated alleles in adipocytes observed in our studies appears to be an artifact caused by the enrichment of non-methylated alleles in the PCR amplification reaction of Mest promoter regions I and III. Although we did not measure Mest expression in adipose tissue from the hybrid progeny derived from B6 and CAST, all mouse strains we have examined including B6 and CAST show induced adipose tissue Mest to varying degrees (>2 to more than 10-fold) when fed an obesogenic diet (unpublished observations). Thus we would expect that the hybrid progeny from a cross between B6 and CAST to show a comparable response.
Figure 6.
Allelic discrimination analysis shows normal maternal and paternal allelic methylation patterns in adipocytes. Data shows methylation patterns of DNA from epididymal fat-derived adipocytes (EpiAd) and stromal-vascular cells (EpSV) from F1 progeny derived from crosses between B6 X Castaneus (BC) and Castaneus X B6 (CB) mice. A single nucleotide polymorphism in genomic region III of the Mest promoter was used to identify alleles as being maternally (M) or paternally (P) derived.
Discussion
The identification of gene targets associated with fat mass expansion in an obesogenic environment could lead to new pharmacological approaches for the treatment of obesity. Because genetically inbred male B6 mice show large variations in dietary fat-induced obesity when raised in seemingly identical conditions, it was anticipated that this would be an ideal model to identify genes and epigenetic determinants that predispose mice to becoming obese. We previously showed that phenotypic variability of fat mass expansion among genetically inbred B6 mice fed a high fat diet is positively associated with the expression of Mest in adipose tissue. A number of studies have shown that Mest, a maternally imprinted gene, can be regulated by methylation within its promoter region and; in some cases bi-allelic expression can occur due to loss of imprinting 22. Since Mest expression varies up to 80-fold among individuals within a genetically homogenous mouse population, even after a relatively short exposure to dietary fat, it seemed highly plausible that variations in DNA methylation could be involved in its regulation. However, in this study, extensive bisulfite sequencing analyses of DNA from adipose tissue and adipocytes of mice with low and high Mest expression showed no differences in methylation that could account for variability in gene expression. Furthermore, what appeared to be hypomethylation of the maternal allele in adipocyte DNA, as evidenced by enrichment of non-methylated DNA fragments, was likely caused by a PCR-derived artifact. These data are consistent with recent observations of Kamei et al23 who used a single nucleotide polymorphism between B6 and Japanese Fancy mice within the coding region of Mest to show that adult adipose tissue Mest mRNA was only derived from the paternal allele. Additionally, a recent manuscript by Okada et al used MALDI-TOF mass spectrometry to show that no changes in methylation occurs within the Mest promoter after induction of Mest gene expression in adipose tissue of mice by feeding them a high fat diet 24. In studies to determine whether isoforms of Mest are derived from alternative transcriptional start sites (promoter switching) in adipose tissue from mice fed a high fat diet showed that Mest transcripts that were predominantly transcribed contained the ‘authentic’ exon 1 which is used in development 23.
Although our experiments, and those of Kamei et al 23 and Okada et al 24, clearly show that the maternal allele of Mest in adipose tissue of adult mice is not transcriptionally functional; the mechanism by which variability in Mest expression occurs within a genetically identical population of mice remains intriguing. As an alternative to a DNA methylation based mechanism, epigenetic control of the regulation of transcription factor(s)/ enhancer(s) could indirectly regulate Mest via interaction with its regulatory elements; or, variations in the acetylation and /or methylation of histones could repress or promote Mest transcription. Recent studies suggest that activation of transcription from the non-imprinted paternal allele of Mest may occur via disruption of the interaction between TIF1β (transcriptional intermediary factor 1β) and HP1 (heterochromatin protein 1) and a switch from DNA hypermethylation and histone H3K9 trimethylation to DNA hypomethylation and histone H3K27 trimethylation 25. Because our bisulfite sequencing analyses of DNA does not show evidence of hyper-methylation within genomic regions that overlap those analyzed by Riclet et al 25, it is likely that the Mest promoter of the paternal allele in adipocytes of adult mice is maintained in a transcriptionally permissible state.
A number of studies have failed to demonstrate epigenetic changes within CpG islands of genes associated with complex metabolic phenotypes. Recently, transgenerational amplification of body weight was shown to be prevented in agouti viable yellow (Avy) mice fed diets supplemented with methyl donors; however, no association with changes in the methylation state of the CpG island in the Avy promoter was observed 26. These studies and others underscore the complexities of gene regulation as well as the difficulty in being able to establish the effects of epigenetic variation within CpG islands encompassing the immediate proximal promoter regions of genes. Because the identification of molecular and epigenetic determinants for the regulation of Mest provides an opportunity to evaluate it as a target gene for nutritional programming, in depth promoter analyses of Mest is now being pursued in our laboratory. The data from these and future studies may be used to develop pharmaceutical interventions that can modulate fat mass expansion and obesity in humans by specifically targeting Mest in adipocytes.
Acknowledgments
We thank Tamra Mendoza for technical support, Drs. Kenneth Eilertsen and Jong Seop-Rim for reviewing the manuscript, Susan Newman and Jana Smith of the Pennington Biomedical Research Center’s Genomic Core Facility for support in DNA sequencing and quantitative RT-PCR, and Dr. Brenda Smith-Richards for providing reciprocal mouse hybrids generated from B6 and CAST/EiJ. These studies were supported by The Health Excellent Fund of the State of Louisiana (LPK), NIH P30 DK072476 CNRU P&F (RAK), NIH P20-RR021945 COBRE (RAK) and NIH R21 DK074951 (RAK).
Abbreviations
- Mest
mesoderm specific transcript
- DMR
differentially methylated region
- TSS
transcriptional start site
- B6
C57BL/6J
References
- 1.Duhl DMJ, Vrieling H, Miller KA, Wolff GL, Barsh GS. Neomorphic agouti mutations in obese yellow mice. Nature Genet. 1994;8:59–64. doi: 10.1038/ng0994-59. [DOI] [PubMed] [Google Scholar]
- 2.Reed SC. The inheritance and expression of fused, a new mutation in the house mouse. Genetics. 1937;22:1–13. doi: 10.1093/genetics/22.1.1. [DOI] [PMC free article] [PubMed] [Google Scholar]
- 3.Zeng L, Fagotto F, Zhang T, Hsu W, Vasicek TJ, Perry WL, 3rd, Lee JJ, Tilghman SM, Gumbiner BM, Costantini F. The mouse Fused locus encodes Axin, an inhibitor of the Wnt signaling pathway that regulates embryonic axis formation. Cell. 1997;90:181–92. doi: 10.1016/s0092-8674(00)80324-4. [DOI] [PubMed] [Google Scholar]
- 4.Argeson AC, Nelson KK, Siracusa LD. Molecular basis of the pleiotropic phenotype of mice carrying the hypervariable yellow (Ahvy) mutation at the agouti locus. Genetics. 1996;142:557–67. doi: 10.1093/genetics/142.2.557. [DOI] [PMC free article] [PubMed] [Google Scholar]
- 5.Michaud EJ, Bultman SJ, Klebig ML, van Vugt MJ, Stubbs LJ, Russell LB, Woychik RP. A molecular model for the genetic and phenotypic characteristics of the mouse lethal yellow (Ay) mutation. Proc Natl Acad Sci U S A. 1994;91:2562–6. doi: 10.1073/pnas.91.7.2562. [DOI] [PMC free article] [PubMed] [Google Scholar]
- 6.Vasicek TJ, Zeng L, Guan XJ, Zhang T, Costantini F, Tilghman SM. Two dominant mutations in the mouse fused gene are the result of transposon insertions. Genetics. 1997;147:777–86. doi: 10.1093/genetics/147.2.777. [DOI] [PMC free article] [PubMed] [Google Scholar]
- 7.Burcelin R, Crivelli V, Dacosta A, Roy-Tirelli A, Thorens B. Heterogeneous metabolic adaptation of C57BL/6J mice to high-fat diet. Am J Physiol Endocrinol Metab. 2002;282:E834–42. doi: 10.1152/ajpendo.00332.2001. [DOI] [PubMed] [Google Scholar]
- 8.Koza RA, Nikonova L, Hogan J, Rim JS, Mendoza T, Faulk C, Skaf J, Kozak LP. Changes in gene expression foreshadow diet-induced obesity in genetically identical mice. PLoS Genet. 2006;2:e81. doi: 10.1371/journal.pgen.0020081. [DOI] [PMC free article] [PubMed] [Google Scholar]
- 9.Lefebvre L, Viville S, Barton SC, Ishino F, Surani MA. Genomic structure and parent-of-origin-specific methylation of Peg1. Hum Mol Genet. 1997;6:1907–15. doi: 10.1093/hmg/6.11.1907. [DOI] [PubMed] [Google Scholar]
- 10.Tada M, Tada T, Lefebvre L, Barton SC, Surani MA. Embryonic germ cells induce epigenetic reprogramming of somatic nucleus in hybrid cells. Embo J. 1997;16:6510–20. doi: 10.1093/emboj/16.21.6510. [DOI] [PMC free article] [PubMed] [Google Scholar]
- 11.Kanwar YS, Kumar A, Ota K, Lin S, Wada J, Chugh S, Wallner EI. Identification of developmentally regulated mesodermal-specific transcript in mouse embryonic metanephros. Am J Physiol Renal Physiol. 2002;282:F953–65. doi: 10.1152/ajprenal.00200.2001. [DOI] [PubMed] [Google Scholar]
- 12.Li T, Vu TH, Lee KO, Yang Y, Nguyen CV, Bui HQ, Zeng ZL, Nguyen BT, Hu JF, Murphy SK, Jirtle RL, Hoffman AR. An imprinted PEG1/MEST antisense expressed predominantly in human testis and in mature spermatozoa. J Biol Chem. 2002;277:13518–27. doi: 10.1074/jbc.M200458200. [DOI] [PubMed] [Google Scholar]
- 13.Nishita Y, Sado T, Yoshida I, Takagi N. Effect of CpG methylation on expression of the mouse imprinted gene Mest. Gene. 1999;226:199–209. doi: 10.1016/s0378-1119(98)00576-9. [DOI] [PubMed] [Google Scholar]
- 14.Holmquist M. Alpha/Beta-hydrolase fold enzymes: structures, functions and mechanisms. Curr Protein Pept Sci. 2000;1:209–35. doi: 10.2174/1389203003381405. [DOI] [PubMed] [Google Scholar]
- 15.Ollis DL, Cheah E, Cygler M, Dijkstra B, Frolow F, Franken SM, Harel M, Remington SJ, Silman I, Schrag J, et al. The alpha/beta hydrolase fold. Protein Eng. 1992;5:197–211. doi: 10.1093/protein/5.3.197. [DOI] [PubMed] [Google Scholar]
- 16.Nikonova L, Koza RA, Mendoza T, Chao PM, Curley JP, Kozak LP. Mesoderm-specific transcript is associated with fat mass expansion in response to a positive energy balance. FASEB J. 2008;22:3925–37. doi: 10.1096/fj.08-108266. [DOI] [PMC free article] [PubMed] [Google Scholar]
- 17.Olek A, Oswald J, Walter J. A modified and improved method for bisulphite based cytosine methylation analysis. Nucleic Acids Res. 1996;24:5064–6. doi: 10.1093/nar/24.24.5064. [DOI] [PMC free article] [PubMed] [Google Scholar]
- 18.Bjorntorp P, Karlsson M, Gustafsson L, Smith U, Sjostrom L, Cigolini M, Storck G, Pettersson P. Quantitation of different cells in the epididymal fat pad of the rat. J Lipid Res. 1979;20:97–106. [PubMed] [Google Scholar]
- 19.Cleary MP, Greenwood MR, Brasel JA. A multifactor analysis of growth in the rat epididymal fat pad. J Nutr. 1977;107:1969–74. doi: 10.1093/jn/107.11.1969. [DOI] [PubMed] [Google Scholar]
- 20.Miller WH, Faust IM, Hirsch J. Demonstration of de novo production of adipocytes in adult rats by biochemical and radioautographic techniques. J Lipid Res. 1984;25:336–47. [PubMed] [Google Scholar]
- 21.Takahashi M, Kamei Y, Ezaki O. Mest/Peg1 imprinted gene enlarges adipocytes and is a marker of adipocyte size. Am J Physiol Endocrinol Metab. 2004 doi: 10.1152/ajpendo.00244.2004. [DOI] [PubMed] [Google Scholar]
- 22.Shi W, Lefebvre L, Yu Y, Otto S, Krella A, Orth A, Fundele R. Loss-of-imprinting of Peg1 in mouse interspecies hybrids is correlated with altered growth. Genesis. 2004;39:65–72. doi: 10.1002/gene.20027. [DOI] [PubMed] [Google Scholar]
- 23.Kamei Y, Suganami T, Kohda T, Ishino F, Yasuda K, Miura S, Ezaki O, Ogawa Y. Peg1/Mest in obese adipose tissue is expressed from the paternal allele in an isoform-specific manner. FEBS Lett. 2007;581:91–6. doi: 10.1016/j.febslet.2006.12.002. [DOI] [PubMed] [Google Scholar]
- 24.Okada Y, Sakaue H, Nagare T, Kasuga M. Diet-induced up-regulation of gene expression in adipocytes without changes in DNA methylation. Kobe J Med Sci. 2009;54:E241–9. [PubMed] [Google Scholar]
- 25.Riclet R, Chendeb M, Vonesch JL, Koczan D, Thiesen HJ, Losson R, Cammas F. Disruption of the interaction between transcriptional intermediary factor 1{beta} and heterochromatin protein 1 leads to a switch from DNA hyper- to hypomethylation and H3K9 to H3K27 trimethylation on the MEST promoter correlating with gene reactivation. Mol Biol Cell. 2009;20:296–305. doi: 10.1091/mbc.E08-05-0510. [DOI] [PMC free article] [PubMed] [Google Scholar]
- 26.Waterland RA, Travisano M, Tahiliani KG, Rached MT, Mirza S. Methyl donor supplementation prevents transgenerational amplification of obesity. Int J Obes (Lond) 2008;32:1373–9. doi: 10.1038/ijo.2008.100. [DOI] [PMC free article] [PubMed] [Google Scholar]


