

Abstract
Introduction
CUG-BP, Elav-like family member 1 (CELF1) and CELF2 are RNA-binding proteins that regulate several stages of RNA processing, and are broadly expressed in developing and adult tissues. In this study, we investigated the expression patterns of CELF1 and CELF2 transcripts and proteins in different tissues, stages of development, and organisms.
Results
We found that CELF1 and CELF2 protein levels are regulated independently of transcript levels during heart development, and these proteins exhibit nuclear and cytoplasmic isoforms in the embryonic heart. We found that the subcellular distribution of CELF1 differs between heart, liver, nervous system, and eye, and identified tissue-specific isoforms of both CELF1 and CELF2 in these tissues. CELF1 and CELF2 are largely co-expressed, but are found in mutually exclusive territories in several organs, including the heart and eye. Finally, we show that the expression patterns observed in embryonic chicken were mostly recapitulated in the developing mouse, suggesting that the roles of these proteins in the tissues and cells of the developing embryo are conserved as well.
Conclusions
CELF1 and CELF2 may underlie conserved, developmentally regulated, tissue-specific processes in vertebrate embryos. Different tissues likely have unique profiles of nuclear and cytoplasmic CELF1- and CELF2-mediated functions.
Keywords: CELF1, CELF2, embryonic development, chicken, mouse, expression, evolutionary conservation
Introduction
CUG-BP, ELAV-like family (CELF) proteins are multifunctional RNA-binding proteins (for a review, see Dasgupta and Ladd, 2012). Members of this family are evolutionarily conserved, and homologs have been identified in vertebrates and invertebrates, as well as in plants (Brimacombe and Ladd, 2007). In this work, CELF proteins will be referred to according to the most recent CELF nomenclature and, where appropriate, other aliases will be included in parentheses. CELF proteins are found in both the nucleus and the cytoplasm. In the nucleus, CELF proteins regulate the alternative splicing of pre-mRNA targets, and CELF2 has been suggested to also be involved in mRNA editing (Anant et al., 2001). In the cytoplasm, CELF1 and CELF2 have been shown to regulate transcript stability and translation (Mukhopadhyay et al., 2003; Baldwin et al., 2004; Iakova et al., 2004; Timchenko et al., 2005).
The CELF proteins are divided based on sequence similarity into two subfamilies, CELF1-2 and CELF3-6. Members of the two subfamilies differ in their tissue distribution, with CELF1 and CELF2 being found in a broad array of tissues in the adult (including heart, skeletal muscle, lung, liver, kidney, and the nervous system) and CELF3-6 being found primarily in the nervous system (Ladd et al., 2001; Ladd et al., 2004). The wide distribution of CELF1 and CELF2, in contrast to the other members of the family, makes the expression and regulation of these members of particular interest, especially in the context of the dynamic processes of organogenesis.
While few studies have systematically compared the expression patterns of these genes across species, developmental stages, or tissues, the available data suggest that they are dynamically regulated during development. Celf2 (Napor) transcript levels in the embryo increase from early to late embryonic development in zebrafish and mouse (Choi et al., 1999; Levers et al., 2002; Choi et al., 2003). This developmental regulation is also seen in Xenopus laevis, where total transcript levels of all CELF members (Brunol1-5) increase during embryonic development, as detected by RT-PCR on whole embryo RNA (Wu et al., 2010).
The distribution of CELF transcripts has also been investigated in the embryo, and suggests family member-specific regulation. In the zebrafish zygote, celf1 (brul) is found in the vegetal pole (Suzuki et al., 2000). By contrast, celf2 (napor) is found in the animal pole – as maternal transcripts – and its levels oscillate sharply during early embryonic development (Choi et al., 2003). The limited available data suggest that, at later stages, celf1 is strongly expressed in the lens fiber cells of the developing zebrafish embryo, while celf2 is found in the nervous system, somites, and retinal cells (Choi et al., 2003). In Xenopus laevis, celf1 (EDEN-BP; brunol2) of presumably maternal origin is found homogeneously in the early embryo, although conflicting evidence suggests that these transcripts are localized to the animal pole of the unfertilized egg and early-stage embryo (Wu et al., 2010). At later stages, celf1 (brunol2) and celf2 (brunol3) transcripts are co-expressed in the Xenopus embryo, where their territories include the paraxial mesoderm, somites, neural structures, and the eye (Wu et al., 2010). In chicken early embryonic development, CELF1 and CELF2 transcripts are found to be similarly expressed in the somites, nervous system, and heart muscle, while they localize to non-overlapping regions in the eye and endocardial cushions of the heart (Brimacombe and Ladd, 2007). In the developing mouse embryo, CELF1 and CELF2 transcripts have been detected in several brain regions, as well as in the eye (Choi et al., 1999; Levers et al., 2002; McKee et al., 2005; Magdaleno et al., 2006; Diez-Roux et al., 2011).
In contrast to the patterns of transcript expression, the tissue distribution of the CELF1 and CELF2 proteins in the embryo has largely not been investigated. Levels of both proteins have been shown to change from pre-natal to postnatal stages in several tissues including heart, skeletal muscle, liver, stomach, lung, and brain, but changes in protein levels during embryogenesis have not been studied (Ladd et al., 2001; Ladd et al., 2005; Kalsotra et al., 2008).
In this work, we compare CELF1 and CELF2 transcripts and proteins in different embryonic tissues, in order to characterize the levels and tissue, cellular, and subcellular distribution of these proteins in the developing embryo. Furthermore, we compare the distribution of these CELF members in chicken and mouse embryonic development, in order to investigate the conservation of transcript and protein distribution in vertebrate embryogenesis. The expression patterns of CELF1 and CELF2 from this and previous studies are summarized in Table 1. Our results demonstrate that CELF1 and CELF2 exhibit conserved, partially overlapping, developmental stage-, tissue-, and subcellular compartment-specific expression. These patterns of expression suggest that CELF1 and CELF2 may have unique targets and roles in regions of the embryo in which the expression of one family member is exclusive of the other.
Table 1.
Summary of CELF1 and CELF2 expression in embryonic and adult tissuesa
| CELF1 | CELF2 | |||||
|---|---|---|---|---|---|---|
| Tissue | Embryo | Adult | Ref.b | Embryo | Adult | Ref.b |
| Heart | DB (H), ISH (M, C), WB (M, C), IF (M, C) |
DB (H), WB (M, C) |
1-6 | DB (H), ISH (M, C), WB (M, C) |
DB (H); WB (M, C) |
1-6 |
|
| ||||||
| Liver | DB (H), ISH (C), WB (C), IF (M, C) |
DB (H), WB (M) |
1-5 | DB (H), ISH (C), WB (C) |
DB (H), WB (M) |
1-5 |
|
| ||||||
| Somites | ISH (C) | NA | 5 | ISH (C, Z) | NA | 5, 7, 8 |
|
| ||||||
| Skeletal muscle |
ISH (M, C, F), WB (M), IF (M, C) |
DB (H), WB (M) |
1-5 | ISH (M, C), WB (M) |
DB (H), WB (M) |
1-5, 9 |
|
| ||||||
| Brain and nervous system |
DB (H), ISH (M, C, F), WB (M, C), IF (M, C) |
DB (H), ISH (M), WB (M) |
1-5, 10, 11 |
DB (H), ISH (M, C, F, Z), RT- PCR (M), WB (M) |
DB (H), ISH (M), WB (M) |
1-5, 7-9, 11-13 |
|
| ||||||
| Eye | ISH (M, C, F, Z), WB (C), IF (M, C) |
ND |
1, 5, 11, 14 |
ISH (M, C, F), WB (C) |
ND |
1, 5, 7, 9, 11 |
|
| ||||||
| Lung | DB (H), WB (M) |
DB (H), WB (M) |
2, 3, 4 | DB (H), WB (M) |
DB (H), WB (M) |
2, 3, 4 |
|
| ||||||
| Kidney | DB (H), ISH (C) |
DB (H), WB (M) |
1, 2, 3 | DB (H) | DB (H), WB (M) |
2, 3 |
|
| ||||||
| Spleen | DB (H) | DB (H), WB (M) |
2, 3 | DB (H) | DB (H), WB (M) |
2, 3, 4 |
|
| ||||||
| G.I. c |
ISH (C), WB (M) |
DB (H), WB (M) |
1-4 | ISH (C), WB (M) |
DB (H), WB (M) |
1-4 |
|
| ||||||
| Repro., Md | ND | DB (H) | 3 | ND | DB (H) | 3 |
|
| ||||||
| Repro., Fd | ND | DB (H), WB (M) |
2, 3 | ND | DB (H) | 3 |
Transcript or protein expression was demonstrated in these tissues as indicated by Assay (Species): DB, RNA dot blot; ISH, in situ hybridization; RT-PCR, reverse transcription polymerase chain reaction; WB, western blot; IF, immunofluorescence; H, human; M, mouse; C, chicken; F, frog; Z, zebrafish; NA, not applicable; ND, not determined
References: (1) This study; (2) Ladd et al., 2001; (3) Ladd et al., 2004; (4) Ladd et al., 2005; (5) Brimacombe and Ladd, 2007; (6) Kalsotra, et al., 2008; (7) Choi et al., 2003; (8) Magdaleno et al., 2006; (9) Diez-Roux et al., 2011; (10) McKee et al., 2005; (11) Wu et al., 2010; (12) Choi et al., 1999; (13) Levers et al., 2002; (14) Suzuki et al., 2000
G.I., gastrointestinal tract
Repro., reproductive system; M, male; F, female
Results and Discussion
CELF1 and CELF2 undergo dynamic post-transcriptional regulation during early heart development in chicken
The heart first forms as a simple, linear tube (by stages 9-10, or roughly day 1-1.5). During cardiac morphogenesis, the primitive heart tube undergoes cardiac looping (stages 11-16, or roughly day 1.5-2.5) to orient the chambers and align the inflow and outflow tracts at the top of the heart. The looped heart then undergoes dramatic growth and rearrangement to form the morphologically familiar four-chambered structure (recognizable by stage 35, or day 8). Total protein levels of both CELF1 and CELF2 have previously been observed to drop between embryonic day 8 and adult (Ladd et al., 2001; Ladd et al., 2005; Kalsotra et al., 2008). However, protein dynamics have not been investigated during the period of most active cardiac morphogenesis. To investigate the regulation of these proteins during this important period of heart development, the total protein levels of CELF1 and CELF2 were evaluated at eight stages between day 1.5 and day 14 of gestation. When total protein samples from whole heart were analyzed by western blot, both CELF1 and CELF2 appeared to be dynamically regulated. Both proteins were expressed at low levels at stages 10 and 14, their expression then rose steeply — peaking between stages 23 and 26 — followed by an acute decline (Figure 1A). Thus, the down-regulation reported at later embryonic and postnatal stages actually begins earlier than previously appreciated (Ladd et al., 2005; Kalsotra et al., 2008).
Figure 1.

ELF1 and CELF2 expression in chicken heart during embryonic development. (A) Total CELF1 and CELF2 protein levels in whole heart rise from stage 10 to stages 23-26 (CELF1) and stages 26-29 (CELF2), and then drop, as determined by western blot. (B) Relative transcript levels of CELF1 and CELF2 do not vary significantly (P > 0.05) in whole heart between stages 10 and 35, as determined by real-time RT-PCR (n = 3-4). Error bars represent 95% Confidence Intervals. (C) Expression of CELF1 and CELF2 protein in heart nuclear and cytoplasmic fractions from stages 14, 23, and 35 as assessed by western blot. Ponceau S staining was used to show total protein integrity and loading. Bars by western blots indicate the relative position of the 50/52 kDa ladder marker for that blot. Blots shown are representative of three independent experiments.
While CELF1 and CELF2 protein levels decrease in mouse and chicken postnatally, their transcript levels remain unchanged, suggesting post-transcriptional regulation of CELF levels via changes in translation and/or protein stability (Ladd and Cooper, 2004; Ladd et al., 2005; Kalsotra et al., 2008). In order to investigate if CELF1 and CELF2 in the embryonic chicken heart are also regulated post-transcriptionally, we investigated the dynamics of expression of CELF1 and CELF2 transcripts versus proteins. During the developmental window in which CELF1 and CELF2 protein levels were dramatically rising and then falling, CELF1 and CELF2 transcript levels (measured by qRT-PCR) did not markedly change (Figure 1B). These results are consistent with the regulation of these proteins via a post-transcriptional mechanism, as has been suggested postnatally.
CELF1 and CELF2 have been found in both nuclear and cytoplasmic fractions of mid-embryonic (E14) and early postnatal mouse heart, consistent with these proteins carrying out both nuclear and cytoplasmic functions (Kalsotra et al., 2008; Ladd et al., 2005; for review, see Dasgupta and Ladd, 2012). Since in previous studies the subcellular localization was determined at one embryonic stage, we investigated the dynamics of this localization over a broader developmental arc. Western blots were performed on nuclear and cytoplasmic fractions of embryonic chicken hearts from several stages (Figure 1C), and probed for both CELF1 and CELF2. Both nuclear and cytoplasmic CELF1 levels increased between stage 14 and 23, and then decreased between stage 23 and 35, as we have seen with total protein from whole heart. By contrast, while the nuclear CELF2 recapitulated the expression pattern in whole heart, the cytoplasmic CELF2 only decreased between stage 14 and 35.
While the expression level of CELF1 in the nucleus was similar to CELF1 in the cytoplasm, distinct nuclear (slower-migrating) and cytoplasmic (faster-migrating) bands were identified (Figure 1C); a pattern that had not previously been reported. By contrast, CELF2 exhibited a doublet in cytoplasm and only a single band in the nucleus. Interestingly, this single nuclear band showed a developmental switch from a slow-migrating band at stage 14 to a faster-migrating band at stages 23 and 35.
Several sources of sequence variation have been reported for CELF1 and CELF2, including variants in transcript sequence and post-translational modifications of the proteins (partially curated in the UniProt database; http://www.uniprot.org/uniprot/). There is evidence that both CELF1 and CELF2 are alternatively spliced, including one variant of CELF1 that codes for an extra four amino acids (the “LYLQ variant”) and variants of CELF2 that would result in peptides with extra amino acids (Choi et al., 1999; Ladd et al., 2001; Takahashi et al., 2001). There is also evidence of alternative promoter usage at the CELF1 and CELF2 gene loci, giving rise to different primary transcripts in several tissues and cancer cells yielding distinct protein isoforms with different amino termini (Choi et al., 1999). Also, CELF1 and CELF2 contain several putative phosphorylation sites, and phosphorylation of CELF1 at multiple sites has been associated with changes in function and subcellular localization (Choi et al., 1999; Li et al., 2001; Huichalaf et al., 2007; Ramalingam et al., 2008). Other post-translational modifications, such as ubiquitylation, SUMOylation, and lipidation have not been investigated.
Different CELF1 and CELF2 isoforms are expressed in different tissues
Having found multiple isoforms of CELF1 and CELF2 in the developing heart, we expanded our investigation to other tissues shown in the literature to express these genes in the adult or embryo. Both CELF1 and CELF2 proteins have been detected by western blot in a variety of adult tissues, including heart, skeletal muscle, liver, kidney, lung, and brain (Ladd et al., 2001; Ladd et al., 2005). In this study, total protein from four tissues (heart, liver, hindbrain, and eye) at two developmental stages (stage 26, during which CELF protein levels peak in the heart and cardiac morphogenesis is underway, and stage 35, during which CELF protein levels in the heart are in decline and cardiac morphogenesis is largely complete) was compared by western blot analysis. In heart and liver samples, only a single CELF1 band was resolved, whereas two bands were resolved in hindbrain and eye (Figure 2). By contrast, a variety of bands were observed when the membranes were probed for CELF2, with little overlap between tissues. While the number of bands in each tissue did not change between stages, the relative abundance of protein in each band did appear to shift between stages 26 and 35 (Figure 2). In particular, the level of expression of the slow-migrating bands for both CELF1 and CELF2 in eye and hindbrain decreased from stage 26 to stage 35.
Figure 2.
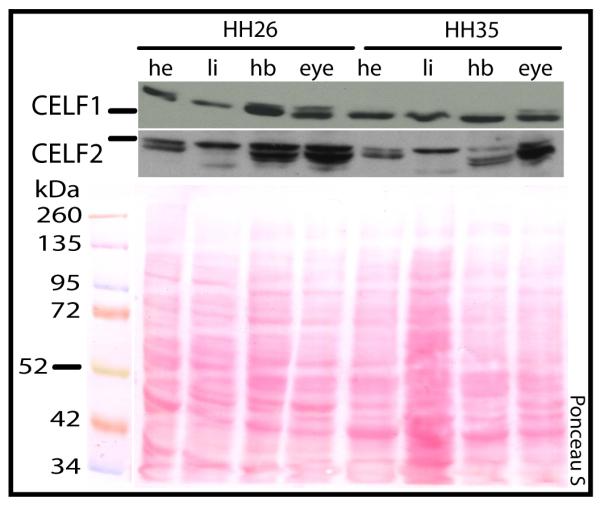
xpression of CELF1 and CELF2 proteins in a panel of chicken embryonic tissues. CELF1 and CELF2 protein expression in heart (he), liver (li), hindbrain (hb), and eye (ey) from stages 26 and 35 was assessed by western blot. Ponceau S staining was used to show total protein integrity and loading. Bars by western blots indicate the relative position of the 50/52 kDa ladder marker for that blot. Blots shown are representative of three independent experiments.
An area of future investigation will be to distinguish the identity of these isoforms. Multiple mechanisms, including both differences in transcript sequences and post-translational modifications, may underlie CELF1 and CELF2 isoform diversity. Amplification of the full-length open reading frames of CELF1 and CELF2 from embryonic tissues by RT-PCR revealed several splice variants of each that differ by three to eighteen nucleotides (data not shown). Although these differences are too small by themselves to explain the differences observed by western blot (encoding only one to six amino acids), they may affect the post-translational modification of specific residues. Protein modifications may allow for dynamic regulation of localization or activity of these proteins, and in these ways regulate the class of substrates under CELF1 and CELF2 control during diverse conditions in different tissues and developmental stages.
Regional distribution of CELF1 and CELF2 in the chicken embryo differ between tissues
We have previously reported that, at earlier stages of development (stages 18 and 23), CELF1 and CELF2 transcripts are found in many of the same tissues (such as in the nervous system, heart, and somites), and that their expression territories overlap in some tissues (e.g., somites) but are non-overlapping in others (e.g., the endocardial cushions of the heart)(Brimacombe and Ladd, 2007). In the current study, we probed sagittal sections of chicken embryos from two more advanced stages of embryonic development (stages 26 and 35) for CELF1 and CELF2 by in situ hybridization (Figure 3). Our data extend our previous findings, showing that CELF1 and CELF2 transcripts are co-expressed in some tissues (such as heart, liver, nervous system, and eye) at these stages as well, and that their territories overlap in some tissues (e.g., in the liver and in parts of the nervous system), while being spatially distinct in others (e.g., in the lens and retina)(Figures 4A-D). Our data go further to show that at stage 35, unlike at earlier stages, both CELF1 and CELF2 are found in the gut; that CELF1 – but not CELF2 – is found in kidney at this stage; and that at both stage 26 and stage 35 CELF1 – but not CELF2 – is detectable at appreciable levels in the dorsal root ganglia.
Figure 3.

CELF1 and CELF2 in situ hybridization in chicken embryos. Tissue distribution of CELF1 (A, C) and CELF2 (B, D) transcripts in sagittal sections of chicken embryos from stages 26 (A, B) and 35 (C, D; body only). Labels: he, heart; li, liver; br, brain; lu, lung; gi, gizzard; nt, neural tube; asterisks indicate dorsal root ganglia.
Figure 4.

CELF1 and CELF2 are differentially expressed in the embryonic chicken eye. CELF1 (A, C) and CELF2 (B, D) transcripts in transverse (A, B) and coronal (C, D) sections of stage 35 embryonic chicken heads (transverse and coronal planes of section for the embryo correspond to sagittal and transverse planes of section for the lens, respectively). Insets show magnified views of the lens in each panel. (E) CELF1 and CELF2 protein levels in lens and retina (ret.) of chicken embryos from stages 26 and 35, determined by western blot. Ponceau S staining was used to show total protein integrity and loading. Bars by western blots indicate the relative position of the 50/52 kDa ladder marker for that blot. Blots shown are representative of three independent experiments.
The dichotomy of expression in the embryonic eye was also very striking at the protein level. When whole protein was extracted from isolated lenses and retinas of stage 26 or stage 35 embryos and analyzed by western blot, very sharp differences could be seen for both CELF1 and CELF2. Like their RNAs, CELF1 protein expression is higher in the lens, while CELF2 protein is more highly expressed in the retina. At both stages, a CELF1 band (possibly a doublet) was found in the lens, which was distinct from a CELF1 band found in retina, and the same was true for a lens-specific CELF2 band versus a retina-specific CELF2 doublet (Figure 4E). Furthermore, our findings show that, while CELF2 transcripts are virtually undetectable in lens (while its relative levels are quite high in other tissues, especially brain), the protein is readily detectable by western blot (at levels equivalent or greater than those in brain), suggesting that either translation of CELF2 is very efficient or the protein is particularly stable in the lens.
Our findings suggest that CELF1 and CELF2 are regulated both in terms of protein levels – in a manner that our data suggest is independent of transcript levels – and in terms of their subcellular localization. Furthermore, while our findings by western blot analysis suggest the presence of multiple protein isoforms in different subcellular compartments, the protein samples represent multiple cell types from each represented tissue. In order to visualize the relative levels, the subcellular distribution, as well as the sub-tissue distribution of CELF1 and CELF2 in the embryo, we employed indirect immunofluorescence (Figure 5). Despite attempts to optimize conditions (e.g., fixation, embedding, and antigen retrieval), immunofluorescence for CELF2 was unsuccessful for multiple antibodies (Fisher catalog number PA14130, Calbiochem catalog number 40-7500, Abcam catalog number ab111728, and 1H2 [Santa Cruz Biotechnologies])(not shown). While CELF1 protein was present in all transcript-positive tissues of stage 26 and stage 35 chicken embryos, its intracellular distribution in heart and skeletal muscles was strikingly different from its expression in other tissues. In particular, CELF1 was detected in both the cytoplasm and nucleus in cardiomyocytes, although it appeared to be expressed more strongly in the nucleus, while in other tissues analyzed its expression was overwhelmingly cytoplasmic (Figure 5C). Furthermore, CELF1 expression within several tissues was regionally specific. In the heart, CELF1 was exclusively detected in cardiomyocytes, while in the brain and retina it was predominantly detected in the luminal layers (Figure 5C). The strongest expression of CELF1 (protein and transcript) was found in the lens (Figure 5D), where the protein was predominantly detected in the fiber cells and in the cells of the transitional zone, whereas it was nearly undetectable in the lens epithelial cells. Taking our protein data together (as detected by western blot and by immunofluorescence), our findings suggest that the different isoforms of CELF1 and CELF2 in the eye may underlie more than just localization, since the protein is found in the cytoplasm of cells in both the retina and the lens. This territorial separation between CELF1 and CELF2 in the eye has also been shown in zebrafish and Xenopus embryos, suggesting that there is high conservation of function for these proteins in the eye (Choi et al., 2003).
Figure 5.

Tissue distribution of CELF1 protein in embryonic chicken. (A and B) CELF1 protein in sagittal sections of embryos from stages 26 (A) and 35 (B), determined by immunofluorescence. (C) High magnification (40X) images of CELF1 protein distribution in heart, liver, and hindbrain of an embryo from stage 35. (D) CELF1 protein in the whole eye of an embryo from stage 35; smaller panels show enlargements of lens and retina. Green, CELF1; blue, DAPI; each section is representative of two embryos. Labels: endo, endocardial cells; myo, myocardial cells; LEC, lens epithelial cells; LFC, lens fiber cells; TZ, transitional zone; GCL, glial cell layer; RPE, retinal pigment epithelium. Since retinal staining was variable and patchy, the high magnification view of the retina is from a different section than the one shown for the whole eye and the lens.
The distribution of CELF1 and CELF2 transcripts and proteins are largely conserved between chicken and mouse
To investigate the conservation of expression of CELF1 and CELF2, in situ hybridization was performed on whole sections of mouse embryos from days E11.5 and E14 of gestation for Celf1 and Celf2 transcripts (Figure 6). Our results show that the regional distribution of both transcripts recapitulates many of the patterns we find in the chicken embryo (e.g., high expression of Celf1 and Celf2 in the brain and in muscle), but not others (e.g., both Celf1 and Celf2 are strongly expressed in dorsal root ganglia)(Figure 6A-D compared with Figure 3A-D; note that the mouse embryo does not possess a gizzard). In addition, in the eye we find Celf1 to be highly expressed in the lens and Celf2 to be predominantly in the retina, as in chick (Figures 6E-H). Finally, we also found both Celf1 and Celf2 expressed in a striated pattern in the mouse embryonic tongue (Figures 6E-H), while our chicken sections did not include the tongue.
Figure 6.

Celf1 and Celf2 in situ hybridization in sagittal sections of mouse embryos. Celf1 (A, C) and Celf2 (B, D) transcript distribution at E11.5 (A, B) and E14 (C, D). (E-H) Celf1 (E, G) and Celf2 (F, H) transcripts in transverse (E, F) and coronal (G, H) sections of the heads of E14 embryos (transverse and coronal planes of section for the embryo correspond to sagittal and transverse planes of section for the eye, respectively). Tissue labels: he, heart; li, liver; br, brain; lu, lung; nt, neural tube; to, tongue; asterisks indicate dorsal root ganglia.
When we probed similar sections of whole mouse embryos for CELF1 protein by immunofluorescence, CELF1 expression patterns largely recapitulated those found in the chicken embryo: CELF1 protein is highly expressed in the heart, other striated muscle, liver, nervous system, and lens (Figures 7A-D). Of note was the expression pattern of CELF1 in the heart. In embryos of both species, CELF1 protein in the heart was restricted to the myocardial cell layer. In the chicken embryonic heart, cytoplasmic CELF1 expression was markedly lower than nuclear expression, while cytoplasmic expression of CELF1 in myocardial cells of the mouse embryonic heart were in many cells similar to nuclear levels of the protein (Figure 7C compared with Figure 5C). Finally, while CELF1 was detected in the chicken embryonic retina (albeit only in the cells lining the luminal aspect), no protein was detected in the retina of the mouse embryo; this is despite the fact that CELF1 expression in the lens was robustly detected in the embryos of both organisms (Figure 7D). This observation may represent differences in the development of the eye between these two species, as well as differences in antibody affinity for CELF1 in chicken versus mouse retina.
Figure 7.

Tissue distribution of CELF1 protein in embryonic mouse. (A and B) CELF1 protein in sagittal sections of embryos from E11.5 (A) and E14 (B). (C) High magnification (40X) images of CELF1 protein in heart, liver, and hindbrain of an E14 embryo. Labels: epi, epicardial cells; myo, myocardial cells; endo, endocardial cells. (D) CELF1 protein in the whole eye of an E14 embryo; smaller panels show enlargements of lens and retina (green, CELF1; blue, DAPI). Labels: LEC, lens epithelial cells; LFC, lens fiber cells; NR, neural retina; RPE, retinal pigment epithelium.
Concluding remarks
In this study, we investigated the expression of CELF1 and CELF2 transcripts and proteins in developing chicken and mouse embryos. We showed that CELF1 and CELF2 protein levels are dynamically regulated during cardiogenesis, and that these dynamics are independent of transcript levels. We extended the previously reported developmental series for CELF1 and CELF2 transcript expression, showing that the largely overlapping expression territories of CELF1 and CELF2 transcripts are maintained into later stages of development, but also showed that CELF1 and CELF2 are mutually exclusive in the kidney (in addition to the endocardial cushions, the lens, and the retina). We identified tissue-specific isoforms of both CELF1 and CELF2 in several tissues, and showed that some of these isoforms are restricted to the nuclear or cytoplasmic subcellular compartment in the heart. Finally, we compared CELF1 protein expression between the chicken embryo and the mouse embryo, showing that the patterns of protein expression are largely conserved from birds to mammals, with some subtle differences. This conservation in expression patterns suggests that the function of these proteins is largely conserved during development. The distribution of CELF1 protein in both the nucleus and the cytoplasm of myocardial cells in both species suggests that it has important activities in both compartments, while the subtle difference in its distribution between these compartments may suggest an expansion of its cytoplasmic role in cardiomyocytes of the developing mouse.
Important questions are raised in regions of overlapping expression: Are the proteins working synergistically? Are they antagonizing each other? Are they modified in a way that maintains a level of mechanistic or physical separation between them? Better reagents and tools for detection of CELF2 protein in situ are desperately needed in order to address these issues. Lastly, our data suggest that CELF1 may play predominantly different roles in different tissues. For instance, in liver, our data suggest that CELF1 plays predominantly cytoplasmic roles, which is in line with reports of CELF1 function in hepatocytes (i.e., translation control; Michalowski et al., 1999; Timchenko et al., 1999; Fardaei et al., 2001; Timchenko et al., 2006). By contrast, previous reports on CELF1 function in the brain have focused on it splicing regulatory (i.e., nuclear) role, whereas our data suggest that the protein is predominantly expressed in the cytoplasm (for a review of studies of CELF1 function in the brain, see Ladd, In press). In fact, further dissection of CELF1 (and CELF2) protein expression in particular cell populations in complex tissues such as brain and eye will be useful in identifying the specific tissue components that are regulated by these proteins. Such information would help to further uncover the processes that are globally regulated by these proteins in all CELF1/2-expressing cells, as well as the tissue- or cell-type-specific processes that are regulated by these proteins.
Experimental Procedures
Ethics statement
All animal work was carried out in accordance with the recommendations of the American Veterinary Medical Association and in compliance with institutional and federal guidelines for the ethical care and use of laboratory animals (protocol #2011-0547). Fertilized chicken eggs (White Leghorn Hy-line W-36) were purchased from the Department of Animal Sciences at Ohio State University. Only chicken embryos were used in this study, which are not subject to federal regulation and do not require approval from the Cleveland Clinic Institutional Animal Care and Use Committee. Chicken embryos taken at gestational stages with a differentiated nervous system (i.e., stage 35) were euthanized by decapitation immediately upon removal from the egg. Mice (B6129F1; Taconic Farms, Inc.) were maintained in our animal colony, and all animal husbandry and euthanasia were carried out with the goal of minimizing pain and distress.
Tissue and embryo collection
Fertilized chicken eggs were kept at 15°C (59°F) for up to one week until use. Eggs were incubated at 100°F, 40-60% humidity with auto-turning until the appropriate developmental stage was reached (stage 10 ≈ 1.5 days; stage 14 ≈ 2 days; stage 18 ≈ 3 days; stage 26 ≈ 5 days; stage 29 ≈ 6 days; stage 35 ≈ 8 days; and day 14, where noted). At collection, embryos were extracted from the eggs and staged using the Hamburger and Hamilton staging system (Hamburger and Hamilton, 1992). Embryos were then either fixed for in situ processing or dissected for tissue collection.
In order to obtain mouse embryos, timed matings were performed in our animal colony. At the appropriate day post-conception (day 11 or 14 for E11.5 or E14 embryos, respectively), pregnant females were euthanized by CO2 inhalation followed by cervical dislocation. Embryos were removed, washed briefly in PBS, and fixed in 4% paraformaldehyde overnight at 4°C.
Western blotting and nuclear-cytoplasmic fractionation
For subsequent western blot analyses, tissues were collected on ice, snap-frozen in ethanol on dry-ice, and stored at −80°C until use. Upon use, tissues were homogenized in protein loading buffer (58 mM Tris pH 6.8, 9.3% glycerol, 1.86% SDS, 1.86% β-mercaptoethanol, bromphenol blue) and sonicated. Protein concentrations were determined using a non-interfering (NI) protein assay (G-Biosciences). Nuclear and cytoplasmic protein fractions were isolated from chicken tissues as previously described (Ladd et al., 2005).
Protein samples were boiled briefly and subjected to SDS polyacrylamide gel electrophoresis. Proteins were transferred onto PVDF membranes and probed with primary antibodies against CELF1 (200 ng/mL 3B1 mouse mAb; Santa Cruz Biotechnology) or CELF2 (12.5 ng/mL 40-7500 rabbit pAb; Invitrogen). Blots were exposed to Horse Radish Peroxidase-conjugated secondary antibody (6.7 ng/mL goat anti-mouse [Calbiochem; catalog number DC02L] and 1:10,000 goat anti-rabbit [Calbiochem; catalog number 401393], respectively) and detected using Immobilon Western Chemiluminescent HRP Substrate (Millipore). Three biological replicates were evaluated for each tissue, and each biological replicate consisted of tissue pooled from multiple embryos.
Real-time RT-PCR
Real-time RT-PCR experiments were carried out as described previously (Lemasters et al., 2012). Briefly, RNA was isolated from chicken tissues and reverse-transcribed using the SuperScript VILO cDNA Synthesis kit (Life Technologies; formerly Invitrogen). cDNA was quantified using the Quant-iT OliGreen ssDNA kit (Life Technologies), and diluted to 5 ng/μL in water. All cDNA samples were stored at −20°C. The StepOnePlus platform was used for real-time RT-PCR experiments. FAM-labeled TaqMan probes for chicken CELF1 (Gg03340922_m1), CELF2 (Gg03364304_m1) and VIC-labeled primer-limited probes for GAPDH (Gg03346982) were obtained from Life Technologies (formerly Applied Biosystems). Reactions consisted of 1X TaqMan Gene Expression Master Mix (Life Technologies), 1X endogenous control probe, 0.25X target gene probe, 5 ng cDNA, and water to 20 μL per reaction. Experiments were run using 3-4 technical replicates per sample and 3-4 biological replicates per experimental group. Data were analyzed by the ΔΔCt method, normalizing target gene values to endogenous control (GAPDH) values. Data from biological replicates were analyzed as previously described (Willems et al., 2008).
In situ hybridization
Chicken and mouse embryos were processed, sectioned, and hybridized as previously described (Lemasters et al., 2012). Antisense RNA probes against the chicken CELF1 and CELF2 open reading frames were used, and sense probes for the same transcripts were used to confirm the absence of non-specific signal (Brimacombe and Ladd, 2007). Mouse Celf1 and Celf2 open reading frames were amplified from adult mouse brain RNA as previously described (Ladd et al., 2001). Amplicons were cloned into the pCR-Blunt II-TOPO vector using the Zero Blunt TOPO kit (Invitrogen) and confirmed by sequencing. Primers used for mouse Celf1 (5′-ATGGCTGCGTTTAAGTTGG-3′ and 5′-TCAGTAGGGCTTACTATC-3′) and Celf2 (5′-ATGTTTGAGCGCACTTCTG-3′ and 5′-TCAGTAAGGTTTGCTGTCG-3′) were ordered from Integrated DNA Technologies (IDT). Sections were imaged on the LCN400 Slide Scanner platform (Leica Microsystems).
Immunofluorescence
Following fixation in paraformaldehyde, embryos were transferred to 20% sucrose and incubated at 4°C overnight. Embryos were then embedded in 2:1 20% sucrose:O.C.T. (Optimal Cutting Temperature solution; Electron Microscopy Sciences), frozen on dry ice, and stored at −80°C until use. Whole embryo sections (7-10 μm) were prepared using a cryostat microtome, post-fixed in ice-cold acetone for 10 min, and stored at −80°C until use. To probe for CELF1, sections were permeabilized in 0.1% Triton X-100 in PBS for 20 min at room temperature, blocked in 3% BSA in PBS for 15 min at room temperature, and incubated with primary antibody in blocking solution at 4°C overnight. Mouse sections were probed with 1:100 EPR8298(B) [rabbit mAb; Epitomics], while chicken sections were probed with either EPR8298(B) or 0.4 μg/mL 3B1 [mouse mAb; Santa Cruz Biotechnology]. Sections were washed in PBS, incubated with secondary antibody (6 μg/mL sheep anti-mouse-FITC [cat. No. 515-095-003; Jackson ImmunoResearch] or 10 μg/mL goat anti-rabbit-Alexa Fluor 488 [A11008; Invitrogen]) in blocking solution for at least one hour at room temperature, washed in PBS, and mounted using VECTASHIELD HardSet Mounting Medium with DAPI (Vector Laboratories). Images were captured on an inverted epifluorescent tiling microscope (DM5000B; Leica Microsystems), using the ImagePro Plus software (Media Cybernetics). Images were processed for publication using Adobe Photoshop CS2 (v.9.0.2), GIMP (v.2.8; http://libguides.library.cofc.edu/gimp), and ImageJ (v.1.46; NIH; Schneider et al., 2012).
Key Findings.
Developmental regulation of CELF1 and CELF2 protein dynamics is independent of transcript levels in the embryonic heart.
CELF1 and CELF2 transcripts are largely co-expressed, but are found in mutually exclusive territories in several tissues.
Several tissue- and subcellular compartment-specific isoforms of CELF1 and CELF2 proteins suggest a means for functional diversity and specificity for these proteins.
CELF1 and CELF2 expression patterns are largely conserved between chicken and mouse embryos.
Acknowledgements
We would like to thank the laboratory of Dr. Oliver Wessely for technical assistance with in situ hybridizations. We would also like to thank Dr. Judith A. Drazba and Dr. John Peterson for assistance with the production of tiled images of embryo sections. This work was supported by 1R01HL089376 from the NIH to A.N.L. Y.B-H. was supported by the NIH training grant 5T32GM008056-28.
Grant sponsor: NIH; Grant numbers: 1R01HL089376 and 5T32GM008056-28.
References
- Anant S, Henderson JO, Mukhopadhyay D, Navaratnam N, Kennedy S, Min J, Davidson NO. Novel role for RNA-binding protein CUGBP2 in mammalian RNA editing. CUGBP2 modulates C to U editing of apolipoprotein B mRNA by interacting with apobec-1 and ACF, the apobec-1 complementation factor. J Biol Chem. 2001;276:47338–47351. doi: 10.1074/jbc.M104911200. [DOI] [PubMed] [Google Scholar]
- Baldwin BR, Timchenko NA, Zahnow CA. Epidermal growth factor receptor stimulation activates the RNA binding protein CUG-BP1 and increases expression of C/EBPbeta-LIP in mammary epithelial cells. Mol Cell Biol. 2004;24:3682–3691. doi: 10.1128/MCB.24.9.3682-3691.2004. [DOI] [PMC free article] [PubMed] [Google Scholar]
- Brimacombe KR, Ladd AN. Cloning and embryonic expression patterns of the chicken CELF family. Dev Dyn. 2007;236:2216–2224. doi: 10.1002/dvdy.21209. [DOI] [PubMed] [Google Scholar]
- Choi DK, Ito T, Tsukahara F, Hirai M, Sakaki Y. Developmentally-regulated expression of mNapor encoding an apoptosis-induced ELAV-type RNA binding protein. Gene. 1999;237:135–142. doi: 10.1016/s0378-1119(99)00312-1. [DOI] [PubMed] [Google Scholar]
- Choi DK, Yoo KW, Hong SK, Rhee M, Sakaki Y, Kim CH. Isolation and expression of Napor/CUG-BP2 in embryo development. Biochem Biophys Res Commun. 2003;305:448–454. doi: 10.1016/s0006-291x(03)00789-7. [DOI] [PubMed] [Google Scholar]
- Dasgupta T, Ladd AN. The importance of CELF control: molecular and biological roles of the CUG-BP, Elav-like family of RNA-binding proteins. Wiley Interdiscip Rev RNA. 2012;3:104–121. doi: 10.1002/wrna.107. [DOI] [PMC free article] [PubMed] [Google Scholar]
- Diez-Roux G, Banfi S, Sultan M, Geffers L, Anand S, Rozado D, Magen A, Canidio E, Pagani M, Peluso I, Lin-Marq N, Koch M, Bilio M, Cantiello I, Verde R, De Masi C, Bianchi SA, Cicchini J, Perroud E, Mehmeti S, Dagand E, Schrinner S, Nurnberger A, Schmidt K, Metz K, Zwingmann C, Brieske N, Springer C, Hernandez AM, Herzog S, Grabbe F, Sieverding C, Fischer B, Schrader K, Brockmeyer M, Dettmer S, Helbig C, Alunni V, Battaini MA, Mura C, Henrichsen CN, Garcia-Lopez R, Echevarria D, Puelles E, Garcia-Calero E, Kruse S, Uhr M, Kauck C, Feng G, Milyaev N, Ong CK, Kumar L, Lam M, Semple CA, Gyenesei A, Mundlos S, Radelof U, Lehrach H, Sarmientos P, Reymond A, Davidson DR, Dolle P, Antonarakis SE, Yaspo ML, Martinez S, Baldock RA, Eichele G, Ballabio A. A high-resolution anatomical atlas of the transcriptome in the mouse embryo. PLoS Biol. 2011;9:e1000582. doi: 10.1371/journal.pbio.1000582. [DOI] [PMC free article] [PubMed] [Google Scholar]
- Fardaei M, Larkin K, Brook JD, Hamshere MG. In vivo co-localisation of MBNL protein with DMPK expanded-repeat transcripts. Nucleic Acids Res. 2001;29:2766–2771. doi: 10.1093/nar/29.13.2766. [DOI] [PMC free article] [PubMed] [Google Scholar]
- Hamburger V, Hamilton HL. A series of normal stages in the development of the chick embryo. 1951. Dev Dyn. 1992;195:231–272. doi: 10.1002/aja.1001950404. [DOI] [PubMed] [Google Scholar]
- Huichalaf CH, Sakai K, Wang GL, Timchenko NA, Timchenko L. Regulation of the promoter of CUG triplet repeat binding protein, Cugbp1, during myogenesis. Gene. 2007;396:391–402. doi: 10.1016/j.gene.2007.04.022. [DOI] [PubMed] [Google Scholar]
- Iakova P, Wang GL, Timchenko L, Michalak M, Pereira-Smith OM, Smith JR, Timchenko NA. Competition of CUGBP1 and calreticulin for the regulation of p21 translation determines cell fate. Embo J. 2004;23:406–417. doi: 10.1038/sj.emboj.7600052. [DOI] [PMC free article] [PubMed] [Google Scholar]
- Kalsotra A, Xiao X, Ward AJ, Castle JC, Johnson JM, Burge CB, Cooper TA. A postnatal switch of CELF and MBNL proteins reprograms alternative splicing in the developing heart. Proc Natl Acad Sci U S A. 2008;105:20333–20338. doi: 10.1073/pnas.0809045105. [DOI] [PMC free article] [PubMed] [Google Scholar]
- Ladd AN. CUG-BP, Elav-like familiy (CELF)-mediated alternative splicing in the brain during health and disease. Mol Cell Neurosci. doi: 10.1016/j.mcn.2012.12.003. In press. [DOI] [PMC free article] [PubMed] [Google Scholar]
- Ladd AN, Charlet N, Cooper TA. The CELF family of RNA binding proteins is implicated in cell-specific and developmentally regulated alternative splicing. Mol Cell Biol. 2001;21:1285–1296. doi: 10.1128/MCB.21.4.1285-1296.2001. [DOI] [PMC free article] [PubMed] [Google Scholar]
- Ladd AN, Cooper TA. Multiple domains control the subcellular localization and activity of ETR-3, a regulator of nuclear and cytoplasmic RNA processing events. J Cell Sci. 2004;117:3519–3529. doi: 10.1242/jcs.01194. [DOI] [PubMed] [Google Scholar]
- Ladd AN, Nguyen NH, Malhotra K, Cooper TA. CELF6, a member of the CELF family of RNA-binding proteins, regulates muscle-specific splicing enhancer-dependent alternative splicing. J Biol Chem. 2004;279:17756–17764. doi: 10.1074/jbc.M310687200. [DOI] [PubMed] [Google Scholar]
- Ladd AN, Stenberg MG, Swanson MS, Cooper TA. Dynamic balance between activation and repression regulates pre-mRNA alternative splicing during heart development. Dev Dyn. 2005;233:783–793. doi: 10.1002/dvdy.20382. [DOI] [PubMed] [Google Scholar]
- Lemasters KE, Blech-Hermoni Y, Stillwagon SJ, Vajda NA, Ladd AN. Loss of muscleblind-like 1 promotes invasive mesenchyme formation in endocardial cushions by stimulating autocrine TGFbeta3. BMC Dev Biol. 2012;12:22. doi: 10.1186/1471-213X-12-22. [DOI] [PMC free article] [PubMed] [Google Scholar]
- Levers TE, Tait S, Birling MC, Brophy PJ, Price DJ. Etr-r3/mNapor, encoding an ELAV-type RNA binding protein, is expressed in differentiating cells in the developing rodent forebrain. Mech Dev. 2002;112:191–193. doi: 10.1016/s0925-4773(01)00643-8. [DOI] [PubMed] [Google Scholar]
- Li D, Bachinski LL, Roberts R. Genomic organization and isoform-specific tissue expression of human NAPOR (CUGBP2) as a candidate gene for familial arrhythmogenic right ventricular dysplasia. Genomics. 2001;74:396–401. doi: 10.1006/geno.2001.6558. [DOI] [PubMed] [Google Scholar]
- Magdaleno S, Jensen P, Brumwell CL, Seal A, Lehman K, Asbury A, Cheung T, Cornelius T, Batten DM, Eden C, Norland SM, Rice DS, Dosooye N, Shakya S, Mehta P, Curran T. BGEM: an in situ hybridization database of gene expression in the embryonic and adult mouse nervous system. PLoS Biol. 2006;4:e86. doi: 10.1371/journal.pbio.0040086. [DOI] [PMC free article] [PubMed] [Google Scholar]
- McKee AE, Minet E, Stern C, Riahi S, Stiles CD, Silver PA. A genome-wide in situ hybridization map of RNA-binding proteins reveals anatomically restricted expression in the developing mouse brain. BMC Dev Biol. 2005;5:14. doi: 10.1186/1471-213X-5-14. [DOI] [PMC free article] [PubMed] [Google Scholar]
- Michalowski S, Miller JW, Urbinati CR, Paliouras M, Swanson MS, Griffith J. Visualization of double-stranded RNAs from the myotonic dystrophy protein kinase gene and interactions with CUG-binding protein. Nucleic Acids Res. 1999;27:3534–3542. doi: 10.1093/nar/27.17.3534. [DOI] [PMC free article] [PubMed] [Google Scholar]
- Mukhopadhyay D, Jung J, Murmu N, Houchen CW, Dieckgraefe BK, Anant S. CUGBP2 plays a critical role in apoptosis of breast cancer cells in response to genotoxic injury. Ann N Y Acad Sci. 2003;1010:504–509. doi: 10.1196/annals.1299.093. [DOI] [PubMed] [Google Scholar]
- Ramalingam S, Natarajan G, Schafer C, Subramaniam D, May R, Ramachandran I, Queimado L, Houchen CW, Anant S. Novel intestinal splice variants of RNA-binding protein CUGBP2: isoform-specific effects on mitotic catastrophe. Am J Physiol Gastrointest Liver Physiol. 2008;294:G971–981. doi: 10.1152/ajpgi.00540.2007. [DOI] [PMC free article] [PubMed] [Google Scholar]
- Schneider CA, Rasband WS, Eliceiri KW. NIH Image to ImageJ: 25 years of image analysis. Nat Methods. 2012;9:671–675. doi: 10.1038/nmeth.2089. [DOI] [PMC free article] [PubMed] [Google Scholar]
- Suzuki H, Maegawa S, Nishibu T, Sugiyama T, Yasuda K, Inoue K. Vegetal localization of the maternal mRNA encoding an EDEN-BP/Bruno-like protein in zebrafish. Mech Dev. 2000;93:205–209. doi: 10.1016/s0925-4773(00)00270-7. [DOI] [PubMed] [Google Scholar]
- Takahashi N, Sasagawa N, Usuki F, Kino Y, Kawahara H, Sorimachi H, Maeda T, Suzuki K, Ishiura S. Coexpression of the CUG-binding protein reduces DM protein kinase expression in COS cells. J Biochem. 2001;130:581–587. doi: 10.1093/oxfordjournals.jbchem.a003022. [DOI] [PubMed] [Google Scholar]
- Timchenko LT, Salisbury E, Wang GL, Nguyen H, Albrecht JH, Hershey JW, Timchenko NA. Age-specific CUGBP1-eIF2 complex increases translation of CCAAT/enhancer-binding protein beta in old liver. J Biol Chem. 2006;281:32806–32819. doi: 10.1074/jbc.M605701200. [DOI] [PubMed] [Google Scholar]
- Timchenko NA, Wang GL, Timchenko LT. RNA CUG-binding protein 1 increases translation of 20-kDa isoform of CCAAT/enhancer-binding protein beta by interacting with the alpha and beta subunits of eukaryotic initiation translation factor 2. J Biol Chem. 2005;280:20549–20557. doi: 10.1074/jbc.M409563200. [DOI] [PubMed] [Google Scholar]
- Timchenko NA, Welm AL, Lu X, Timchenko LT. CUG repeat binding protein (CUGBP1) interacts with the 5′ region of C/EBPbeta mRNA and regulates translation of C/EBPbeta isoforms. Nucleic Acids Res. 1999;27:4517–4525. doi: 10.1093/nar/27.22.4517. [DOI] [PMC free article] [PubMed] [Google Scholar]
- Willems E, Leyns L, Vandesompele J. Standardization of real-time PCR gene expression data from independent biological replicates. Anal Biochem. 2008;379:127–129. doi: 10.1016/j.ab.2008.04.036. [DOI] [PubMed] [Google Scholar]
- Wu J, Li C, Zhao S, Mao B. Differential expression of the Brunol/CELF family genes during Xenopus laevis early development. Int J Dev Biol. 2010;54:209–214. doi: 10.1387/ijdb.082685jw. [DOI] [PubMed] [Google Scholar]