

Abstract
Quantitative measurement of the dynamic longitudinal cortex development during early postnatal stages is of great importance to understand the early cortical structural and functional development. Conventional methods usually reconstruct the cortical surfaces of longitudinal images from the same subject independently, which often generate longitudinally-inconsistent cortical surfaces and thus lead to inaccurate measurement of cortical changes, especially for vertex-wise mapping of cortical development. This paper aims to address this problem by presenting a method to reconstruct temporally-consistent cortical surfaces from longitudinal infant brain MR images, for accurate and consistent measurement of the dynamic cortex development in infants. Specifically, the longitudinal development of the inner cortical surface is first modeled by a deformable growth sheet with elasto-plasticity property to establish longitudinally smooth correspondences of the inner cortical surfaces. Then, the modeled longitudinal inner cortical surfaces are jointly deformed to locate both inner and outer cortical surfaces with a spatial-temporal deformable surface method. The method has been applied to 13 healthy infants, each with 6 serial MR scans acquired at 2 weeks, 3 months, 6 months, 9 months, 12 months and 18 months of age. Experimental results showed that our method with the incorporated longitudinal constraints can reconstruct the longitudinally-dynamic cortical surfaces from serial infant MR images more consistently and accurately than the previously published methods. By using our method, for the first time, we can characterize the vertex-wise longitudinal cortical thickness development trajectory at multiple time points in the first 18 months of life. Specifically, we found the highly age-related and regionally-heterogeneous developmental trajectories of the cortical thickness during this period, with the cortical thickness increased most from 3 to 6 months (16.2%) and least from 9 to 12 months (less than 0.1%). Specifically, the central sulcus only underwent significant increase of cortical thickness from 6 to 9 months and the occipital cortex underwent significant increase from 0 to 9 months, while the frontal, temporal and parietal cortices grew continuously in this first 18 months of life. The adult-like spatial patterns of cortical thickness were generally present at 18 months of age. These results provided detailed insights into the dynamic trajectory of the cortical thickness development in infants.
Keywords: Infant, longitudinal development, cortical surface reconstruction, cortical thickness, cortical folding
1. Introduction
The human cerebral cortex develops from a smooth neural tube into a highly folded and complex structure (Nie et al., 2012), with extensive forming of cortical folding during the third trimester (Chi et al., 1977; Dubois et al., 2008). At term birth, all primary and secondary foldings of the human cerebral cortex have been well established (Chi et al., 1977; Dubois et al., 2008; Hill et al., 2010a), although the cortical surface area is only one-third of that of the adult brain (Hill et al., 2010a). Also, after term birth, the primary and secondary cortical foldings are well preserved during the postnatal cortex development, while the cortex size and some tertiary folding structures are still undergoing dynamic development, especially in the first year of life (Li et al., 2013a; Nie et al., 2012; Shi et al., 2010a; Shi et al., 2011). For example, the cortical surface area expands 1.8 times (Li et al., 2013a) and the cortical gray matter volume doubles (Gilmore et al., 2012) during the first year of life. Quantitative measurement of the dynamic cortex development during this critical stage is of vital importance to understand the normal cortical structural development and its relationship to the high-level functional development (Gilmore et al., 2012; Knickmeyer et al., 2008).
In studying the dynamic cortex development in infants, the reconstruction of cortical surfaces from longitudinal infant brain MR images plays a vital role. In contrast to volume-based analysis, cortical surface-based methods are well-suited for studying the highly convoluted cerebral cortex, as these methods respect the topology of the cortex and facilitate the analysis and visualization of buried sulcal regions (Dale et al., 1999; Van Essen, 2005). Therefore, cortical surfaces have been widely used for measuring anatomical attributes of the cortex, such as surface area (Hill et al., 2010b; Li et al., 2013a), cortical thickness (Fischl and Dale, 2000; Xue et al., 2007), sulcal depth (Hill et al., 2010a; Li et al., 2013b), cortical folding (Awate et al., 2010; Dubois et al., 2008; Li et al., 2010b; Nie et al., 2012; Zhang et al., 2009), and gyrification index (Schaer et al., 2008), as well as for performing surface-based registration/parcellation (Fischl et al., 1999; Li et al., 2009, 2010a; Li and Shen, 2011; Liu et al., 2004; Van Essen, 2004; Yeo et al., 2010) and the functional mapping (Van Essen et al., 1998). Many methods have been developed for reconstruction of cortical surfaces from brain MR images (Dale et al., 1999; Han et al., 2004; Joshi et al., 1999; Kim et al., 2005; Liu et al., 2008; MacDonald et al., 2000; Shattuck and Leahy, 2002; Shi et al., 2013; Van Essen et al., 2001; Xu et al., 1999; Xue et al., 2007), however, these methods were mainly designed for working on a single MR image in the cross-sectional studies.
Recently, longitudinal analysis has become increasingly important in studying normal brain development and neurodevelopmental disorders using serial MR images (Almli et al., 2007; Fan et al., 2011; Geng et al., 2012; Gilmore et al., 2012; Li et al., 2013a; Nie et al., 2013; Nie et al., 2012; Schumann et al., 2010). Compared to cross-sectional studies, longitudinal studies can reduce the confounding effect of between-subject variability and increase statistical power, as well as capture individual temporal trajectories of the underlying biological processes (Bernal-Rusiel et al., 2012). However, applying the cortical surface reconstruction methods developed for cross-sectional studies independently to each time-point image in the longitudinal study will likely generate longitudinally-inconsistent cortical surfaces, and thus lead to inaccurate measurements of cortical changes. This may become more serious in vertex-wise mapping of cortical changes, due to the potential inconsistency of many sub-steps in the sophisticated cortical surface reconstruction pipelines, such as tissue segmentation, topology correction, surface tessellation, and surface evolution (Li et al., 2012a). To this end, recently several methods have been proposed for the reconstruction of consistent cortical surfaces from the serial adult MR images with subtle longitudinal changes (Li et al., 2012a; Nakamura et al., 2011; Reuter et al., 2012). For example, in the longitudinal pipeline of FreeSurfer, a within-subject template is first built by rigidly aligning all longitudinal images of same subject to a mean or median image, and then the cortical surfaces of the within-subject template are reconstructed, which will be rigidly transformed back to the space of each longitudinal image as an initialization and further evolved independently towards the reconstruction of longitudinal cortical surfaces (Reuter et al., 2012). Although this strategy might be suitable for adult brain MR images, it becomes problematic when applied to the longitudinal infant brain MR images with dynamic longitudinal cortex changes. In addition, all longitudinal cortical surfaces of the same infant need to be normalized onto a common space for measuring longitudinal development. This is typically performed by feature-driven surface registration methods, which may lead to temporally inconsistent or even bumpy correspondences especially in the flat cortical surface regions with no distinctive geometric features, and thus eventually affect the accurate and consistent measurement of the dynamic cortical development (Nie et al., 2012).
To deal with these issues, in our previous work (Nie et al., 2012), we have developed a computational cortical growth model for consistent, accurate modeling and measurement of dynamic cortex development using longitudinal MR images in the first year of life. Specifically, in our cortical growth model, the cerebral cortex is represented by its inner cortical surface (white-gray matter interface), and its growth is modeled by a deformable elasto-plasticity sheet with the guidance from the cortical surface at the later developmental stage (Nie et al., 2012). However, one notable limitation in this method is that, since only the inner cortical surface is adopted to represent and model the cerebral cortex development, certain important anatomical attributes of the cortex could not be derived in this model. For example, the cortical thickness, which reflects the underlying microstructure changes of the cortex and is associated with many neurodevelopmental disorders and cognitive functioning, is normally defined relying on both inner and outer cortical surfaces (Fischl and Dale, 2000) and thus cannot be measured (Nie et al., 2012).
In order to accurately and consistently measure the longitudinal development of cortex attributes that are related to the outer cortical surface in infants, in this paper, by taking advantage of the cortical growth model (Nie et al., 2012), we propose a spatial-temporal deformable surface method for consistent reconstruction of both inner and outer cortical surfaces from longitudinal infant brain MR images in the first 18 months. Given the longitudinally-consistent tissue segmentation results of infant brain MR images (Wang et al., 2012), our method consists of the following two major steps as shown in Fig. 1. First, the longitudinal growth model of the inner cortical surface is built by a deformable sheet with the elasto-plasticity property to establish longitudinally-consistent vertex-wise correspondences of the dynamic inner cortical surfaces. Second, the modeled longitudinal inner cortical surfaces are used to initialize all longitudinal inner and outer cortical surfaces and then all longitudinal cortical surfaces are jointly deformed with a spatial-temporal deformable surface method to reconstruct the longitudinally-consistent inner and outer cortical surfaces. The advantage of the proposed method for longitudinal infant cortical surface reconstruction is that all longitudinal inner and outer cortical surfaces of the same infant have the same triangular mesh configurations, and thus both temporal and inner-to-outer surface correspondences are naturally established, importantly for accurate and consistent measurement of dynamic cortex development.
Fig. 1.
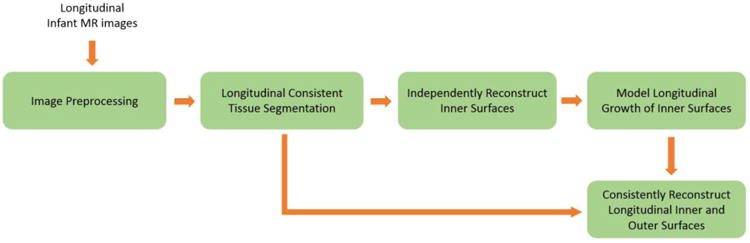
Flowchart of the proposed method for consistent reconstruction of longitudinal dynamic cortical surfaces from infant serial brain MR images.
2. Materials and Methods
2. 1 Subjects
The Institutional Review Board of the University of North Carolina (UNC) School of Medicine approved this study. Pregnant mothers were recruited during the second trimester of pregnancy from the UNC hospitals. Informed consent was obtained from both parents. Exclusion criteria included abnormalities on fetal ultrasound, or major medical or psychotic illness in the mother. Infants in the study cohort were free of congenital anomalies, metabolic disease, and focal lesions. No sedation was employed and all subjects were imaged during natural sleep. A physician or nurse was present during each scan, and a pulse oximeter was used to monitor heart rate and oxygen saturation. A total of 37 healthy infants were recruited to undergo a longitudinal MR imaging study of early brain development, where each infant was planned to be scanned every 3 months from birth till year 1 and again at 18 months. So far, 14 subjects completed all 6 time points, where one subject exhibited severe motion related artifacts and was removed from study. Thus, the proposed method were applied to 13 healthy infants (9 males/4 females), each with 6 serial brain MR scans (acquired at 2 weeks, 3, 6, 9, 12 and 18 months, respectively).
2.2 Image Acquisition
Longitudinal T1, T2, and diffusion-weighted MR images of infants were acquired using a 3T Siemens scanner (TIM TRIO, Siemens) with a 32 channel head coil, allowing parallel imaging to shorten acquisition time. T1 images (160 axial slices) were acquired with the following imaging parameters: Time to Repeat [TR] = 1900ms, Time to Echo [TE] = 4.38 ms, flip angle = 7, acquisition matrix = 256 × 256, voxel resolution = 1 × 1 × 1 mm3 and field of view (FOV) = 256 × 256 mm2. T2 images (70 axial slices) were acquired with the imaging parameters: TR/TE = 7380/119 ms, flip angle = 150, acquisition matrix = 256 × 128, voxel resolution = 1.25 × 1.25 × 1.95 mm3, and FOV = 320 × 160 mm2. Diffusion-weighted images (60 axial slices) were acquired with the imaging parameters: TR/TE = 7680/82 ms, acquisition matrix = 128 × 96, voxel resolution = 2 × 2 × 2 mm3, FOV = 256 × 192 mm2, 42 non-collinear diffusion gradients, and diffusion weighting b =1000s/mm2.
2.3 Image Preprocessing
The diffusion tensor images were reconstructed and the respective fractional anisotropy (FA) images were computed (Wang et al., 2012; Yap et al., 2011). T2 image and FA image were rigidly aligned onto their T1 image and further resampled to 1 × 1 × 1 mm3 using FLIRT in FSL (Smith et al., 2004). Specifically, T2 images were first linearly aligned to their respective T1 images based on normalized mutual information. Then FA images were linearly aligned to the warped T2 images. All alignments were visually inspected to ensure the quality. For each set of aligned T1, T2, and FA images, non-cerebral tissues, such as skull, brain stem and cerebellum, were removed by using iBEAT (Dai et al., 2012). Specifically, the skull stripping was performed by a learning-based infant-specific method (Shi et al., 2012). The brain stem and cerebellum were removed by registration of an atlas with the subject image using in-house developed registration methods (Shen et al., 1999; Wu et al., 2006; Xue et al., 2006). Intensity inhomogeneity correction was performed by N3 (Sled et al., 1998). All longitudinal images of the same infant were then rigidly aligned using FLIRT in FSL (Smith et al., 2004). Longitudinally-consistent brain tissue segmentation was performed by an infant-specific 4D level-set method by combining the complementary information from T1, T2 and FA images (Wang et al., 2012). After tissue segmentation, non-cortical structures were masked and filled. Due to extremely severe partial volume effects in small-sized infant brain MR images, tissue segmentation method is unable to resolve deep tight sulci, which often leads to inaccurate estimation of outer cortical surfaces. Therefore, we adopted the anatomically consistent enhancement (ACE) method (Han et al., 2004) to generate a no-more-than-one-voxel thick separation between the opposite sulcal gray-matter banks for recovering the issue of deep tight sulci.
2.4 Longitudinal Inner Cortical Surface Growth Modeling
The longitudinal inner cortical surface growth modeling of the infant is based on our previously published method (Nie et al., 2012), which is described here in short. To build the longitudinal growth model, we first independently reconstruct the inner cortical surface of each longitudinal MR image, referred to as independently-reconstructed inner cortical surfaces. Specifically, the white matter is first topologically corrected to ensure a spherical topology, and then the corrected white matter is tessellated to form a triangulated surface mesh (Li et al., 2013a). The independently-reconstructed outer cortical surfaces were generated by deforming the independently-reconstructed inner cortical surfaces using the external force and spatial internal force, which will be defined in Section 2.5. We then determine the approximate correspondences of surface vertices between each pair of successive inner cortical surfaces using a hybrid nonlinear volumetric/surface warping method (Liu et al., 2004; Shen and Davatzikos, 2002). Lastly, we build the longitudinal inner cortical surface growth model based on the cortical surface registration results, referred to as modeled longitudinal inner cortical surfaces. In our cortical growth model, the cerebral cortex is represented by its inner surface, which is a fundamentally important surface through which all anatomical connections between cortex and deep brain structures must pass (Pienaar et al., 2008). The growth of the cortex is modeled by a deformable growth sheet with elasto-plasticity property under the guidance from cortical surfaces at later developmental stages, and also the constraint preventing mesh self-collision (Nie et al., 2010; Nie et al., 2012). By considering physical properties of the growing cortex, our cortical growth model estimates temporally more accurate and smoother trajectories of the longitudinal inner cortical surface vertices and the cortical folding measurements, compared to the surface-based registration method (Nie et al., 2012).
2.5 Longitudinal Inner and Outer Cortical Surface Reconstruction
The modeled longitudinal inner cortical surfaces in Section 2.4, which have the similar size and shape as the independently-reconstructed inner surface at each age and are all represented by the same triangular mesh configuration as the inner surface at 2 weeks, are adopted to initialize all longitudinal inner and outer cortical surfaces. Then, all initialized longitudinal cortical surfaces are jointly deformed using a spatial-temporal deformable surface method to reconstruct the longitudinal inner and outer cortical surfaces. The evolution of the spatial-temporal deformable surface is controlled by both internal and external forces:
| (1) |
where is the spatial position of a vertex at the longitudinal time t and surface evolution time τ. is the spatial internal force for spatial smoothness and defined as:
| (2) |
where is a spatially varying parameter, used to adaptively control the degree of spatial smoothness. indicates the tentatively smoothed vertex position by Taubin lambda-mu mesh smoothing filter, which repeatedly applies positive factor λ Laplacian smoothing, followed by negative factor Laplacian smoothing, with the constraint of −μ> λ > 0 (Taubin, 1995). In our implementation, λ and μ are experimentally set as 0.33 and -0.331 with 6 iterations, respectively. This strategy makes the cortical surface smooth, and meanwhile doesn't introduce the undesired effects of surface shrinking and over-smoothing, in contrast to the use of conventional Laplacian smoothing or spring energy term, whose effects have already been noticed in (Fischl, 2012). At the bottoms of recovered sulci, outer cortical surfaces are extremely sharply bended with the two opposite sulcal banks closely approaching together in infant brain MR images as shown in Fig. 2. Therefore, applying Taubin lambda-mu mesh smoothing filter could drive the outer cortical surface away from sulcal bottoms. To deal with this issue, are adaptively set as small values at sharply-bended cortical regions, such as the recovered sulcal bottoms.
Fig. 2.
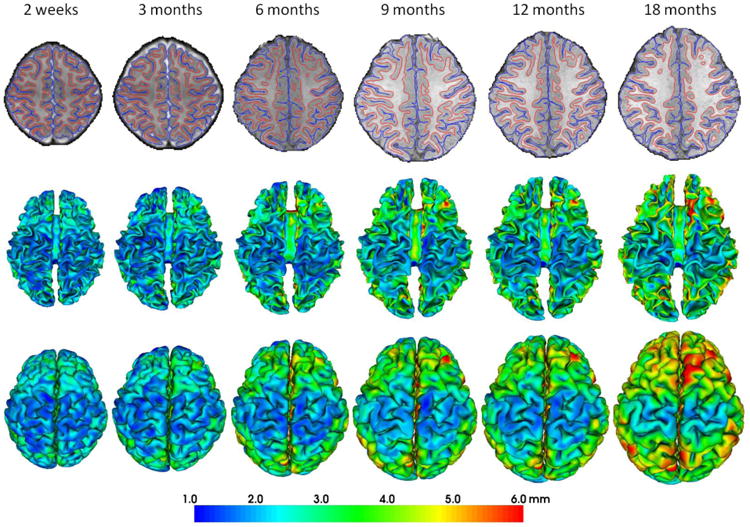
Reconstructed longitudinal inner and outer cortical surfaces of a representative infant from 2 weeks to 18 months of age by the proposed method. The first row shows the longitudinal inner (red curves) and outer (blue curves) cortical surfaces embedded in their respective image spaces. The second and third rows show the longitudinal inner and outer surfaces, respectively, color-coded by the cortical thickness.
Given a set of all edges connecting to vertex , we denote as the minimum of the dot product of the normal directions of the two triangles sharing an edge among the edge set. We also denote as the indicator function of the recovered sulci obtained in Section 2.3. Thus, is defined as:
| (3) |
At the recovered sulcal bottoms, where outer cortical surfaces are sharply bended, will be close to -1.0 and thus will be close to 0. On the other hand, at the flat sulcal banks in the recovered sulci, and will be close to α.
To account for the nonlinear and dynamic cortical development during different stages in infants, by taking advantage of the modeled longitudinal inner cortical surfaces, the temporal internal force for temporal consistency is defined spatially and temporally adaptively as:
| (4) |
where the parameter β controls the degree of temporal smoothness of vertex trajectories. Note that the temporal internal force is not applicable to the first and last time points. indicates the vertex cposition at time point t in the modeled longitudinal inner surfaces as described in Section 2.4, where the vertex trajectories are temporally smooth. The temporal internal force is formulated as a constraint by requiring that the deformations from longitudinal time points t − 1 to t and from to t + 1 on the consistently reconstructed longitudinal cortical surfaces should resemble the corresponding deformations in the modeled longitudinal inner surfaces in Section 2.4.
The external force , which is derived from the image at longitudinal time point t and drives thec deformable surface towards the target surfaces, comprises the forces activated inside of gray matter, recovered sulci, and other tissues. Denote and as gray matter (GM) and white matter (WM) indicator functions, respectively. Also denote , and as the forces activated inside of gray matter, recovered sulci, and other tissues (white matter and CSF), respectively. The external force is thus set as:
| (5) |
As mentioned in Section 2.3, due to extremely severe partial volume effects in small-sized infant brain MR images, tissue segmentation method is unable to resolve deep tight sulci. Thus, for reconstruction of the outer cortical surface, a no-more-than-one-voxel thick separation is recovered in deep tight sulci (Han et al., 2004). However, it should be noted that the interface between GM and recovered sulci does not necessarily indicate the outer cortical surface. Therefore, in the recovered sulci, the outer cortical surface will continue to evolve until the opposite sulcal banks closely approaching each other, while still being free of mesh self-intersection, to locate the outer cortical surface. The force activated in the recovered sulci for reconstructions of inner and outer surfaces is accordingly set as:
| (6) |
| (7) |
where is the outward-oriented unit normal and is the force strength. For inner and outer cortical surface reconstruction, is set as the distance along the direction of to the WM/GM and GM/sulci interfaces, respectively. The force activated at other tissues is set as:
| (8) |
For inner surface reconstruction, is the distance along the direction of to the WM/GM interface. For outer surface reconstruction, is the distance along the direction of to the GM/CSF or GM/sulci interfaces.
On the other hand, is derived from Laplace's equation of the GM. By setting WM as the minimal value, and both CSF and recovered sulci as the maximal value, the Laplace's equation is solved to obtain the harmonic function, which establishes a one-to-one correspondence between WM/GM and GM/CSF or GM/sulci interfaces (Jones et al., 2000). Importantly, the streamlines of the harmonic function never intersect each other, which help to preserve the topology of the surface mesh during its evolution. Denote the normalized gradient vector field of the harmonic function as , and also denote the streamline lengths from a vertex in GM to WM/GM and GM/CSF (or GM/sulci) interfaces as and respectively. We define for reconstructions of inner and outer surfaces, respectively, as:
| (9) |
| (10) |
The central idea is that should point towards the target surface with the strength directly proportional to the distance to the target surface (Li et al., 2012a).
For cortical surface reconstruction, it is always important to prevent surface meshes from self-intersection during the surface evolution. Therefore, a fast triangle-triangle intersection detection method is performed in local regions as similarly done in FreeSurfer (Fischl, 2012). Specifically, in each step of the surface evolution at each vertex, once any triangle-triangle intersection is detected in the tentatively evolved cortical surface, the deformation is reduced to a location with triangle-triangle intersection no longer existing. Fig. 2 shows the reconstructed longitudinal inner and outer cortical surfaces of a representative infant from 2 weeks to 18 months of age by the proposed method, color-coded by the cortical thickness. As can be seen, the reconstructed longitudinal infant cortical surfaces are visually quite reasonable to reflect the highly convoluted cortical folding as well as the dynamic increase trend of the cortical thickness and surface area.
3. Results
Our method has been applied to 13 healthy infants, each with longitudinal brain MR images acquired at 2 weeks, 3, 6, 9, 12 and 18 months. Both qualitative and quantitative validations were used to demonstrate its performance. In all experiments, we used same surface evolution steps with the parameters set experimentally as: α=0.06, β=0.006 and γ=0.06. On average, our method took around 5.5 hours (with about 600 iterations) on a standard PC with Intel Xeon 2.26 GHz CPU and 4 GB memory, to reconstruct all longitudinal inner and outer cortical surfaces of 6 time points for each infant.
3.1 Validation of Accuracy
Visual inspection
To further demonstrate longitudinal dynamic infant cortical surfaces, Fig. 3 showed the reconstructed longitudinal outer cortical surfaces of 6 randomly selected infants by the proposed method, color-coded by the cortical thickness. As we can see, the reconstructed longitudinal infant outer cortical surfaces of these infants consistently reflected the highly convoluted cortical folding as well as the dynamical growing trajectories of both cortical thickness and surface area during the early postnatal brain development.
Fig. 3.
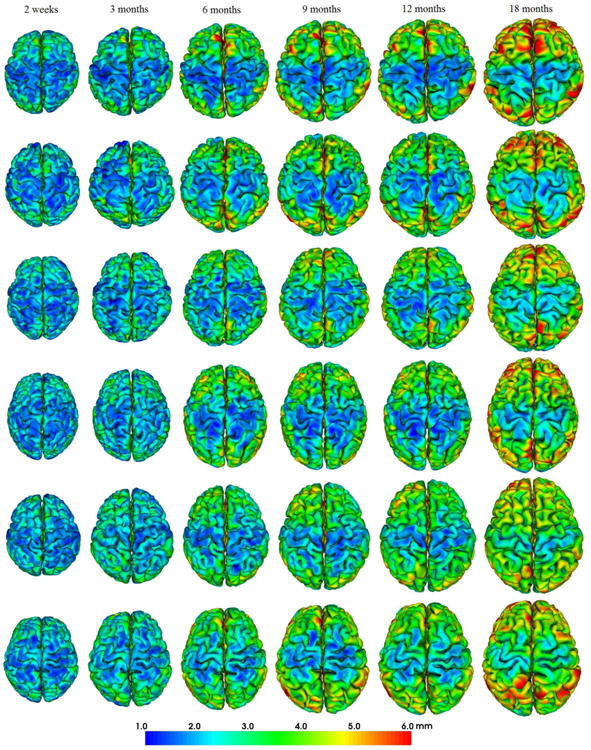
Reconstructed longitudinal outer surfaces of 6 randomly selected infants by the proposed method, each from 2 weeks to 18 months of age, color-coded by the cortical thickness. Each row indicates one infant.
Validation using tissue segmentation results
To validate the accuracy of the reconstructed longitudinal cortical surfaces, we first compared the voxels labeled as GM in the tissue segmented image (denoted as A) with the voxels enclosed by the reconstructed inner and outer cortical surfaces (denoted as B), as did in (Lee et al., 2006; Li et al., 2012a). Three measurements were calculated, including (1) true positive: A ∩ B, (2) false negative: (A ∩ B̄, and (3) false positive: (Ā ∩ B)/A. We calculated these measurements on both the cortical surfaces reconstructed by the proposed method and the cortical surfaces reconstructed independently in Section 2.4. Note that those independently-reconstructed outer cortical surfaces were obtained by deforming the independently-reconstructed inner surfaces in Section 2.4 using the same external force and spatial internal forced as defined in Section 2.5. Fig. 4 provided the average true positive, false positive, and false negative of enclosed voxels by (1) the reconstructed inner and outer surfaces using the proposed method and (2) the independently-reconstructed inner and outer surfaces, compared with their respective GM voxels on the 13 infants. On the cortical surfaces reconstructed by the proposed method, the average true positive, false negative, and false positive were 0.833±0.015, 0.167±0.015 and 0.095±0.023 in the 13 infants, respectively. While, on the independently-reconstructed cortical surfaces, the average true positive, false negative, and false positive were 0.835±0.014, 0.165±0.014 and 0.094±0.022, respectively. As we can see, both methods achieved high accuracy, indicating the validity of the external force and spatial internal force defined in Section 2.5. Although the performance of the independently-reconstructed surfaces seemed slightly better than that of the reconstructed longitudinal surfaces by the proposed method, this difference was statistically nonsignificant (p-value > 0.1).
Fig. 4.
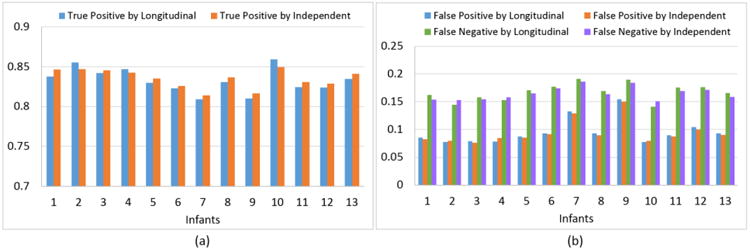
Average true positive (a), false positive and false negative (b) of enclosed voxels by the reconstructed inner and outer cortical surfaces using the proposed method and also the independently-reconstructed inner and outer surfaces, compared with their respective GM voxels on the 13 infants.
Validation using independently-reconstructed cortical surfaces
To further evaluate the proposed method, following the strategy in (Nie et al., 2012), we compared the reconstructed longitudinal inner and outer surfaces by the proposed method with their respective independently-reconstructed inner and outer surfaces, using their bidirectional surface distances. Despite lacking longitudinal consistency, the independently-reconstructed longitudinal inner and outer surfaces have reasonable accuracy to some extent, therefore, we expected that the reconstructed longitudinal inner and outer surfaces by the proposed method will not have large deviations from the independently-reconstructed inner and outer surfaces. We also compared the modeled longitudinal inner cortical surfaces (Nie et al., 2012) in Section 2.4 with the independently-reconstructed inner surfaces. Fig. 5 showed the vertex-wise bidirectional surface distances of modeled longitudinal inner surfaces and the reconstructed longitudinal inner and outer surfaces by the proposed method, compared with their independently-reconstructed cortical surfaces, from 3 to 18 months of age in a representative infant. Fig. 6 provided the average values of the bidirectional surface distances between the reconstructed surfaces by the proposed method and the independently-reconstructed surfaces for each of 13 infants aged from 3 to 18 months. Of note, in the proposed method, the modeled longitudinal inner cortical surfaces, which have the similar size and shape as the independently-reconstructed inner surface at each age and are all represented by the same triangular mesh configuration as the inner surface at 2 weeks of age, were used to initialize all longitudinal inner and outer surfaces. During the surface evolution, the cortical surfaces at 2 weeks were not affected by other time points and thus kept same. Hence, we did not calculate the surface distances at 2 weeks. The average bidirectional surface distance of the modeled longitudinal inner surfaces was around 0.37±0.04mm, while the same values for the reconstructed longitudinal inner and outer surfaces by the proposed method were around 0.09±0.005mm and 0.21±0.02mm, respectively, indicating superior accuracy of the proposed method.
Fig. 5.
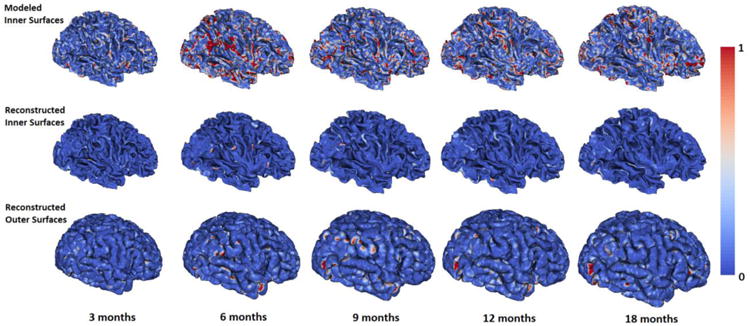
Modeled longitudinal inner surfaces, and our reconstructed longitudinal inner surfaces and outer surfaces of a representative infant from 3 to 18 months of age, all color-coded by bidirectional surface distances (mm) compared with their respective independently-reconstructed cortical surfaces.
Fig. 6.
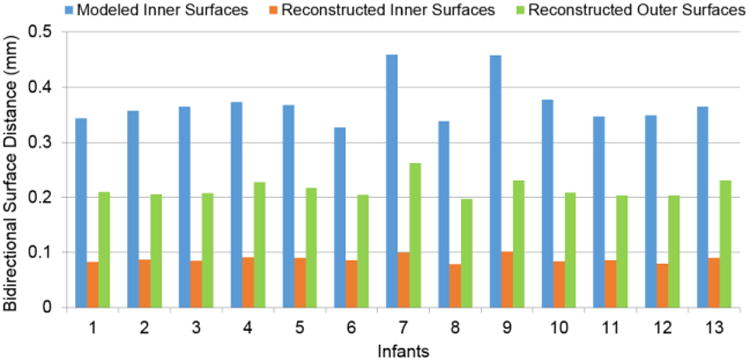
Average bidirectional surface distances for each of 13 infants aged from 3 to 18 months, by comparing the modeled longitudinal inner surfaces (Nie et al., 2012) and our reconstructed longitudinal inner and outer surfaces with their respective independently-reconstructed cortical surfaces.
Validation using simulated cortical surfaces
We also validated our method using simulated longitudinal infant image sequences, based on our reconstructed longitudinal inner and outer cortical surfaces, which were considered as the “ground-truth” cortical surfaces of the simulated image sequences. Specifically, we labeled all voxels inside of the inner cortical surface as WM, all voxels between the inner and outer cortical surfaces as GM, and all voxels between the outer cortical surface and skull as CSF. Then, we reconstructed longitudinal cortical surfaces from these simulated longitudinal image sequences by the proposed method and further compared with their respective “ground-truth” cortical surfaces. Fig. 7 showed an example of tissue labeling for the simulated infant image sequence from 2 weeks to 18 months of age. Fig. 8 showed the average values of bidirectional surface distance errors between the reconstructed surfaces by the proposed method and the “ground-truth” on both inner and outer surfaces at each time point, for each of 13 infants. On the inner cortical surfaces, the average bidirectional surface distance errors were 0.310 mm at 2 weeks, 0.326 mm at 3 months, 0.331 mm at 6 months, 0.333 mm at 9 months, 0.336 mm at 12 months and 0.340 mm at 18 months. On the outer cortical surfaces, these average errors were 0.282 mm at 2 weeks, 0.309 mm at 3 months, 0.336mm at 6 months, 0.342 mm at 9 months, 0.346 mm at 12 months and 0.363 at 18 months. In general, the average bidirectional surface distance errors gradually increased during the brain growth. Considering the resolution of 1.0 mm in our dataset, the average bidirectional surface distance error was around 1/3 voxel. Our results were comparable with the results reported in (Xue et al., 2007), where the surface distance errors were 0.73mm for the inner surfaces and 0.68 mm for the outer surfaces in neonatal MRI with the resolution of 0.86 mm, based on the landmark points placed by experts. In addition, we also calculated the percentage of vertices with the surface distance errors larger than 1 voxel at each time point of the simulated image sequences of 13 infants, as shown in Fig. 9. On the inner cortical surfaces, the percentages were consistently less than 0.5%. On the outer cortical surfaces, the average percentages were 1.0% at 2 weeks, 1.3% at 3 months, 2.0% at 6 months, 2.2% at 9 months, 2.4% at 12 months and 2.9% at 18 months, indicating the accuracy of the proposed method.
Fig. 7.
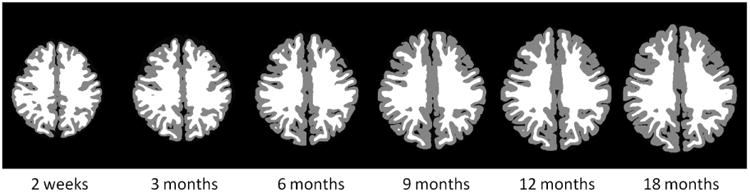
An example of tissue labeling for simulated infant image sequence in the first 18 months of age.
Fig. 8.
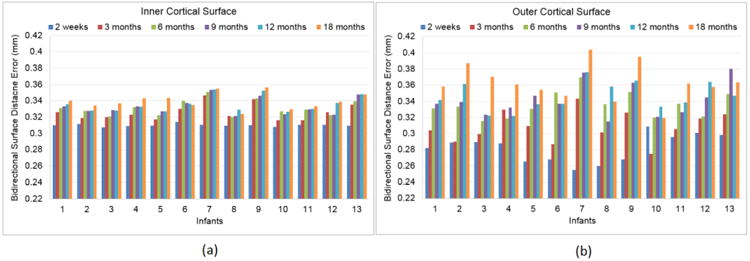
Average bidirectional surface distance errors of inner (a) and outer (b) surfaces at each time point of the simulated image sequences, compared with their corresponding “ground-truth” longitudinal cortical surfaces, for each of 13 infants.
Fig. 9.
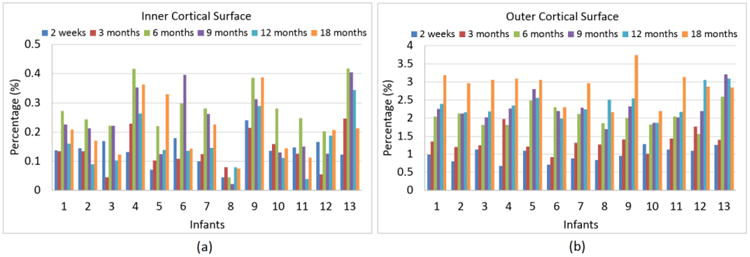
Percentages of vertices with the bidirectional surface distance errors larger than 1 voxel at each time point of the simulated image sequences, compared with their “ground-truth” cortical surfaces, for each of 13 infants. Panels (a) and (b) are results on the inner and outer cortical surfaces, respectively.
3.2 Validation of Consistency
To demonstrate the consistency, Fig. 10 provided the close-up views of representative examples of the reconstructed outer cortical surfaces from 2 weeks to 18 months by the proposed method and their corresponding independently-reconstructed cortical surfaces. It can be observed that the reconstructed longitudinal infant cortical surfaces by the proposed method have temporally more consistent cortical morphologies than the independently-reconstructed cortical surfaces. Moreover, by considering longitudinal constraint, our method can naturally produce the temporally smooth trajectories of vertices on cortical surfaces as shown in Fig. 11, compared to the proposed method without longitudinal constraint (by setting β=0), as well as the independently-reconstructed cortical surfaces with surface-based registration.
Fig. 10.
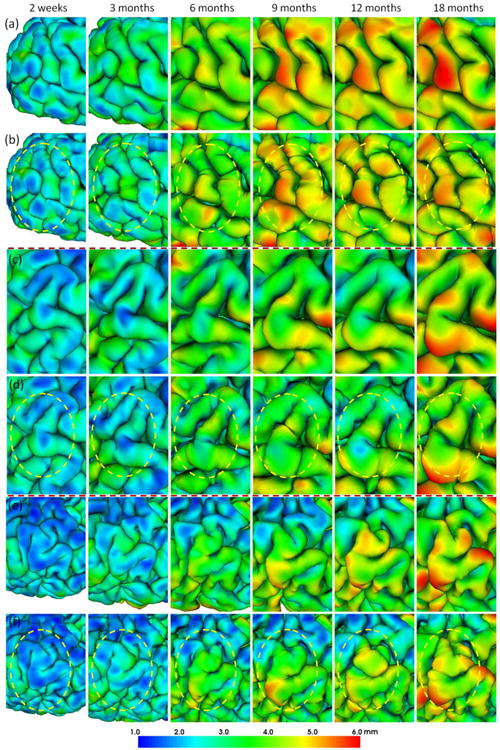
Visual comparison of (a, c, e) our reconstructed longitudinal infant outer cortical surfaces from 2 weeks to 18 months of age and (b, d, f) their corresponding independently-reconstructed outer cortical surfaces, all color-coded by their cortical thickness. The yellow circles highlight the temporally inconsistent cortical morphologies in the independently-reconstructed longitudinal surfaces.
Fig. 11.
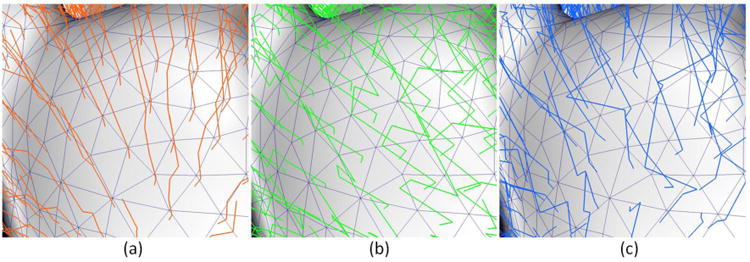
Representative temporal trajectories of vertices on the reconstructed outer cortical surfaces. (a) Proposed method; (b) Proposed method without longitudinal constraint; (c) Independently-reconstructed cortical surfaces with surface-based registration.
To quantitatively evaluate the temporal consistency, following the same strategy in (Nie et al., 2012), we performed the linear regression on the trajectory of spatial positions of each vertex of the reconstructed longitudinal outer cortical surfaces by the proposed method with and without longitudinal constraint, as well as on the independently-reconstructed outer cortical surfaces. The average residuals of the temporal vertex position regression in each infant by the 3 methods were provided in Fig. 12 (a). As can be seen, the residuals by the proposed method with longitudinal constraint were consistently smaller than those by the proposed method without longitudinal constraint and also the independently-reconstructed outer cortical surfaces, indicating the superior consistency of the temporal trajectories of vertex positions by the proposed method. Meanwhile, we also performed the linear regression on the trajectory of temporal vertex cortical thicknesses on the reconstructed longitudinal cortical surfaces by the 3 methods. Similarly, the average residuals of the cortical thickness regression of all vertices in each infant were provided in Fig. 12 (b). Again, as can be seen, the cortical thickness residuals by the proposed method with longitudinal constraint were consistently smaller than those by the proposed method without longitudinal constraint and the independently-reconstructed cortical surfaces, indicating the superior consistency of the temporal trajectory of cortical thickness by the proposed method.
Fig. 12.
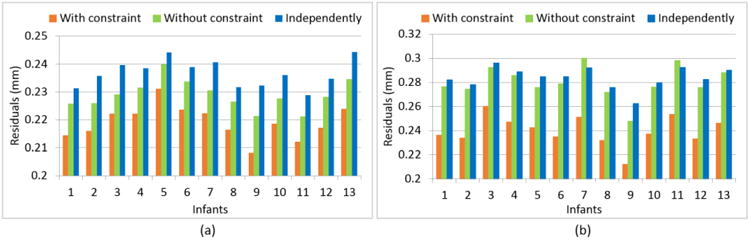
The average values of the regression residuals of (a) temporal vertex position trajectories and (b) temporal cortical-thickness trajectories of all vertices by 3 different methods in each of the 13 infants.
3.3 Application to Characterization of Cortical Thickness Development in Infants
In this section, we applied our method to study the longitudinal developmental trajectory of cortical thickness from 2 weeks to 18 months of age. To do this, we first warped the inner surfaces of all infants at 2 weeks of age to the inner surface of a representative infant at 2 weeks of age by using a surface-based registration method (Liu et al., 2004), and then mapped the longitudinal cortical thickness trajectories of each infant obtained by the proposed method onto the inner surface of the representative infant at 2 weeks of age. Fig. 13 shows the vertex-wise mapping of the average cortical thickness developmental trajectory of the 13 infants, with the top-right panel showing the mean value and standard deviation of the cortical thickness over the whole cortex at each age. As we can see from Fig. 13, the cortical thickness developed highly nonlinearly and dynamically in the first 18 months of life, with totally 40.7% increase from 2 weeks to 18 months. Overall, the cortical thickness increased moderately from birth to 3 months (5.5%), followed by a dramatic increase from 3 to 6 months (16.2%) and a moderate increase from 6 to 9 months (6.4%), then exhibited a stable period from 9 to 12 months (less than 0.1%), and finally showed another substantial increase from 12 to 18 months (7.9%).
Fig. 13.
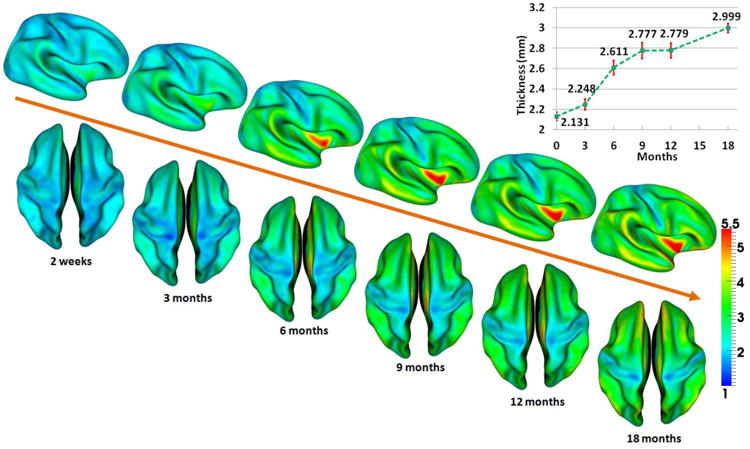
Vertex-wise mapping of the average developmental trajectory of the cortical thickness (mm) of 13 infants from 2 weeks to 18 months of age, obtained using our proposed method. Also, the mean value and standard deviation of cortical thickness at each age, obtained from 13 infants, are shown in the top-right panel.
To test the statistical significance of the cortical thickness development, we utilized the surface-based threshold-free cluster enhancement (TFCE) method with 5000 permutation tests (Hill et al., 2010a), originally developed for volumetric data (Smith and Nichols, 2009). We performed the TFCE on the cortical thicknesses between each pair of successive time points from 2 weeks to 18 months, with the results provided in Fig. 14. The statistically significant regions were highly related to the age. From 0 to 3 months, 3 to 6 months and 6 to 9 months, most cortical regions, except the central sulcus, were detected as the significant regions with cortical thickness increase. From 9 to 12 months and 12 to 18 months, a few cortical regions were detected as the significant regions with cortical thickness increase, including the prefrontal, parietal, superior temporal cortices and temporal pole. In addition, between 12 and 18 months, the precentral and postcentral gyri also showed significant increase. Interestingly, between 12 and 18 months, significant regions were largely concentrated in the cortical gyri, instead of sulci, indicating distinct developmental trajectories between gyri and sulci. As a result, during the first 18 months of life, the cortical thickness in the crests of gyri increased more than that in the fundi of sulci, leading to the higher thickness in the crests of gyri at 18 months of age. It should be noted that no region showed statistically significant decrease of cortical thickness during the first 18 months of life, indicating that the cortical thickness in each cortical region is still in the developmental stage. Overall, in the first 18 months, the temporal and frontal cortices exhibited more rapid increase of cortical thickness than the parietal and occipital cortices.
Fig. 14.
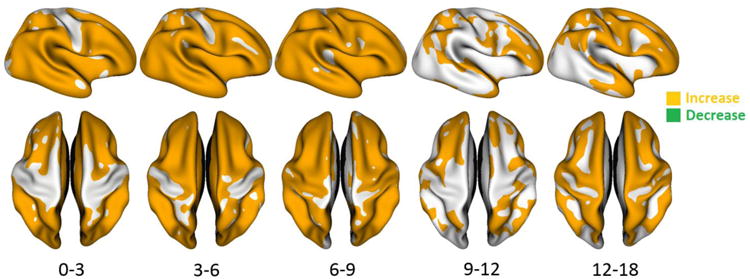
Regions with statistically-significant cortical-thickness increase between each pair of successive time points of 13 infants from 2 weeks to 18 months of age, using TFCE (p<0.05). No region showed the statistically significant decrease of cortical thickness during the first 18 months of life.
4. Discussion and Conclusion
To our knowledge, this paper presents the first method for reconstruction of longitudinally-consistent dynamic inner and outer cortical surfaces for the infant serial brain MR images. Previous methods for the longitudinal cortical surface reconstruction are mainly developed for the adults with subtle longitudinal changes, where the cortical surfaces of the mean or median image of the longitudinal images are first reconstructed and then rigidly placed to the space of each longitudinal image for initialization (Reuter et al., 2012). These strategies are, however, not suitable for the infant brain images with longitudinally-dynamic changes. For example, due to the dynamic growths of brain tissues and the dynamic changes of intensity appearance in MR images because of the ongoing white matter myelination, as shown in Fig. 2, the mean intensity image of longitudinal infant images might not be biologically meaningful. Meanwhile, the infant brain MR images at 6-9 months, corresponding to the median image in first 18 months, exhibit isointense tissue appearances and thus extremely low tissue contrast (Wang et al., 2012); hence the brain tissue segmentation and surface reconstruction results during this stage are less reliable than other stages in infants. To establish the longitudinally-dynamic cortical correspondences in infants, we take advantage of the infant cortical growth modeling, which generates temporally more accurate and smoother trajectories of longitudinal inner surface vertices than the surface-based registration method (Nie et al., 2012). These modeled longitudinal inner cortical surfaces, which have the similar size and shape as the independently-reconstructed inner surface at each age and are all represented by the same triangular mesh configuration as the inner surface at 2 weeks of age, are adopted to initialize all longitudinal inner and outer cortical surfaces and are further jointly deformed to reconstruct the longitudinally-consistent inner and outer cortical surfaces. The rationale is that all primary and secondary cortical foldings of the cortex have been established at term birth (Chi et al., 1977; Hill et al., 2010a), and are well preserved during the postnatal cortex development (Li et al., 2013a; Nie et al., 2012). Experimental results show both the accuracy and temporal consistency of the reconstructed longitudinal infant cortical surfaces by the proposed method.
Accurate brain tissue segmentation is essential and pivotal for accurate cortical surface reconstruction (Dale et al., 1999; Han et al., 2004; Liu et al., 2008; MacDonald et al., 2000; Van Essen et al., 2001; Xue et al., 2007). Segmentation of infant brain MR images is considerably more difficult that of the adult MR images, due to the low tissue contrast, high image noise, severe partial volume effect and ongoing white matter myelination in infants (Shi et al., 2010b; Wang et al., 2013; Xue et al., 2007). Therefore, independent segmentation of each image in serial infant brain MR images leads to inaccurate and temporally inconsistent results (Wang et al., 2012). To achieve accurate and temporally consistent segmentation of serial infant MR images, we adopted the infant-specific 4D level-set based method by combining longitudinal information and complementary information from T1, T2 and FA images (Wang et al., 2012), which greatly facilitated the reconstruction of the longitudinally-consistent cortical surfaces in infants.
In previous studies, Nie et al. (2012) investigated the development of regional cortical folding in the first year of life. Gilmore et al. (2012) studied the development of regional cortical volume from 0 to 1 and 1 to 2 years of age. However, as pointed out by recent studies, the cortical volume growth is jointly determined by the development of cortical thickness and surface area, which are driven by totally distinct cellular and genetic mechanisms (Chen et al., 2013; Panizzon et al., 2009). To further our understanding of fine-scaled cortex development, Li et al. (2013a) studied the expansion of vertex-wise cortical surface area from 0 to 1 and 1 to 2 years of age. This paper presents the vertex-wise dynamic developmental trajectory of the cortical thickness in-between the first 18 months of life. It is worth noting that cortical thickness is correlated with cognitive functions (Li et al., 2012b; Shaw et al., 2006; Zhang et al., 2012) and is found altered in many brain disorders (Rimol et al., 2012; Shaw et al., 2007; Zhang et al., 2011). Thus, quantitative measurement of the dynamic cortical thickness developmental trajectory during early brain development stage is of great importance in understanding both normal development and its relationship to the high-level functional and cognitive developments, as well as insightful understanding of neurodevelopmental disorders such as autism and schizophrenia (Knickmeyer et al., 2008).
For the first time, we have applied our method to study the vertex-wise cortical thickness developmental trajectory from 2 weeks to 18 months of age in the 13 infants. Our results indicate that the cortical thickness development is highly age-related and regional-specific during this period. Importantly, we revealed several hitherto unseen properties of cortical thickness development in the first 18 months of life, which include 1) The cortical thickness increases most from 3 to 6 months (16.2%) and least from 9 to 12 months (less than 0.1%); 2) From 0 to 3 months, 3 to 6 months and 6 to 9 months, most cortical regions, except the central sulcus, exhibit significant increasing of the cortical thickness; 3) From 9 to 12 and 12 to 18 months, only a few cortical regions are increased significantly with cortical thickness, mainly concentrated in the gyral regions of prefrontal, parietal, temporal, motor and sensory cortices, suggesting distinct developmental trajectories of the cortical thickness in sulci and gyri. In our previous study of vertex-wise cortical surface areal expansion between birth and 1 year of age, visual cortex, auditory cortex, and sensory cortex expanded more rapidly than motor cortex and association cortex (Li et al., 2013a). The distinct developmental patterns of the cortical thickness and cortical surface area during this period are likely associated with their distinct cellular and genetic mechanisms (Chen et al., 2013; Panizzon et al., 2009). Imaging studies of children and adolescents have found the regional heterogeneous trajectory of cortical thickness with the association cortices reaching peak values later than sensory and motor cortices (Shaw et al., 2008; Sowell et al., 2004). The cortical thickness development from 18 months to early childhood is largely unknown, and further studies of cortical thickness during this stage will help better understand the developmental trajectories of the cortical thickness.
We also found that the spatial distribution patterns of cortical thickness in adults (Economo and Parker, 1929; Fischl and Dale, 2000) were generally present at 18 months of age, with the temporal, superior frontal and orbitofrontal cortices exhibiting the largest cortical thickness, and also the sensory cortex and visual cortex showing the lowest cortical thickness. White matter studies showed rapid and tract-specific developmental trajectories of microstructures in the first 2 years (Geng et al., 2012), with much slow and gradual maturation thereafter. Functional MR imaging studies show that the resting-state networks are present in sensorimotor, visual, and auditory cortices (Fransson et al., 2011; Lin et al., 2008). The default network that involves inferior parietal, prefrontal, and temporal cortices does not fully develop until 2 years of age (Gao et al., 2009). All these results suggest that the fundamental structural and functional stage is largely established by 2 years of age, where abnormal structural and functional developments associated with neurodevelopmental disorder are also likely emerged or established.
A potential limitation of the proposed method is that it highly relies on the hard tissue segmentation results. Given the great challenges in accurate tissue segmentation of infant MR images, using the probability based tissue segmentation results may facilitate more accurate reconstruction of longitudinal infant cortical surfaces than using the hard tissue segmentation results, which will be investigated in our future work. Another issue is that our current infant cortex growth model could be potentially advanced by integration of white matter fibers from DTI data (Yap et al., 2011), which might provide improved initializations for longitudinally-consistent infant cortical surface reconstruction.
More longitudinal infant dataset are being collected in our institute, thus we will further extensively optimize and validate our method with this increasing large-scale dataset. We will make use of this larger-scale dataset to comprehensively map the longitudinal dynamic cortex developmental trajectories of the cortical thickness, cortical surface area, cortical gyrification, and cortical folding in infants, for increasing our limited knowledge on normal cortical development trajectories in this pivotal period and also for providing important insights into the neurodevelopmental disorders.
Highlights.
We propose a method for consistent dynamic infant cortical surface reconstruction.
We apply the method to map dynamic cortical thickness development in infants.
We find regional-specific cortical thickness developmental trajectory in infants.
Acknowledgments
The authors would like to thank the editor and anonymous reviewers for providing constructive and detailed suggestions that improved this paper significantly. This work was supported in part by National Institutes of Health grants AG041721, AG042599, MH100217, EB006733, EB008374, EB009634, EB008760, MH088520, MH070890, MH064065, NS055754, and HD053000.
Footnotes
Publisher's Disclaimer: This is a PDF file of an unedited manuscript that has been accepted for publication. As a service to our customers we are providing this early version of the manuscript. The manuscript will undergo copyediting, typesetting, and review of the resulting proof before it is published in its final citable form. Please note that during the production process errors may be discovered which could affect the content, and all legal disclaimers that apply to the journal pertain.
References
- Almli CR, Rivkin MJ, McKinstry RC. The NIH MRI study of normal brain development (Objective-2): newborns, infants, toddlers, and preschoolers. Neuroimage. 2007;35:308–325. doi: 10.1016/j.neuroimage.2006.08.058. [DOI] [PubMed] [Google Scholar]
- Awate SP, Yushkevich PA, Song Z, Licht DJ, Gee JC. Cerebral cortical folding analysis with multivariate modeling and testing: Studies on gender differences and neonatal development. Neuroimage. 2010;53:450–459. doi: 10.1016/j.neuroimage.2010.06.072. [DOI] [PMC free article] [PubMed] [Google Scholar]
- Bernal-Rusiel JL, Greve DN, Reuter M, Fischl B, Sabuncu MR. Statistical analysis of longitudinal neuroimage data with Linear Mixed Effects models. Neuroimage. 2012;66C:249–260. doi: 10.1016/j.neuroimage.2012.10.065. [DOI] [PMC free article] [PubMed] [Google Scholar]
- Chen CH, Fiecas M, Gutierrez ED, Panizzon MS, Eyler LT, Vuoksimaa E, Thompson WK, Fennema-Notestine C, Hagler DJ, Jr, Jernigan TL, Neale MC, Franz CE, Lyons MJ, Fischl B, Tsuang MT, Dale AM, Kremen WS. Genetic topography of brain morphology. Proc Natl Acad Sci U S A. 2013 doi: 10.1073/pnas.1308091110. [DOI] [PMC free article] [PubMed] [Google Scholar]
- Chi JG, Dooling EC, Gilles FH. Gyral development of the human brain. Ann Neurol. 1977;1:86–93. doi: 10.1002/ana.410010109. [DOI] [PubMed] [Google Scholar]
- Dai Y, Shi F, Wang L, Wu G, Shen D. iBEAT: A Toolbox for Infant Brain Magnetic Resonance Image Processing. Neuroinformatics. 2012 doi: 10.1007/s12021-012-9164-z. [DOI] [PubMed] [Google Scholar]
- Dale AM, Fischl B, Sereno MI. Cortical surface-based analysis. I. Segmentation and surface reconstruction. Neuroimage. 1999;9:179–194. doi: 10.1006/nimg.1998.0395. [DOI] [PubMed] [Google Scholar]
- Dubois J, Benders M, Cachia A, Lazeyras F, Ha-Vinh Leuchter R, Sizonenko SV, Borradori-Tolsa C, Mangin JF, Huppi PS. Mapping the early cortical folding process in the preterm newborn brain. Cereb Cortex. 2008;18:1444–1454. doi: 10.1093/cercor/bhm180. [DOI] [PubMed] [Google Scholar]
- Economo C, Parker S. Humphrey Milford. Oxford University Press; London: 1929. The cytoarchitectonics of the human cerebral cortex. [Google Scholar]
- Fan Y, Shi F, Smith JK, Lin W, Gilmore JH, Shen D. Brain anatomical networks in early human brain development. Neuroimage. 2011;54:1862–1871. doi: 10.1016/j.neuroimage.2010.07.025. [DOI] [PMC free article] [PubMed] [Google Scholar]
- Fischl B. FreeSurfer. Neuroimage. 2012 doi: 10.1016/j.neuroimage.2012.01.021. [DOI] [PMC free article] [PubMed] [Google Scholar]
- Fischl B, Dale AM. Measuring the thickness of the human cerebral cortex from magnetic resonance images. Proc Natl Acad Sci U S A. 2000;97:11050–11055. doi: 10.1073/pnas.200033797. [DOI] [PMC free article] [PubMed] [Google Scholar]
- Fischl B, Sereno MI, Tootell RB, Dale AM. High-resolution intersubject averaging and a coordinate system for the cortical surface. Hum Brain Mapp. 1999;8:272–284. doi: 10.1002/(SICI)1097-0193(1999)8:4<272::AID-HBM10>3.0.CO;2-4. [DOI] [PMC free article] [PubMed] [Google Scholar]
- Fransson P, Aden U, Blennow M, Lagercrantz H. The functional architecture of the infant brain as revealed by resting-state fMRI. Cereb Cortex. 2011;21:145–154. doi: 10.1093/cercor/bhq071. [DOI] [PubMed] [Google Scholar]
- Gao W, Zhu H, Giovanello KS, Smith JK, Shen D, Gilmore JH, Lin W. Evidence on the emergence of the brain's default network from 2-week-old to 2-year-old healthy pediatric subjects. Proc Natl Acad Sci U S A. 2009;106:6790–6795. doi: 10.1073/pnas.0811221106. [DOI] [PMC free article] [PubMed] [Google Scholar]
- Geng X, Gouttard S, Sharma A, Gu H, Styner M, Lin W, Gerig G, Gilmore JH. Quantitative tract-based white matter development from birth to age 2years. Neuroimage. 2012;61:542–557. doi: 10.1016/j.neuroimage.2012.03.057. [DOI] [PMC free article] [PubMed] [Google Scholar]
- Gilmore JH, Shi F, Woolson SL, Knickmeyer RC, Short SJ, Lin W, Zhu H, Hamer RM, Styner M, Shen D. Longitudinal development of cortical and subcortical gray matter from birth to 2 years. Cereb Cortex. 2012;22:2478–2485. doi: 10.1093/cercor/bhr327. [DOI] [PMC free article] [PubMed] [Google Scholar]
- Han X, Pham DL, Tosun D, Rettmann ME, Xu C, Prince JL. CRUISE: cortical reconstruction using implicit surface evolution. Neuroimage. 2004;23:997–1012. doi: 10.1016/j.neuroimage.2004.06.043. [DOI] [PubMed] [Google Scholar]
- Hill J, Dierker D, Neil J, Inder T, Knutsen A, Harwell J, Coalson T, Van Essen D. A surface-based analysis of hemispheric asymmetries and folding of cerebral cortex in term-born human infants. J Neurosci. 2010a;30:2268–2276. doi: 10.1523/JNEUROSCI.4682-09.2010. [DOI] [PMC free article] [PubMed] [Google Scholar]
- Hill J, Inder T, Neil J, Dierker D, Harwell J, Van Essen D. Similar patterns of cortical expansion during human development and evolution. Proc Natl Acad Sci U S A. 2010b;107:13135–13140. doi: 10.1073/pnas.1001229107. [DOI] [PMC free article] [PubMed] [Google Scholar]
- Jones SE, Buchbinder BR, Aharon I. Three-dimensional mapping of cortical thickness using Laplace's equation. Hum Brain Mapp. 2000;11:12–32. doi: 10.1002/1097-0193(200009)11:1<12::AID-HBM20>3.0.CO;2-K. [DOI] [PMC free article] [PubMed] [Google Scholar]
- Joshi M, Cui J, Doolittle K, Joshi S, Van Essen D, Wang L, Miller MI. Brain segmentation and the generation of cortical surfaces. Neuroimage. 1999;9:461–476. doi: 10.1006/nimg.1999.0428. [DOI] [PubMed] [Google Scholar]
- Kim JS, Singh V, Lee JK, Lerch J, Ad-Dab'bagh Y, MacDonald D, Lee JM, Kim SI, Evans AC. Automated 3-D extraction and evaluation of the inner and outer cortical surfaces using a Laplacian map and partial volume effect classification. Neuroimage. 2005;27:210–221. doi: 10.1016/j.neuroimage.2005.03.036. [DOI] [PubMed] [Google Scholar]
- Knickmeyer RC, Gouttard S, Kang C, Evans D, Wilber K, Smith JK, Hamer RM, Lin W, Gerig G, Gilmore JH. A structural MRI study of human brain development from birth to 2 years. J Neurosci. 2008;28:12176–12182. doi: 10.1523/JNEUROSCI.3479-08.2008. [DOI] [PMC free article] [PubMed] [Google Scholar]
- Lee JK, Lee JM, Kim JS, Kim IY, Evans AC, Kim SI. A novel quantitative cross-validation of different cortical surface reconstruction algorithms using MRI phantom. Neuroimage. 2006;31:572–584. doi: 10.1016/j.neuroimage.2005.12.044. [DOI] [PubMed] [Google Scholar]
- Li G, Guo L, Nie J, Liu T. Automatic cortical sulcal parcellation based on surface principal direction flow field tracking. Neuroimage. 2009;46:923–937. doi: 10.1016/j.neuroimage.2009.03.039. [DOI] [PMC free article] [PubMed] [Google Scholar]
- Li G, Guo L, Nie J, Liu T. An automated pipeline for cortical sulcal fundi extraction. Med Image Anal. 2010a;14:343–359. doi: 10.1016/j.media.2010.01.005. [DOI] [PMC free article] [PubMed] [Google Scholar]
- Li G, Nie J, Wang L, Shi F, Lin W, Gilmore JH, Shen D. Mapping region-specific longitudinal cortical surface expansion from birth to 2 years of age. Cereb Cortex. 2013a;23:2724–2733. doi: 10.1093/cercor/bhs265. [DOI] [PMC free article] [PubMed] [Google Scholar]
- Li G, Nie J, Wang L, Shi F, Lyall AE, Lin W, Gilmore JH, Shen D. Mapping Longitudinal Hemispheric Structural Asymmetries of the Human Cerebral Cortex From Birth to 2 Years of Age. Cereb Cortex. 2013b doi: 10.1093/cercor/bhs413. [DOI] [PMC free article] [PubMed] [Google Scholar]
- Li G, Nie J, Wu G, Wang Y, Shen D. Consistent reconstruction of cortical surfaces from longitudinal brain MR images. Neuroimage. 2012a;59:3805–3820. doi: 10.1016/j.neuroimage.2011.11.012. [DOI] [PMC free article] [PubMed] [Google Scholar]
- Li G, Shen D. Consistent sulcal parcellation of longitudinal cortical surfaces. Neuroimage. 2011;57:76–88. doi: 10.1016/j.neuroimage.2011.03.064. [DOI] [PMC free article] [PubMed] [Google Scholar]
- Li K, Guo L, Li G, Nie J, Faraco C, Cui G, Zhao Q, Miller LS, Liu T. Gyral folding pattern analysis via surface profiling. Neuroimage. 2010b;52:1202–1214. doi: 10.1016/j.neuroimage.2010.04.263. [DOI] [PMC free article] [PubMed] [Google Scholar]
- Li Y, Wang Y, Wu G, Shi F, Zhou L, Lin W, Shen D. Discriminant analysis of longitudinal cortical thickness changes in Alzheimer's disease using dynamic and network features. Neurobiol Aging. 2012b;33:427, e415–430. doi: 10.1016/j.neurobiolaging.2010.11.008. [DOI] [PMC free article] [PubMed] [Google Scholar]
- Lin W, Zhu Q, Gao W, Chen Y, Toh CH, Styner M, Gerig G, Smith JK, Biswal B, Gilmore JH. Functional connectivity MR imaging reveals cortical functional connectivity in the developing brain. AJNR Am J Neuroradiol. 2008;29:1883–1889. doi: 10.3174/ajnr.A1256. [DOI] [PMC free article] [PubMed] [Google Scholar]
- Liu T, Nie J, Tarokh A, Guo L, Wong ST. Reconstruction of central cortical surface from brain MRI images: method and application. Neuroimage. 2008;40:991–1002. doi: 10.1016/j.neuroimage.2007.12.027. [DOI] [PMC free article] [PubMed] [Google Scholar]
- Liu T, Shen D, Davatzikos C. Deformable registration of cortical structures via hybrid volumetric and surface warping. Neuroimage. 2004;22:1790–1801. doi: 10.1016/j.neuroimage.2004.04.020. [DOI] [PubMed] [Google Scholar]
- MacDonald D, Kabani N, Avis D, Evans AC. Automated 3-D extraction of inner and outer surfaces of cerebral cortex from MRI. Neuroimage. 2000;12:340–356. doi: 10.1006/nimg.1999.0534. [DOI] [PubMed] [Google Scholar]
- Nakamura K, Fox R, Fisher E. CLADA: Cortical longitudinal atrophy detection algorithm. Neuroimage. 2011;54:278–289. doi: 10.1016/j.neuroimage.2010.07.052. [DOI] [PMC free article] [PubMed] [Google Scholar]
- Nie J, Guo L, Li G, Faraco C, Stephen Miller L, Liu T. A computational model of cerebral cortex folding. J Theor Biol. 2010;264:467–478. doi: 10.1016/j.jtbi.2010.02.002. [DOI] [PMC free article] [PubMed] [Google Scholar]
- Nie J, Li G, Shen D. Development of cortical anatomical properties from early childhood to early adulthood. Neuroimage. 2013;76:216–224. doi: 10.1016/j.neuroimage.2013.03.021. [DOI] [PMC free article] [PubMed] [Google Scholar]
- Nie J, Li G, Wang L, Gilmore JH, Lin W, Shen D. A computational growth model for measuring dynamic cortical development in the first year of life. Cereb Cortex. 2012;22:2272–2284. doi: 10.1093/cercor/bhr293. [DOI] [PMC free article] [PubMed] [Google Scholar]
- Panizzon MS, Fennema-Notestine C, Eyler LT, Jernigan TL, Prom-Wormley E, Neale M, Jacobson K, Lyons MJ, Grant MD, Franz CE, Xian H, Tsuang M, Fischl B, Seidman L, Dale A, Kremen WS. Distinct genetic influences on cortical surface area and cortical thickness. Cereb Cortex. 2009;19:2728–2735. doi: 10.1093/cercor/bhp026. [DOI] [PMC free article] [PubMed] [Google Scholar]
- Pienaar R, Fischl B, Caviness V, Makris N, Grant PE. A Methodology for Analyzing Curvature in the Developing Brain from Preterm to Adult. Int J Imaging Syst Technol. 2008;18:42–68. doi: 10.1002/ima.v18:1. [DOI] [PMC free article] [PubMed] [Google Scholar]
- Reuter M, Schmansky NJ, Rosas HD, Fischl B. Within-subject template estimation for unbiased longitudinal image analysis. Neuroimage. 2012;61:1402–1418. doi: 10.1016/j.neuroimage.2012.02.084. [DOI] [PMC free article] [PubMed] [Google Scholar]
- Rimol LM, Nesvag R, Hagler DJ, Jr, Bergmann O, Fennema-Notestine C, Hartberg CB, Haukvik UK, Lange E, Pung CJ, Server A, Melle I, Andreassen OA, Agartz I, Dale AM. Cortical volume, surface area, and thickness in schizophrenia and bipolar disorder. Biol Psychiatry. 2012;71:552–560. doi: 10.1016/j.biopsych.2011.11.026. [DOI] [PubMed] [Google Scholar]
- Schaer M, Cuadra MB, Tamarit L, Lazeyras F, Eliez S, Thiran JP. A surface-based approach to quantify local cortical gyrification. IEEE Trans Med Imaging. 2008;27:161–170. doi: 10.1109/TMI.2007.903576. [DOI] [PubMed] [Google Scholar]
- Schumann CM, Bloss CS, Barnes CC, Wideman GM, Carper RA, Akshoomoff N, Pierce K, Hagler D, Schork N, Lord C, Courchesne E. Longitudinal magnetic resonance imaging study of cortical development through early childhood in autism. J Neurosci. 2010;30:4419–4427. doi: 10.1523/JNEUROSCI.5714-09.2010. [DOI] [PMC free article] [PubMed] [Google Scholar]
- Shattuck DW, Leahy RM. BrainSuite: an automated cortical surface identification tool. Med Image Anal. 2002;6:129–142. doi: 10.1016/s1361-8415(02)00054-3. [DOI] [PubMed] [Google Scholar]
- Shaw P, Eckstrand K, Sharp W, Blumenthal J, Lerch JP, Greenstein D, Clasen L, Evans A, Giedd J, Rapoport JL. Attention-deficit/hyperactivity disorder is characterized by a delay in cortical maturation. Proceedings of the National Academy of Sciences of the United States of America. 2007;104:19649–19654. doi: 10.1073/pnas.0707741104. [DOI] [PMC free article] [PubMed] [Google Scholar]
- Shaw P, Greenstein D, Lerch J, Clasen L, Lenroot R, Gogtay N, Evans A, Rapoport J, Giedd J. Intellectual ability and cortical development in children and adolescents. Nature. 2006;440:676–679. doi: 10.1038/nature04513. [DOI] [PubMed] [Google Scholar]
- Shaw P, Kabani NJ, Lerch JP, Eckstrand K, Lenroot R, Gogtay N, Greenstein D, Clasen L, Evans A, Rapoport JL, Giedd JN, Wise SP. Neurodevelopmental trajectories of the human cerebral cortex. J Neurosci. 2008;28:3586–3594. doi: 10.1523/JNEUROSCI.5309-07.2008. [DOI] [PMC free article] [PubMed] [Google Scholar]
- Shen D, Davatzikos C. HAMMER: hierarchical attribute matching mechanism for elastic registration. IEEE Trans Med Imaging. 2002;21:1421–1439. doi: 10.1109/TMI.2002.803111. [DOI] [PubMed] [Google Scholar]
- Shen DG, Wong WH, Ip HHS. Affine-invariant image retrieval by correspondence matching of shapes. Image and Vision Computing. 1999;17:489–499. [Google Scholar]
- Shi F, Fan Y, Tang S, Gilmore JH, Lin W, Shen D. Neonatal brain image segmentation in longitudinal MRI studies. Neuroimage. 2010a;49:391–400. doi: 10.1016/j.neuroimage.2009.07.066. [DOI] [PMC free article] [PubMed] [Google Scholar]
- Shi F, Wang L, Dai Y, Gilmore JH, Lin W, Shen D. LABEL: Pediatric brain extraction using learning-based meta-algorithm. Neuroimage. 2012;62:1975–1986. doi: 10.1016/j.neuroimage.2012.05.042. [DOI] [PMC free article] [PubMed] [Google Scholar]
- Shi F, Yap PT, Fan Y, Gilmore JH, Lin W, Shen D. Construction of multi-region-multi-reference atlases for neonatal brain MRI segmentation. Neuroimage. 2010b;51:684–693. doi: 10.1016/j.neuroimage.2010.02.025. [DOI] [PMC free article] [PubMed] [Google Scholar]
- Shi F, Yap PT, Wu G, Jia H, Gilmore JH, Lin W, Shen D. Infant brain atlases from neonates to 1- and 2-year-olds. PLoS One. 2011;6:e18746. doi: 10.1371/journal.pone.0018746. [DOI] [PMC free article] [PubMed] [Google Scholar]
- Shi Y, Lai R, Toga AW. Cortical surface reconstruction via unified Reeb analysis of geometric and topological outliers in magnetic resonance images. IEEE Trans Med Imaging. 2013;32:511–530. doi: 10.1109/TMI.2012.2224879. [DOI] [PMC free article] [PubMed] [Google Scholar]
- Sled JG, Zijdenbos AP, Evans AC. A nonparametric method for automatic correction of intensity nonuniformity in MRI data. IEEE Trans Med Imaging. 1998;17:87–97. doi: 10.1109/42.668698. [DOI] [PubMed] [Google Scholar]
- Smith SM, Jenkinson M, Woolrich MW, Beckmann CF, Behrens TE, Johansen-Berg H, Bannister PR, De Luca M, Drobnjak I, Flitney DE, Niazy RK, Saunders J, Vickers J, Zhang Y, De Stefano N, Brady JM, Matthews PM. Advances in functional and structural MR image analysis and implementation as FSL. Neuroimage. 2004;23(1):S208–219. doi: 10.1016/j.neuroimage.2004.07.051. [DOI] [PubMed] [Google Scholar]
- Smith SM, Nichols TE. Threshold-free cluster enhancement: addressing problems of smoothing, threshold dependence and localisation in cluster inference. Neuroimage. 2009;44:83–98. doi: 10.1016/j.neuroimage.2008.03.061. [DOI] [PubMed] [Google Scholar]
- Sowell ER, Thompson PM, Leonard CM, Welcome SE, Kan E, Toga AW. Longitudinal mapping of cortical thickness and brain growth in normal children. J Neurosci. 2004;24:8223–8231. doi: 10.1523/JNEUROSCI.1798-04.2004. [DOI] [PMC free article] [PubMed] [Google Scholar]
- Taubin G. A signal processing approach to fair surface design. Proceedings of the 22nd annual conference on Computer graphics and interactive techniques. ACM. 1995:351–358. [Google Scholar]
- Van Essen DC. Surface-based approaches to spatial localization and registration in primate cerebral cortex. Neuroimage. 2004;23(1):S97–107. doi: 10.1016/j.neuroimage.2004.07.024. [DOI] [PubMed] [Google Scholar]
- Van Essen DC. A Population-Average, Landmark- and Surface-based (PALS) atlas of human cerebral cortex. Neuroimage. 2005;28:635–662. doi: 10.1016/j.neuroimage.2005.06.058. [DOI] [PubMed] [Google Scholar]
- Van Essen DC, Drury HA, Dickson J, Harwell J, Hanlon D, Anderson CH. An integrated software suite for surface-based analyses of cerebral cortex. J Am Med Inform Assoc. 2001;8:443–459. doi: 10.1136/jamia.2001.0080443. [DOI] [PMC free article] [PubMed] [Google Scholar]
- Van Essen DC, Drury HA, Joshi S, Miller MI. Functional and structural mapping of human cerebral cortex: solutions are in the surfaces. Proc Natl Acad Sci U S A. 1998;95:788–795. doi: 10.1073/pnas.95.3.788. [DOI] [PMC free article] [PubMed] [Google Scholar]
- Wang L, Shi F, Li G, Gao Y, Lin W, Gilmore JH, Shen D. Segmentation of neonatal brain MR images using patch-driven level sets. Neuroimage. 2013;84C:141–158. doi: 10.1016/j.neuroimage.2013.08.008. [DOI] [PMC free article] [PubMed] [Google Scholar]
- Wang L, Shi F, Yap PT, Gilmore JH, Lin W, Shen D. 4D multi-modality tissue segmentation of serial infant images. PLoS One. 2012;7:e44596. doi: 10.1371/journal.pone.0044596. [DOI] [PMC free article] [PubMed] [Google Scholar]
- Wu G, Qi F, Shen D. Learning-based deformable registration of MR brain images. IEEE Trans Med Imaging. 2006;25:1145–1157. doi: 10.1109/tmi.2006.879320. [DOI] [PubMed] [Google Scholar]
- Xu C, Pham DL, Rettmann ME, Yu DN, Prince JL. Reconstruction of the human cerebral cortex from magnetic resonance images. IEEE Trans Med Imaging. 1999;18:467–480. doi: 10.1109/42.781013. [DOI] [PubMed] [Google Scholar]
- Xue H, Srinivasan L, Jiang S, Rutherford M, Edwards AD, Rueckert D, Hajnal JV. Automatic segmentation and reconstruction of the cortex from neonatal MRI. Neuroimage. 2007;38:461–477. doi: 10.1016/j.neuroimage.2007.07.030. [DOI] [PubMed] [Google Scholar]
- Xue Z, Shen D, Karacali B, Stern J, Rottenberg D, Davatzikos C. Simulating deformations of MR brain images for validation of atlas-based segmentation and registration algorithms. Neuroimage. 2006;33:855–866. doi: 10.1016/j.neuroimage.2006.08.007. [DOI] [PMC free article] [PubMed] [Google Scholar]
- Yap PT, Fan Y, Chen Y, Gilmore JH, Lin W, Shen D. Development trends of white matter connectivity in the first years of life. PLoS One. 2011;6:e24678. doi: 10.1371/journal.pone.0024678. [DOI] [PMC free article] [PubMed] [Google Scholar]
- Yeo BT, Sabuncu MR, Vercauteren T, Ayache N, Fischl B, Golland P. Spherical demons: fast diffeomorphic landmark-free surface registration. IEEE Trans Med Imaging. 2010;29:650–668. doi: 10.1109/TMI.2009.2030797. [DOI] [PMC free article] [PubMed] [Google Scholar]
- Zhang D, Wang Y, Zhou L, Yuan H, Shen D. Multimodal classification of Alzheimer's disease and mild cognitive impairment. Neuroimage. 2011;55:856–867. doi: 10.1016/j.neuroimage.2011.01.008. [DOI] [PMC free article] [PubMed] [Google Scholar]
- Zhang DQ, Shen DG, Neuroimagin AsD. Predicting Future Clinical Changes of MCI Patients Using Longitudinal and Multimodal Biomarkers. PLoS One. 2012;7 doi: 10.1371/journal.pone.0033182. [DOI] [PMC free article] [PubMed] [Google Scholar]
- Zhang T, Guo L, Li G, Nie J, Liu T. Parametric representation of cortical surface folding based on polynomials. Med Image Comput Comput Assist Interv. 2009;12:184–191. doi: 10.1007/978-3-642-04271-3_23. [DOI] [PMC free article] [PubMed] [Google Scholar]