

Abstract
A Taiwan origin for the expansion of the Austronesian languages and their speakers is well supported by linguistic and archaeological evidence. However, human genetic evidence is more controversial. Until now, there had been no ancient skeletal evidence of a potential Austronesian-speaking ancestor prior to the Taiwan Neolithic ∼6,000 years ago, and genetic studies have largely ignored the role of genetic diversity within Taiwan as well as the origins of Formosans. We address these issues via analysis of a complete mitochondrial DNA genome sequence of an ∼8,000-year-old skeleton from Liang Island (located between China and Taiwan) and 550 mtDNA genome sequences from 8 aboriginal (highland) Formosan and 4 other Taiwanese groups. We show that the Liangdao Man mtDNA sequence is closest to Formosans, provides a link to southern China, and has the most ancestral haplogroup E sequence found among extant Austronesian speakers. Bayesian phylogenetic analysis allows us to reconstruct a history of early Austronesians arriving in Taiwan in the north ∼6,000 years ago, spreading rapidly to the south, and leaving Taiwan ∼4,000 years ago to spread throughout Island Southeast Asia, Madagascar, and Oceania.
Introduction
The expansion of the Austronesian language family, one of the world’s largest expansions across Island Southeast Asia and Oceania, began in Taiwan.1 However, genetic evidence has been equivocal, with some mitochondrial DNA (mtDNA) studies showing a minor genetic contribution from Taiwan in extant Austronesian-speaking groups.2,3 Moreover, a limited panel of Y chromosome and autosomal STR loci indicate that Taiwan aboriginals are genetically close to the Daic speakers from southern China,4,5 but based on contemporary populations it suggests only that they share recent ancestry, because there are no Austronesian speakers in China, and linguistic evidence further argues that the link with Daic speakers may be a result of back migration of south Formosan ancestors.6
Crucially, there is a lack of relevant fossil material pertaining to the origin or the genetic diversity of the various groups of aboriginal Formosans, nor has information concerning genetic diversity among the various groups of aboriginal Formosans been incorporated into investigations of the Austronesian expansion. Here, we combine ancient DNA analysis of a relevant skeleton (Liangdao Man; Figure 1) with complete mtDNA genome sequences from 550 individuals that include 8 aboriginal (highland Formosan) groups to investigate the peopling of Neolithic Taiwan and the origins of the Austronesian expansion.
Figure 1.
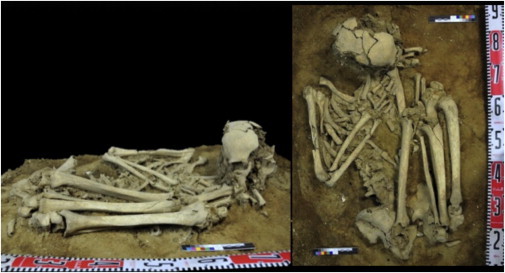
The Liangdao Man Skeleton
Side and top profile of the ancient specimen found in a supine flexed position without coffin or burial items.
The Liangdao Man skeletal remains were discovered on the Liang Island of the Matsu archipelago in December 2011 and transported to the Matsu Folklore Museum. Matsu is located on the Min River estuary, 24 km from Fujian and 180 km northwest of Taiwan (Figure S1 available online). It represents one of the shortest crossings from the mainland into Taiwan. The skeleton is 70% complete and that of a robust male about 160 cm in height. The C14-AMS dating of a thoracic rib yields a date 8,060–8,320 Cal BP (at 95% probability; Figure S3). The Liangdao Man has a shell mound above it that contains artifacts such as pottery, stone tools, and bone tools. The radiocarbon dates of the shells and charcoal from the layers above the Liangdao Man range from 7,500 to 7,900 years ago (ya), verifying the burial to be from the earliest phase of the shell mound. Thus, both the age and location of Liangdao Man position it at an appropriate time and place to potentially provide insights concerning the early Austronesian expansion into Taiwan as well as a genetic link to southern China.
Material and Methods
Samples
A total of 565 individuals from 12 ethnic groups were recruited in Taiwan from 1998 to 2001. We included eight highland Formosan tribes (Ami, Atayal, Bunun, Paiwan, Puyuma, Rukai, Saisiat, and Tsou) that represent the branches of Blust’s linguistic classification7 and relate to the Proto-Austronesian, a reconstructed linguistic ancestor (Figure S18). We included four other groups: Makatao (lowland Formosan), Tao (Orchid Islanders offshore Taiwan), and two Han Taiwanese (Hakka and Minnan, who migrated to Taiwan from Fujian and Guangdong less than 300 ya). The demographic details (Table S1) and sampling locations in Taiwan (Figure S1) are provided, as well as the descriptions of the Liangdao Man archeology (Appendix A). All aboriginal samples were collected at major township centers, and ancestry was ascertained by requiring both parents to be in the same tribe. The ethics committees of the China Medical University, the Taiwan National Health Research Institutes, and the University of Leipzig Medical Faculty have approved this study. Informed consent was obtained from all participants. Genomic DNA was extracted from whole blood by the QIAGEN-Gentra Puregene Blood Kit according to laboratory protocols. DNA sequencing was performed on the Illumina platform. DNA from the Liangdao Man foot phalanx was extracted and a single-strand library was prepared and enriched for mtDNA. For the modern samples, double-indexed libraries were prepared and enriched for mtDNA.
Ancient DNA Extraction, Library Preparation, and mtDNA Enrichment
The DNA was extracted as described previously8 from a foot phalanx and femur of the Liangdao Man from 59 and 15 mg of bone powder, respectively. Libraries were produced from 10 μl of each extract by a single-strand library preparation method.9 To prevent contamination from sequences derived from modern DNA libraries, adaptor CL53/73 (CL53 CGACGCTCTTC-ddC [ddC = dideoxy cytidine]; CL73 Phosphate-GGAAGAGCGTCGTGTAGGGAAAGAG∗T∗G∗T∗A [∗ = PTO bonds]) were used for libraries. An optimal PCR cycle number for library amplification was determined by qPCR.10 Libraries were amplified with AccuPrime Pfx DNA polymerase (Life Technologies) with reaction parameters described previously11 and with distinct sample-specific internal barcodes introduced into both library adaptors.12 The MinElute PCR purification kit (QIAGEN) was used to purify the PCR-amplified libraries. To obtain high-concentration DNA libraries for the mtDNA hybridization capture, a second round of amplification in a 100 μl PCR reaction was performed with Herculase II Fusion DNA polymerase (Agilent) with the primers IS5 and IS613 and the conditions described previously.11 The hybridization capture with an mtDNA probe set14 was performed to enrich the mtDNA in libraries. The libraries were amplified with primers IS5 and IS6.13 Library concentration was determined with a Bioanalyzer DNA 1000 chip and the libraries were pooled in equimolar ratio.
Illumina Sequencing and Ancient mtDNA Assembly
The pooled libraries were sequenced on a fifth of one lane of the Illumina MiSeq (MS-102-1001 MiSeq Reagent Kit 300-cycles-PE) using a paired-end run with 76 + 7 cycles and two 7-base pair index reads.12 An indexed control PhiX 174 library was spiked-in to yield 2%–3% control reads (index 5′-TTGCCGC-3′). Base-calling was performed with Bustard applying a cycle-independent correction for cross-talk followed by the correction of phasing and prephasing. A minimum base quality score of 10 was required in both index reads. The full-length molecule sequences were reconstructed by merging the paired-end reads with the requirement that the forward and reverse sequence reads overlapped by at least 11 bp.15 The adaptors were then removed and these sequences were used for further analysis.
The total sequencing of the libraries from phalanx and femur yielded 174,426 and 550,722 merged reads, respectively. After filtering with map quality filter 30 and length filter 35, 51,466 and 484,491 of the reads from these two libraries could be aligned to the revised Cambridge Reference Sequence (rCRS; NCBI reference sequence NC_012920.116) with an iterative mapping assembler (MIA)17 with a position-specific scoring matrix that handles the nucleotide misincorporation patterns found in ancient DNA sequences. To remove PCR duplicates, we built a consensus from sequences with identical start and end coordinates by retaining the base with the highest quality score at each position in the alignment. The average length of the Liangdao DNA molecules is 50 bp (Figure S4A). The mtDNA coverage as determined from unique sequences was 245.9-fold for the phalanx and 32.9-fold for the femur. The consensus sequences obtained from both samples are identical. Because the phalanx shows the better preservation of the two samples (163.9-fold coverage/mg bone on average), the library prepared from the phalanx was used for further mtDNA analysis. Previous studies reported a GC bias in sequences generated from libraries prepared with the double-stranded library method18 and an AT bias in the single-strand library method.9 Here we also see that bias decreases with increasing fragment size (Figure S4B). With the single-stranded library preparation method, we find a similar decrease in GC content with fragment size, but overall the GC content is similar to the genome average (42%) throughout the range of fragment sizes.
Authenticity of Ancient mtDNA Genome Sequence
The authenticity was determined in two steps: via the majority base at each position of the sequence and by the damage pattern.
Majority Base
In order to check for contamination and/or errors induced by nucleotide misincorporations, the coverage for each position and the proportion of reads that matched the consensus base at each position are plotted in Figure S5. The average frequency of the majority base at each position is 98.6%. The lowest coverage across the mtDNA genome is 25-fold. The consensus support was below 80% for only 2 out of 16,566 positions. One of these was incorrectly aligned, and the other one showed 11 out of 50 sequences with a C>T mismatch close to the end, strongly suggesting that these substitutions represent nucleotide misincorporations resulting from cytosine deamination. Hence, the majority of the mtDNA sequence is from the same individual. To thoroughly assess whether the mtDNA comes from a single individual, we focused on one position where the Liangdao consensus sequence differs from 99% of 311 complete mtDNA sequences from around the world.19 Among 98 distinct DNA fragments that cover this position, none differs from the consensus sequence, indicating that the vast majority (96.2%–100%, 95% CI) of the DNA fragments come from one mtDNA genome.
Damage Pattern
To assess the damage information, we focus on the C>T changes at the 5′ ends and 3′ ends in the single-stranded DNA, especially CpG>TpG substitutions. The ratio of CpG>TpG substitutions at both fragment ends (>50%) indicates the presence of 5′ and 3′ single-stranded DNA overhangs carrying many 5-methyl-cytosines, which is a characteristic of ancient DNA9 (Figure S6).
Thus, we conclude that the mitochondrial genome sequence of the Liangdao specimen is likely to be derived from one ancient individual.
High-Throughput Sequencing of Taiwanese mtDNA Genomes
A total of 565 samples were processed for high-throughput sequencing on the Illumina GAIIx as described previously.20 In total, 255,160,433 reads were generated, of which 62,368,213 reads mapped to the rCRS. Four highland Formosan (two Saisiat and two Tsou) and 11 non-Formosan (five Hakka and six Tao) samples did not have sufficient reads and were removed from further analysis. Of the 550 remaining samples, 10% were randomly resequenced and yielded identical consensus sequences. The mean coverage was 504-fold per sequence (99.5% samples > 10-fold coverage; Figure S7). This allowed us to attain a high-quality data set that was missing 2.7% (26/949) of the total polymorphic sites, and these sites were removed from all sequences during analysis. During sequence cleaning we further removed 81 sites: poly-C stretch of hypervariable segment 2 (HVS-II; nucleotide positions [np] 303–317); CA-repeat (np 514–523); C-stretch 1 (np 568–573); 12S rRNA (np 956–965); historical site (np 3,107); C-stretch 2 (np 5,895–5,899); 9 bp deletion/insertion (np 8,272–8,289); and poly-C stretch of hypervariable segment 1 (HVS-I; np 16,180–16,195). Table S8 shows the haplogroup calls based on Phylotree v.15.21
Quality of Taiwanese Data Set
We performed 10,000 resampling of haplotypes/haplogroups at incremental sample sizes per tribe to observe whether, for example, the lower sample size of the Saisiat affects the results. Figure S8 shows that the Saisiat curve does increase more rapidly (especially for haplogroups), but overall curves do not differ among groups. Moreover, the Formosan curves are more saturated than the Han curves, suggesting increased representation of the Formosan sequences. Another indication of adequate sampling of each Formosan group is that the per tribe haplotype diversity is associated with their population size census22 for 1906, 1964, and 2004 (Spearman’s rho∼0.63 and p = 0.045, 0.045, 0.049, respectively). We infer that the introduction of “foreign” haplotypes via recent migration has not greatly influenced patterns of highland Formosan mtDNA diversity. The mtDNA genetic distances of highlander tribes cluster regionally (Figure S9A). Further downscaling of mtDNA Formosan sequences from this study and previous study23 to 713 bp, that includes HVS-I and HVS-II, the between-study tribal Φst ranges from 0.005 to 0.07 (Figure S9B). Thus, this study is consistent with slightly increased variation in south Formosans resulting from differences in sampling locations.
Phylogeny, Bayesian Inference, and Clustering
The haplogroup E phylogeny was constructed by median joining in Network 4.611.24 BEAST 1.7.525 estimated population size changes over time under Skyride26 with the HKY85+Γ (four categories) substitution model as the best fit determined by jModeltest2,27 and all runs were carried out to an ESS > 103. For the comparison of clock methods, a strict clock of a whole mtDNA substitution rate of 1.665 × 10⁻⁸ per site per year was used.28 We simulated three model scenarios (“Into Taiwan,” “Out of Taiwan,” and “Formosan phylogeny;” Appendix B) via fastsimcoal29 and inferred parameters via Approximate Bayesian Computation (ABC).30 For the clustering of individuals and testing robustness of the “stepping-stone” signal, a discriminant analysis of principal components (DAPC)31 was used that maximizes between group differences and minimizes within-cluster variation based on alleles. The retained discriminant functions give probabilities for individual membership among groups. The coefficient measures how close individuals are to the ten assigned ethnic clusters (eight highlander groups and two Han groups).
Results
We extracted DNA from a foot phalanx of the Liangdao Man and completely sequenced the mtDNA genome at 245-fold coverage. The ancient mtDNA is haplogroup E (with two of the four diagnostic changes toward haplogroup E1; Figure 2). Figure 3 shows a comparison of the Liangdao Man sequence with 104 sequences from haplogroup E, collected from this study, Philippines,20,32 Malaysia,33 Indonesia,34,35 and Melanesia,36 and the nearest extant relative haplogroup (M9) that is found in southern China.37 Two aboriginal Formosan sequences are the closest match to the Liangdao Man sequence, with four nucleotide differences in the mtDNA protein-coding region.
Figure 2.
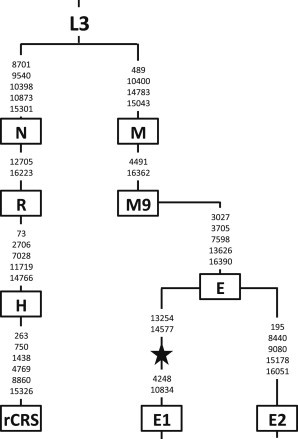
Liangdao Man’s mtDNA Haplogroup
There are 29/29 complete matches from rCRS to haplogroup E (based on Phylotree v.15), 2/4 defining positions toward E1 (13254C, 14577C), and 2 additional positions that are not haplogroup defining (315.1C, 16519C). Thus, the Liangdao Man (black star) is haplogroup E (and ancestral to E1).
Figure 3.
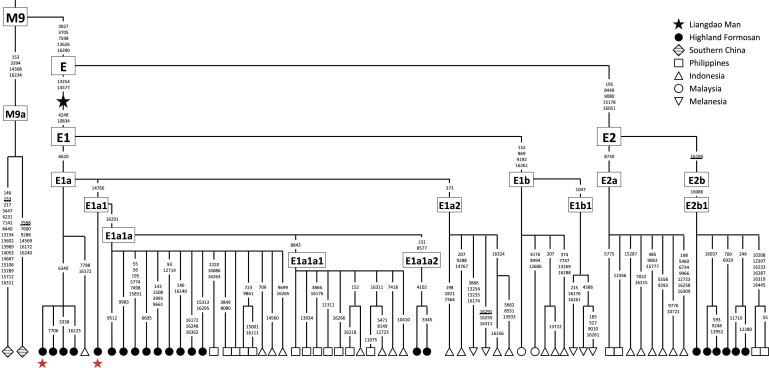
Haplogroup E among Austronesian Speakers Related to the Liangdao Man
Shown are 67 haplotypes obtained from 104 whole mtDNA genome sequences belonging to haplogroup E, collected from this study and published data from the Philippines,20,32 Malaysia,33 Indonesia,34,35 and Melanesia,36 and from two M9a sequences from Han in southern China.37 The Liangdao Man sequence (black star) is an intermediate between E and E1. The Formosan sequences are most similar to the Liangdao Man sequence, where the closest sequences (red stars) only differ by four nucleotide changes, and these are found in two Ami (with differences at np 4248-6340-6620-10834) individuals under E1a and one Atayal (with differences at np 4248-6620-10834-14766) individual under E1a1. The polymorphic positions are indicated on branches; recurrent mutations are underlined.
Haplogroup E has been previously dated to more than 30,000 years ago (30 kya) by the rho method and a constant molecular clock.35 By contrast, Bayesian dating via ancient DNA calibration38 and using the direct age of the Liangdao Man indicates that haplogroup E probably arose 8,136–10,933 ya (95% highest posterior density, HPD; Figure S10D), illustrating the value of incorporating ancient DNA information into molecular dating. This results in a recalibration of the molecular clock and positive support for the relaxed over strict clock (log10 Bayes Factor = 6.72) where the averaging substitution rate for the entire mtDNA genome is 2.67 × 10⁻⁸ (2.13–3.16 × 10⁻⁸, 95% HPD) per site per year. This rate is similar to and separately confirmed by the calibration of the worldwide mtDNA phylogeny via more extensive set of archaic humans and other ancient DNA.39 The Bayesian skyline plot of haplogroup E shows that this lineage expanded from an effective female size of 125 (14–485, 95% HPD) about 8,102 ya to a present-day size of 6,991 (2,274–17,796, 95% HPD; Figure S11). Similar calibration to the 361 complete Formosan mtDNA sequences (Figure S12) shows a decisive support for a relaxed clock (log10 Bayes Factor = 42.43) with substitution rate of 2.68 × 10⁻⁸ (1.91–3.16 × 10⁻⁸, 95% HPD) per site per year. The Formosan haplogroups trace back to an ancestral population that expanded at earliest about 10,835 ya from an effective female size of 4,867 (172–21,868, 95% HPD) to a present-day size of 34,027 (14,882–73,492, 95% HPD; Figure S12B).
We completely sequenced the mtDNA genomes at 500-fold coverage from 550 Taiwanese. We find a complete lack of haplotype sharing between the eight highland Formosans and Han, suggesting that there had been negligible gene flow (Figure 4B). Therefore, we first carried out an Into Taiwan simulation based on the divergence between the highland Formosans and Han. The simulation indicates that they last shared common ancestry between 8,093 and 10,306 ya (95% HPD; Table S2). Within Taiwan, we find strong evidence of a north-to-south gradient in the patterns of Formosan mtDNA nucleotide diversity (Figure 4). The highland Formosans have higher mean nucleotide differences in the north than south, each with a “tail” in the mismatch distributions (Figure S19) and accompanying support for the spatial expansion model (Table S6) that together matches their mountainous residence in highly heterogeneous environments.40 Bayesian skyline plots show that the highlanders underwent bottlenecks (Figure S19), suggesting that they split from a group of early Austronesians. On the other hand, the Makatao is demographically similar to Han by exhibiting a stationary (demographic) expansion (no tail) and high intrademe flow (94–430 per generation; Table S6), as well as population expansions in the Bayesian skyline plots (Figure S19). These results suggest that in contrast to highlanders, the lowlanders have admixed more with the Han and are thus less isolated and have experienced more migration.
Figure 4.
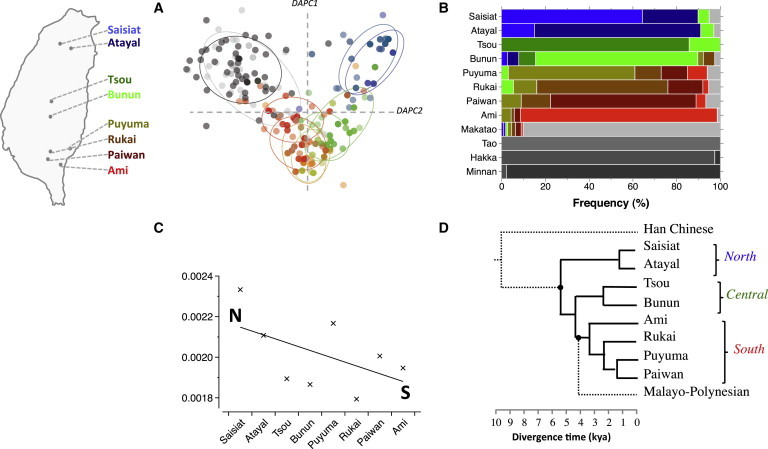
Into and Out of Taiwan
(A) Map location of highland Formosan tribes and DAPC plot; individuals are dots, groups are circles, color corresponds to eight Formosan groups and two Han groups in gray.
(B) Stepping-stone haplotype sharing across 12 groups. Han/lowland Taiwanese groups are in gray and the frequency of haplotypes shared with/with other groups are colored according to the map.
(C) Formosan nucleotide diversity declines from north (N) to south (S).
(D) Formosan tribal relationships based on complete mtDNA sequences; dotted lines are non-Formosan groups.
We next reconstructed the order of splitting of highland tribes from each other via the Formosan phylogeny simulation, which is an unbiased search of all possible bifurcating tree shapes formed by the eight tribes that provide the best fit to the observed data. The best tree conforms to the observed geographic cline as well as the temporal relationships of regional sequences (Figure S16). The performance of the ABC simulations indicate improved fit of posterior to the observed (Appendix B). Finally, the Out of Taiwan simulation has estimated an original split between the ancestors of aboriginal Formosans and those of Filipinos from northern Luzon to have occurred 13,725–29,601 ya (95% HPD; Table S2). This was followed by a migration from Neolithic Taiwan into the Philippines between 3,825 and 4,450 ya (95% HPD) with a mean probability of 4,138 ya (Table S2).
Discussion
Haplogroup E is not observed in more than 6,000 individuals across 84 populations in China,41 and therefore the occurrence of this haplogroup at the Liangdao Man’s location is highly unusual. In fact, haplogroup E is prevalent outside China among Austronesian-speaking groups from Taiwan, Philippines,32 Malay Peninsula,33 Island Southeast Asia,3,35 and Guam and Marianas in Micronesia,42 spreading as far west as Madagascar43 and as far east as the Bismarck Archipelago, but it has not yet been reported in Polynesia.44 The evidence linking this haplogroup to Taiwan is that it is among the mid-Holocene maternal lineages, such as E1a1a, M7b3, M7c3c, and Y2 that are candidates for the presumed out-of-Taiwan dispersal.3,45
A Formosan source for the Liangdao Man is unlikely, because haplogroup E evolved from haplogroup M9, which has never been detected in more than 1,000 Formosan mtDNA sequences from this study and published data.23 Instead, haplogroup M9 is distributed along coastal China close to the Liang Island, such as in the Yangtze Valley region and Zhejiang.37 This suggests that M9 differentiated to E outside China (near Fuzhou) and that the haplogroup E lineages are associated with early Austronesians and the subsequent dispersal of Austronesian languages (Figure 5B). Further support for this view is that on the Mainland Southeast Asia, the E lineages are found in the Austronesian-speaking Cham but not in the Austro-Asiatic, Tai-Kadai (Daic), or Tibeto-Burman speakers.46 The Cham have been traced to originate from Borneo,47 which may be one linguistic source of Malagasy, and E lineages are reported at 10% frequency in the Malagasy.43 At around the time when haplogroup E developed from M9 in the population that later carried it into Taiwan, the surrounding regions gave rise to M9a∗ lineages that are now carried by Sinitic speakers.37 Thus, the Han, Liangdao Man, and Formosan haplogroup M9a/E lineages can be traced to an ancestral M9 mtDNA lineage (Figure 3). Additionally, the Tibetans have a high frequency of M9a lineages that is shown to have coalesced during the Neolithic48 and there is a hypothesized linguistic link between Sino-Tibetan and Austronesian languages.6
Figure 5.
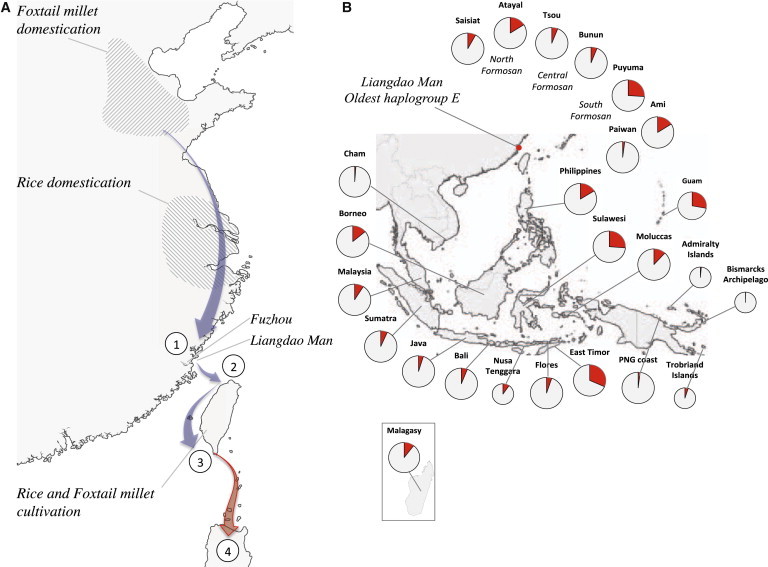
Suggested Migration Route for Early Austronesians Into and Out of Taiwan and the Worldwide Distribution of Haplogroup E1
(A) Geographic regions in China of foxtail millet domestication51 (shaded) delimited by Nanzhuangtou, Cishan, and Yuezhuang, and of rice domestication52 (shaded) in the Yangtze River Valley. Shown are (1) early Austronesians in the Fuzhou region, (2) entry into north Taiwan, and (3) rapid north-south dispersal along the west coast and crop cultivation at Nanguanli.50 (4) One Austronesian language subgroup from Taiwan is ancestral to the Proto-Malayo-Polynesian language subgroup in the Philippines.
(B) Frequency of haplogroup E1 across Taiwan, Island Southeast Asia, Madagascar, and Near Oceania.
The archeology of the cereal crop cultivation in south Taiwan is strongly linked to their origin in China.49,50 The earliest domestication of foxtail millet is 9.5–11.5 kya in northern China51 and of rice is 8.2–13.5 kya in the Yangtze Valley52 (Figure 5A). Because the co-occurrence of agricultural developments and population growth is well known,53 we investigated the Bayesian skyline plots of the calibrated haplogroup E sequences (Figure S11) and of the highland Formosan mtDNA sequences (Figure S12B) and find evidence of population expansions about 8–10 kya. Thus, when the early Austronesians diverged from the Han ancestors and expanded into Taiwan, haplogroup E (among other maternal lineages) increased in frequency outside China.
As early Austronesians migrated and arrived on the mainland opposite Taiwan, the Fuzhou basin was flooded around 9 kya.54 The region is less conducive to farming and may have motivated an exploration of shell resources, such as in the case of the Liang Island. Archeological evidence indicates that Neolithic Taiwan was settled 6 kya.55 Although additional ancient DNA data would benefit the Bayesian inference, the emerging picture is that the majority of E lineages show a coalescence of 5–8 kya with a higher mean probability of about 6 kya (Figure S10D). Taken together, the entry into Taiwan is likely from the north, because the Liang Island and the origin of cereal crops used by aborigines are northward of the island (Figure 5A). The incoming direction matches the genetic findings that Saisiat and Atayal (northernmost tribes) have the highest mtDNA diversity (Figure 4C) and are involved in the deepest splits among highlander groups (Figure 4D).
In Taiwan, the early Austronesians dispersed southward (Figure 4). The Formosan phylogeny simulation indicates that a northern group diverged first at 5,332 ya (4,975–5,638, 95% HPD; Table S2). This coincides with the root estimate of Austronesian languages at 5,230 ya (4,750–5,800, 95% HPD) according to archeological settlement times outside Taiwan.1 The next split, between the central and southern groups, occurred 4,226 ya (4,049–4,452, 95% HPD; Table S2). The Out-of-Taiwan simulation, corresponding to the Proto-Malayo-Polynesian speakers (who left Taiwan), has a higher mean probability of occurring at 4.1–4.2 kya, which is consistent with the archeological record of an early contact with the Philippines at 4 kya.56 However, at this time there was a single population moving through Taiwan because none of the Formosan tribes had yet formed. The genetic results thus suggest a rapid dispersal through Taiwan, followed by subsequent population differentiation.
We also find a good correspondence between the genetic relationships and the various linguistic models of population relationships (Figure S18). Particularly, the three regional, early Austronesian branches (north, central, south; Figure 4D) reflect Sagart’s Proto-Austronesian numeral system that also describes a stepwise progression down the island.6 The merits of other models are noticed under a curious genetic relationship in that Formosan tribes diversified in the reverse direction to the southward expansion. That is, the southern, central, and northern tribes were established with mean probabilities of 3,376–1,383 ya, 2,281 ya, and 1,248 ya, respectively (Figure 4D and Table S4). Thus, languages in south Taiwan may have diversified before those in the north, which could relate to the initial branches of the models of Li57 and Ross.58 Importantly, Blust’s polytomy7 of a single ancestor also receives support in the genetic data, in that all highlanders share similar demographic history (Figure S19 and Table S6), and this model explains more of the genetic variation among groups than the other models (p < 0.001; Table S7).
For many years, it has been challenging to define early Austronesians beyond reconstruction of languages. To be sure, we cannot know what language Liangdao Man spoke, nor if he had anything to do with the spread of rice and millet agriculture that is usually associated with the early Austronesian expansion. However, ancient DNA verifies that he carries an ancestral haplogroup E mtDNA sequence that strongly links him with contemporary Formosans. Thus, Liangdao Man is the oldest genetic relative of aboriginal Formosans. Furthermore, his lineage traces back to ancestral M9 lineages along coastal China. Aided by his sequence, we improve the calibration of the mtDNA clock via model-based simulations and we estimate the initial divergence between Formosans and Han to be around 8–10 kya, colonization of Taiwan in the north followed by a north-to-south dispersal through Taiwan, and an exit of Proto-Malayo-Polynesian speakers from the south at about 4 kya. The Liangdao Man mtDNA sequence, complemented by detailed analyses of Formosan genetic diversity, thus provides more details of the process by which humans spread to, through, and out of Taiwan.
Acknowledgments
We thank all those who donated samples and gratefully acknowledge Yang Shui Sheng (Magistrate of Lienchiang County), Tsang Cheng-Hwa, Matsu Liangdao Archeological Team, Svante Pääbo, Matthias Meyer, and Ayinuer Aximu-Petri for lab assistance. This research was supported by the Lienchiang County, by the Hsu Yu-Ziang Science and Technology Memorial Foundation, and by the Max Planck Society.
Contributor Information
Mark Stoneking, Email: stoneking@eva.mpg.de.
Ying-Chin Ko, Email: ycko0406@gmail.com.
Appendix A: Liangdao Man Archeology
The Liangdao Man was exhumed from the Liang Island, the northernmost satellite island in the Matsu archipelago of Taiwan. The Liang Island has an area of 0.35 km2 (1,400 m long and 250 m wide) with sparse vegetation and is populated by migratory birds. There are marine resources (shells and fish) in the nearby waters. It is uninhabited because Matsu is under Taiwanese martial law. The ancient skeleton was found by accident as a road construction exposed a spread-out shell mound layer about 3 m wide by 30 m long by 10–50 cm in height (Figure S2). Inspection revealed shells, pottery shards, bone tools, and three pieces of human parietal bone. An excavation revealed a skeleton in situ. This archeological site is termed the Liangdaodaowei-1 (LDDW-I). The skeleton is assessed to be 70% complete, male (determined from a narrow greater sciatic notch and lack of subpubic concavity), and about 30 years old (determined from degree of molar wear), with height of 160 ± 3.59 cm with robust humerus and developed deltoid tuberosity and prominent ridgeline for insertion of muscle and thicker body of the bone. To determine its age, a thoracic rib was sent for C14-AMS dating (Figure S3). Separately, the Matsu Liangdao archeology team sent the nonhuman specimens (shells and charcoal) from layers above the Liangdao Man, prior to its full exposure, to the Valuable Instrument Center Laboratory of the National Taiwan University for radiocarbon C14 dating, and the age range of those artifacts is 7,500–7,900 years BP.
Appendix B: Approximate Bayesian Computation Simulations
Simulation 1: Into and Out of Taiwan
To reconstruct the history of Neolithic Taiwan, we divided its major events into three stages: Into Taiwan, Formosan phylogeny, and Out of Taiwan. For Into Taiwan, the complete mtDNA genomes of Han (n = 95) and Formosan (n = 361) from this study were used, where the model (Figure S13) assumes an ancestor split into two at time (T) in the past. We modeled population expansion as indicated by the significantly negative Tajima’s D values of the Han and Formosan (−2.34 and −1.64, respectively) and Bayesian skyline plots (Figures S12 and S19). Thus, the ancestral size is calculated as a fraction of the present-day size but not exceeding it. For Out of Taiwan, the complete mtDNA genomes of Formosan (n = 361) and Filipino (n = 67) from our recent study were used.32 We selected six northern Filipino groups (Ivatan, Ifugao, Ibaloi, Kankanaey, Kalangoya, and Bugkalot) of non-Negrito ancestry that are geographically closest to Taiwan to capture the background signal of migration. The model (Figure S13) assumes an ancestor split into two at time 1 (T1) and then a migration at time 2 (T2) in the past. We also allowed for population expansion as indicated by the significantly negative Tajima’s D (−1.64, −1.30, respectively) and Bayesian skyline plots32 (Figure S12). The choices of priors in Table S2 are as follows.
1. T was set between the Neolithic settlement of Taiwan 6 kya55 and early domestication of foxtail millet at about 12 kya in northern China.51
2. Han Ne. The entire population is about 20 million, but we sampled locally from south Taiwan and estimate an effective size of 2 million divided by 6 (half from males and females, then a third to represent the reproductive individuals in the population).
3. Formosan Ne. Because we sampled throughout Taiwan, the effective size is the 2004 census of total aboriginals (500,000) divided by 6.
4. Philippines Ne. Because the total population of indigenous peoples is 12 million (from the 2005 census) and samples are from north Luzon, we estimate an effective size of 1 million divided by 6.
5. Ancestral Ne was a fraction of the descendants (after allowing for population expansion).
6. T1. We assume the Taiwan and Philippines are settled at different times, and therefore the inhabitants shared a common ancestor any time from Neolithic Taiwan at 6 kya55 up to the European/Asian split at 20–30 kya.59
7. T2, Out of Taiwan, is the time from the present to Neolithic Taiwan (6 kya).55
8. m (migration rate) is a value between 0 and 1.
9. μ is credible intervals of the whole mtDNA genome rate calibrated to archaic humans and other ancient DNA via the relaxed clock.39
For Into Taiwan, 5,568,411 observations were simulated then log transformed for ABC local linear regression30 by means of seven statistical categories: number of haplotypes; haplotype diversity; polymorphic sites; Tajima’s D; mean number of pairwise differences; pairwise Φst; and percent of variation among groups/within populations in the analysis of molecular variance (AMOVA). We specifically used Tajima’s D to capture population expansion. For Out of Taiwan, 5,159,957 observations were simulated, and we introduced a pairwise haplotype sharing statistic to capture the extent of migration between Taiwan and Philippines. The top 10,000 simulations (tolerance of 0.2%) were retained because this most correlated with 1,000 pseudo-observed described previously.60 Table S2 shows R2 > 10% indicate parameters are estimated reliably, where 10% is suggested to be the threshold below which the parameter is unreliably estimated.60 The average coverage (proportion of true within estimate) is 81% and average factor 2 (proportion of estimate within 50%–200% of true) is 95%. A high overlap suggests convergence. The average bias and relative mean square error (RMSE) of divergence times are 3% and 15%, effective sizes are 9% and 15%, and substitution rate are 2% and 4%. The parameter with the highest variability is the migration rate. Table S3 shows that posterior fit the observed better than prior, e.g., for Into Taiwan, the fit of Pi is 20–40 times better in terms of bias and RMSE and Tajima’s D is about 6 times better; and for Out of Taiwan, the fit for Tajima’s D is about 3 times better and pairwise haplotype sharing is up to 5 times better.
Simulation 2: Formosan Phylogeny
The complete Formosan mtDNA sequences (n = 361) are allocated into the eight groups based on language.7 We generated all trees to conduct an unbiased and exhaustive search for the best tree (i.e., branching order and branch lengths), then resimulated that tree for parameter estimates (effective sizes, divergence times, migration rates). No assumption is made about the tree shape; all possible solutions are generated for bifurcating rooted trees with labeled leaves given by the formula61 for n ≥ 2:
For 8 leaves, there are 135,135 unique trees. We simplified this to 423 fixed topologies (not shown) that encapsulate varying permutations of leaves within each topology and tagged each unique tree. Every tree was iterated 200 times for a total of 27,027,000 stochastic draws. We generated 17,596,318 observations (not every simulation converge, but every tree occurred >20% of the time) by using unbiased, uniform priors, where each tribal size is fixed at 10,000 (Ne prior of 80,000 from simulation 1, averaged over 8 tribes), so only 6 coalescent times change (tree is rooted at 6,000 BP). We filtered by pairwise haplotype sharing (informative of north-south cline) that has 64 values (informative of private and shared haplotypes per tribe) thus offers very high specificity. After removing those outside 90%–110% of true value, we retained 8 candidate trees: 143 (#44), 149 (#62), 272 (#899), 275 (#112), 296 (#719), 296 (#721), 349 (#39), and 351 (#447). The first number is the topology (1–423) and hash is the permutation of leaves; e.g., topology 149 has 1,261 permutations labeled #1 to #1,261. After we required Saisiat to show the highest pairwise difference, only two trees remain (Figure S14). We determined the best tree to be north diverging first, i.e., 149 (#62) as opposed to central 296 (#721) (Figure S14). The choices of priors in Table S4 are:
1. T1–T7, from the present to Neolithic Taiwan 6 kya.55
2. SAI-PAI Ne, Formosan of 500,000 divided by 6 then averaged over 8 tribes.
3. m, based on the finding that between-tribe marriages are <5% according to public health surveys.62
4. μ, credible intervals of the whole mtDNA genome rate calibrated to archaic humans and ancient DNA via the relaxed clock.39
Resimulations of 149 (#62) shows improved fit to nucleotide diversity (Figure S15). Figure S16 demonstrate that the Bayesian posterior of the regional sequences do match the coalescent information in tree 149 (#62). Finally, tree 149 (#62) was simulated for 5,793,246 observations, then log transformed in ABC local linear regression30 by means of four statistical categories: number of haplotypes, haplotype diversity, mean number of pairwise differences, and polymorphic positions. We retained the top 1,000 simulations (tolerance of 0.02%) where the log Euclidean < 1 (Figure S15) and high correlation with 1,000 pseudo-observed. Table S4 shows that the parameters are reliably estimated (R2 > 0.1). There is a high overlap between true values and estimates (average coverage = 97% and factor 2 = 89%). The average bias is 11% (divergence times versus effective sizes is 5% versus 13%) and average RMSE is 42%. Figure S17 and Table S5 together shows that posterior better fit the observed, e.g., the average bias and RMSE for S is 16–20 times better and Pi is 20–30 times better. Additionally, we noticed that when the mean effective tribal sizes are combined by region (north is 2,226, central is 3,179, south is 4,610 from Table S4), they are consistent with the 2004 census that indicates more aboriginals reside in south Taiwan (Spearman’s correlation is marginally significant, p = 0.08). The branching order (Figure S16) and mean tribal divergence times (Table S4) are summarized into Figure 4D as well as incorporated results from the first simulation.
Supplemental Data
Web Resources
The URLs for data presented herein are as follows:
Fluxus Engineering, http://www.fluxus-engineering.com
GenBank, http://www.ncbi.nlm.nih.gov/genbank/
Accession Numbers
The complete mtDNA sequences reported herein have been submitted to GenBank under the accession numbers KF540505 (Liangdao Man) and KF540506-KF541055 (550 sequences from 12 Taiwanese groups).
References
- 1.Gray R.D., Drummond A.J., Greenhill S.J. Language phylogenies reveal expansion pulses and pauses in Pacific settlement. Science. 2009;323:479–483. doi: 10.1126/science.1166858. [DOI] [PubMed] [Google Scholar]
- 2.Soares P., Rito T., Trejaut J., Mormina M., Hill C., Tinkler-Hundal E., Braid M., Clarke D.J., Loo J.H., Thomson N. Ancient voyaging and Polynesian origins. Am. J. Hum. Genet. 2011;88:239–247. doi: 10.1016/j.ajhg.2011.01.009. [DOI] [PMC free article] [PubMed] [Google Scholar]
- 3.Hill C., Soares P., Mormina M., Macaulay V., Clarke D., Blumbach P.B., Vizuete-Forster M., Forster P., Bulbeck D., Oppenheimer S., Richards M. A mitochondrial stratigraphy for island southeast Asia. Am. J. Hum. Genet. 2007;80:29–43. doi: 10.1086/510412. [DOI] [PMC free article] [PubMed] [Google Scholar]
- 4.Mirabal S., Cadenas A.M., Garcia-Bertrand R., Herrera R.J. Ascertaining the role of Taiwan as a source for the Austronesian expansion. Am. J. Phys. Anthropol. 2013;150:551–564. doi: 10.1002/ajpa.22226. [DOI] [PubMed] [Google Scholar]
- 5.Li H., Wen B., Chen S.J., Su B., Pramoonjago P., Liu Y., Pan S., Qin Z., Liu W., Cheng X. Paternal genetic affinity between Western Austronesians and Daic populations. BMC Evol. Biol. 2008;8:146. doi: 10.1186/1471-2148-8-146. [DOI] [PMC free article] [PubMed] [Google Scholar]
- 6.Sagart L. The expansion of Setaria farmers in East Asia: A linguistic and archaeological model. In: Sanchez-Mazas A., Ross M., Peiros I., Lin M., editors. Past Human Migrations in East Asia: Matching Archaeology, Linguistics and Genetics. Routledge; New York: 2008. pp. 133–167. [Google Scholar]
- 7.Blust R. Selected papers from the Eighth International Conference on Austronesian Linguistics. In: Zeitoun E., Li P., editors. Symposium series of the Institute of Linguistics. Academia Sinica; Taipei, Taiwan: 1999. pp. 31–94. [Google Scholar]
- 8.Rohland N., Siedel H., Hofreiter M. A rapid column-based ancient DNA extraction method for increased sample throughput. Mol. Ecol. Resour. 2010;10:677–683. doi: 10.1111/j.1755-0998.2009.02824.x. [DOI] [PubMed] [Google Scholar]
- 9.Meyer M., Kircher M., Gansauge M.T., Li H., Racimo F., Mallick S., Schraiber J.G., Jay F., Prüfer K., de Filippo C. A high-coverage genome sequence from an archaic Denisovan individual. Science. 2012;338:222–226. doi: 10.1126/science.1224344. [DOI] [PMC free article] [PubMed] [Google Scholar]
- 10.Meyer M., Kircher M. Illumina sequencing library preparation for highly multiplexed target capture and sequencing. Cold Spring Harb Protoc. 2010;2010 doi: 10.1101/pdb.prot5448. t5448. [DOI] [PubMed] [Google Scholar]
- 11.Dabney J., Meyer M. Length and GC-biases during sequencing library amplification: a comparison of various polymerase-buffer systems with ancient and modern DNA sequencing libraries. Biotechniques. 2012;52:87–94. doi: 10.2144/000113809. [DOI] [PubMed] [Google Scholar]
- 12.Kircher M., Sawyer S., Meyer M. Double indexing overcomes inaccuracies in multiplex sequencing on the Illumina platform. Nucleic Acids Res. 2012;40:e3. doi: 10.1093/nar/gkr771. [DOI] [PMC free article] [PubMed] [Google Scholar]
- 13.Margulies M., Egholm M., Altman W.E., Attiya S., Bader J.S., Bemben L.A., Berka J., Braverman M.S., Chen Y.J., Chen Z. Genome sequencing in microfabricated high-density picolitre reactors. Nature. 2005;437:376–380. doi: 10.1038/nature03959. [DOI] [PMC free article] [PubMed] [Google Scholar]
- 14.Fu Q., Meyer M., Gao X., Stenzel U., Burbano H.A., Kelso J., Pääbo S. DNA analysis of an early modern human from Tianyuan Cave, China. Proc. Natl. Acad. Sci. USA. 2013;110:2223–2227. doi: 10.1073/pnas.1221359110. [DOI] [PMC free article] [PubMed] [Google Scholar]
- 15.Reich D., Patterson N., Kircher M., Delfin F., Nandineni M.R., Pugach I., Ko A.M., Ko Y.C., Jinam T.A., Phipps M.E. Denisova admixture and the first modern human dispersals into Southeast Asia and Oceania. Am. J. Hum. Genet. 2011;89:516–528. doi: 10.1016/j.ajhg.2011.09.005. [DOI] [PMC free article] [PubMed] [Google Scholar]
- 16.Andrews R.M., Kubacka I., Chinnery P.F., Lightowlers R.N., Turnbull D.M., Howell N. Reanalysis and revision of the Cambridge reference sequence for human mitochondrial DNA. Nat. Genet. 1999;23:147. doi: 10.1038/13779. [DOI] [PubMed] [Google Scholar]
- 17.Briggs A.W., Good J.M., Green R.E., Krause J., Maricic T., Stenzel U., Lalueza-Fox C., Rudan P., Brajkovic D., Kucan Z. Targeted retrieval and analysis of five Neandertal mtDNA genomes. Science. 2009;325:318–321. doi: 10.1126/science.1174462. [DOI] [PubMed] [Google Scholar]
- 18.Reich D., Green R.E., Kircher M., Krause J., Patterson N., Durand E.Y., Viola B., Briggs A.W., Stenzel U., Johnson P.L. Genetic history of an archaic hominin group from Denisova Cave in Siberia. Nature. 2010;468:1053–1060. doi: 10.1038/nature09710. [DOI] [PMC free article] [PubMed] [Google Scholar]
- 19.Green R.E., Malaspinas A.-S., Krause J., Briggs A.W., Johnson P.L.F., Uhler C., Meyer M., Good J.M., Maricic T., Stenzel U. A complete Neandertal mitochondrial genome sequence determined by high-throughput sequencing. Cell. 2008;134:416–426. doi: 10.1016/j.cell.2008.06.021. [DOI] [PMC free article] [PubMed] [Google Scholar]
- 20.Gunnarsdóttir E.D., Li M., Bauchet M., Finstermeier K., Stoneking M. High-throughput sequencing of complete human mtDNA genomes from the Philippines. Genome Res. 2011;21:1–11. doi: 10.1101/gr.107615.110. [DOI] [PMC free article] [PubMed] [Google Scholar]
- 21.van Oven M., Kayser M. Updated comprehensive phylogenetic tree of global human mitochondrial DNA variation. Hum. Mutat. 2009;30:E386–E394. doi: 10.1002/humu.20921. [DOI] [PubMed] [Google Scholar]
- 22.Wang J.Y. Academia Sinica Monographs. Institute of Ethnology; Nankang, Taipei: 1967. Population change of Formosan aborigines; p. 36. [Google Scholar]
- 23.Trejaut J.A., Kivisild T., Loo J.H., Lee C.L., He C.L., Hsu C.J., Lee Z.Y., Lin M. Traces of archaic mitochondrial lineages persist in Austronesian-speaking Formosan populations. PLoS Biol. 2005;3:e247. doi: 10.1371/journal.pbio.0030247. [DOI] [PMC free article] [PubMed] [Google Scholar]
- 24.Bandelt H.J., Forster P., Röhl A. Median-joining networks for inferring intraspecific phylogenies. Mol. Biol. Evol. 1999;16:37–48. doi: 10.1093/oxfordjournals.molbev.a026036. [DOI] [PubMed] [Google Scholar]
- 25.Drummond A.J., Suchard M.A., Xie D., Rambaut A. Bayesian phylogenetics with BEAUti and the BEAST 1.7. Mol. Biol. Evol. 2012;29:1969–1973. doi: 10.1093/molbev/mss075. [DOI] [PMC free article] [PubMed] [Google Scholar]
- 26.Minin V.N., Bloomquist E.W., Suchard M.A. Smooth skyride through a rough skyline: Bayesian coalescent-based inference of population dynamics. Mol. Biol. Evol. 2008;25:1459–1471. doi: 10.1093/molbev/msn090. [DOI] [PMC free article] [PubMed] [Google Scholar]
- 27.Darriba D., Taboada G.L., Doallo R., Posada D. jModelTest 2: more models, new heuristics and parallel computing. Nat. Methods. 2012;9:772. doi: 10.1038/nmeth.2109. [DOI] [PMC free article] [PubMed] [Google Scholar]
- 28.Soares P., Ermini L., Thomson N., Mormina M., Rito T., Röhl A., Salas A., Oppenheimer S., Macaulay V., Richards M.B. Correcting for purifying selection: an improved human mitochondrial molecular clock. Am. J. Hum. Genet. 2009;84:740–759. doi: 10.1016/j.ajhg.2009.05.001. [DOI] [PMC free article] [PubMed] [Google Scholar]
- 29.Excoffier L., Foll M. fastsimcoal: a continuous-time coalescent simulator of genomic diversity under arbitrarily complex evolutionary scenarios. Bioinformatics. 2011;27:1332–1334. doi: 10.1093/bioinformatics/btr124. [DOI] [PubMed] [Google Scholar]
- 30.Beaumont M.A., Zhang W., Balding D.J. Approximate Bayesian computation in population genetics. Genetics. 2002;162:2025–2035. doi: 10.1093/genetics/162.4.2025. [DOI] [PMC free article] [PubMed] [Google Scholar]
- 31.Jombart T., Devillard S., Balloux F. Discriminant analysis of principal components: a new method for the analysis of genetically structured populations. BMC Genet. 2010;11:94. doi: 10.1186/1471-2156-11-94. [DOI] [PMC free article] [PubMed] [Google Scholar]
- 32.Delfin F., Min-Shan Ko A., Li M., Gunnarsdóttir E.D., Tabbada K.A., Salvador J.M., Calacal G.C., Sagum M.S., Datar F.A., Padilla S.G. Complete mtDNA genomes of Filipino ethnolinguistic groups: a melting pot of recent and ancient lineages in the Asia-Pacific region. Eur. J. Hum. Genet. 2014;22:228–237. doi: 10.1038/ejhg.2013.122. [DOI] [PMC free article] [PubMed] [Google Scholar]
- 33.Jinam T.A., Hong L.C., Phipps M.E., Stoneking M., Ameen M., Edo J., Saitou N., HUGO Pan-Asian SNP Consortium Evolutionary history of continental southeast Asians: “early train” hypothesis based on genetic analysis of mitochondrial and autosomal DNA data. Mol. Biol. Evol. 2012;29:3513–3527. doi: 10.1093/molbev/mss169. [DOI] [PubMed] [Google Scholar]
- 34.Gunnarsdóttir E.D., Nandineni M.R., Li M., Myles S., Gil D., Pakendorf B., Stoneking M. Larger mitochondrial DNA than Y-chromosome differences between matrilocal and patrilocal groups from Sumatra. Nat Commun. 2011;2:228. doi: 10.1038/ncomms1235. [DOI] [PubMed] [Google Scholar]
- 35.Soares P., Trejaut J.A., Loo J.H., Hill C., Mormina M., Lee C.L., Chen Y.M., Hudjashov G., Forster P., Macaulay V. Climate change and postglacial human dispersals in southeast Asia. Mol. Biol. Evol. 2008;25:1209–1218. doi: 10.1093/molbev/msn068. [DOI] [PubMed] [Google Scholar]
- 36.Friedlaender J.S., Friedlaender F.R., Hodgson J.A., Stoltz M., Koki G., Horvat G., Zhadanov S., Schurr T.G., Merriwether D.A. Melanesian mtDNA complexity. PLoS ONE. 2007;2:e248. doi: 10.1371/journal.pone.0000248. [DOI] [PMC free article] [PubMed] [Google Scholar]
- 37.Peng M.S., Palanichamy M.G., Yao Y.G., Mitra B., Cheng Y.T., Zhao M., Liu J., Wang H.W., Pan H., Wang W.Z. Inland post-glacial dispersal in East Asia revealed by mitochondrial haplogroup M9a’b. BMC Biol. 2011;9:2. doi: 10.1186/1741-7007-9-2. [DOI] [PMC free article] [PubMed] [Google Scholar]
- 38.Shapiro B., Ho S.Y., Drummond A.J., Suchard M.A., Pybus O.G., Rambaut A. A Bayesian phylogenetic method to estimate unknown sequence ages. Mol. Biol. Evol. 2011;28:879–887. doi: 10.1093/molbev/msq262. [DOI] [PMC free article] [PubMed] [Google Scholar]
- 39.Fu Q., Mittnik A., Johnson P.L., Bos K., Lari M., Bollongino R., Sun C., Giemsch L., Schmitz R., Burger J. A revised timescale for human evolution based on ancient mitochondrial genomes. Curr. Biol. 2013;23:553–559. doi: 10.1016/j.cub.2013.02.044. [DOI] [PMC free article] [PubMed] [Google Scholar]
- 40.Excoffier L. Patterns of DNA sequence diversity and genetic structure after a range expansion: lessons from the infinite-island model. Mol. Ecol. 2004;13:853–864. doi: 10.1046/j.1365-294x.2003.02004.x. [DOI] [PubMed] [Google Scholar]
- 41.Kong Q.P., Sun C., Wang H.W., Zhao M., Wang W.Z., Zhong L., Hao X.D., Pan H., Wang S.Y., Cheng Y.T. Large-scale mtDNA screening reveals a surprising matrilineal complexity in east Asia and its implications to the peopling of the region. Mol. Biol. Evol. 2011;28:513–522. doi: 10.1093/molbev/msq219. [DOI] [PubMed] [Google Scholar]
- 42.Vilar M.G., Chan C.W., Santos D.R., Lynch D., Spathis R., Garruto R.M., Lum J.K. The origins and genetic distinctiveness of the Chamorros of the Marianas Islands: an mtDNA perspective. Am. J. Hum. Biol. 2013;25:116–122. doi: 10.1002/ajhb.22349. [DOI] [PMC free article] [PubMed] [Google Scholar]
- 43.Ricaut F.X., Razafindrazaka H., Cox M.P., Dugoujon J.M., Guitard E., Sambo C., Mormina M., Mirazon-Lahr M., Ludes B., Crubézy E. A new deep branch of eurasian mtDNA macrohaplogroup M reveals additional complexity regarding the settlement of Madagascar. BMC Genomics. 2009;10:605. doi: 10.1186/1471-2164-10-605. [DOI] [PMC free article] [PubMed] [Google Scholar]
- 44.Delfin F., Myles S., Choi Y., Hughes D., Illek R., van Oven M., Pakendorf B., Kayser M., Stoneking M. Bridging near and remote Oceania: mtDNA and NRY variation in the Solomon Islands. Mol. Biol. Evol. 2012;29:545–564. doi: 10.1093/molbev/msr186. [DOI] [PubMed] [Google Scholar]
- 45.Tabbada K.A., Trejaut J., Loo J.H., Chen Y.M., Lin M., Mirazón-Lahr M., Kivisild T., De Ungria M.C. Philippine mitochondrial DNA diversity: a populated viaduct between Taiwan and Indonesia? Mol. Biol. Evol. 2010;27:21–31. doi: 10.1093/molbev/msp215. [DOI] [PubMed] [Google Scholar]
- 46.Peng M.S., Quang H.H., Dang K.P., Trieu A.V., Wang H.W., Yao Y.G., Kong Q.P., Zhang Y.P. Tracing the Austronesian footprint in Mainland Southeast Asia: a perspective from mitochondrial DNA. Mol. Biol. Evol. 2010;27:2417–2430. doi: 10.1093/molbev/msq131. [DOI] [PubMed] [Google Scholar]
- 47.Bellwood P., Chambers G., Ross M., Hung H.-C. Are ‘cultures’ inherited? Multidisciplinary perspectives on the origins and migrations of Austronesian-speaking peoples prior 1000 BC. In: Roberts B., Vander Linden M., editors. Investigating Archaeological Cultures: Material Culture, Variability, and Transmission. Springer; New York: 2011. pp. 321–353. [Google Scholar]
- 48.Qi X., Cui C., Peng Y., Zhang X., Yang Z., Zhong H., Zhang H., Xiang K., Cao X., Wang Y. Genetic evidence of paleolithic colonization and neolithic expansion of modern humans on the tibetan plateau. Mol. Biol. Evol. 2013;30:1761–1778. doi: 10.1093/molbev/mst093. [DOI] [PubMed] [Google Scholar]
- 49.Bellwood P. The checkered prehistory of rice movement southwards as a domesticated cereal—from the Yangzi to the equator. Rice. 2011;4:93–103. [Google Scholar]
- 50.Tsang C.H. Recent discoveries at the Tapenkeng culture sites in Taiwan: Implications for the problem of Austronesian origins. In: Blench R., Sagart L., Sanchez-Mazas A., editors. The Peopling of East Asia: Putting Together Archaeology, Linguistics and Genetics. Routledge/Curzon; London: 2005. pp. 63–73. [Google Scholar]
- 51.Yang X., Wan Z., Perry L., Lu H., Wang Q., Zhao C., Li J., Xie F., Yu J., Cui T. Early millet use in northern China. Proc. Natl. Acad. Sci. USA. 2012;109:3726–3730. doi: 10.1073/pnas.1115430109. [DOI] [PMC free article] [PubMed] [Google Scholar]
- 52.Molina J., Sikora M., Garud N., Flowers J.M., Rubinstein S., Reynolds A., Huang P., Jackson S., Schaal B.A., Bustamante C.D. Molecular evidence for a single evolutionary origin of domesticated rice. Proc. Natl. Acad. Sci. USA. 2011;108:8351–8356. doi: 10.1073/pnas.1104686108. [DOI] [PMC free article] [PubMed] [Google Scholar]
- 53.Diamond J., Bellwood P. Farmers and their languages: the first expansions. Science. 2003;300:597–603. doi: 10.1126/science.1078208. [DOI] [PubMed] [Google Scholar]
- 54.Rolett B.V., Zheng Z., Yue Y. Holocene sea-level change and the emergence of Neolithic seafaring in the Fuzhou Basin (Fujian, China) Quat. Sci. Rev. 2011;30:788–797. [Google Scholar]
- 55.Bellwood P. Oxford Univ. Press; New York: 1978. Man’s Conquest of the Pacific: The Prehistory of Southeast Asia and Oceania. [Google Scholar]
- 56.Bellwood P. University of Hawai’i Press; Honolulu: 1997. Prehistory of the Indo-Malaysian Archipelago. [Google Scholar]
- 57.Li P.J.K. Time perspective of Formosan aborigines. In: Sanchez-Mazas A., Ross M., Peiros I., Lin M., editors. Past Human Migrations in East Asia: Matching Archaeology, Linguistics and Genetics. Routledge; New York: 2008. pp. 211–218. [Google Scholar]
- 58.Ross M. Proto Austronesian verbal morphology: A reappraisal. In: Adelaar A., Pawley A., editors. Austronesian Historical Linguistics and Culture History: A Festschrift for Robert Blust. Pacific Linguistics; Canberra: 2009. pp. 295–326. [Google Scholar]
- 59.Gutenkunst R.N., Hernandez R.D., Williamson S.H., Bustamante C.D. Inferring the joint demographic history of multiple populations from multidimensional SNP frequency data. PLoS Genet. 2009;5:e1000695. doi: 10.1371/journal.pgen.1000695. [DOI] [PMC free article] [PubMed] [Google Scholar]
- 60.Neuenschwander S., Largiadèr C.R., Ray N., Currat M., Vonlanthen P., Excoffier L. Colonization history of the Swiss Rhine basin by the bullhead (Cottus gobio): inference under a Bayesian spatially explicit framework. Mol. Ecol. 2008;17:757–772. doi: 10.1111/j.1365-294X.2007.03621.x. [DOI] [PubMed] [Google Scholar]
- 61.Felsenstein J. The number of evolutionary trees. Syst. Zool. 1978;27:27–33. [Google Scholar]
- 62.Lin C.F., Wang J.D., Chen P.H., Chang S.J., Yang Y.H., Ko Y.C. Predictors of betel quid chewing behavior and cessation patterns in Taiwan aborigines. BMC Public Health. 2006;6:271. doi: 10.1186/1471-2458-6-271. [DOI] [PMC free article] [PubMed] [Google Scholar]
Associated Data
This section collects any data citations, data availability statements, or supplementary materials included in this article.