Abstract
Recently we published two independent studies describing novel gene expression-based classifications of colorectal cancer (CRC). Notably, each study stratified CRC into a different number of subtypes: one reported 3 subtypes, whereas the second highlighted 5. Given that each ascribed clinical significance, distinctive biology, and therapeutic prognosis to the different subtypes, we sought to reconcile this apparent incongruity in subtype stratification of CRC, and to interrelate the results. To do so, we each evaluated the other’s data sets and analytical methods and discovered that the subtypes and their classifiers are, in fact, clearly related to each other; indeed, the 5 subtype outcomes can be coalesced into the same three. In addition to presenting this clarification, we briefly discuss how both classification methods can be viewed within the broader literature on CRC subtypes, and potentially applied.
Keywords: colorectal cancer, cancer subtypes, consensus clustering, therapy resistance, MSI, CIMP, cetuximab, serrated pathway
Introduction
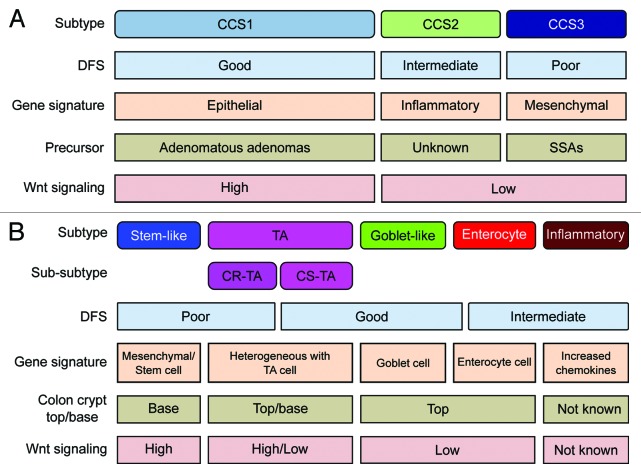
Recently our groups concurrently published 2 independent studies describing novel gene expression-based classifications of colorectal cancer (CRC).1,2 In the study of De Sousa E Melo et al., 3 different types of CRC (CCS1-CIN, CCS2-MSI, and CCS3-serrated) were identified that were differentiated by their genetic and clinicopathological characteristics1 (Fig. 1A). In the second study, Sadanandam et al. identified a classification of CRC into 5 subtypes (stem-like, transit amplifying [TA], enterocyte, goblet-like, and inflammatory type), of which the TA type could be further subdivided into 2 sub-groups based on different responses to epidermal growth factor receptor (EGFR)-targeted therapy (cetuximab)2 (Fig. 1B). Each study identified sets of genes—signatures—whose differential expression among CRCs can stratify ostensibly similar tumors into subtypes with distinctive characteristics of potential clinical significance. We anticipated that these 2 studies, published back-to-back, might cause some confusion, as at first sight they appear incongruous: Are there 3 or 5 CRC subtypes? And what can explain the difference in the number of subtypes identified? After detailed evaluation of our respective data sets and analytical methods, we present here a reconciliation of the 2 taxonomies. We conclude that the classifiers strongly relate to each other. Below we briefly present an in-depth analysis of the relationships between the distinctly named and numbered subtypes from the 2 studies.
Figure 1. Overview of CRC classification studies. (A and B) Graphic showing the clinical and biological characteristics and gene signatures of Colon Cancer Subtypes (CCS) (A) and CRCassigner subtypes (B). SSA, sessile serrated adenoma; TA, transit-amplifying; CR-TA, cetuximab-resistant TA; CS-TA, cetuximab-sensitive TA; DFS, disease-free survival.
Results
Both our studies separated patients into distinct groups by performing an unbiased consensus-based clustering of core data sets for various numbers of clusters (k = 2–10) using different clustering methods. Subsequently the number of clusters that best represents in the collective data set was selected using a statistical algorithm that summarizes how similar individual patients are within a cluster, and how dissimilar they are across clusters (namely their cophenetic coefficient: CC2 or gap score1). In this analysis, k = 3, indicating 3 subtypes, resulting in robust cluster stability in both of our studies.1,2 However, additional heterogeneity was detected in one study within some of the clusters, which can be accommodated by using 5 clusters instead of 3, which led one of us to use k = 5 as the standard, while mentioning the k = 3 cluster solution in the supplementary information.2 Importantly k = 3 or k = 5 do not significantly differ in gap score or CC for both core data sets, and are therefore both suitable solutions that can be adopted (Fig. S1).
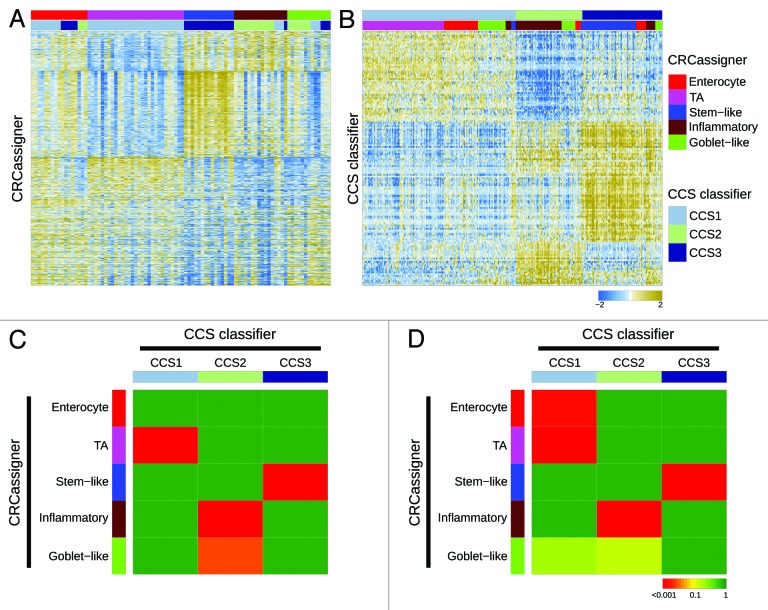
To investigate how our proposed subtypes relate to each other, we re-evaluated the 2 data sets from our studies by exchanging data sets and applying our distinctive classifiers and clustering methods on the other’s data set (Fig. 2A and B). Specifically, we applied the CRCassigner-786 classifier and non-matrix factorization (NMF) algorithm methodology from Sadanandam et al. to classify the AMC-AJCCII-90 data set from De Sousa E Melo et al. (Fig. 2A). Similarly, we applied the 146-gene CCS classifier from De Sousa E Melo et al. to classify the core data sets from Sadanandam et al. (Fig. 2B), using different methods than those used by Sadanandam et al., in order to correct for batch effects, and merged the data sets; see the “Materials and Methods” section for details. This logic of applying each group’s methods on other’s data sets provided a means to investigate the discrepancies in the number and nature of the CRC subtypes identified in the 2 studies. In addition, we determined the significance of association of the various subtypes by assessing the overrepresentation of tumor samples of one CRCassigner subtype in each of CCS subtypes and vice versa using a hypergeometric test (sample enrichment analysis; Fig. 2C and D). Importantly, we observed that in general the subtypes defined by Sadanandam et al. are further subdivisions of those defined by De Sousa E Melo et al. There is an obvious consensus between our classifications, although minor variations exist between the different data sets that probably relate to the sample size and variations in the composition of the patient series and methodologies used.
Figure 2. Relationships of colorectal cancer subtype classifications. (A and B) Heatmaps depict the AMC-AJCCII-90 data set classified according to the CRCassigner signature (A) and the Sadanandam et al. core data set classified based on the CCS classification (B). Columns represent patients; rows indicate CRCassigner genes (A) or CCS classifier genes (B). Colors represent relative gene expression levels; blue signifies low expression, and brown high expression. (C and D) Heatmaps indicate association of CRCassigner subtype samples (left) with CCS group samples (top) for the AMC-AJCCII-90 set (C) and the Sadanandam et al. core data set (D). Colors indicate significance of association; green signifies a low association, and red a high association. P values are determined using hypergeometric tests.
Overall, our analysis, summarized in Figure 2, reveals that the TA and enterocyte subtypes are subsets of the CCS1-CIN subtype, whereas the tumors defined as CCS2-MSI encompass the inflammatory and goblet-like subtypes; the stem-like subtype is highly related to the CCS3-serrated subtype. These associations make sense also in light of previous studies, since MSI tumors are often associated with an inflammatory immune infiltrate and a mucinous phenotype,3 and poor prognosis CRC (CCS3-serrated) has previously been shown to display a stem cell-like gene expression signature.4,5 Thus, we found that 2 of the De Sousa E Melo et al. subtypes were simply subdivided to generate a total of four subsets in the Sadanandam et al. study.
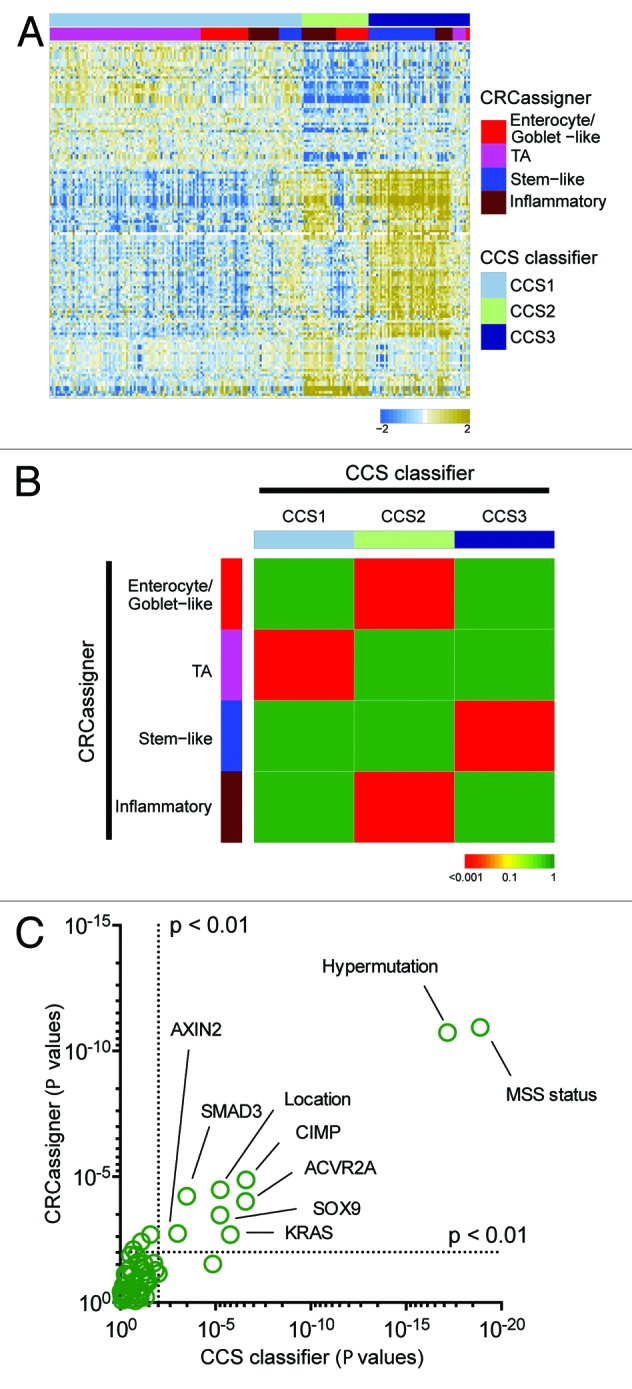
We further assessed the concordance in our classification signatures using a third data set from the TCGA consortium6 using both of our methodologies. We had already used the CRCassigner signature to classify the TCGA data set, as described in Sadanandam et al.2 Now, we applied the CCS classification to that TCGA data set, as described in the “Materials and Methods” section. Then, we sought to associate both classifications of the TCGA data set using a heatmap and the hypergeometric test (Fig. 3A and B). Additionally, we evaluated the overall association of the subtypes with the clinical and (epi)genetic characteristics reported for the TCGA data set.6 Both classifications associate subtypes with phenotypic features, in particular microsatellite stability status, CpG island methylator phenotype (CIMP), BRAF mutations, and tumor location in the colon (Fig. 3C). Furthermore, analogous trends are observed for the 2 classifications with respect to the conclusion that patients with a CCS3/stem-like subtype have a poor prognosis.1,2

Figure 3. Validation in the TCGA data set. (A) Heatmap depicts the TCGA data set classified by both taxonomies. Columns represent patients; rows indicate genes from the CCS classifier. Colors represent relative gene expression levels; blue signifies low expression, and brown, high expression. (B) Heatmap indicates association of CRCassigner subtype samples (left) with CCS group samples (top) for the TCGA set. Colors indicate significance of association; green signifies a low association, and red a high association. P values are determined using hypergeometric tests. (C) Graph depicts the association of clinical and (epi)genetic characteristics with both classification methods for the TCGA data set. Features that are significantly associated with both classification schemes are indicated. P values are determined using Chi-square tests.
Discussion
These analyses establish that the 2 independently derived classification schemes are not in conflict, but instead support each other’s legitimacy. In addition, both taxonomies have, in our view, their own unique appeal: the CCS classification closely coincides with well-established and clinically relevant CRC subtypes, MSI (microsatellite instable) and CIN (chromosomal instable) tumors, and further identified a third, previously less-defined entity (CCS3-serrated) that displays a particularly poor prognosis and is associated with a different precursor lesion (Fig. 1A).1 The CRCassigner proposes a categorization that draws parallels with various cell type-specific characteristics that can be recognized in the normal colon crypt. Thus the goblet-like and enterocyte CRC subtypes express high levels of goblet cell and enterocyte-specific genes, respectively, whereas the stem-like subtype has high Wnt signaling and both stem-cell and mesenchymal signatures, and the TA subtype displays heterogeneity in Wnt activity (Fig. 1B).2 It remains to be established if these distinctive normal cell types are indeed the cell-of-origin for CRCs ascribable to these subtypes, or whether these molecular characteristics are rather features of malignant transformation.
In addition, both classifications define subtypes that are associated with differential response to therapeutic strategies that are currently employed for treatment of CRC. Using the same patient series (Khambata-Ford7), both stratifications identified subgroups of patients that are resistant to cetuximab therapy. For instance, CCS3-serrated tumors are relatively resistant to EGFR-targeted therapy, and a similar trend can be observed for the stem-like subtype of Sadanandam et al., which functionally corroborates the association between these subtypes. Furthermore, in Sadanandam et al. a 2-tier approach was described in which TA-subtype patients can be further subdivided into cetuximab-resistant and cetuximab-sensitive patients (CR-TA and CS-TA, respectively) using a small gene panel, thereby indicating even further relevant heterogeneity within the major subtypes of both studies.
We envision that these proposed classifications will facilitate future research on CRC heterogeneity and its implications for therapy, a disease which may come to be treated based on molecular subtype, much as is increasingly the case for breast and non-small cell lung cancer.8 Attempts to define therapeutic strategies for CRC based on targetable mutations has not been fruitful, apart from the intrinsic resistance of KRAS-mutated CRCs to EGFR targeted therapy that dictates exclusion.9 Our studies demonstrate that more general and unbiased tumor categories can be defined based on gene expression profiles, which associate with distinct molecular and cellular features, and that the subtypes may be differentially responsive to distinctive therapies. More data from both larger and prospective cohorts should in due course clarify whether and how these distinct but interrelated classification systems can best be used to guide decisions about patient care, and we will actively pursue clarity and consensus on this important question in the future. Notably, both studies propose simple immunohistochemical assays that may enable classification of patients in the context of clinical trials evaluating both standard and nouveau therapies in regard to potential subtype selectivity in beneficial responses and intrinsic resistance.
Materials and Methods
Classifying the core data set of Sadanandam et al. and the TCGA set by the CCS classifier
CRC tumor samples of the “core” data set of Sadanandam et al. from 2 cohorts: GSE13294 (n = 135) and GSE14333 (n = 252), were normalized by frozen robust multiarray analysis (fRMA10) separately. Batch effect was detected by principle component analysis and corrected by ComBat.11 The CCS classifier built based on PAM in De Sousa E Melo et al. was then applied to classify the merged median centered expression profiles of total 387 CRC tumor samples that passed the Silhouette-based selection of samples from Sadanandam et al.2 For CCS-based classification of the TCGA data, the normalized gene expression profiles, based on Agilent Microarray platform, for 220 CRC tumors were obtained from the TCGA Data Portal (https://tcga-data.nci.nih.gov/docs/publications/coadread_2012/). Probesets were mapped to unique gene symbols, based on the criterion that for each gene we select the probeset with highest overall expression. Similarly, we applied the CCS classifier to classify the median centered expression data of signature genes. Those signature genes of the CCS classifier that cannot be found in the TCGA data set were substituted by their most correlated genes.
Classifying the AMC-AJCCII-90 set and the TCGA set by CRCassigner
Affymetrix GeneChip® Human Genome U133 Plus 2.0 arrays of tumors samples from AMC-AJCCII-90 (GSE33113) was processed and normalized using R and Bioconductor-based robust multiarray analysis (RMA).12 After mapping CRCassigner-786 genes on to the normalized AMC-AJCCII-90 data, we performed NMF-based classification as described.2 The normalization and processing of TCGA data set for CRCassigner classification is described in the supplementary information of Sadanandam et al.2
Comparison of subtypes
For each of the AMC-AJCCII-90, the core data set of Sadanandam et al., and the TCGA data set, we performed sample enrichment analysis using hypergeometric tests to compare the classification results from the CCS and CRCassigner classifiers. P values derived from these tests (Benjamini–Hochberg corrected) indicate strength of association between CRCassigner subtypes and CCS subtypes. For classification results of the TCGA data set using either CRCassigner or CCS classifier, we performed chi-square tests to inspect the association with a variety of clinical features and mutations. Gap statistic and cophenetic coefficients for varying cluster numbers were determined as described.1,2
Supplementary Material
Disclosure of Potential Conflicts of Interest
No potential conflicts of interest were disclosed.
Acknowledgments
We thank all the authors on the original publications for fruitful discussion and relevant comments on the contents of this manuscript. LV is supported by a KWF Fellowship (Dutch Cancer Society). We acknowledge NHS funding to the NIHR Biomedical Research Centre for Cancer (AS). This work was partially supported by a Swiss National Science Foundation project grant awarded to DH.
Footnotes
Previously published online: www.landesbioscience.com/journals/cc/article/27769
References
- 1.De Sousa E Melo F, Wang X, Jansen M, Fessler E, Trinh A, de Rooij LP, de Jong JH, de Boer OJ, van Leersum R, Bijlsma MF, et al. Poor-prognosis colon cancer is defined by a molecularly distinct subtype and develops from serrated precursor lesions. Nat Med. 2013;19:614–8. doi: 10.1038/nm.3174. [DOI] [PubMed] [Google Scholar]
- 2.Sadanandam A, Lyssiotis CA, Homicsko K, Collisson EA, Gibb WJ, Wullschleger S, Ostos LC, Lannon WA, Grotzinger C, Del Rio M, et al. A colorectal cancer classification system that associates cellular phenotype and responses to therapy. Nat Med. 2013;19:619–25. doi: 10.1038/nm.3175. [DOI] [PMC free article] [PubMed] [Google Scholar]
- 3.Boland CR, Goel A. Microsatellite instability in colorectal cancer. Gastroenterology. 2010;138:2073–87, e3. doi: 10.1053/j.gastro.2009.12.064. [DOI] [PMC free article] [PubMed] [Google Scholar]
- 4.de Sousa E Melo F, Colak S, Buikhuisen J, Koster J, Cameron K, de Jong JH, Tuynman JB, Prasetyanti PR, Fessler E, van den Bergh SP, et al. Methylation of cancer-stem-cell-associated Wnt target genes predicts poor prognosis in colorectal cancer patients. Cell Stem Cell. 2011;9:476–85. doi: 10.1016/j.stem.2011.10.008. [DOI] [PubMed] [Google Scholar]
- 5.Merlos-Suárez A, Barriga FM, Jung P, Iglesias M, Céspedes MV, Rossell D, Sevillano M, Hernando-Momblona X, da Silva-Diz V, Muñoz P, et al. The intestinal stem cell signature identifies colorectal cancer stem cells and predicts disease relapse. Cell Stem Cell. 2011;8:511–24. doi: 10.1016/j.stem.2011.02.020. [DOI] [PubMed] [Google Scholar]
- 6.Cancer Genome Atlas Network Comprehensive molecular characterization of human colon and rectal cancer. Nature. 2012;487:330–7. doi: 10.1038/nature11252. [DOI] [PMC free article] [PubMed] [Google Scholar]
- 7.Khambata-Ford S, Garrett CR, Meropol NJ, Basik M, Harbison CT, Wu S, Wong TW, Huang X, Takimoto CH, Godwin AK, et al. Expression of epiregulin and amphiregulin and K-ras mutation status predict disease control in metastatic colorectal cancer patients treated with cetuximab. J Clin Oncol. 2007;25:3230–7. doi: 10.1200/JCO.2006.10.5437. [DOI] [PubMed] [Google Scholar]
- 8.Sotiriou C, Piccart MJ. Taking gene-expression profiling to the clinic: when will molecular signatures become relevant to patient care? Nat Rev Cancer. 2007;7:545–53. doi: 10.1038/nrc2173. [DOI] [PubMed] [Google Scholar]
- 9.De Roock W, Piessevaux H, De Schutter J, Janssens M, De Hertogh G, Personeni N, Biesmans B, Van Laethem JL, Peeters M, Humblet Y, et al. KRAS wild-type state predicts survival and is associated to early radiological response in metastatic colorectal cancer treated with cetuximab. Ann Oncol. 2008;19:508–15. doi: 10.1093/annonc/mdm496. [DOI] [PubMed] [Google Scholar]
- 10.McCall MN, Bolstad BM, Irizarry RA. Frozen robust multiarray analysis (fRMA) Biostatistics. 2010;11:242–53. doi: 10.1093/biostatistics/kxp059. [DOI] [PMC free article] [PubMed] [Google Scholar]
- 11.Johnson WE, Li C, Rabinovic A. Adjusting batch effects in microarray expression data using empirical Bayes methods. Biostatistics. 2007;8:118–27. doi: 10.1093/biostatistics/kxj037. [DOI] [PubMed] [Google Scholar]
- 12.Gentleman RC, Carey VJ, Bates DM, Bolstad B, Dettling M, Dudoit S, Ellis B, Gautier L, Ge Y, Gentry J, et al. Bioconductor: open software development for computational biology and bioinformatics. Genome Biol. 2004;5:R80.1-16. doi: 10.1186/gb-2004-5-10-r80. [DOI] [PMC free article] [PubMed] [Google Scholar]
Associated Data
This section collects any data citations, data availability statements, or supplementary materials included in this article.


