

Abstract
The COP9 signalosome (CSN) is an evolutionarily conserved protein complex that participates in the regulation of the ubiquitin/26S proteasome pathway by controlling the function of cullin-RING-ubiquitin ligases. Impressive progress has been made in deciphering its critical role in diverse cellular and developmental processes. However, little is known about the underlying regulatory principles that coordinate its function. Through biochemical and fluorescence microscopy analyses, we determined that the complex is localized in the cytoplasm, nucleoplasm, and chromatin-bound fractions, each differing in the composition of posttranslationally modified subunits, depending on its location within the cell. During the cell cycle, the segregation between subcellular localizations remains steady. However, upon UV damage, a dose-dependent temporal shuttling of the CSN complex into the nucleus was seen, accompanied by upregulation of specific phosphorylations within CSN1, CSN3, and CSN8. Taken together, our results suggest that the specific spatiotemporal composition of the CSN is highly controlled, enabling the complex to rapidly adapt and respond to DNA damage.
INTRODUCTION
The COP9 signalosome (CSN) is a conserved multisubunit complex which was identified 2 decades ago in plants in a screen of mutant seedlings exhibiting constant photomorphogenesis (reviewed in references 1 and 2). Later on, the complex was also found in mammals, and today, it is known to be conserved throughout evolution, from fungi to humans. In higher organisms, the complex is composed of 8 subunits, termed CSN1 to CSN8 (1, 2). Deletions of single subunits are lethal, and directed postnatal deletions cause pronounced developmental and functional damage. On the other hand, lower eukaryotes, such as various fungi, contain smaller versions of the complex; mutants arising from subunit deletions are viable, and only a small subset of them result in a detectable phenotype. Thus, it appears that the evolutionary evolvement of the CSN, reflected in the addition of subunits, has also increased its functional complexity and its significance in development (3).
Six of the eight canonical CSN subunits (CSN1, CSN2, CSN3, CSN4, CSN7, and CSN8) contain PCI domains (for proteasome, COP9, and initiation factor 3) (4), while the two additional subunits (CSN5 and CSN6) contain an MPN domain (Mpr1-Pad1-N terminal) (5). The JAB1/MPN/Mov34 metalloenzyme (JAMM) motif within the MPN domain of CSN5 is responsible for the enzymatic activity of the CSN, namely, deneddylation, the cleavage of Nedd8, a ubiquitin-like protein, from cullin-RING E3 ligases (CRLs) (5). This catalytic function is dependent on the integrity of the complex (6). CSN6 contains a noncatalytic MPN domain lacking the JAMM motif, and it was recently shown that it is dispensable for complex integrity, as well as for deneddylation (7). Thus far, a high-resolution molecular structure for the CSN has not been resolved, but structural mass spectrometry (MS) analysis and single-particle analysis via electron microscopy have succeeded in elucidating the topology and structural arrangement of reconstituted and biochemically active human CSN (8–10).
CSN regulates the ability of CRLs to ubiquitinate protein substrates prior to their degradation by the 26S proteasome (11). CRLs are multisubunit ubiquitin ligases in which a central cullin subunit links a substrate-binding adaptor with an E2-binding RING protein (12). Covalent conjugation of the Nedd8 molecule to cullins causes pronounced conformational changes in the CRL architecture, thereby generating the required platform for efficient substrate ubiquitination (13, 14). The catalytic removal of Nedd8 from cullins by the CSN (5, 11) reverses this structural rearrangement, inducing partial CRL disassembly and physical separation of the functional modules from each other (13). Nonneddylated cullins can then bind CAND1, a 120-kDa HEAT repeat protein, which acts to stabilize the CRLs in an inactive state (15). It was recently shown that in addition to this catalytic mechanism, CSN also inhibits CRL function in a noncatalytic fashion (10, 16). CSN can physically bind the CRLs, independently of deneddylation, and preclude interactions with E2 enzymes and ubiquitination substrates, leading to a reduction in the ubiquitin ligase activity of the CRLs (10, 16).
The mechanisms by which CSN mediates the inactivation of CRLs are known to have fundamental biological significance, acting on three regulatory levels: (i) controlling protein stability through deactivation of CRLs and subsequent inhibition of ubiquitination; (ii) maintaining the dynamic activation/deactivation cycles of CRLs by inducing their disassembly, and the biogenesis of new CRL assemblies, according to the changing needs of the cell; and (iii) protecting the CRL components themselves, as active CRLs can target their own elements for ubiquitination and subsequent degradation (reviewed in references 2 and 17). Considering that CRLs account for nearly half of the cellular E3s and for approximately 20% of proteasome-dependent degradation, the robust functioning of the CSN is critical for myriad biological processes underlying normal development and physiology (12).
Deregulation of the CSN and its interactions can exert dramatic effects on diverse cellular functions, including DNA repair, cell cycle control, angiogenesis, and microenvironmental homeostasis, all of which are critical for tumor development (18, 19). Indeed, accumulating evidence indicates a correlation between aberrant functioning of the CSN and multiple cancers, making it an attractive target for therapeutic intervention (19, 20). Frequent overexpression of CSN subunits, especially the MPN proteins CSN5 and CSN6, in a variety of human cancers is correlated with cancer progression and poor survival (21–24), while inhibition or knockdown of CSN5 was shown to suppress tumor growth in mice (21, 25). Targeting CSN for cancer intervention, however, requires an in-depth understanding of the processes that regulate its mode of action. Considering the essential cellular role of the CSN, it is reasonable to assume that multiple mechanisms have evolved to coordinate its function; however, their molecular details still remain unclear.
In this study, we studied the various factors that affect CSN function by investigating its subunit diversity and relative abundances in different cellular compartments. We determined that CSN subunits are localized in the cytoplasm, nucleoplasm, and chromatin-associated fractions and display a diffusion pattern similar to that of a large macromolecular complex, implying that the individual CSN subunits assemble into a single, intact complex. Moreover, biochemical analysis revealed that CSN subunits are subject to differential posttranslational modifications (PTM) in the three cellular fractions. Following induction of UV damage, we could detect transient shuttling of the complex into the nucleus, as well as significant increases in the phosphorylation levels of specific domains within CSN1, CSN3, and CSN8. Taken together, our results demonstrate the subunit heterogeneity and dynamic flexibility of the CSN complex, suggesting that the cellular complex is composed of a versatile array of heterogeneous populations which can accommodate the changing needs of the cell.
MATERIALS AND METHODS
Cell lines and cell cultures.
HeLa and HEK293T cells were purchased from Cell Lines Service, Germany, and the American Type Culture Collection (ATCC), respectively. HEK293 cells were obtained from Eitan Reuveny (Weizmann Institute of Science). Cells were cultivated in Dulbecco's modified Eagle's medium (DMEM) supplemented with 10% fetal calf serum, penicillin-streptomycin, sodium pyruvate, nonessential amino acids (Biological Industries), and MycoZap (Lonza) in a humidified incubator at 37°C, in a 5% CO2 controlled environment, according to the manufacturer's instructions. Cells subjected to subcellular fractionation were harvested by trypsinization into phosphate-buffered saline (PBS) and collected at ∼0.5 × 10⁶ cells/tube. Unless otherwise indicated, all biochemical fractionations were performed in HeLa cells. For the generation of stable fluorescent CSN cell lines, HEK293 cells were transfected with expression vectors for Cerulean-CSN3 (Cer-CSN3) and Cerulean-CSN5 (Cer-CSN5) by CaCl2 transfection (26) and selected on hygromycin (0.4 mg/ml). HEK293T cells were transfected with expression vectors for Cerulean-CSN2 (Cer-CSN2), Cerulean-CSN6 (Cer-CSN6), and Cerulean-CSN7a (referred to as CSN7, Cer-CSN7) by lentiviral transfection. Transduced cells were isolated and sorted for low expression levels by fluorescence-activated cell sorting (FACSAria; BD Biosciences) and expanded in complete DMEM.
Confocal microscopy imaging.
Confocal fluorescence imaging and fluorescence recovery after photobleaching (FRAP) measurements were performed with an IX81-based Olympus FluoView 1000D microscope, equipped with a spectral scanning system and two independent laser scanners, MAIN and SIM, enabling rapid and simultaneous acquisition of images during photobleaching. Cells were imaged using a 1.35-numerical-aperture (NA) UPLSAPO 60× oil objective. Cerulean was excited at 442.7 nm, using a diode laser. FRAP was performed as follows: a region of 13.07 μm by 7.8 μm in the desired cellular domain was selected and continuously imaged at 105 ms/frame. Following 3 prebleach images, a circle of 7 μm was bleached for 25 ms using 100% laser power at 405 nm and continuously imaged for a total of 20 s, using the 442.7-nm-diode laser. Recovery curves were generated by normalizing the measured fluorescence in the bleached region to that of the prebleach values, after subtraction of background fluorescence (27). Every plot represents an average of 3 independent measurements of at least 20 cells. Normalized fluorescence recovery data were then individually plotted for each subunit and fitted to a single or double exponential equation using Origin (OriginLab Corporation). The double exponential equation y(t) = Y0 + A1(1 − e−k1t) + A2(1 − e−k2t) (28) (y is fluorescence, Y0 is the initial fluorescence after bleach, A1 and A2 are the coefficients of the fast and slow reactions, respectively, and k1 and k2 are the rate constants) was favored over the single exponential curve as judged by the pattern of residuals and higher R2 values. The parameters half-life 1 and 2 (t1/21 and t1/22) were calculated from the obtained k1 and k2 values, using the equation t1/2 = ln(2)/k. Fitting was not performed for free Cerulean, considering that the time corresponding to its recovery rate is less than the acquisition time (29).
Total protein extraction, subcellular fractionation, and Western blotting.
Total protein extraction was conducted using modified radioimmunoprecipitation assay (mRIPA) buffer (Merck-Millipore). Briefly, ∼0.5 × 10⁶ cells were lysed on ice for 10 min in buffer containing 50 mM HEPES (pH 7.6), 150 mM NaCl, 1% NP-40, 0.25% sodium deoxycholate, protease inhibitors (1 mM phenylmethylsulfonyl fluoride [PMSF], 1 mM benzamidine, 1.4 μg/ml pepstatin A), and phosphatase inhibitors (5 mM sodium orthovanadate, 4 mM sodium pyrophosphate, 4 mM β-glycerophosphate, 50 mM NaF). Extracts were cleared by centrifugation at 15,000 × g for 10 min. Cell fractionation was modified from references 30 and 31. A total of ∼0.5 × 10⁶ cells were resuspended in 0.2 ml hypotonic buffer A containing 10 mM HEPES (pH 7.6), 10 mM KCl, 1.5 mM MgCl2 with phosphatase inhibitors, 0.5% NP-40, and protease inhibitors (0.26 mM PMSF, 1 mM benzamidine, 1.4 μg/ml pepstatin A) and incubated on ice for 10 min. Then, 5 μl of 10% NP-40 was added, and cells were subjected to a vortex procedure for 10 s. The cytosolic fraction was separated from the nuclei by centrifugation at 650 × g for 3 min and further clarified by centrifugation at 10,000 × g for 10 min. The nuclear pellet was washed in 0.1 ml buffer A, and nuclei were pelleted at 450 × g for 2 min. Nuclei were then resuspended in 0.1 ml hypertonic CSK buffer, containing 20 mM HEPES (pH 7.6), 100 mM NaCl, 300 mM sucrose, 3 mM MgCl2, 1 mM CaCl2, with phosphatase inhibitors, 0.5% Triton X-100, and protease inhibitors, and incubated on ice for 3 min. The nucleoplasmic fraction was separated by centrifugation at 5,000 × g for 5 min. The pellet was resuspended in 0.08 ml hypertonic CSK buffer and incubated at room temperature (RT) for 15 min with 2,000 gel units of micrococcal nuclease (NEB). Chromatin-bound proteins were released from the DNA by addition of 0.02 ml of 1 M ammonium sulfate and incubation for 5 min on ice, followed by centrifugation at 5,000 × g for 5 min. Samples from different fractions were loaded on PAGE gels, blotted to nitrocellulose or polyvinylidene difluoride (PVDF) membranes, and probed with antibodies (anti-CSN1 [Enzo PW 8290], anti-CSN2 [Enzo PW8230], anti-CSN3 [Abcam ab79698], anti-CSN4 [Abcam ab12322], anti-CSN5 [Abcam ab495], anti-CSN6 [Enzo PW8295], anti-CSN7 [Enzo PW8300], anti-CSN8 [Enzo PW 8290], anti-GAPDH [anti-glyceraldehyde-3-phosphate dehydrogenase; Novus NBP1-47339], anti-histone 3 [Abcam ab24834], anti-DNA damage binding protein 2 [anti-DDB2; ab51017], and anti-green fluorescent protein [anti-GFP; Abcam ab290]).
Activity assay.
Deneddylation assays were performed using a neddylated Cul1 substrate (pcu1) from Schizosaccharomyces pombe cells deleted for CSN1 (caa1-d) (32). Cells were chromosomally tagged at the 5′ end of the pcu1 gene with a triple-hemagglutinin (triple-HA) tag, under the regulation of the P3nmt1 promoter, according to the method described in reference 33. S. pombe cell extracts were prepared according to reference 11, and cells were grown in yeast extract with glucose and supplements (YES medium) to an optical density at 600 nm (OD600) of ∼0.6, harvested, and washed in 10 mM Tris (pH 7.5). Cells were resuspended in an equal volume of lysis buffer containing 20 mM HEPES (pH 7.6), 150 mM NaCl, 0.2% Triton X-100, 1 mM dithiothreitol (DTT), and protease inhibitors and lysed using an equal volume of acid-washed glass beads, by 20 consecutive vortex steps, intermitting with 1 min incubation on ice. Cell lysate was cleared by two centrifugations at 15,000 × g for 10 min. For deneddylation assays, 7 μg cleared lysate was incubated in the presence of different amounts of HEK293 and HeLa protein extracts, as indicated, for 20 to 30 min at 37°C. Salt conditions were adjusted to 100 mM in all reactions. After deneddylation, proteins were resolved on a 9% acrylamide SDS-PAGE and visualized using an anti-HA antibody (Abcam ab9110).
2D gel electrophoresis, SDS-PAGE, and Western blotting.
Samples for two-dimensional (2D) gel electrophoresis were prepared according to GE Healthcare 2D electrophoresis principles and methods and reference 34, with few modifications. One milligram of cytosolic, nucleoplasmic, and chromatin-associated proteins was precipitated with three volumes of cold acetone (for CSN5 and CSN8) or isopropanol (for CSN1 and CSN3) for 1 to 2 h at −20°C and centrifuged at 10,000 × g for 30 min. Pellets were air dried for 1 min and solubilized in 0.4 ml 2D solubilization buffer containing 7 M urea, 2 M thiourea, 4% CHAPS {3-[(3-cholamidopropyl)-dimethylammonio]-1-propanesulfonate}, 2% ampholytes (Amersham) (pH 4 to 7), 120 mM DTT, and 40 mM Tris base. Proteins were dialyzed three times against 1 liter MilliQ water and lyophilized. Dried samples were resuspended in 0.4 ml 2D sample buffer (7 M urea, 2 M thiourea, 4% CHAPS, 0.5% ampholytes [pH 4 to 7], 0.5% Triton X-100, 5% glycerol, 20 mM DTT) and assayed for protein concentration according to reference 35. Samples (0.2 mg of each) were loaded onto 18-cm-long immobilized pH gradient (IPG) strips (Amersham) (pH 4 to 7). Proteins were rehydrated at 30 V for 10 to 12 h and focused on an Ettan IPGphor (Amersham) at gradients of 100, 300, 600, and 1,000 V, for 1 h at each step, and then at a 1,000-to-8,000 V gradient for 30 min and 8,000 V until 55,000 to 60,000 Vh was reached. Focused strips were equilibrated to SDS-PAGE in SDS equilibration buffer containing 6 M urea, 75 mM Tris-HCl (pH 8.8), 29.3% glycerol, 2% SDS, 1% DTT, and 0.002% bromophenol blue for 15 min and loaded onto PAGE gels. SDS-PAGE 1D and 2D reaction mixtures were transferred to nitrocellulose or PVDF membranes and incubated with antibodies against CSN subunits.
IP.
For immunoprecipitation (IP), 400 μg cytosolic, nuclear, and chromatin-associated proteins or combined nucleoplasmic and chromatin-bound proteins was used. Cytosolic proteins were diluted in 500 μl IP buffer, containing 10 mM HEPES (pH 7.6), 150 mM NaCl, 1.5 mM MgCl2, protease inhibitors, and phosphatase inhibitors, as described above. The NaCl concentration was adjusted to 150 mM. Nuclear proteins were diluted in 500 μl CSK buffer. Proteins were precleared by rotation with 35 μl of prewashed protein G-Sepharose beads (Amersham) for 1 h at 4°C. After removal of the resin, proteins were incubated with 6 μl anti-CSN3 antibody and gently rotated overnight (O/N) at 4°C. The following morning, proteins were incubated for 1 h at 4°C with 35 μl fresh prewashed protein G-Sepharose. For Western analyses, the resin was washed 3 times with IP buffer and boiled in SDS-PAGE sample buffer. Lysates (10 μg cytosolic proteins, 30 μg nuclear proteins) and immunoprecipitated proteins obtained from 25% of the IP reaction mixture were separated on SDS-PAGE gels, transferred to PVDF or nitrocellulose, and blotted with different antibodies.
Cell cycle synchronization by double-thymidine block.
HeLa cells were treated with 5 mM thymidine for 16 h, the thymidine was removed by washings, and cells were incubated with fresh medium for an additional 8 h and treated again with 5 mM thymidine for 16 h. Cells were harvested at different time points postrelease (36). The cell cycle stage was monitored by fluorescence-activated cell sorting (LSRII), following methanol fixation and propidium iodide staining (36).
Inducing DNA damage by UV irradiation.
HeLa cells, grown in 15-cm-diameter culture dishes, were washed twice in PBS and illuminated with UV-C in a chamber at different doses. Cells were collected at different time points postirradiation.
Chemical treatment of cells.
For the inhibition of new protein synthesis, 50 μg/ml cycloheximide was added to the growth medium, and cells were incubated for 1 h at 37°C before UV illumination. For the inhibition of proteasomal degradation, 20 μM MG132 was added to the growth medium 5 h before UV irradiation. Cells were harvested at different time points after induction of the damage.
Phosphopeptide analysis.
Three biological replicas of control and UV-irradiated cells were prepared. Cells collected 10 min postdamage were fractionated to cytosolic, nucleoplasmic, and chromatin-bound fractions. One milligram total protein of each fraction was immunoprecipitated as described above using 12 μl of anti-CSN3 antibody. Proteins were eluted from protein G-Sepharose beads with 75 μl glycine-HCl (pH 2.5) and neutralized with 3 μl of 2 M Tris-HCl (pH 8.8). Samples were stored in liquid N2 until further processing.
Samples were subjected to in-solution digestion. Proteins were first reduced using 5 mM DTT for 30 min at 60°C and alkylated with 10 mM iodoacetamide in the dark at room temperature. Trypsin was then added, and samples were incubated at 37°C overnight. Digestion was quenched by addition of trifluoroacetic acid (TFA) to reach a final concentration of 1%. The resulting solution was desalted with 50 mg Sep-Pak C18 cartridges (Waters Corp.) and lyophilized in a vacuum concentrator.
The phosphopeptides from the tryptic digests were enriched using a Ti4+-immobilized metal affinity chromatography (Ti4+-IMAC) microcolumn as previously described (37). Briefly, the trypsinized peptides were resuspended in 50 μl of 80% acetonitrile (ACN)–6% TFA and then loaded onto preconditioned Ti4+-IMAC microcolumns. After the sample loading, the Ti4+-IMAC microcolumns were sequentially washed with 30 μl of 50% ACN 0.5% TFA containing 200 mM NaCl and 30 μl of 50% ACN 0.1% TFA. The bound peptides were firstly eluted with 20 μl of 10% ammonia into 20 μl of 10% formic acid. The final elution was performed with 2 μl of 80% ACN–20% formic acid. Finally, 2 μl of neat formic acid was added to acidify the eluent and the acidified samples were subjected to liquid chromatography-tandem mass spectrometry (LC-MS/MS) analysis.
LC-MS/MS analysis.
All LC-MS/MS experiments were performed using a nanoAcquity UltraPerformance LC (UPLC) (Waters Corp., Milford, MA) system and a linear trap quadrupole (LTQ) Orbitrap Velos hybrid ion trap mass spectrometer (Thermo Scientific, Waltham, MA). Separation of peptides was performed by reverse-phase chromatography using a Waters reverse-phase nano column (BEH C18) (75-μm inner diameter [i.d.] by 250 mm; 1.7-μm particle size) at a flow rate of 300 nl/min. Peptides (5 μl) were initially loaded onto a precolumn (Waters UPLC Trap Symmetry C18) (180-μm i.d. by 20 mm; 5-μm particle size) from the nanoAcquity sample manager with 0.1% formic acid for 3 min at a flow rate of 10 μl/min. After this period, the column valve was switched to allow the elution of peptides from the precolumn onto the analytical column. Solvent A was water–0.1% formic acid, and solvent B was ACN–0.1% formic acid. The linear gradient employed was 2% to 40% solvent B in 40 min.
The LC eluent was sprayed into the mass spectrometer by means of a nanospray source. All m/z values of eluting ions were measured in the Orbitrap Velos mass analyzer, set at a resolution of 30,000. Data-dependent scans (Top 20) were employed to automatically isolate and generate fragment ions by collision-induced dissociation in the linear ion trap, resulting in the generation of MS/MS spectra. Ions with charge states of 2+ and above were selected for fragmentation.
Raw data were imported into the TransOmics software (Waters) (also known as Progenesis LC-MS) (38, 39). The software was used for retention time alignment and peak detection of precursor peptides. A master peak list was generated from all MS/MS events and sent for database searching using Mascot v2.4 (Matrix Sciences). Data were searched against UniprotKB version 05_2012, including 125 common laboratory contaminants. Fixed modification was set to carbamidomethylation of cysteines, and variable modification was set to oxidation of methionines and phosphorylation of serines, threonines, or tyrosines. Phosphopeptide site localization probability was calculated using Mascot Delta Score (40). Search results were then imported back to TransOmics to annotate identified peaks. Differential analysis was conducted by direct comparison of peak intensities across all samples. Technical replicates were averaged, and Student's t test, after logarithmic transformation, was used to identify significant differences across the biological replica. A P value of less than 0.05 was used as the significance threshold. All raw data, peak lists, and identifications were deposited to the ProteomeXchange Consortium (http://proteomecentral.proteomexchange.org) via the PRIDE partner repository (41) with the data set identifier PXD000277.
RESULTS
An active CSN is localized in the cytoplasm and nucleus.
Historically, the CSN was defined as a nuclear complex (42, 43), but more recent studies have demonstrated that CSN subunits are also localized in the cytoplasm (44–47). To systematically dissect the subcellular distribution of the CSN complex, we generated stable HEK293 cell lines, expressing the fluorescent protein Cerulean (Cer), fused to the N terminus of subunit CSN2, CSN3, CSN5, CSN6, or CSN7 (48). We selected lines that express the fluorescent subunits at close to endogenous levels and confirmed that the tagged subunits were properly incorporated into the complex by performing activity assays and immunoprecipitation analyses using antibodies against CSN3 and GFP (see Fig. S1 and S2 in the supplemental material). Activity assays demonstrated that cell lines expressing the fluorescently labeled subunits exhibit CSN enzymatic activity comparable to wild-type levels (see Fig. S1). Likewise, the CSN3 antibody efficiently pulled down the fluorescent subunits (see Fig. S2A), as well as endogenous subunits (see Fig. S2B), confirming that the N-terminal tag did not hinder integration into the complex. The integration of Cer-CSN3 into the complex was further validated by a reciprocal pulldown assay using an anti-GFP antibody (see Fig. S2C). Interestingly, we noted that in cell lines expressing Cer-CSN6 and Cer-CSN7, the expression levels of the endogenous subunits were strongly reduced, suggesting that the expression of these CSN subunits is tightly regulated (see Fig. S2A and B). Treatment of cells either with cycloheximide to inhibit new protein synthesis or with MG132 to hinder proteasomal degradation did not influence the expression level of endogenous CSN6 and CSN7 (data not shown), suggesting that their expression is regulated at the transcriptional level. Nevertheless, Cer-CSN6 and Cer-CSN7, like the other tagged subunits, were efficiently incorporated into the active CSN complex, enabling us to conclude that the fluorescently labeled cell lines can reliably reflect the endogenous complex properties.
Confocal microscopy analysis of the fluorescently labeled CSN subunits indicated that they accumulate in the cytoplasm and the nucleus (Fig. 1A). To study the diffusion kinetics of the CSN subunits in these compartments, we performed FRAP assays (49). For comparison, similar measurements were conducted on free Cerulean, representing the dynamics of a fully mobile monomeric protein (50). The FRAP data were fitted to models of exponential recovery in which all CSN subunits fitted better to a double exponential function than to a single exponential, indicating a “fast” (t1) and “slow” (t2) t1/2 (see Fig. S3 in the supplemental material). This result suggests that two processes operating on different time scales contribute to the complex mobility, where protein-protein interactions reduce the rate of movement of the subunits. Examination of the data indicated that in general, within each compartment, the recovery curves of the CSN subunits were very similar, displaying a mobility rate significantly lower than that of free Cerulean, suggesting that they are part of a similarly sized complex (51). CSN5, however, was the only subunit that exhibited in the cytosol a recovery rate higher than that of the other CSN subunits (Fig. 1B; see Fig. S3). This observation supports previous studies indicating that a fraction of the cytoplasmic CSN5 exists as a monomer or in smaller complexes outside the holo-CSN complex (52, 53). Interestingly, comparison of the cytosolic and nuclear fitting parameters indicates a higher contribution of the “slow” component to the mobility of the nuclear CSN. This observation may reflect some degree of transient immobilization, possibly through the interaction with chromatin (54), supporting previously reported findings indicating that the CSN may bear regulatory functions related to transcription regulation (55).
FIG 1.

Cellular CSN is localized in the cytoplasm and nucleus and displays the mobility of a large macromolecular complex. (A) Representative fluorescent midsection images of live HEK293 cells, stably transfected with CSN subunits N-terminally fused to Cerulean. The images indicate that CSN subunits are localized in the cytosol and nucleus but are excluded from nucleoli. For convenience, the nuclear borders are marked with a dashed line. Scale bars represent 10 μm. (B) FRAP curves of fluorescent CSN subunits and free Cerulean. Each plot constitutes an average of at least 60 cells, normalized to prebleach intensity.
CSN in the nucleus is partially bound to chromatin.
To further validate the partitioning of the CSN between the cellular compartments, we performed biochemical separations of cellular proteins into cytosolic, nucleoplasmic, and chromatin-associated fractions and analyzed the expression levels of the various CSN subunits in HEK293 and HeLa cells (Fig. 2A). In both cell lines, most of the CSN accumulated in the cytoplasm, while a smaller amount was found in the nucleus. Within the nucleus, a small subfraction was associated with chromatin, supporting our in vivo diffusion kinetics results (Fig. 1B). Since the results obtained for both HeLa and HEK293 cells were practically the same, we continued our studies using HeLa cells only.
FIG 2.

The active CSN complex is associated with the cytosol, nucleus, and chromatin. (A) Cellular proteins were biochemically separated into cytosolic (Cyt), nucleoplasmic (N), and chromatin-associated (Chr) fractions in the presence of phosphatase inhibitors and tested for the expression levels of various CSN subunits. For comparison, similar percentages of each fraction were loaded. Fractionation was assessed by detection of the chromatin-associated histone H3 (Histone3) protein and of the mainly cytosolic glyceraldehyde-3-phosphate dehydrogenase protein (GAPDH). IB, immunoblot. (B) The CSN complex was shown to be active in the different cellular fractions. Proteins from the different fractions were used in deneddylation assays utilizing neddylated HA-tagged S. pombe Cul1, and the immunoblot was visualized by anti-HA antibody. Proteins (30 μg) from each fraction were used for the activity assays.
To examine whether the CSN is catalytically active in the different cellular fractions, deneddylation assays were performed on proteins extracted from each compartment. Enzymatic activity was obtained for CSN in the three different cellular fractions (Fig. 2B), demonstrating that the complex is catalytically active in the cytosol, nucleoplasm, and chromatin.
Distinct forms of CSN subunits exist within the different cellular compartments.
It has been reported that CSN subunits are decorated by different PTMs (56–58, 60, 61). However, to the best of our knowledge, a systematic analysis of variations in the modifications among the different cellular compartments was not performed. We therefore analyzed a set of CSN subunits from the cytosol, nucleoplasm, and chromatin-bound fractions by two-dimensional (2D) electrophoresis, in which proteins are separated according to their pI and size. The migration patterns of CSN1, CSN3, CSN5, and CSN8 in each of the subcellular compartments are shown in Fig. 3.
FIG 3.

CSN subunits are distinctly modified in different cellular fractions. Cellular proteins were fractionated in the presence of phosphatase inhibitors into cytosolic (Cyt), nucleoplasmic (N), and chromatin (Chr) fractions, separated by 2D gel electrophoresis, and visualized using different anti-CSN antibodies, as indicated. Each spot represents a distinct variant of a CSN subunit.
In the cytosolic fraction, CSN1 and CSN3 resolved into a series of charged spots. A similar number of spots were also observed in the nucleoplasmic fraction; however, a pronounced shift of the series toward the acidic pH was obtained. The pattern of the spots resembled multiple phosphorylations (62), which generate a series of spots with lower pI; however, we cannot rule out the existence of other modifications. The total number of species was significantly lower in the chromatin fraction than in the other two compartments. Overall, comparison of the migration patterns of CSN1 and CSN3 in the different cellular compartments indicates that distinct forms are present in one compartment and absent from the other. Moreover, even if identical variants exist, their relative abundances differ between the fractions.
CSN5 had a similar separation profile in the different fractions in which some of the forms migrated as doublets, a pattern which may be observed due to phosphorylation coupled with deamidation (62, 63). While the cytosolic and nucleoplasmic fractions displayed similar migration patterns, the acidic species were much less abundant in the chromatin fraction. Unlike the other subunits examined (CSN1, CSN3, and CSN5), the CSN8 composition was largely uniform in all subcellular fractions. CSN8 appeared in three different forms: two variants, which were separated in the pI dimension, displayed a migration pattern in the size dimension that was slower than that of the third species, reflecting their higher molecular weight. This result is in accordance with our previous observation, which indicated that CSN8, purified from human erythrocytes, is present in two forms, with a mass difference of 0.5 kDa, possibly resulting from two adjacent translation initiation sites (Met1 and Met6) (64).
In summary, our results suggest that CSN subunits appear in differentially modified forms; moreover, subunits in the different subcellular compartments can significantly diverge in their characteristics. This variability in CSN subunit composition is particularly exemplified in the marked decrease in the number of variants that exists in the chromatin fraction, suggesting that CSN functionality is specialized in this compartment.
CSN partitioning between cellular fractions is not affected by the cell cycle.
The CSN is known to be involved in multiple aspects of cell cycle and checkpoint control (32, 65–67). We therefore explored whether the subcellular partitioning of the complex changes during the different stages of the cell cycle. To test this hypothesis, we synchronized HeLa cells using a double-thymidine block. Protein extracts were prepared at various time points following their release from the block, and the cell cycle state was evaluated by flow cytometry. The expression level of CSN subunits within each cellular compartment was then examined by Western blot analyses. Our analysis indicates that although we could clearly detect the expected oscillation in the levels of the cell cycle regulator, cyclin E, the cellular levels of CSN subunits remained constant throughout the cell cycle (Fig. 4). Thus, changes in CSN subunit levels, due to either overexpression or recruitment, do not seem to be essential for cell cycle progression; however, we cannot rule out the possibility that variations in the combination and/or configuration of CSN posttranslational modifications occur.
FIG 4.
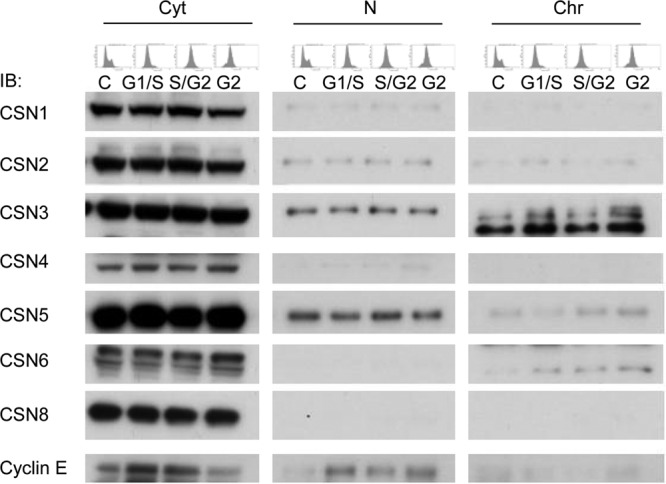
Subcellular distribution of the CSN complex is not affected by the cell cycle. Cells were synchronized and collected at different stages of the cell cycle, as indicated. Cellular proteins were then fractionated in the absence of phosphatase inhibitors and probed with anti-CSN and anti-cyclin E antibodies, as indicated. Cell cycle stages were verified by flow cytometry, as displayed in the plots above the lanes. Nonsynchronized cells (C) were used as a control.
CSN is transiently recruited to the nucleus upon DNA damage.
A number of studies have demonstrated that CSN is involved in DNA repair and DNA damage responses (3). We therefore wished to explore whether the induction of DNA damage affects the partitioning and expression levels of the complex. To this end, HeLa cells were exposed to UV irradiation (UV-C, 20 J/m2), and cells were fractionated at different time points, following exposure to the UV light. Our findings indicated that the level of cytosolic CSN did not significantly change in response to UV irradiation, but a clear increase in band intensity was observed in the nucleoplasmic and chromatin-associated CSN fractions, immediately after UV irradiation (Fig. 5A). However, CSN recruitment to the nucleus was transient: within 4 h after DNA damage, the nucleoplasmic and chromatin-associated CSN complexes returned to basal levels.
FIG 5.
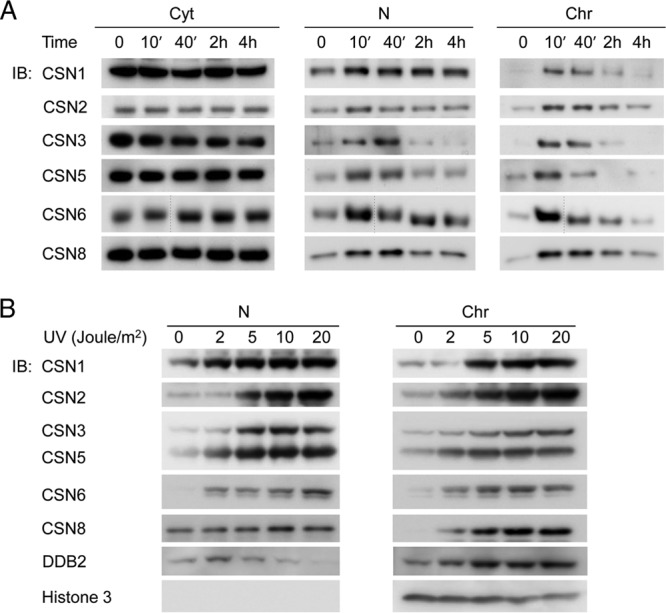
CSN subunits are transiently recruited to the nucleus following UV damage, in a dose-dependent manner. (A) Cells were exposed to 20 J/m2 of UV-C irradiation. Cellular proteins were fractionated into cytosolic (Cyt), nucleoplasmic (N), and chromatin (Chr) fractions, at different time points following DNA damage induction, and monitored by Western blot analyses using anti-CSN antibodies, as indicated. In CSN6, the thin dashed line represents an additional time point that was omitted. (B) Cells were treated with increasing doses of UV-C light, fractionated after 10 min, and probed with various antibodies, as indicated. As a control for DNA damage-dependent recruitment to chromatin, we used DDB2; histone H3 was used as a loading control.
To determine whether CSN accumulation in the nucleus is due to shuttling between compartments or synthesis of new CSN complexes, we performed a cycloheximide chase. The addition of cycloheximide to cells did not affect the transient accumulation of CSN subunits in the nucleus (see Fig. S4A in the supplemental material). Similarly, to check whether the subsequent decrease in nuclear CSN levels was due to proteasomal degradation, we repeated this experiment in the presence of the proteasome inhibitor, MG132 (see Fig. S4B). While MG132 induced a slight delay in the reduction of CSN levels, both in its presence or absence, the levels of the CSN subunits returned to their basal state 4 h after UV irradiation. Taken together, these results demonstrate that the transient accumulation of CSN in the nucleus is not due to synthesis or degradation but rather to redistribution of the existing CSN pool. Transient reduction in the cytoplasmic CSN was observed; however, the effect was not pronounced, probably because the amount of CSN that shuttles back and forth during the DNA damage response is negligible compared to the overall level of the cytosolic complex.
We then investigated whether the CSN response to DNA damage constitutes a simple “on/off” switch or whether it depends on the UV dose. Therefore, HeLa cells were UV irradiated at increasing doses from 2 to 20 J/m2 and the abundance of CSN subunits in the various fractions was examined by Western blotting (Fig. 5B). Interestingly, the levels of CSN subunits in the nucleoplasm and chromatin fractions were clearly increased at UV doses of around 5 to 10 J/m2, while no further enrichment in CSN abundance was obtained at 20 J/m2. Taken together, our results indicate that following DNA damage, CSN transiently migrates to the nucleus, and the extent of this event is dependent on the amount of UV radiation to which the cell is exposed.
UV damage induces differential changes in the phosphorylation level of specific domains.
Examination of the chromatin-associated CSN3 subunit suggested not only that the total amount of the protein increases following UV damage but also that phosphorylated species, consisting of a slower migration pattern, accumulate in particular (Fig. 6A). This observation led us to systematically examine whether UV irradiation can affect the phosphorylation pattern of CSN subunits. To achieve this goal, we performed phosphoproteomic analysis by LC-MS/MS. For this analysis, samples were collected 10 min following UV irradiation, separated into cytosolic, nucleoplasmic, and chromatin-associated fractions, and immunoprecipitated using a CSN3 antibody. The immunoprecipitated proteins were subjected to in-solution digestion with trypsin and enriched for phosphopeptides using Ti+4-IMAC beads (37). Enriched fractions were then analyzed in triplicates by LC-MS/MS. Quantitative analysis was conducted by direct comparison of precursor peptide and phosphopeptide intensities across the different biological samples and replicates. Student's t test was used for statistical comparisons, and a P value smaller than 0.05 was considered the significance threshold. Our results show that DNA damage induced a significant increase in the phosphorylation level of specific peptides corresponding to CSN1, CSN3, and CSN8, within the nucleoplasmic and chromatin-associated fractions, while no substantial effect was detected for these subunits in the cytosolic fraction (Fig. 6C; see Fig. S5 and Table S1 in the supplemental material).
FIG 6.

UV damage induces upregulation of specific phophopeptides within the nucleus. (A) Phosphorylated CSN3 accumulates in the chromatin-bound fraction, following DNA damage. Cells were exposed to 20 J/m2 of UV-C light. After induction of DNA damage, cellular proteins were fractionated at different time points in the absence of phosphatase inhibitors and visualized using an anti-CSN3 antibody. In response to UV irradiation, more slowly migrating bands, which may correspond to a phosphorylated form of CSN3, transiently appeared in the chromatin-bound fraction. (B) Cells were exposed to 20 J/m2 of UV-C light. Cellular proteins were fractionated 10 min after induction of DNA damage and subjected to phosphopeptide analysis. The fold change of the phosphopeptide intensities of control (blue bars) versus UV-treated (red bars) phosphopeptides, in the nucleoplasmic (N) and chromatin-bound (Chr) fractions, is indicated. Significances were calculated using Student's t test; single asterisks, double asterisks, and triple asterisks designate significance at confidence levels of 0.01, 0.005, and 0.0001, respectively. ns, nonsignificant. Each value represents the average of the intensities with standard deviation of the same phosphopeptide in three biological replicates with three technical replicates each. The most probable phosphorylation site on each peptide, as calculated by the Mascot software, is highlighted in bold. (C) A schematic representation highlighting the positions of the upregulated phosphorylation sites within CSN1, CSN3, and CSN8.
In total, we identified four phosphopeptides that were markedly enriched within the chromatin-associated fraction in response to DNA damage (Fig. 6; see Fig. S5 and Table S1 in the supplemental material). Two of the peptides correspond to the central and C-terminal regions of CSN1, 236GERDSQTQAILTK248 and 468SPPREGSQGELTPANSQSR486, respectively. An additional phosphopeptide is located at the C terminus of CSN3, 407SMGSQEDDSGNKPSSYS423, and the fourth phosphopeptide is near the C-terminal region of CSN8, 166KPVAGALDVSFNK178 (Fig. 6B and C). The level of the C-terminal phosphopeptide of CSN1, as well as the phosphopeptides of CSN3 and CSN8, was also increased in the nucleoplasm following UV irradiation (Fig. 6; see Fig. S5 and Table S1). The central phosphopeptide of CSN1, however, did not display a significant change in abundance within the nucleoplasm, suggesting that it possesses a specific role only within the chromatin. The most drastic effect, with a more than 200-fold increase in abundance in response to DNA damage, was detected for CSN3, while CSN8 and CSN1 (C-terminal peptide) exhibited 12- and 7-fold increases, respectively. For the remaining CSN subunits, no enrichment of phosphopeptides was identified.
In summary, our results show a significant upregulation of specific phosphopeptides within CSN1, CSN3, and CSN8 following UV irradiation, underscoring the ability of the complex to adjust to the cell's needs. This adjustment is reflected in both in the cellular location of the complex and the phosphorylation level of specific domains.
DISCUSSION
In the present study, we examined fundamental properties of the cellular CSN: its cellular localization, integrity, subunit composition, and sensitivity to cellular cues. By combining live microscopy, biochemical tools, and mass spectrometry analysis, we disclose the multilevel complexity in CSN regulation, insights which may provide the basis for understanding how CSN functions adequately in diverse cellular processes.
Our results show that an active CSN is localized in the cytosol, nucleoplasm, and chromatin-associated compartments, with the majority of complexes residing in the cytosol (Fig. 2). The similarity of the mobility kinetics that were measured for CSN subunits (Fig. 1) suggests that they commonly reside within the holo-CSN complex. An exception was the cytosolic CSN5, which in comparison to the other subunits displayed a somewhat higher mobility rate. This observation is in line with previous studies indicating that in addition to the intact CSN, CSN5 also exists as part of smaller non-CSN complexes (52, 53). Nevertheless, the relatively uniform mobility of CSN subunits is in agreement with our recent findings, indicating the stability of the endogenous human CSN, unlike the reconstituted complex, which, in addition to the intact complex, also exists in smaller subcomplexes (28). Thus, within the cellular environment, the integrity of the CSN complex may be tightly regulated, possibly by PTMs that contribute to subunit associations.
One remarkable observation arising from our study is the impressive plasticity of CSN subunits, which is reflected not only in the array of distinct subunit variants but also in the divergence in subunit composition among the cellular localizations (Fig. 3). The modularity in subunit composition was most pronounced in CSN1 and CSN3, which exhibited different species in cytosolic, nucleoplasmic, and chromatin-bound fractions. It will be interesting to reveal how the modified CSN variants specifically contribute to the activity of the complex and whether PTMs dictate the cellular localization of the complex or whether localization governs the PTM patterns. We speculate that the variability in CSN subunits across cellular boundaries has a significant impact on the functional regulation of the complex, as subunits can be assembled into multiple configurations, generating an array of complexes with various functionalities.
Modulation of the complex localization and adjustment of the PTM configuration are observed following the induction of DNA damage. The involvement of the CSN in the DNA damage response was previously established (3, 42, 54). Yet here we show that following UV damage, the CSN immediately translocates into the nucleus (Fig. 5; see Fig. S4 in the supplemental material). This transient redistribution of the CSN is dependent on the extent of DNA damage and is accompanied by a significant elevation in subunit phosphorylation levels within specific sites (Fig. 6). The spatiotemporal regulation of the CSN probably evolved to efficiently counteract DNA damage. Following UV irradiation, there is an urgent need for rapid ubiquitination of histones at sites of damage, which facilitates the recruitment of DNA repair proteins (68). Under these conditions, existing levels of CSN may not be sufficient; therefore, supplementary and optimally activated CSN would be required to overcome the threat of DNA damage.
A marked response to DNA damage was observed in the phosphopeptide profiles of CSN1, CSN3, and CSN8, within the nucleoplasm and chromatin bound fractions (Fig. 6). Given that phosphorylation is associated with surface charge effects which mediate structural changes and/or binding affinities (69), the interaction between the CSN and CRLs (10, 16) may be highly modulated by this event, especially considering the strategic position of the identified peptides. The C-terminal phosphopeptides of CSN1 and CSN3 are part of a major interaction interface formed by the PCI subunits, while the central CSN1 phosphopeptide seems to be near the substrate receptor module of CRLs (26). Interestingly, various global phosphoproteome analyses performed under different cellular conditions (i.e., differentiation, signaling activation, cell cycle, and cancer) identified phosphorylation events in exactly the same peptides as we found here, namely, the C-terminal peptides of CSN1 and CSN3 and the end region of CSN8 (61, 70–75). In most of these studies, quantitative changes of the phosphorylation at the corresponding peptides were deduced (71–75). Hence, it is tempting to speculate that these regions within CSN1, CSN3, and CSN8 may comprise phosphorylation hot spots which influence the capacity of the CSN to regulate CRLs and, as a result, modulate the ubiquitination process.
Supplementary Material
ACKNOWLEDGMENTS
We thank Vladimir Kiss, Sigal Shachar, and Adriana Katz for their advice, Benoit Guilquin, Institut Albert Bonniot, France, for providing the pFA6a kanMX6 P3nmt1 3HA plasmid, Anthony M. Carr, University of Sussex, United Kingdom, for the S. pombe caa1-d cells, David Piston for the Cerulean gene, and Eitan Reuveny for the HEK293 cells. We acknowledge the PRIDE team for their assistance in uploading the MS data.
M.S. is grateful for the financial support of a Starting Grant from the European Research Council (ERC) (grant agreement no. 239679) and the PRIME-XS Project (grant agreement no. 262067), both under the European Community's Seventh Framework Programme. M.S. is the incumbent of the Elaine Blond Career Development Chair.
Footnotes
Published ahead of print 13 January 2014
Supplemental material for this article may be found at http://dx.doi.org/10.1128/MCB.01598-13.
REFERENCES
- 1.Schwechheimer C. 2004. The COP9 signalosome (CSN): an evolutionary conserved proteolysis regulator in eukaryotic development. Biochim. Biophys. Acta 1695:45–54. 10.1016/j.bbamcr.2004.09.023 [DOI] [PubMed] [Google Scholar]
- 2.Wei N, Serino G, Deng XW. 2008. The COP9 signalosome: more than a protease. Trends Biochem. Sci. 33:592–600. 10.1016/j.tibs.2008.09.004 [DOI] [PubMed] [Google Scholar]
- 3.Hannss R, Dubiel W. 2011. COP9 signalosome function in the DDR. FEBS Lett. 585:2845–2852. 10.1016/j.febslet.2011.04.027 [DOI] [PubMed] [Google Scholar]
- 4.Hofmann K, Bucher P. 1998. The PCI domain: a common theme in three multiprotein complexes. Trends Biochem. Sci. 23:204–205. 10.1016/S0968-0004(98)01217-1 [DOI] [PubMed] [Google Scholar]
- 5.Cope GA, Suh GS, Aravind L, Schwarz SE, Zipursky SL, Koonin EV, Deshaies RJ. 2002. Role of predicted metalloprotease motif of Jab1/Csn5 in cleavage of Nedd8 from Cul1. Science 298:608–611. 10.1126/science.1075901 [DOI] [PubMed] [Google Scholar]
- 6.Echalier A, Pan Y, Birol M, Tavernier N, Pintard L, Hoh F, Ebel C, Galophe N, Claret FX, Dumas C. 2013. Insights into the regulation of the human COP9 signalosome catalytic subunit, CSN5/Jab1. Proc. Natl. Acad. Sci. U. S. A. 110:1273–1278. 10.1073/pnas.1209345110 [DOI] [PMC free article] [PubMed] [Google Scholar]
- 7.Pick E, Golan A, Zimbler JZ, Guo L, Sharaby Y, Tsuge T, Hofmann K, Wei N. 2012. The minimal deneddylase core of the COP9 signalosome excludes the Csn6 MPN- domain. PLoS One 7:e43980. 10.1371/journal.pone.0043980 [DOI] [PMC free article] [PubMed] [Google Scholar]
- 8.Sharon M, Mao H, Boeri Erba E, Stephens E, Zheng N, Robinson CV. 2009. Symmetrical modularity of the COP9 signalosome complex suggests its multifunctionality. Structure 17:31–40. 10.1016/j.str.2008.10.012 [DOI] [PubMed] [Google Scholar]
- 9.Enchev RI, Schreiber A, Beuron F, Morris EP. 2010. Structural insights into the COP9 signalosome and its common architecture with the 26S proteasome lid and eIF3. Structure 18:518–527. 10.1016/j.str.2010.02.008 [DOI] [PubMed] [Google Scholar]
- 10.Enchev RI, Scott DC, da Fonseca PC, Schreiber A, Monda JK, Schulman BA, Peter M, Morris EP. 2012. Structural basis for a reciprocal regulation between SCF and CSN. Cell Rep. 2:616–627. 10.1016/j.celrep.2012.08.019 [DOI] [PMC free article] [PubMed] [Google Scholar]
- 11.Lyapina S, Cope G, Shevchenko A, Serino G, Tsuge T, Zhou C, Wolf DA, Wei N, Deshaies RJ. 2001. Promotion of NEDD-CUL1 conjugate cleavage by COP9 signalosome. Science 292:1382–1385. 10.1126/science.1059780 [DOI] [PubMed] [Google Scholar]
- 12.Deshaies RJ, Joazeiro CA. 2009. RING domain E3 ubiquitin ligases. Annu. Rev. Biochem. 78:399–434. 10.1146/annurev.biochem.78.101807.093809 [DOI] [PubMed] [Google Scholar]
- 13.Duda DM, Borg LA, Scott DC, Hunt HW, Hammel M, Schulman BA. 2008. Structural insights into NEDD8 activation of cullin-RING ligases: conformational control of conjugation. Cell 134:995–1006. 10.1016/j.cell.2008.07.022 [DOI] [PMC free article] [PubMed] [Google Scholar]
- 14.Saha A, Deshaies RJ. 2008. Multimodal activation of the ubiquitin ligase SCF by Nedd8 conjugation. Mol. Cell 32:21–31. 10.1016/j.molcel.2008.08.021 [DOI] [PMC free article] [PubMed] [Google Scholar]
- 15.Schmidt MW, McQuary PR, Wee S, Hofmann K, Wolf DA. 2009. F-box-directed CRL complex assembly and regulation by the CSN and CAND1. Mol. Cell 35:586–597. 10.1016/j.molcel.2009.07.024 [DOI] [PMC free article] [PubMed] [Google Scholar]
- 16.Emberley ED, Mosadeghi R, Deshaies RJ. 2012. Deconjugation of Nedd8 from Cul1 Is directly regulated by Skp1-F-box and substrate, and the COP9 signalosome inhibits deneddylated SCF by a noncatalytic mechanism. J. Biol. Chem. 287:29679–29689. 10.1074/jbc.M112.352484 [DOI] [PMC free article] [PubMed] [Google Scholar]
- 17.Wolf DA, Zhou C, Wee S. 2003. The COP9 signalosome: an assembly and maintenance platform for cullin ubiquitin ligases? Nat. Cell Biol. 5:1029–1033. 10.1038/ncb1203-1029 [DOI] [PubMed] [Google Scholar]
- 18.Lee EW, Oh W, Song J. 2006. Jab1 as a mediator of nuclear export and cytoplasmic degradation of p53. Mol. Cells 22:133–140 [PubMed] [Google Scholar]
- 19.Richardson KS, Zundel W. 2005. The emerging role of the COP9 signalosome in cancer. Mol. Cancer Res. 3:645–653. 10.1158/1541-7786.MCR-05-0233 [DOI] [PMC free article] [PubMed] [Google Scholar]
- 20.Lee MH, Zhao R, Phan L, Yeung SC. 2011. Roles of COP9 signalosome in cancer. Cell Cycle 10:3057–3066. 10.4161/cc.10.18.17320 [DOI] [PMC free article] [PubMed] [Google Scholar]
- 21.Adler AS, Littlepage LE, Lin M, Kawahara TL, Wong DJ, Werb Z, Chang HY. 2008. CSN5 isopeptidase activity links COP9 signalosome activation to breast cancer progression. Cancer Res. 68:506–515. 10.1158/0008-5472.CAN-07-3060 [DOI] [PMC free article] [PubMed] [Google Scholar]
- 22.Adler AS, Lin M, Horlings H, Nuyten DS, van de Vijver MJ, Chang HY. 2006. Genetic regulators of large-scale transcriptional signatures in cancer. Nat. Genet. 38:421–430. 10.1038/ng1752 [DOI] [PMC free article] [PubMed] [Google Scholar]
- 23.Shackleford TJ, Claret FX. 2010. JAB1/CSN5: a new player in cell cycle control and cancer. Cell Div. 5:26. 10.1186/1747-1028-5-26 [DOI] [PMC free article] [PubMed] [Google Scholar]
- 24.Zhao R, Yeung SC, Chen J, Iwakuma T, Su CH, Chen B, Qu C, Zhang F, Chen YT, Lin YL, Lee DF, Jin F, Zhu R, Shaikenov T, Sarbassov D, Sahin A, Wang H, Wang H, Lai CC, Tsai FJ, Lozano G, Lee MH. 2011. Subunit 6 of the COP9 signalosome promotes tumorigenesis in mice through stabilization of MDM2 and is upregulated in human cancers. J. Clin. Invest. 121:851–865. 10.1172/JCI44111 [DOI] [PMC free article] [PubMed] [Google Scholar]
- 25.Lee YH, Judge AD, Seo D, Kitade M, Gomez-Quiroz LE, Ishikawa T, Andersen JB, Kim BK, Marquardt JU, Raggi C, Avital I, Conner EA, MacLachlan I, Factor VM, Thorgeirsson SS. 2011. Molecular targeting of CSN5 in human hepatocellular carcinoma: a mechanism of therapeutic response. Oncogene 30:4175–4184. 10.1038/onc.2011.126 [DOI] [PMC free article] [PubMed] [Google Scholar]
- 26.Chen C, Okayama H. 1987. High-efficiency transformation of mammalian cells by plasmid DNA. Mol. Cell. Biol. 7:2745–2752 [DOI] [PMC free article] [PubMed] [Google Scholar]
- 27.Lippincott-Schwartz J, Snapp E, Kenworthy A. 2001. Studying protein dynamics in living cells. Nat. Rev. Mol. Cell Biol. 2:444–456. 10.1038/35073068 [DOI] [PubMed] [Google Scholar]
- 28.Sprague BL, Pego RL, Stavreva DA, McNally JG. 2004. Analysis of binding reactions by fluorescence recovery after photobleaching. Biophys. J. 86:3473–3495. 10.1529/biophysj.103.026765 [DOI] [PMC free article] [PubMed] [Google Scholar]
- 29.Swaminathan R, Hoang CP, Verkman AS. 1997. Photobleaching recovery and anisotropy decay of green fluorescent protein GFP-S65T in solution and cells: cytoplasmic viscosity probed by green fluorescent protein translational and rotational diffusion. Biophys. J. 72:1900–1907. 10.1016/S0006-3495(97)78835-0 [DOI] [PMC free article] [PubMed] [Google Scholar]
- 30.Reyes JC, Muchardt C, Yaniv M. 1997. Components of the human SWI/SNF complex are enriched in active chromatin and are associated with the nuclear matrix. J. Cell Biol. 137:263–274. 10.1083/jcb.137.2.263 [DOI] [PMC free article] [PubMed] [Google Scholar]
- 31.Bar N, Dikstein R. 2010. miR-22 forms a regulatory loop in PTEN/AKT pathway and modulates signaling kinetics. PLoS One 5:e10859. 10.1371/journal.pone.0010859 [DOI] [PMC free article] [PubMed] [Google Scholar]
- 32.Mundt KE, Porte J, Murray JM, Brikos C, Christensen PU, Caspari T, Hagan IM, Millar JB, Simanis V, Hofmann K, Carr AM. 1999. The COP9/signalosome complex is conserved in fission yeast and has a role in S phase. Curr. Biol. 9:1427–1430. 10.1016/S0960-9822(00)80091-3 [DOI] [PubMed] [Google Scholar]
- 33.Bähler J, Wu JQ, Longtine MS, Shah NG, McKenzie A, III, Steever AB, Wach A, Philippsen P, Pringle JR. 1998. Heterologous modules for efficient and versatile PCR-based gene targeting in Schizosaccharomyces pombe. Yeast 14:943–951. [DOI] [PubMed] [Google Scholar]
- 34.Thongboonkerd V, Chutipongtanate S, Kanlaya R. 2006. Systematic evaluation of sample preparation methods for gel-based human urinary proteomics: quantity, quality, and variability. J. Proteome Res. 5:183–191. 10.1021/pr0502525 [DOI] [PubMed] [Google Scholar]
- 35.Ramagli LS. 1999. Quantifying protein in 2-D PAGE solubilization buffers. Methods Mol. Biol. 112:99–103 [DOI] [PubMed] [Google Scholar]
- 36.Shaul YD, Seger R. 2006. ERK1c regulates Golgi fragmentation during mitosis. J. Cell Biol. 172:885–897. 10.1083/jcb.200509063 [DOI] [PMC free article] [PubMed] [Google Scholar]
- 37.Zhou H, Ye M, Dong J, Corradini E, Cristobal A, Heck AJ, Zou H, Mohammed S. 2013. Robust phosphoproteome enrichment using monodisperse microsphere-based immobilized titanium (IV) ion affinity chromatography. Nat. Protoc. 8:461–480. 10.1038/nprot.2013.010 [DOI] [PubMed] [Google Scholar]
- 38.Dicker L, Lin X, Ivanov AR. 2010. Increased power for the analysis of label-free LC-MS/MS proteomics data by combining spectral counts and peptide peak attributes. Mol. Cell. Proteomics 9:2704–2718. 10.1074/mcp.M110.002774 [DOI] [PMC free article] [PubMed] [Google Scholar]
- 39.Thongboonkerd V, Chutipongtanate S, Kanlaya R. 2006. Systematic evaluation of sample preparation methods for gel-based human urinary proteomics: quantity, quality, and variability. J. Proteome Res. 5:183–191. 10.1021/pr0502525 [DOI] [PubMed] [Google Scholar]
- 40.Savitski MM, Lemeer S, Boesche M, Lang M, Mathieson T, Bantscheff M, Kuster B. 2011. Confident phosphorylation site localization using the Mascot Delta Score. Mol. Cell. Proteomics 10:M110.003830. 10.1074/mcp.M110.003830 [DOI] [PMC free article] [PubMed] [Google Scholar]
- 41.Vizcaíno JA, Côté RG, Csordas A, Dianes JA, Fabregat A, Foster JM, Griss J, Alpi E, Birim M, Contell J, O'Kelly G, Schoenegger A, Ovelleiro D, Pérez-Riverol Y, Reisinger F, Ríos D, Wang R, Hermjakob H. 2013. The PRoteomics IDEntifications (PRIDE) database and associated tools: status in 2013. Nucleic Acids Res. 41:D1063–D1069. 10.1093/nar/gks1262 [DOI] [PMC free article] [PubMed] [Google Scholar]
- 42.Mundt KE, Liu C, Carr AM. 2002. Deletion mutants in COP9/signalosome subunits in fission yeast Schizosaccharomyces pombe display distinct phenotypes. Mol. Biol. Cell 13:493–502. 10.1091/mbc.01-10-0521 [DOI] [PMC free article] [PubMed] [Google Scholar]
- 43.Chamovitz DA, Wei N, Osterlund MT, von Arnim AG, Staub JM, Matsui M, Deng XW. 1996. The COP9 complex, a novel multisubunit nuclear regulator involved in light control of a plant developmental switch. Cell 86:115–121. 10.1016/S0092-8674(00)80082-3 [DOI] [PubMed] [Google Scholar]
- 44.Huang J, Yuan H, Lu C, Liu X, Cao X, Wan M. 2007. Jab1 mediates protein degradation of the Rad9-Rad1-Hus1 checkpoint complex. J. Mol. Biol. 371:514–527. 10.1016/j.jmb.2007.05.095 [DOI] [PMC free article] [PubMed] [Google Scholar]
- 45.Hunter C, Evans J, Valencik ML. 2008. Subunit 3 of the COP9 signalosome is poised to facilitate communication between the extracellular matrix and the nucleus through the muscle-specific beta1D integrin. Cell Commun. Adhes. 15:247–260. 10.1080/15419060802198660 [DOI] [PubMed] [Google Scholar]
- 46.Peng Z, Staub JM, Serino G, Kwok SF, Kurepa J, Bruce BD, Vierstra RD, Wei N, Deng XW. 2001. The cellular level of PR500, a protein complex related to the 19S regulatory particle of the proteasome, is regulated in response to stresses in plants. Mol. Biol. Cell 12:383–392. 10.1091/mbc.12.2.383 [DOI] [PMC free article] [PubMed] [Google Scholar]
- 47.Wang J, Barnes RO, West NR, Olson M, Chu JE, Watson PH. 2008. Jab1 is a target of EGFR signaling in ERalpha-negative breast cancer. Breast Cancer Res. 10:R51. 10.1186/bcr2105 [DOI] [PMC free article] [PubMed] [Google Scholar]
- 48.Rizzo MA, Springer GH, Granada B, Piston DW. 2004. An improved cyan fluorescent protein variant useful for FRET. Nat. Biotechnol. 22:445–449. 10.1038/nbt945 [DOI] [PubMed] [Google Scholar]
- 49.Luijsterburg MS, Goedhart J, Moser J, Kool H, Geverts B, Houtsmuller AB, Mullenders LH, Vermeulen W, van Driel R. 2007. Dynamic in vivo interaction of DDB2 E3 ubiquitin ligase with UV-damaged DNA is independent of damage-recognition protein XPC. J. Cell Sci. 120:2706–2716. 10.1242/jcs.008367 [DOI] [PubMed] [Google Scholar]
- 50.Dross N, Spriet C, Zwerger M, Muller G, Waldeck W, Langowski J. 2009. Mapping eGFP oligomer mobility in living cell nuclei. PLoS One 4:e5041. 10.1371/journal.pone.0005041 [DOI] [PMC free article] [PubMed] [Google Scholar]
- 51.van Royen ME, Farla P, Mattern KA, Geverts B, Trapman J, Houtsmuller AB. 2009. Fluorescence recovery after photobleaching (FRAP) to study nuclear protein dynamics in living cells. Methods Mol. Biol. 464:363–385. 10.1007/978-1-60327-461-6_20 [DOI] [PubMed] [Google Scholar]
- 52.Chamovitz DA, Segal D. 2001. JAB1/CSN5 and the COP9 signalosome. A complex situation. EMBO Rep. 2:96–101. 10.1093/embo-reports/kve028 [DOI] [PMC free article] [PubMed] [Google Scholar]
- 53.Yoshida A, Yoneda-Kato N, Kato JY. 2013. CSN5 specifically interacts with CDK2 and controls senescence in a cytoplasmic cyclin E-mediated manner. Sci. Rep. 3:1054. 10.1038/srep01054 [DOI] [PMC free article] [PubMed] [Google Scholar]
- 54.Groisman R, Polanowska J, Kuraoka I, Sawada J, Saijo M, Drapkin R, Kisselev AF, Tanaka K, Nakatani Y. 2003. The ubiquitin ligase activity in the DDB2 and CSA complexes is differentially regulated by the COP9 signalosome in response to DNA damage. Cell 113:357–367. 10.1016/S0092-8674(03)00316-7 [DOI] [PubMed] [Google Scholar]
- 55.Chamovitz DA. 2009. Revisiting the COP9 signalosome as a transcriptional regulator. EMBO Rep. 10:352–358. 10.1038/embor.2009.33 [DOI] [PMC free article] [PubMed] [Google Scholar]
- 56.Fang L, Wang X, Yamoah K, Chen PL, Pan ZQ, Huang L. 2008. Characterization of the human COP9 signalosome complex using affinity purification and mass spectrometry. J. Proteome Res. 7:4914–4925. 10.1021/pr800574c [DOI] [PMC free article] [PubMed] [Google Scholar]
- 57.Beli P, Lukashchuk N, Wagner SA, Weinert BT, Olsen JV, Baskcomb L, Mann M, Jackson SP, Choudhary C. 2012. Proteomic investigations reveal a role for RNA processing factor THRAP3 in the DNA damage response. Mol. Cell 46:212–225. 10.1016/j.molcel.2012.01.026 [DOI] [PMC free article] [PubMed] [Google Scholar]
- 58.Uhle S, Medalia O, Waldron R, Dumdey R, Henklein P, Bech-Otschir D, Huang X, Berse M, Sperling J, Schade R, Dubiel W. 2003. Protein kinase CK2 and protein kinase D are associated with the COP9 signalosome. EMBO J. 22:1302–1312. 10.1093/emboj/cdg127 [DOI] [PMC free article] [PubMed] [Google Scholar]
- 59. Reference deleted.
- 60.Huang X, Langelotz C, Hetfeld-Pechoc BK, Schwenk W, Dubiel W. 2009. The COP9 signalosome mediates beta-catenin degradation by deneddylation and blocks adenomatous polyposis coli destruction via USP15. J. Mol. Biol. 391:691–702. 10.1016/j.jmb.2009.06.066 [DOI] [PubMed] [Google Scholar]
- 61.Matsuoka S, Ballif BA, Smogorzewska A, McDonald ER, III, Hurov KE, Luo J, Bakalarski CE, Zhao Z, Solimini N, Lerenthal Y, Shiloh Y, Gygi SP, Elledge SJ. 2007. ATM and ATR substrate analysis reveals extensive protein networks responsive to DNA damage. Science 316:1160–1166. 10.1126/science.1140321 [DOI] [PubMed] [Google Scholar]
- 62.Görg A, Weiss W, Dunn MJ. 2004. Current two-dimensional electrophoresis technology for proteomics. Proteomics 4:3665–3685. 10.1002/pmic.200401031 [DOI] [PubMed] [Google Scholar]
- 63.Robinson NE, Robinson AB. 2001. Deamidation of human proteins. Proc. Natl. Acad. Sci. U. S. A. 98:12409–12413. 10.1073/pnas.221463198 [DOI] [PMC free article] [PubMed] [Google Scholar]
- 64.Rozen S, Tieri A, Ridner G, Stark AK, Schmaler T, Ben-Nissan G, Dubiel W, Sharon M. 2013. Exposing the subunit diversity within protein complexes: a mass spectrometry approach. Methods 59:270–277. 10.1016/j.ymeth.2012.12.013 [DOI] [PubMed] [Google Scholar]
- 65.Chen B, Zhao R, Su CH, Linan M, Tseng C, Phan L, Fang L, Yang HY, Yang H, Wang W, Xu X, Jiang N, Cai S, Jin F, Yeung SC, Lee MH. 2012. CDK inhibitor p57 (Kip2) is negatively regulated by COP9 signalosome subunit 6. Cell Cycle 11:4633–4641. 10.4161/cc.22887 [DOI] [PMC free article] [PubMed] [Google Scholar]
- 66.Tomoda K, Kubota Y, Kato J. 1999. Degradation of the cyclin-dependent-kinase inhibitor p27Kip1 is instigated by Jab1. Nature 398:160–165. 10.1038/18230 [DOI] [PubMed] [Google Scholar]
- 67.Yang X, Menon S, Lykke-Andersen K, Tsuge T, Di X, Wang X, Rodriguez-Suarez RJ, Zhang H, Wei N. 2002. The COP9 signalosome inhibits p27(kip1) degradation and impedes G1-S phase progression via deneddylation of SCF Cul1. Curr. Biol. 12:667–672. 10.1016/S0960-9822(02)00791-1 [DOI] [PubMed] [Google Scholar]
- 68.Wang H, Zhai L, Xu J, Joo HY, Jackson S, Erdjument-Bromage H, Tempst P, Xiong Y, Zhang Y. 2006. Histone H3 and H4 ubiquitylation by the CUL4-DDB-ROC1 ubiquitin ligase facilitates cellular response to DNA damage. Mol. Cell 22:383–394. 10.1016/j.molcel.2006.03.035 [DOI] [PubMed] [Google Scholar]
- 69.Barford D, Hu SH, Johnson LN. 1991. Structural mechanism for glycogen phosphorylase control by phosphorylation and AMP. J. Mol. Biol. 218:233–260. 10.1016/0022-2836(91)90887-C [DOI] [PubMed] [Google Scholar]
- 70.Christensen GL, Kelstrup CD, Lyngso C, Sarwar U, Bogebo R, Sheikh SP, Gammeltoft S, Olsen JV, Hansen JL. 2010. Quantitative phosphoproteomics dissection of seven-transmembrane receptor signaling using full and biased agonists. Mol. Cell. Proteomics 9:1540–1553. 10.1074/mcp.M900550-MCP200 [DOI] [PMC free article] [PubMed] [Google Scholar]
- 71.Dephoure N, Zhou C, Villen J, Beausoleil SA, Bakalarski CE, Elledge SJ, Gygi SP. 2008. A quantitative atlas of mitotic phosphorylation. Proc. Natl. Acad. Sci. U. S. A. 105:10762–10767. 10.1073/pnas.0805139105 [DOI] [PMC free article] [PubMed] [Google Scholar]
- 72.Olsen JV, Vermeulen M, Santamaria A, Kumar C, Miller ML, Jensen LJ, Gnad F, Cox J, Jensen TS, Nigg EA, Brunak S, Mann M. 2010. Quantitative phosphoproteomics reveals widespread full phosphorylation site occupancy during mitosis. Sci. Signal. 3:ra3. 10.1126/scisignal.2000475 [DOI] [PubMed] [Google Scholar]
- 73.Rigbolt KT, Prokhorova TA, Akimov V, Henningsen J, Johansen PT, Kratchmarova I, Kassem M, Mann M, Olsen JV, Blagoev B. 2011. System-wide temporal characterization of the proteome and phosphoproteome of human embryonic stem cell differentiation. Sci. Signal. 4:rs3. 10.1126/scisignal.2001570 [DOI] [PubMed] [Google Scholar]
- 74.Van Hoof D, Munoz J, Braam SR, Pinkse MW, Linding R, Heck AJ, Mummery CL, Krijgsveld J. 2009. Phosphorylation dynamics during early differentiation of human embryonic stem cells. Cell Stem Cell 5:214–226. 10.1016/j.stem.2009.05.021 [DOI] [PubMed] [Google Scholar]
- 75.Weber C, Schreiber TB, Daub H. 2012. Dual phosphoproteomics and chemical proteomics analysis of erlotinib and gefitinib interference in acute myeloid leukemia cells. J. Proteomics 75:1343–1356. 10.1016/j.jprot.2011.11.004 [DOI] [PubMed] [Google Scholar]
- 76.Oh H, Jung HY, Kim J, Bae YS. 2010. Phosphorylation of serine282 in NADPH oxidase activator 1 by Erk desensitizes EGF-induced ROS generation. Biochem. Biophys. Res. Commun. 394:691–696. 10.1016/j.bbrc.2010.03.053 [DOI] [PubMed] [Google Scholar]
- 77.Swarup G, Speeg KV, Jr, Cohen S, Garbers DL. 1982. Phosphotyrosyl-protein phosphatase of TCRC-2 cells. J. Biol. Chem. 257:7298–7301 [PubMed] [Google Scholar]
Associated Data
This section collects any data citations, data availability statements, or supplementary materials included in this article.