SUMMARY
We report the construction and analysis of 4,836 heterozygous diploid deletion mutants covering 98.4% of the fission yeast genome. This resource provides a powerful tool for biotechnological and eukaryotic cell biology research. Comprehensive gene dispensability comparisons with budding yeast, the first time such studies have been possible between two eukaryotes, revealed that 83% of single copy orthologues in the two yeasts had conserved dispensability. Gene dispensability differed for certain pathways between the two yeasts, including mitochondrial translation and cell cycle checkpoint control. We show that fission yeast has more essential genes than budding yeast and that essential genes are more likely than non-essential genes to be single copy, broadly conserved and to contain introns. Growth fitness analyses determined sets of haploinsufficient and haploproficient genes for fission yeast, and comparisons with budding yeast identified specific ribosomal proteins and RNA polymerase subunits, which may act more generally to regulate eukaryotic cell growth.
Systematic genome-wide gene deletion collections of eukaryotic organisms provide powerful tools for biotechnology and for investigating problems of molecular and cell biology, as shown by pioneering studies with the budding yeast Saccharomyces cerevisiae1-5. Construction of systematic gene deletion collections is difficult for Metazoa, but RNAi provides an alternative approach to ablate gene activity in these organisms. However, RNAi approaches can suffer from drawbacks such as partial knockdown of gene expression. For example, RNAi screens in fly and human cells revealed between only 10% to 38% overlap in genes identified as being required for the cell cycle6. To increase the resources available for biotechnology and to facilitate systematic comparisons between eukaryotic species, we have constructed a genome-wide gene deletion set for the fission yeast Schizosaccharomyces pombe. The fission and budding yeasts are not closely related and differ in a number of aspects including organization of the cell cycle, heterochromatin, complexity of centromeres and DNA replication origins, and the prevalence of introns7, which makes their comparison valuable for defining genes and processes required more generally in eukaryotes. Here we have identified similarities and differences in gene dispensability between the two yeasts and have used growth fitness profiling to identify genes haploinsufficient or haploproficient for growth.
RESULTS
Deletion construction and gene dispensability
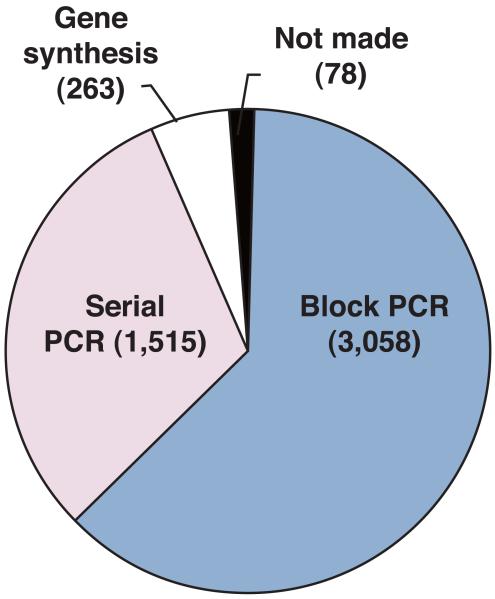
We have constructed 4,836 heterozygous deletions covering 98.4% of the 4,914 protein coding open reading frames (ORFs) based on the annotated genome sequence7 (http://www.genedb.org/genedb/pombe, 01/04/08) (Methods and Supplementary Table 1, for all the PCR primer sets and the mapping data, see Supplementary data 1 and 2) (see also the website, http://pombe.kaist.ac.kr/nbtsupp/). In addition we have deleted 9 Tf2 transposons, 39 dubious genes8, and 48 pseudogenes (Supplementary Table 2). Each gene was deleted and replaced using homologous recombination by a ‘deletion cassette’ containing the KanMX marker gene9 (Supplementary Data 3) flanked by a pair of unique molecular bar codes (Fig.1a and Supplementary Fig. 1). Several pilot scale deletion studies have been carried out10-12, and it was suggested that 40~80 bp of homology is not always sufficient for the recombination required for the systematic deletion of genes in fission yeast12. To overcome this problem both block PCR and total gene synthesis methods13 were developed, to increase the length of homology from ~80 bp to ~350 bp (Fig.1b and Supplementary Figs. 2-4). We confirmed that the deletion mutants were correctly replaced with the KanMX marker using PCR and dideoxy sequencing (Supplementary Fig. 5). For some genes constraints on primer selection for block PCR resulted in less than 100% of the ORF being deleted (for the amount of ORF deleted see Supplementary Table 1 column C KO%). Of the 4,836 genes deleted, at least 4,328 genes (87.6%) have greater than 80% of their ORFs removed. In addition we carried out Southern blot analysis to determine the frequency with which the deletion cassette integrated elsewhere in the genome and estimated it to be less than 1% (Supplementary Fig. 6).
Figure 1.
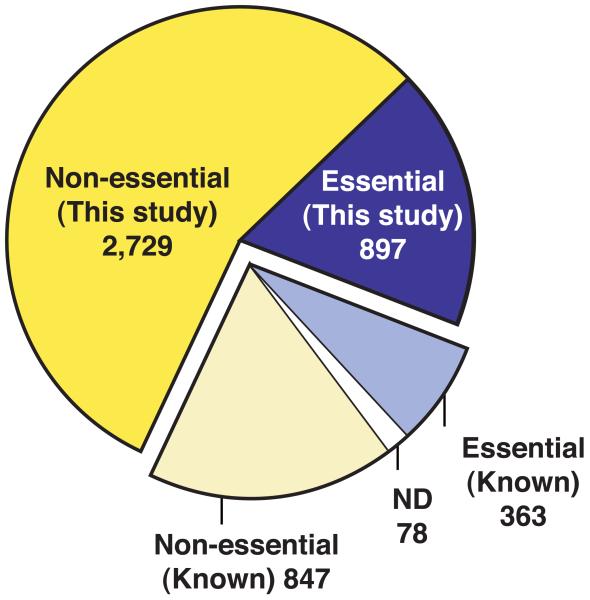
Deletion construction and gene dispensability. (a) Gene deletion cassette containing the KanMX4 gene flanked by unique barcodes (UPTAG/DNTAG) and regions of homology to the gene of interest (RHG). The cassette replaced the ORF of interest by homologous recombination at the RHG regions. (b) Construction of deletion mutants. All 4,836 protein coding genes were deleted using serial extension PCR (31.3%), block PCR (63.2%), or total gene synthesis (5.4%). The remaining 78 genes could not be confirmed as deleted due to ambiguous sequencing results, recombination failure, or inviability of the heterozygous diploids. (c) Dispensability of 4,836 protein coding genes. For 3,626 (2,729+897) genes the dispensability was previously unknown. ND=not done.
We determined the essentiality of 4,836 genes by sporulating each heterozygous deletion diploid strain followed by microscopic observation of the germinating haploid spores. Essentiality was confirmed by tetrad analysis for all genes initially characterized as essential. We found that 26.1% of fission yeast genes (1,260/4,836) were essential and 73.9% (3,576/4,836) were non-essential for viability of haploid cells in the growth conditions we used. This analysis determined the dispensability for 3,626 genes, which had not been deleted previously (Fig. 1c). Comparisons with published data for 1,210 genes revealed that the dispensability data for 98.4% of our deletions is similar or our data is more likely to be correct, leaving 1.6% as the maximum estimate of the error rate in our study (Supplementary Table 3).
These results contrast with budding yeast where 17.8% (1,033/5,776) of genes are essential for viability (http://www.yeastgenome.org). Fission yeast therefore has 227 more essential genes (1,260-1,033) than budding yeast despite having fewer genes in total (4,836 vs. 5,776). Fission yeast has fewer duplicated genes than budding yeast14,15. It is therefore possible that there are more essential genes in fission yeast, because duplication in budding yeast is masking potential essentiality. We examined this possibility by identifying all the essential genes for each organism in the one|many, many|one, and many|many categories, where orthologs in the other organism were non-essential and duplicated (Supplementary Table 1 and Methods). This revealed only 67 essential genes in fission yeast and 32 essential genes in budding yeast where essentiality of the orthologs in the other organism could be masked by redundancy. Thus redundancy could account for maximally only 35 (67-32) of the 227 extra essential genes in fission yeast. We conclude that redundancy is not the major reason for the additional essential genes in fission yeast (see also Dispensability comparison of orthologous pairs from the two yeasts).
Analysis of gene dispensability
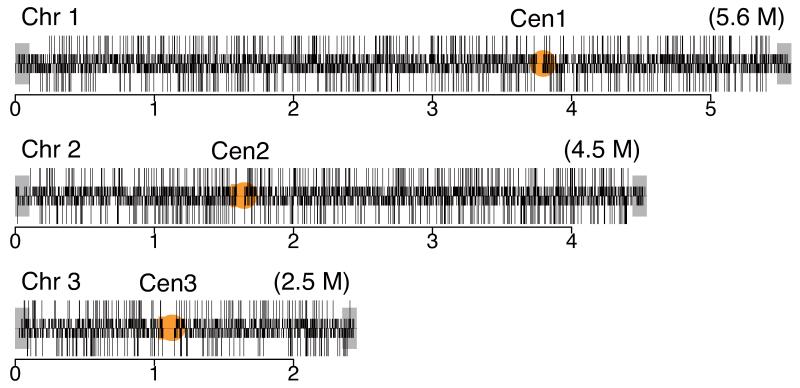
Essential and non-essential genes are distributed evenly throughout the fission yeast genome except within 100 kb of the telomeres on chromosomes 1 and 2 (Fig. 2a). As in other organisms4 genes in the subtelomeric regions showed low essentiality (1.2%) compared to a genome average of 26.1%. These regions are enriched for paralogues (68.7%, 79/115) and we have shown that duplicated genes are less likely to be essential than single copy genes (Supplementary Table 4). These regions are also enriched for non-essential species-specific genes related to meiosis and the response to nitrogen starvation, which are less likely to be essential under these assay conditions15.
Figure 2.
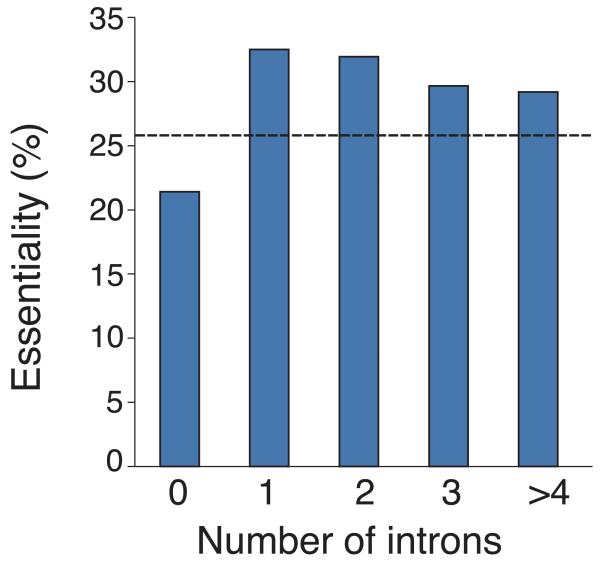
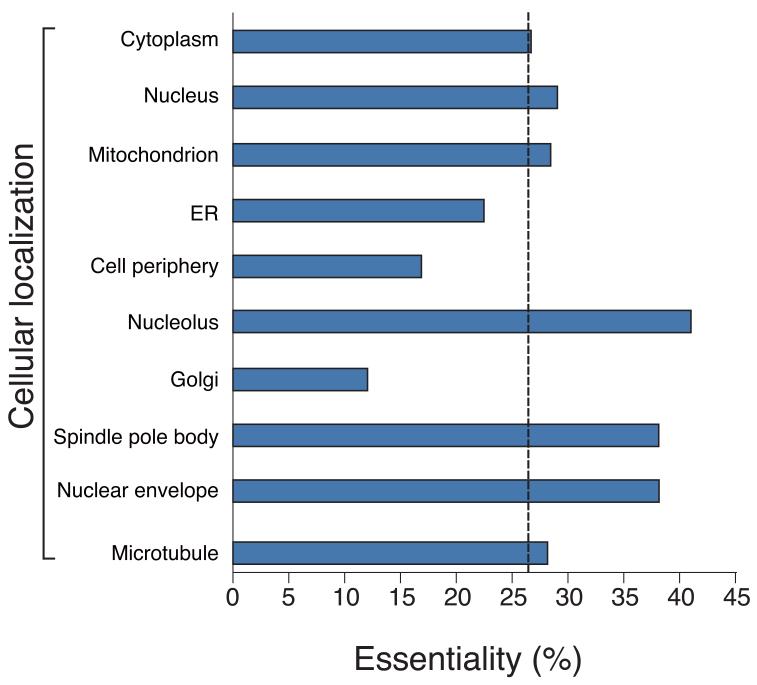
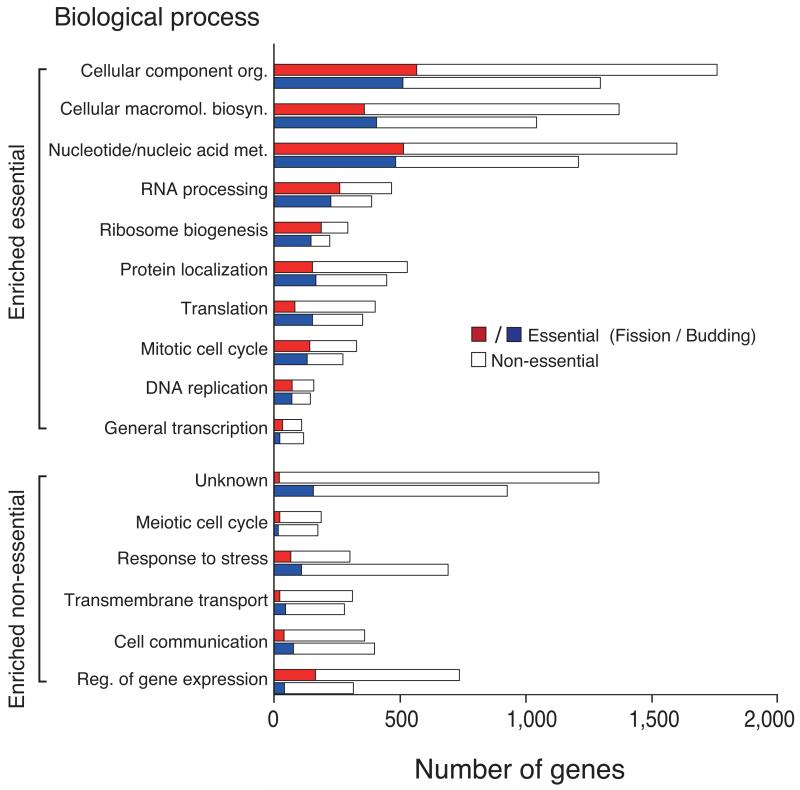
Analysis of gene dispensability. (a) Chromosome distribution of gene dispensability. Essential genes (tall bars) and non-essential genes (short bars) are distributed randomly throughout the genome except within 100 kb of the telomeres (grey boxes) where non-essential genes are enriched. Upper bars represent genes transcribed left to right and lower bars represent genes transcribed right to left. Filled circles in orange represent centromeres. (b) Essentiality vs. number of introns. Gene dispensability was plotted against the number of introns within genes. In fission yeast the essentiality of genes containing introns is significantly (P<10−14) higher than genes lacking introns. The dotted line represents the average essentiality for the total gene set (26.1%). (c) Essentiality vs. ORFeome localization. The percentage of essential genes was plotted against 10 different cellular locations in fission yeast. The dotted line represents the average essentiality for the total gene set (26.1%). The number of essential gene products localised to the nucleolus, spindle pole body, and nuclear envelope is higher than average. The number of essential genes compared to the total for each location is; 1) cytoplasm 564/2,113, 2) nucleus 601/2,068, 3) mitochondrion 128/450, 4) ER 98/436, 5) cell periphery 55/326, 6) nucleolus 89/217, 7) Golgi 27/224, 8) spindle pole body 69/181, 9) nuclear envelope 29/76, and 10) microtubule 20/71. (d) Comparison of GO analysis between fission yeast and budding yeast genes. Bar chart shows a selection of broad, biologically informative GO terms significantly (P≤0.01) enriched for essential and non-essential genes in fission yeast and budding yeast. For the complete list of processes and for methods used to extract this data, see Supplementary Tables 5 and 6. Essential fission yeast genes (red), essential budding yeast genes (blue), non-essential genes (white), y axis (biological processes), and x axis (gene number).
In fission yeast about 46% of genes have introns7 and we found that the essentiality of genes with one or more introns is significantly higher than genes lacking introns (33% vs. 21%, P<10−14) (Fig. 2b). One possible explanation is that essential genes are less likely to be rapidly regulated given that it has already been shown that rapidly regulated stress response-related genes are less likely to contain introns16. Alternatively if introns arose early during eukaryotic evolution, this may be reflected as a bias towards intron-containing essential genes, because essential genes are more likely to be ancient than non-essential genes12.
The relationship between gene essentiality and ORFeome localization17 was also analyzed for 10 different cellular locations (Fig. 2c). As in budding yeast3,18 we found that the greatest percentage of essential gene products was localized to the nucleolus, nuclear envelope and the spindle pole body.
As previously shown for budding yeast4, essential genes in fission yeast were more likely to be unique, with 93.1% of essential genes (1,173/1,260) being present in single copy compared to 73.9% of non-essential genes (2,643/3,576). In contrast non-essential genes were more likely to be duplicated or species-specific. Comparison of Gene Ontology (GO) term enrichment between the two yeasts revealed that the essential gene sets for both yeasts were significantly (P<10−2) enriched for core cellular processes, such as macromolecular (DNA, RNA, protein, and lipid) metabolism and cellular biosynthesis (transcription initiation/translation and ribosome assembly) (Fig. 2d and Supplementary Table 5). In contrast, non-essential genes were significantly (P<10−2) enriched for regulatory functions (control of gene expression and cell communication) (Fig. 2d and Supplementary Table 6). Non-essential genes were also enriched for conditional or life-cycle specific processes, such as stress response, transmembrane transport, and meiosis/sexual reproduction, together with processes that are less likely to be essential in the rich medium and mitotic growth used in our assay conditions. Unknown genes were also highly enriched (93%) in the non-essential genes. We predict that many of these genes are involved in biological regulation or condition-specific processes and are not directly involved in primary processes.
Species distribution of essential genes
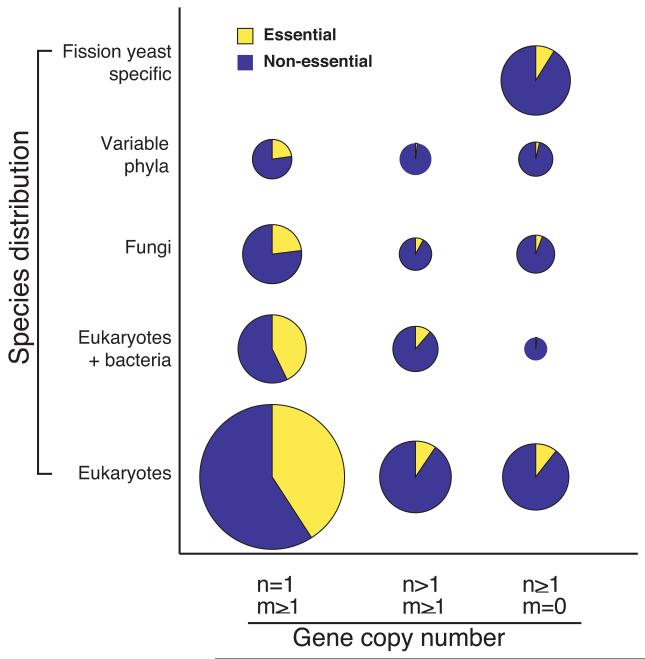
The dispensability profiles for the 4,836 deletion gene set were classified by their gene copy numbers according to their relationship with budding yeast genes (Supplementary Table 4 and x-axis in Fig. 3) and into 5 categories by their species distribution (Supplementary Table 4 and y-axis in Fig. 3). In a comparison of the entire deletion gene set (4,836) there are 2,841 single copy genes (n=1, m ≥1) (n and m are gene copy number in fission yeast and budding yeast respectively), 855 duplicated genes in fission yeast which are conserved in budding yeast (n>1, m ≥1), and 1,140 genes found in fission yeast but not conserved in budding yeast (n≥1, m=0). The 1,260 essential genes were distributed across species as follows; 1) 883 genes conserved only in eukaryotes including humans, 2) 207 conserved in both bacteria and eukaryotes, including humans, 3) 91 genes found only in fungi, 4) 39 genes found with a variable distribution throughout the phyla, and 5) 40 fission yeast specific genes. Essential genes were more likely than non-essential genes to be single copy and to be conserved broadly across species. Of the 1,260 essential fission yeast genes, 1,173 were single copy and only 87 have duplicates (Supplementary Tables 1 and 4). From the total of 974 (883+91) essential genes found only in eukaryotes, 59 are probably related to genes found in Archaea (Supplementary Table 7). The remaining 915 genes (72.6% of all essential genes) are likely to have arisen within the eukaryotic lineage. This implies that many essential novel gene functions arose with the evolution of the eukaryotic cell. The fidelity of cell division in ancestral unicellular eukaryotes may have been very low, which could be tolerated in evolutionary terms as long as there was overall population growth. However, a multicellular eukaryote requires greater fidelity at each cell division than a unicellular eukaryote, because even moderate levels of random cell death would lead to poor survival of a multicellular organism. It has been estimated that it took around 500 million years for multicellular organisms to arise from an ancestral unicellular eukaryote19 and we propose that during this period there was considerable genomic innovation to generate a unicellular eukaryote with sufficient fidelity at cell division to allow the evolution of multicellularity. Essential genes broadly conserved both in bacteria and eukaryotes were significantly (207 genes, P<10−2) enriched for respiratory function and low molecular weight primary metabolic processes, such as nucleotide and glucose metabolism (Supplementary Table 8). Of 445 fission yeast specific genes, only 40 were essential for viability (Supplementary Table 9). Some of these genes are implicated in aspects of mitotic and meiotic chromosome segregation10 and such species-specific genes may have played a role in speciation by reinforcing reproductive isolation20. As the majority of essential genes are broadly conserved, it is possible that distant orthologues exist in other eukaryotes, including budding yeast, if some of these apparently species-specific genes are rapidly diverging. To investigate this possibility we re-interrogated the non-conserved essential genes from both yeasts and identified a further 4 potential orthologues (for details see Supplementary Table 10). This indicates that more in-depth comparisons of the essential non-conserved gene sets may reveal further distant evolutionary relationships and functions.
Figure 3.
Comparative analysis of gene dispensability profiles of fission yeast. Gene dispensability profiles of 4,836 deletion mutants by gene copy number of fission yeast orthologues compared to budding yeast (x-axis) and species distribution (y-axis). Compared to budding yeast, fission yeast genes consist of 2,841 single copy genes (n=1, m ≥1), 855 duplicated genes (n>1, m ≥1), and 1,140 genes found in fission yeast but not in budding yeast (n≥1, m=0), where ‘n’ is the number of genes in fission yeast and ‘m’ is the number of genes in budding yeast. The term ‘eukaryotes’ includes human and the term ‘variable phyla’ includes plants. The area of each circle represents the numbers of genes, where essential and non-essential genes are represented by yellow and blue, respectively.
Dispensability comparison of orthologous pairs from the two yeasts
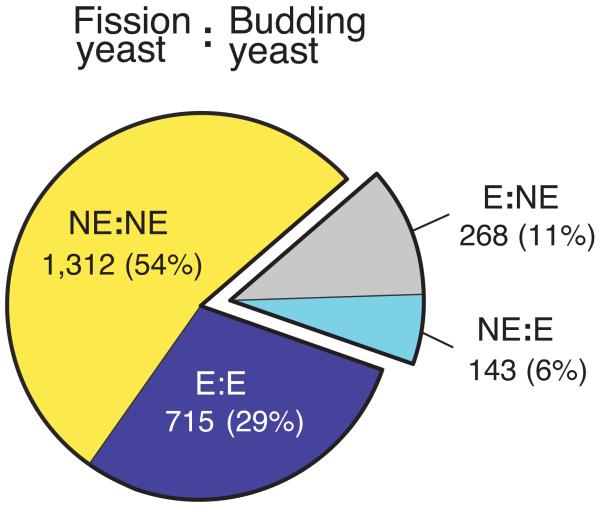
Access to deletion collections for both fission yeast and budding yeast allows a robust comparative analysis of dispensability between two evolutionarily distant eukaryotic organisms. To eliminate any complications due to functionally redundant paralogous genes, 2,438 single copy orthologous pairs (one to ones) for which deletion data is available in both organisms were used for this analysis (Supplementary Table 11). Overall 83% of these genes (2,027/2,438) had the same dispensability in both yeasts (Fig. 4a), suggesting that conserved orthologues in other organisms may also have conserved dispensability. GO enrichment of the conserved one to one essential genes in fission and budding yeasts was similar to that of all essential genes (compare Supplementary Tables 12 with Supplementary Table 5), whereas the non-essential one to one pairs (compare Supplementary Tables 13 with Supplementary Table 6) were enriched for additional GO terms, such as DNA damage, Golgi/ER related processes, and catabolic processes. As conserved genes can be expected to be under positive selection, these single-copy non-essential genes are likely to contribute to overall cell fitness. For example, the inability to repair non lethal DNA damage will reduce cell fitness. It is also likely that some processes can still take place in the absence of certain components, albeit less efficiently, because of flexibility and plasticity in the processes concerned21. The Golgi/ER related processes maybe complemented by different but related membrane trafficking pathways or components substituting one for the other.
Figure 4.
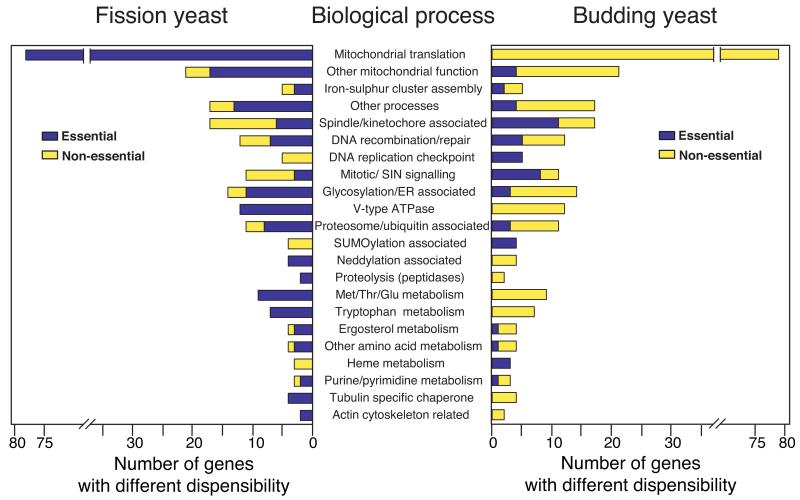
Dispensability comparison of orthologous pairs from the two yeasts. (a) Essentiality of non-redundant 2,438 orthologous pairs were compared between the two yeasts. 83% of orthologues shows conserved dispensability and the remaining 17% shows different dispensability. E=essential and NE=non-essential. (b) Functional distribution of orthologues with different dispensability. The 17% of the orthologous pairs with different dispensability were allocated to one of 31 biological terms, 22 of which are shown here. For the complete list of processes and genes, see Supplementary Table 14. Note that genes annotated to mitochondrial functions, certain amino acid metabolic pathways, and protein degradation pathways such as neddylation and sumoylation are mostly essential in one yeast and non-essential in the other yeast, whilst other categories show essential genes (although the specific genes are different) in both yeasts under the condition used in this study. Because there are some differences in the constituents of the standard rich media used for each organism it is possible that in a few cases different dispensability between the two organisms may be due to these differences.
The remaining 17% of orthologous pairs (411/2,438) differ in essentiality between the two yeasts, of these 268 are essential only in fission yeast and 143 essential only in budding yeast (Fig. 4a). Therefore, there are 125 extra essential genes (268-143) in fission yeast compared to budding yeast in this category, making the difference in dispensability of one to one orthologs a major reason why over all there are 227 more essential genes in fission yeast than in budding yeast. To analyze these differences further we identified a set of broad biological processes that encompass the entire set and sorted each gene pair into the most biologically relevant group (Fig. 4b and Supplementary Table 14). The most striking difference was for mitochondrial function (95 orthologous pairs). Of these 89 genes were essential in fission yeast and only 6 genes in budding yeast. Many of these genes encode components of the mitochondrial translation machinery (69 genes), which is required for mitochondrial DNA (mtDNA) stability. Loss of mtDNA is lethal in fission yeast but not in budding yeast where “petite” mutants lacking mtDNA are viable and mitochondrial translation is not essential22. Conversely, the DNA replication checkpoint genes rad3, rad26 and cds1 are non-essential during normal growth, whilst their respective budding yeast orthologues are essential because of the requirement for degradation of a ribonucleotide reductase inhibitor23. This inhibitor can be degraded by a second checkpoint independent pathway in fission yeast24,25 and other eukaryotes but not in budding yeast. Other examples of differential essentiality include the biological processes relating to RNA processing/ export pathways, Golgi/ER transport, spindle/kinetochore/centromere, transcription/other chromatin associated, and glycosylation/other ER-associated processes. These differences may reflect dissimilarities in the numbers of introns7, centromere structure7, the organization of the Golgi network26,27, and membrane trafficking. Although 83% of the orthologous pairs have conserved dispensability, different essentiality of specific biological processes and defined complexes in 17% of gene pairs may represent life style differences between these distantly related yeasts.
Growth profiling of diploids
As described earlier all fission deletion mutants constructed in this study have been barcoded (Supplementary Table 1), enabling the strains to be examined as an entire set in pooled experiments. Parallel analysis for changes in the growth rate of heterozygous deletion diploid strains has been used in budding yeast to identify potentially rate-limiting steps for cellular growth2,28,29. Using a similar methodology30 (Methods and Supplementary Fig. 7-9), we examined the growth rates in yeast extract medium for 4,334 fission yeast heterozygous deletion diploids (Supplementary Table 15, for the microarray raw data see Supplementary Data 4 and 5) and we further examined the growth rate of the 10 slowest haploinsufficient mutants as a proof-of-principle experiment (Supplementary Fig. 10). The growth rates of these 10 mutants were found to be comparable to the relative fitness results from the microarray parallel analysis.
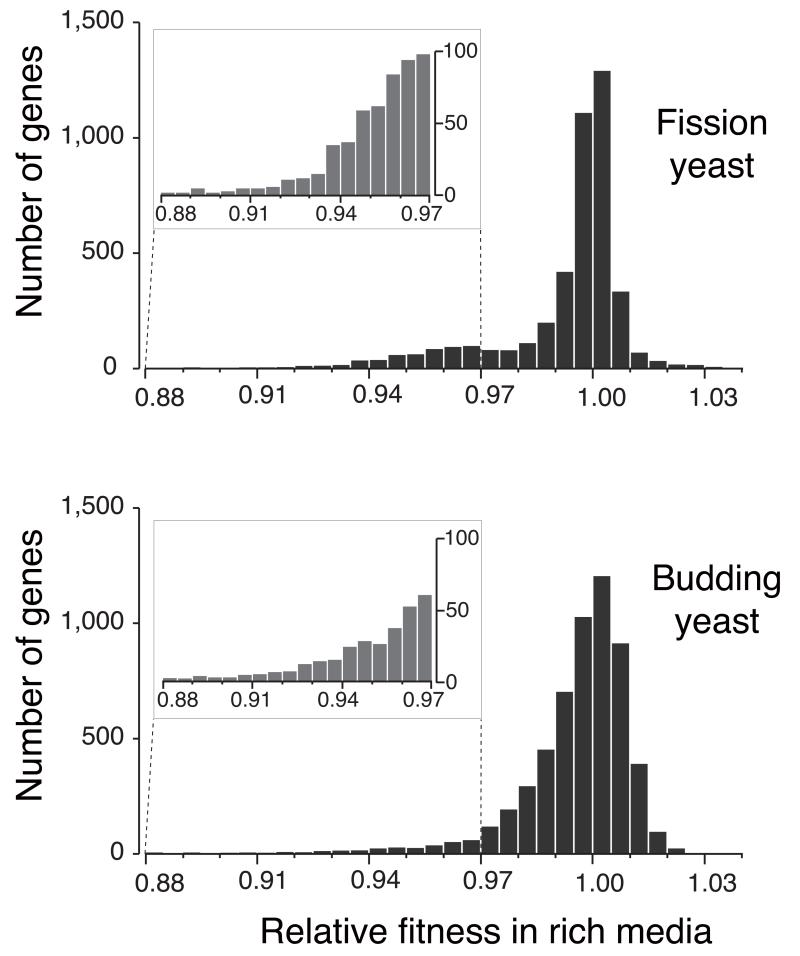
Comparisons were also made for the haploinsufficient (slower growth) and haploproficient (faster growth) genes in fission yeast and budding yeast (Fig. 5). There were considerably more haploinsufficient genes in fission yeast compared to budding yeast (455 vs. 356) when using a growth rate cut-off of less than 0.97 (Fig. 5 and Supplementary Table 16), whereas there were a similar number of haploproficient genes in both yeasts. The budding yeast life cycle is predominantly diploid and so reduced expression of potentially haploinsufficient genes in diploid cells is likely to have been subject to strong negative selection; this would not be the case for the predominantly haploid fission yeast.
Figure 5.
A comparison of the relative growth rates for the total set of heterozygous deletion diploids in fission yeast (4,334 genes) and budding yeast (5,921 genes). The relative growth rate is shown on the x-axis and the number of genes on the y-axis. In fission yeast there are more haploinsufficient genes with a relative growth rate of <0.97 compared to budding yeast (455 vs. 356), as shown in the expanded region 0.88-0.97 (see also Supplementary Table 16).
To make more direct comparison between the fission and budding yeasts, we compared the fastest 3% of haploproficient genes (136 vs. 183) and slowest 3% of haploinsufficient genes (138 vs. 184) from each organism (Table 1 and Supplementary Table 17). In fission yeast the haploproficient gene set showed GO enrichment for macromolecule biosynthesis (P <2.1×10⁻¹⁹) particularly ribosomal proteins (Table 1a and Supplementary Table 18). The TOR pathway genes (tor2, tsc1, and mip1) and genes encoding Rab-GTPase activating proteins (GAPs) were also found to be enriched in the haploproficient gene set. The loss of heterozygosity in TSC131, RAB-GTPases32, and also certain ribosomal proteins33 has been implicated in certain human cancers. None of these haploproficient genes showed any enrichment in the budding yeast haploproficient gene set. If fission yeast evolved in a nutrition poor niche, then these pathways may have evolved to fine tune optimal growth in these conditions, which may result in a sub-maximal growth rate in rich media.
Table 1.
Haploinsufficient and haploproficient genes in the two yeasts. (a) Of the 136 fastest growing genes, 54 genes (39.7%) encode ribosomal subunit proteins and 9 genes encode Rab GAP and TOR pathway related proteins. For GO enrichment of the haploproficient genes in fission yeast, see Supplementary Tables 17 and 18. (b) Genes common to the haploinsufficient gene sets of both fission yeast and budding yeast (Supplementary Tables 17 and 18). Of these 15 genes, 13 (86.7%) are involved in transcription or translation.
| GO term | Haploproficient (HP) gene | HP gene annotation | Total gene annotation | P-value (Uncorrected) | |
|---|---|---|---|---|---|
| Translation & ribosome biogenesis (G0:0006412) | 60S | rpl301, rpl501, rpl702, rpl801, rpl901, rpl902, rpl1001, rpl1101, rpl1701, rpl1801, rpl2001, rpl2002, rpl1901, rpl2101, rpl2102, rpl2301, rpl2502, rpl2802, rpl3001, rpl3201, rpl3202, rpl3401, rpl3601, rpl3602, rpl3702, rpl4301, rpl3801, rpp201 (28 genes) | 54 | 316 | 2.10 × 10⁻¹⁹ |
| 40S | rps001, rps002, rps401, rps402, rps403, rps502, rps801, rps802, rps901, rps1001, rps1002, rps1101, rps1102, rps1201, rps13, rps1501, rps1502, rps1602, rps1701, rps1702, rps1801, rps1902, rps23, rps2302, rps2402, rps2802 (26 genes) | ||||
|
| |||||
| Regulation of Rab GTPase activity (GO:0032313) | gyp1, gyp7, gyp51, SPAC1952.17c | 4 | 13 | 5.30 × 10⁻⁴ | |
|
| |||||
| TOR signaling pathway (GO:0031929) | tor2, tsc1, mip1, tco89, gad8 | 5 | 14 | 8.55 × 10⁻³ | |
| Gene Product | Gene category | Budding yeast ID | Fission yeast ID | Sc:Sp |
|---|---|---|---|---|
| Ribosomal protein S3 | Ribosomal subunit | YNL178W | SPBC16G5.14c | 1:1 |
| Ribosomal protein S6 | Ribosomal subunit | YPL090C | SPAPB1E7.12 | 1:1 |
| Ribosomal protein S7 | Ribosomal subunit | YNL096C|YOR096W | SPAC18G6.14c | 2:1 |
| Ribosomal protein L6 | Ribosomal subunit | YLR448W|YML073C | SPCC622.18 | 2:1 |
| Ribosomal protein L13 | Ribosomal subunit | YDL082W|YMR142C | SPAC664.05|SPBC839.13c | 2:2 |
| Ribosomal protein L35 | Ribosomal subunit | YDL136W|YDL191W | SPCC613.05c | 2:1 |
| Ribosomal protein L39 | Ribosomal subunit | YJL189W | SPCC663.04 | 1:1 |
|
| ||||
| TFIID subunit A (Taf12) | Transcription | YDR145W | SPAC15A10.02 | 1:1 |
| RNA pol II Rpb3 | Transcription | YIL021W | SPCC1442.10c | 1:1 |
| RNA pol Rpb6 | Transcription | YPR187W | SPCC1020.04c | 1:1 |
| RNA pol II Rpb7 | Transcription | YDR404C | SPACUNK4.06c | 1:1 |
| RNA pol Rpc10 | Transcription | YHR143W-A | SPBC19C2.03 | 1:1 |
|
| ||||
| U3 snoRNP Utp4 | RNA processing | YDR324C | SPBC19F5.02c | 1:1 |
| ATPase Rvb2 | Chromatin remodeling | YPL235W | SPBC83.08 | 1:1 |
Haploinsufficient genes from budding yeast showed a significant GO enrichment for ribosomal related function29, whereas those from fission yeast did not (Supplementary Table 18). We reasoned that any genes common to both haploinsufficient gene sets are likely to be important for regulating growth in both yeasts. A comparison of these gene sets in the two yeasts (138 vs. 184) revealed 14 common orthologous groups, 15 genes (Table 1b). These included 3 genes encoding small subunit ribosomal proteins (S3, S6, and S7), 5 genes encoding large subunit ribosomal proteins (L6, redundant L13, L35, and L39) and another 5 genes involved in transcriptional functions including a predicted transcription factor TFIID complex subunit A/ SAGA complex subunit (taf12), DNA-directed RNA polymerase II specific subunits, (rpb3 and rpb7) and DNA-directed RNA polymerase subunits (rpb6 and rpc10), which are common to DNA-directed RNA polymerases I, II, and III. Because the haploinsufficiency of these genes has been conserved between two distantly related organisms, it is likely that the amount of protein encoded by them is particularly important for the growth rate of the cell. It is therefore possible that their dosage is also important for the regulation of growth in other eukaryotes.
DISCUSSION
Fission yeast is an important model eukaryotic organism and the availability of a genome-wide deletion collection will facilitate further post-genomic studies such as genetic interaction assays, phenotypic analysis4, comparative genomics, gene dispensability analysis of higher eukaryotes, and drug-induced haploinsufficiency screening34. For example, a partial collection of the viable haploid deletions has been distributed to around 25 laboratories and studies from two laboratories have shown that there is considerable conservation of synthetic lethal genetic interactions with budding yeast as well as rewiring of some functionally conserved modules35,36.
Our comparisons of orthologous gene pairs between budding and fission yeast showed that 83% had the same dispensability despite being distantly related. This high level of conservation in dispensability will be helpful for the interpretation of more complex RNAi data from other organisms6,37-39. We have also shown that there is a relationship between gene essentiality and the presence of introns, which may indicate that essential genes are less likely to be rapidly regulated16. There are orthologs for 3,492 fission yeast genes in other eukaryotes, including humans. Of these genes 454 are not conserved in budding yeast suggesting that fission yeast may be a valuable alternative organism to budding yeast for certain experiments, for example, optimization of drug screening protocols. However there are around 3,038 genes conserved in both yeasts and other eukaryotes including humans, which encourages us in the view that conclusions drawn from analyses in the two yeasts concerning molecular and cell biology will be relevant to, and improve our understanding of, metazoan cells.
We have also identified a small set of genes required for translation and transcription, including genes encoding specific ribosomal proteins and RNA polymerase subunits that are haploinsufficient for growth in both the yeasts. These specific gene products may play a critical role in regulating the growth of eukaryotic cells. The identification of genes encoding elements of the TOR pathway, Rab-GAPs, and ribosomal proteins, as haploproficient, is also of interest given the involvement of these gene products in cancer31-33. The availability of a near complete genome-wide deletion collection for fission yeast provides a powerful tool for the functional studies of eukaryotic molecular and cell biology and for biotechnological applications.
ONLINE METHODS
Construction of genome-wide deletion mutants
Heterozygous deletion mutants of 4,836 protein coding genes in fission yeast were constructed using a method based on homologous recombination of a deletion cassette containing a pair of unique molecular bar codes (up-tag and down-tag in Supplementary Table 1) and the KanMX marker gene9. The sequences of bar codes was generated using a BioPerl-based computer program to meet the following criteria; melting temperature (Tm)=60°C, no cross-hybridization, no secondary structures, and no similarities to genomic sequences. RNAfold and mfold freeware (http://rna.tbi.univie.ac.at/cgi-bin/RNAfold.cgi) was used for checking secondary structure, and the BLAST program was used for checking similarity with genomic sequence. Deletion cassettes were generated by a modified PCR-based strategy. For 1/3 of deletion cassettes, the conventional serial-extension PCR method3,4 was used. For the remaining 2/3, the block PCR method or an innovative gene synthesis method13 was employed, resulting in the increase in the length of homologous recombination regions from ~80 bp to 250~450 bp.
Oligonucleotides used in construction of the deletion cassettes were supplied by Bioneer Corporation. The deletion cassettes were transformed into SP286 (ade6-M210/ade6-M216, leu1-32/leu1-32, ura4-D18/ura4-D18 h+/h+) using a lithium acetate method40, and then incubated for 5 days to select positive colonies on YES agar containing 100 μg/ml G418 (Duchefa Biochemie).
Confirmation of genome-wide deletion mutants
To verify the integration of deletion cassettes at the correct locus, colony PCR was carried out. Dideoxy sequencing of the PCR product from each successful deletion mutant was carried out to confirm the sequences of up- and down-tags as well as the junctions to accurately define the deleted region. To estimate how often the deletion cassette integrated at additional sites in the genome, Southern blot analysis of chromosomal DNA from 61 different deletion strains was carried out using KanMX4 as a probe. All the strains and check-PCR primers described here are available from Bioneer (http://pombe.bioneer.co.kr).
Determination of essentiality
General growth conditions and media were used as described by Moreno et al41. Essentiality was determined by a microscopic observation of colony-forming ability of spores on YES (Yeast extract medium supplemented with adenine, leucine, uracil and histidine at 250 mg/l) at 25°C and 32°C. The spores were derived from corresponding heterozygous diploid deletion strains transformed with the pON177 plasmid42 using a modified version of the PLATE method43. About 5% of the heterozygous deletion diploids could not be transformed using this high throughput method and these were repeated using a standard transformation protocol40. Briefly, 4 batches each of 48 heterozygous diploid strains were patched on to YE (yeast extract medium supplemented with leucine and uracil at 250 mg/l)+G418 agar plates in two 96-well microtitre plates (each strain is represented four times) and left to grow for 2~3 days at 32°C. Cells were inoculated into 200 μl YE+G418 and left to grow into stationary phase. The cells were harvested and transformed with pON17742, plated on minimal agar + leucine (250 mg/l) and incubated for a week at 32°C.
Transformants were inoculated into minimal media lacking nitrogen and left for 2~3 days at 25°C to induce sporulation. The asci were treated with helicase (Bio Sepra) diluted 1 in 250 to eliminate vegetative cells, washed with water and the haploid spores were plated on YES agar at 25°C and 32°C. Essentiality was determined by a microscopic observation of the germinating spores on plates after 1 and 2 days before replica plating to YES+100 μg/ml G418 to confirm that the deletion phenotype was associated with G418 resistance. Essential genes were further analysed by tetrad analysis. Briefly, cells harbouring pON177 were left to germinate for 4~5 days on minimal plates. Using a Singer MSM microscope, spores were dissected on YES plates for 4~5 days at 30°C. Viable colonies were patched onto YES plates+100 μg/ml G418 to confirm that viability was linked to G418 sensitivity. For details see Supplemental Methods 1. Whilst analyzing gene dispensability, we found that a subset of the deletion collection harboured a recessive temperature sensitive mutation unrelated to the gene deletion. This ts mutation was removed from the entire non-essential haploid deletion library after sporulation of the diploid heterozygous deletion strains of non-essential genes. There were originally 416 of the 1,260 essential heterozygous deletion diploid strains that harboured the ts mutation. Of these 416 strains, 364 have been remade and the remaining 52 are currently being remade (see Supplementary Table 1 Column U for the list of heterozygous diploid strains that still contain the ts mutation).
Redundancy and essentiality
To assess the effect of redundancy on masking essentiality and its contribution to the extra essential genes in fission yeast, we identified all genes in the one|many, many|one, and many|many categories where data was available for both organisms (Supplementary Table 1). We eliminated all orthologous groups with an equal number of essential genes in each organism (e.g. ev|ev) and those where redundancy could not contribute to the difference in essentiality (e.g. vv|vv). The remaining essential genes where redundancy could mask essentiality in one or the other organism were counted for both yeasts. There were 67 essential genes in fission yeast and 35 essential genes in budding yeast where redundancy in the other yeast could potentially be masking essentiality.
Data source and URLs
DNA and protein information of fission yeast were from the S. pombe GeneDB database ftp://ftp.sanger.ac.uk/pub/yeast/pombe/Mappings/OLD/allnames.txt_24/06/2008, and the budding yeast dataset from (http://www.yeastgenome.org/). Budding yeast deletion data3 was from (http://www.stanford.edu/group/yeast_deletion_project/). Interspecies comparisons used manually curated species distribution from GeneDB on 24/06/2008 and Version 13 of the manually curated fission yeast/budding yeast orthologue table.
Distant orthologue detection
The detection of distant orthologs used all essential S. pombe and all S. cerevisiae proteins which were not already members of an existing orthologous group, based on the manually curated S. cerevisae/ S. pombe ortholog table version 1315. Ortholog candidate detection used PSI blast, and the criteria described by Wood et al (2006)15 were used to support orthologous cluster predictions. Individual multiple alignments are provided in Supplementary Table 10. One ortholog prediction SPAC1006.42/YPR085C pair has since been confirmed experimentally (cite PMID 19040720).
GO analysis
GO enrichment analysis used the Princeton implementation of GO term finder44 (http://go.princeton.edu/cgi-bin/GOTermFinder) with gene association files from November 2008; GO TermFinder calculates P-value using the hypergeometric distribution, and Bonferroni method is used for multiple hypothesis correction. Analysis used a P-value cut off of 0.01 and all evidence codes except RCA (Reviewed Computational Analysis) are included. The whole genome comparison in Figure 2d and Supplementary Tables 5 & 6 used the total protein coding datasets for fission yeast (4,836) and budding yeast (5,776). Some biologically uninformative terms were omitted from the results (i.e. when parent and child terms show identical enrichment only the child term is included). GO process enrichment of essential genes which are conserved in single copy (Supplementary Table 12), versus non-essential genes conserved in single copy (Supplementary Table 13) used fission yeast annotations and background set.
Parallel analysis using microarray
The custom-made GeneChip (48K) was designed and manufactured according to the Affymetrix GeneChip guide (KRIBBSP2, Part No. 520506). Construction of mutant library pools, sampling, PCR amplification of probes, hybridization and washes were carried out following modified budding yeast protocols29, 30. Genomic DNA was prepared from frozen cell stocks using a kit (Zymo Research ZR-Fungal/ Bacterial DNA kit; catalog # D6005). For each sample, 10~20 OD600 corresponding to 2~4×10⁸ cells/ml was used for the genomic DNA preparation. To amplify and label the tags the following sets of primers were used for PCR using 0.2 μg genomic DNA as a template; uptag, forward (5′U-2) 5′-GCTCCCGCCTTACTTCGCAT-3′, reverse (biotin-Kan5′U-2) 5′-biotin-CGGGGACGAGGCAAGCTAA-3′; downtag, forward (DN3-F-biotin) 5′-biotin-GCCGCCATCCAGTGTCG-3′, reverse (DN3-R) 5′TTGCGTTGCGTAGGGGGG-3′. For growth profiling, data was collected from six independent experiments using two different pool sets. For details see Supplementary Figures 7-9.
Analysis of microarray results
Out of 4,441 mutants in the deletion pool, 3,523 mutants were represented by both up-tag and down-tag, and 811 mutants were represented by at least one of two tags. Therefore, at least one of the tags from 4,334 strains was detectable by chip analysis. The remaining 107 tags were removed from the analysis, as they had intensities less than 4-fold that of background. For the analysis of microarray results, the Analysis of Covariance (ANCOVA) model was used as a statistical tool. Each array signal was normalized by a mean-intensity (i.e., 2,500 arbitrary units), and interpreted by ANCOVA as a linear regression corresponding to a multiple-regression model on time (measured in generations and treated as a quantitative predictor) and replicate series (treated as a categorical predictor) simultaneously. This analysis provides estimates of statistical significance (P-values) using the F-statistic. For details see Supplemental Methods 2.
Supplementary Material
ACKNOWLEDGEMENTS
We thank members of our laboratories for their participation in the construction and analysis of the deletion mutants, particularly Hye-Rim Hwang, Hyo-Sook Ahn, Young-Dae Kim, Sunhee Park, Hyun-Jee Lee, Jee-Hee Ahn, Young-Sook Kil, Sun-Yong Park, Ji-Hyun Lim, Ju-Hyun Song, Young-Kwon Ryoo, Jee-Youn Kim, Mi-Jung Oh, Suhyun Kong, Jiwon Ahn, Namkyu Sun, Nigel Peat, Ryoko Mandeville and Juan-Juan Li. We also thank Jung-Hye Roe and Won-Ki Huh for reading this manuscript and for their insightful comments and Olaf Nielsen for his patience with the many requests for pON177. This work was supported by the intramural research program of KRIBB (Mission 2007), the Chemical Genomics Research Program and the 21st century Frontier Research Program from the Ministry of Education, Science and Technology (MOEST) of Korea. This work was also supported by Bioneer Corp., The Wellcome Trust, Cancer Research UK, The Breast Cancer Research Foundation (BCRF) and the Rockefeller University.
REFERENCES
- 1.Jorgensen P, et al. High-resolution genetic mapping with ordered arrays of Saccharomyces cerevisiae deletion mutants. Genetics. 2002;162:1091–1099. doi: 10.1093/genetics/162.3.1091. [DOI] [PMC free article] [PubMed] [Google Scholar]
- 2.Hillenmeyer ME, et al. The chemical genomic portrait of yeast: uncovering a phenotype for all genes. Science. 2008;320:362–365. doi: 10.1126/science.1150021. [DOI] [PMC free article] [PubMed] [Google Scholar]
- 3.Giaever G, et al. Functional profiling of the Saccharomyces cerevisiae genome. Nature. 2002;418:387–391. doi: 10.1038/nature00935. [DOI] [PubMed] [Google Scholar]
- 4.Winzeler EA, et al. Functional characterization of the S. cerevisiae genome by gene deletion and parallel analysis. Science. 1999;285:901–906. doi: 10.1126/science.285.5429.901. [DOI] [PubMed] [Google Scholar]
- 5.Entian KD, Kotter P. Yeast genetic strain and plasmid collections. Edn. II Vol. 36. Elsevier Ltd; 2007. [Google Scholar]
- 6.Kittler R, et al. Genome-scale RNAi profiling of cell division in human tissue culture cells. Nat. Cell Biol. 2007;9:1401–1412. doi: 10.1038/ncb1659. [DOI] [PubMed] [Google Scholar]
- 7.Wood V, et al. The genome sequence of Schizosaccharomyces pombe. Nature. 2002;415:871–880. doi: 10.1038/nature724. [DOI] [PubMed] [Google Scholar]
- 8.Fisk DG, et al. Saccharomyces cerevisiae S288C genome annotation: a working hypothesis. Yeast. 2006;23:857–865. doi: 10.1002/yea.1400. [DOI] [PMC free article] [PubMed] [Google Scholar]
- 9.Wach A, Brachat A, Pohlmann R, Philippsen P. New heterologous modules for classical or PCR-based gene disruptions in Saccharomyces cerevisiae. Yeast. 1994;10:1793–1808. doi: 10.1002/yea.320101310. [DOI] [PubMed] [Google Scholar]
- 10.Gregan J, et al. Novel genes required for meiotic chromosome segregation are identified by a high-throughput knockout screen in fission yeast. Curr. Biol. 2005;15:1663–1669. doi: 10.1016/j.cub.2005.07.059. [DOI] [PubMed] [Google Scholar]
- 11.Martin-Castellanos C, et al. A large-scale screen in S. pombe identifies seven novel genes required for critical meiotic events. Curr. Biol. 2005;15:2056–2062. doi: 10.1016/j.cub.2005.10.038. [DOI] [PMC free article] [PubMed] [Google Scholar]
- 12.Decottignies A, Sanchez-Perez I, Nurse P. Schizosaccharomyces pombe essential genes: a pilot study. Genome Res. 2003;13:399–406. doi: 10.1101/gr.636103. [DOI] [PMC free article] [PubMed] [Google Scholar]
- 13.Smith HO, Hutchison CA, 3rd, Pfannkoch C, Venter JC. Generating a synthetic genome by whole genome assembly: phiX174 bacteriophage from synthetic oligonucleotides. Proc. Natl. Acad. Sci. USA. 2003;100:15440–15445. doi: 10.1073/pnas.2237126100. [DOI] [PMC free article] [PubMed] [Google Scholar]
- 14.Sipiczki M. Where does fission yeast sit on the tree of life? Genome Biol. 2000;1 doi: 10.1186/gb-2000-1-2-reviews1011. REVIEWS1011. [DOI] [PMC free article] [PubMed] [Google Scholar]
- 15.Wood V. Schizosaccharomyces pombe comparative genomics; from sequence to systems. Vol. 15. Heidelberg; Springer Berlin: 2006. [Google Scholar]
- 16.Jeffares DC, Penkett CJ, Bahler J. Rapidly regulated genes are intron poor. Trends Genet. 2008;24:375–378. doi: 10.1016/j.tig.2008.05.006. [DOI] [PubMed] [Google Scholar]
- 17.Matsuyama A, et al. ORFeome cloning and global analysis of protein localization in the fission yeast Schizosaccharomyces pombe. Nat. Biotechnol. 2006;24:841–847. doi: 10.1038/nbt1222. [DOI] [PubMed] [Google Scholar]
- 18.Huh WK, et al. Global analysis of protein localization in budding yeast. Nature. 2003;425:686–691. doi: 10.1038/nature02026. [DOI] [PubMed] [Google Scholar]
- 19.Benton MJ, Ayala FJ. Dating the tree of life. Science. 2003;300:1698–1700. doi: 10.1126/science.1077795. [DOI] [PubMed] [Google Scholar]
- 20.Hoskin CJ, Higgie M, McDonald KR, Moritz C. Reinforcement drives rapid allopatric speciation. Nature. 2005;437:1353–1356. doi: 10.1038/nature04004. [DOI] [PubMed] [Google Scholar]
- 21.Harrison R, Papp B, Pal C, Oliver SG, Delneri D. Plasticity of genetic interactions in metabolic networks of yeast. Proc. Natl. Acad. Sci. USA. 2007;104:2307–2312. doi: 10.1073/pnas.0607153104. [DOI] [PMC free article] [PubMed] [Google Scholar]
- 22.Chiron S, Suleau A, Bonnefoy N. Mitochondrial translation: elongation factor tu is essential in fission yeast and depends on an exchange factor conserved in humans but not in budding yeast. Genetics. 2005;169:1891–1901. doi: 10.1534/genetics.104.037473. [DOI] [PMC free article] [PubMed] [Google Scholar]
- 23.Choi DH, Oh YM, Kwon SH, Bae SH. The mutation of a novel Saccharomyces cerevisiae SRL4 gene rescues the lethality of rad53 and lcd1 mutations by modulating dNTP levels. J. Microbiol. 2008;46:75–80. doi: 10.1007/s12275-008-0013-6. [DOI] [PubMed] [Google Scholar]
- 24.Ralph E, Boye E, Kearsey SE. DNA damage induces Cdt1 proteolysis in fission yeast through a pathway dependent on Cdt2 and Ddb1. EMBO Rep. 2006;7:1134–1139. doi: 10.1038/sj.embor.7400827. [DOI] [PMC free article] [PubMed] [Google Scholar]
- 25.Liu C, et al. Cop9/signalosome subunits and Pcu4 regulate ribonucleotide reductase by both checkpoint-dependent and -independent mechanisms. Genes Dev. 2003;17:1130–1140. doi: 10.1101/gad.1090803. [DOI] [PMC free article] [PubMed] [Google Scholar]
- 26.Preuss D, Mulholland J, Franzusoff A, Segev N, Botstein D. Characterization of the Saccharomyces Golgi complex through the cell cycle by immunoelectron microscopy. Mol. Biol. Cell. 1992;3:789–803. doi: 10.1091/mbc.3.7.789. [DOI] [PMC free article] [PubMed] [Google Scholar]
- 27.Ayscough K, Hajibagheri NM, Watson R, Warren G. Stacking of Golgi cisternae in Schizosaccharomyces pombe requires intact microtubules. J. Cell Sci. 1993;106(Pt 4):1227–1237. doi: 10.1242/jcs.106.4.1227. [DOI] [PubMed] [Google Scholar]
- 28.Roemer T, et al. Large-scale essential gene identification in Candida albicans and applications to antifungal drug discovery. Mol. Microbiol. 2003;50:167–181. doi: 10.1046/j.1365-2958.2003.03697.x. [DOI] [PubMed] [Google Scholar]
- 29.Deutschbauer AM, et al. Mechanisms of haploinsufficiency revealed by genome-wide profiling in yeast. Genetics. 2005;169:1915–1925. doi: 10.1534/genetics.104.036871. [DOI] [PMC free article] [PubMed] [Google Scholar]
- 30.Pierce SE, et al. A unique and universal molecular barcode array. Nat. Methods. 2006;3:601–603. doi: 10.1038/nmeth905. [DOI] [PubMed] [Google Scholar]
- 31.Jozwiak J, Jozwiak S, Wlodarski P. Possible mechanisms of disease development in tuberous sclerosis. Lancet Oncol. 2008;9:73–79. doi: 10.1016/S1470-2045(07)70411-4. [DOI] [PubMed] [Google Scholar]
- 32.Cheng KW, Lahad JP, Gray JW, Mills GB. Emerging role of RAB GTPases in cancer and human disease. Cancer Res. 2005;65:2516–2519. doi: 10.1158/0008-5472.CAN-05-0573. [DOI] [PubMed] [Google Scholar]
- 33.McGowan KA, et al. Ribosomal mutations cause p53-mediated dark skin and pleiotropic effects. Nat. Genet. 2008;40:963–970. doi: 10.1038/ng.188. [DOI] [PMC free article] [PubMed] [Google Scholar]
- 34.Lum PY, et al. Discovering modes of action for therapeutic compounds using a genome-wide screen of yeast heterozygotes. Cell. 2004;116:121–137. doi: 10.1016/s0092-8674(03)01035-3. [DOI] [PubMed] [Google Scholar]
- 35.Roguev A, et al. Conservation and rewiring of functional modules revealed by an epistasis map in fission yeast. Science. 2008;322:405–410. doi: 10.1126/science.1162609. [DOI] [PMC free article] [PubMed] [Google Scholar]
- 36.Dixon SJ, et al. Significant conservation of synthetic lethal genetic interaction networks between distantly related eukaryotes. Proc. Natl. Acad. Sci. USA. 2008;105:16653–16658. doi: 10.1073/pnas.0806261105. [DOI] [PMC free article] [PubMed] [Google Scholar]
- 37.Kamath RS, et al. Systematic functional analysis of the Caenorhabditis elegans genome using RNAi. Nature. 2003;421:231–237. doi: 10.1038/nature01278. [DOI] [PubMed] [Google Scholar]
- 38.Dietzl G, et al. A genome-wide transgenic RNAi library for conditional gene inactivation in Drosophila. Nature. 2007;448:151–156. doi: 10.1038/nature05954. [DOI] [PubMed] [Google Scholar]
- 39.Ravi D, et al. A network of conserved damage survival pathways revealed by a genomic RNAi screen. PLoS Genet. 2009;5:e1000527. doi: 10.1371/journal.pgen.1000527. [DOI] [PMC free article] [PubMed] [Google Scholar]
- 40.Bahler J, et al. Heterologous modules for efficient and versatile PCR-based gene targeting in Schizosaccharomyces pombe. Yeast. 1998;14:943–951. doi: 10.1002/(SICI)1097-0061(199807)14:10<943::AID-YEA292>3.0.CO;2-Y. [DOI] [PubMed] [Google Scholar]
- 41.Moreno S, Klar A, Nurse P. Molecular genetic analysis of fission yeast Schizosaccharomyces pombe. Methods Enzymol. 1991;194:795–823. doi: 10.1016/0076-6879(91)94059-l. [DOI] [PubMed] [Google Scholar]
- 42.Styrkarsdottir U, Egel R, Nielsen O. The smt-0 mutation which abolishes mating-type switching in fission yeast is a deletion. Curr. Genet. 1993;23:184–186. doi: 10.1007/BF00352020. [DOI] [PubMed] [Google Scholar]
- 43.Elble R. A simple and efficient procedure for transformation of yeasts. Biotechniques. 1992;13:18–20. [PubMed] [Google Scholar]
- 44.Boyle EI, et al. GO::TermFinder--open source software for accessing Gene Ontology information and finding significantly enriched Gene Ontology terms associated with a list of genes. Bioinformatics. 2004;20:3710–3715. doi: 10.1093/bioinformatics/bth456. [DOI] [PMC free article] [PubMed] [Google Scholar]
Associated Data
This section collects any data citations, data availability statements, or supplementary materials included in this article.


