Abstract
Objective:
To evaluate the benefit of statistical SPECT processing over traditional subtraction methods, we compared ictal–interictal SPECT analyzed by statistical parametric mapping (SPM) (ISAS), statistical ictal SPECT coregistered to MRI (STATISCOM), and subtraction ictal–interictal SPECT coregistered with MRI (SISCOM) in patients with MRI-negative focal temporal lobe epilepsy (nTLE) and extratemporal lobe epilepsy (nETLE).
Methods:
We retrospectively identified 49 consecutive cases of drug-resistant focal epilepsy that had a negative preoperative MRI and underwent interictal and ictal SPECT prior to resective epilepsy surgery. Interictal and ictal SPECT scans were analyzed using SISCOM, ISAS, and STATISCOM to create hyperperfusion and hypoperfusion maps for each patient. Reviewers blinded to clinical data and the SPECT analysis method marked the site of probable seizure origin and indicated their confidence in the localization.
Results:
In nTLE and nETLE, the hyperperfusions detected by STATISCOM (71% nTLE, 57% nETLE) and ISAS (67% nTLE, 53% nETLE) were more often colocalized with surgery resection site compared to SISCOM (38% nTLE, 36% nETLE). In nTLE, localization of the hyperperfusion to the region of surgery was associated with an excellent outcome for STATISCOM (p = 0.005) and ISAS (p = 0.027), but not in SISCOM (p = 0.071). This association was not present in nETLE for any method.
Conclusion:
In an unselected group of patients with normal MRI and focal epilepsy, SPM-based methods of SPECT processing showed better localization of SPECT hyperperfusion to surgical resection site and higher interobserver agreement compared to SISCOM. These results show the benefit of statistical SPECT processing methods and further highlight the challenge of nETLE.
In absence of an MRI lesion, epilepsy surgery outcomes are markedly reduced1–9 and many patients, even after undergoing invasive intracranial EEG (iEEG) monitoring, are ultimately not candidates for resection.10 SPECT has become a routinely used tool in preoperative seizure localization, and has been further improved by ictal–interictal subtraction and coregistration to a high-resolution MRI.11,12 Subtraction ictal–interictal SPECT coregistered with MRI (SISCOM) has been demonstrated in a prospective study to alter the consensus decision-making process in epilepsy surgery.13
SISCOM, however, does not compensate for the physiologic variance in cerebral blood flow that shows significant asymmetries in multiple areas. Statistical parametric mapping (SPM) was used to determine statistical significance of perfusion changes in epilepsy patients by comparison to a control group without epilepsy.14–16
A recent study17 showed that ictal–interictal SPECT analyzed by SPM (ISAS) identified the region of seizure onset in 83% of cases with well-localized neocortical epilepsy and in 71% of cases with mesial temporal sclerosis. Another study18 showed that statistical ictal SPECT coregistered to MRI analysis (STATISCOM) was superior to SISCOM for seizure localization in temporal lobe epilepsy (TLE) surgery, and localization of the STATISCOM focus to the TLE subtype was associated with a seizure-free outcome. These studies showed improved sensitivity of SPM-SPECT for seizure focus localization, but sensitivity and specificity of SPM-SPECT in a population of unselected patients with normal MRI focal epilepsy remains unclear.
METHODS
Standard protocol approval, registration, and patient selection.
The study was approved by the Mayo Clinic institutional review board (IRB) and written informed consent for SPECT imaging was obtained from the 30 control subjects without any history of neurologic disease. These scans were used as a control population for comparison with epilepsy patients in SPM analysis. Patients with epilepsy undergoing SPECT had consented and IRB approved for their data to be used in retrospective clinical studies.
Study subjects.
Selection criteria were (1) a diagnosis of drug-resistant focal epilepsy, (2) surgical resection of the suspected epileptogenic site, (3) SPECT data sufficient for SISCOM, STATISCOM, and ISAS analysis, (4) preoperative “seizure protocol” MRI negative for epileptogenic lesion, (5) age 10 and older. An additional post hoc analysis was performed on patients with excellent surgical outcome defined as remaining seizure-free or having only nondisabling seizures with a minimum period of 1 year postsurgical follow-up.
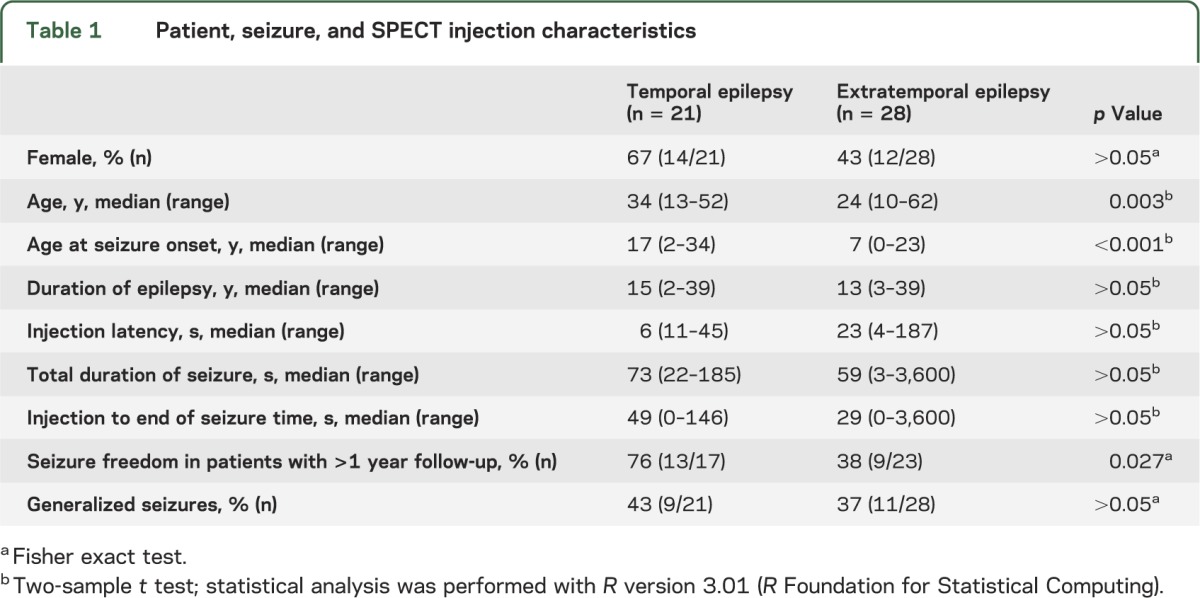
Based on these criteria, we retrospectively identified 49 cases of MRI-negative epilepsy, i.e., nonlesional temporal (21 cases) and extratemporal (28 cases) lobe epilepsy, between January 1997 and December 2005 at Mayo Clinic, Rochester, MN (table 1). Presurgical evaluation included in all cases history and neurologic examination by an epileptologist, awake and sleep EEG, seizure-protocol brain MRI, ictal recording by inpatient video-EEG monitoring, and ictal and interictal SPECT injection. Results of presurgical evaluation were presented at a multidisciplinary epilepsy surgery conference, where the consensus decision about surgery was made. This decision was based on video-EEG recording and all other available diagnostic modalities. SPM-SPECT analysis was performed after surgery.
Table 1.
Patient, seizure, and SPECT injection characteristics
All patients with TLE underwent a standardized anterior temporal lobectomy (10 right, 11 left). Extratemporal lobe epilepsy (ETLE) cases underwent focal cortical resections (22 frontal, 1 occipital, 5 parietal). Postsurgical outcome with respect to seizures was determined by review of the patient's medical records and mail and telephone contact with patients.
Control subjects.
Two SPECT scans on subsequent days between June and August 2007 were taken on 30 normal subjects (age 18 to 39; 15 male, 15 female; 16 right-handed, 3 left-handed, hand preference unknown in 11 individuals) to provide a basis for representing normal cerebral blood perfusion variability for SPM. Images were acquired on a dual-headed Elscint Helix gamma camera system (Elscint, Haifa, Israel) with ultrahigh-resolution fan beam collimators. Projections were acquired on a 128 × 128-pixel matrix over a 360° circular orbit, with 120 views obtained at 3° intervals. Images were reconstructed by routine clinical algorithm with a Metz filter (power, 3, full-width at half-maximum [FWHM], 6 mm) rebinned into 64 × 64 matrix with a 2× zoom. Chang attenuation correction (12 mm) was applied, and standard series of contiguous images were created in the transaxial, coronal, sagittal, and transtemporal planes. Reconstructed data resolution was 1.8 × 1.8 × 3.6 mm.
Patients' SPECT data.
99mTc-labeled ethyl cysteinate dimer (ECD) was administered as soon as seizure onset was noted during a prolonged video-EEG monitoring session. The duration of the seizure and the time of initiation of ictal SPECT injection were determined during analysis of the video-EEG recordings of the seizure.
Interictal injections were performed after the patient had been seizure-free for 24 hours (determined by video-EEG), in ambient room lighting, with the patient's eyes open and ears unplugged. Images of ictal and interictal studies were acquired with the same scanner and identical protocol as in control subjects, within 2 hours of radioisotope injection. Two patients had repeated SPECT studies, yielding in total 51 ictal–interictal SPECT scans. The dose of the injected radioisotope for both the ictal and interictal studies was approximately 20 mCi.
Data processing.
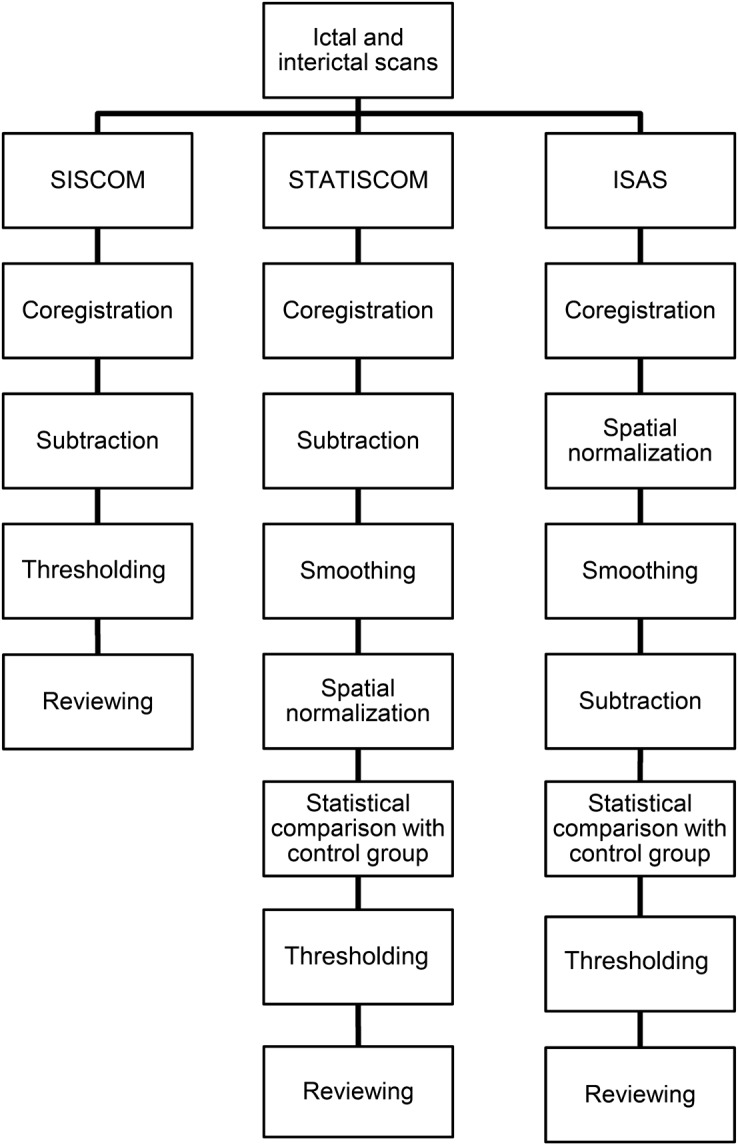
For SISCOM analysis, ictal and interictal SPECT images were realigned using an automated registration algorithm based on a mutual information cost function, normalized for the global brain signal, and the interictal image was then subtracted from the ictal to produce a difference image. Hyperperfusion and hypoperfusion maps were created from voxels that were at least 2 SDs from the mean value and were coregistered with the patient's structural MRI. Images were generated using image analysis software (Analyze 11.0, Biomedical Imaging Resource, Mayo Foundation, Rochester, MN), as described previously.19
SPM is a voxel-based method of image analysis that is able to characterize regionally specific response to experimental factors in a standard anatomical space. The analysis of data involves spatial processing (in order to combine data from different scans or subjects), estimating the parameters of a statistical model, and making inferences about those parameter estimates with appropriate statistics. The resulting t statistic maps provide a statistically more robust activation threshold than is offered by simple subtraction.
ISAS processing was performed using the procedure outlined in McNally et al.17 Ictal and interictal SPECT images were realigned and spatially normalized to the SPM SPECT template, extracerebral signal was removed using brain mask provided with SPM. Images were then smoothed with an isotropic Gaussian kernel of 16 mm FWHM and global intensity normalization to correct for differences in total brain counts between scan pairs was performed by using proportional scaling with an analysis threshold of 0.8. Statistical analysis was made by using multigroup condition and covariate model in SPM5 with each ictal–interictal pair being compared to the database of healthy controls. Analysis was performed within MATLAB (version 7.12; The Mathworks, Natick, MA) using fully scripted version of the ISAS Toolbox (http://spect.yale.edu/instructions.html).
For STATISCOM analysis, images were generated using the procedure described in Kazemi et al.18 Ictal and interictal SPECT images were realigned and difference and mean images were created in the Analyze software. The difference and mean images were spatially normalized to standardized SPECT template and extracerebral signal was removed using a brain mask provided with SPM. Masked and normalized images were smoothed with the same isotropic Gaussian kernel as in ISAS analysis. Normalized, smoothed, and masked difference images were then compared to the normal control set using an unpaired 2-sample t test in SPM2 software in MATLAB.
Perfusion maps.
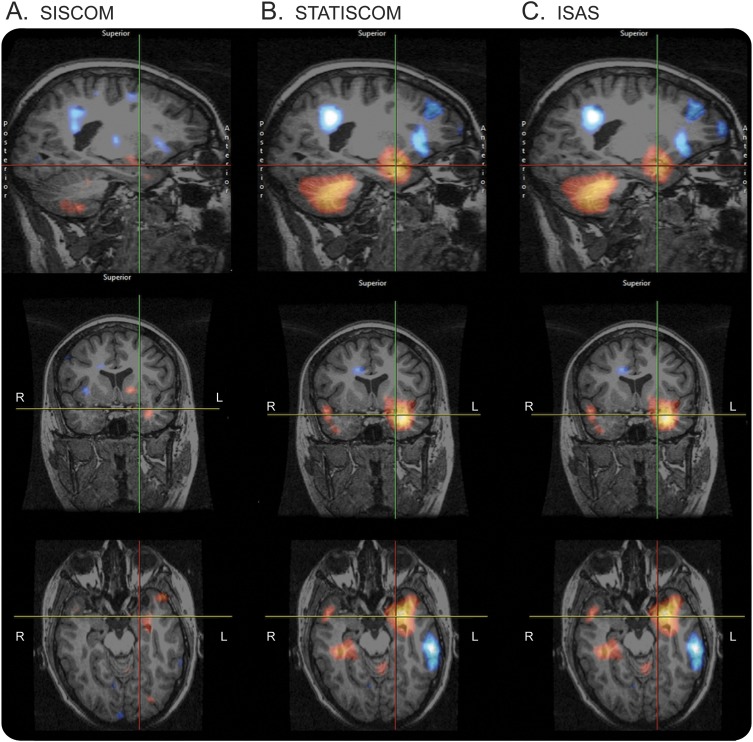
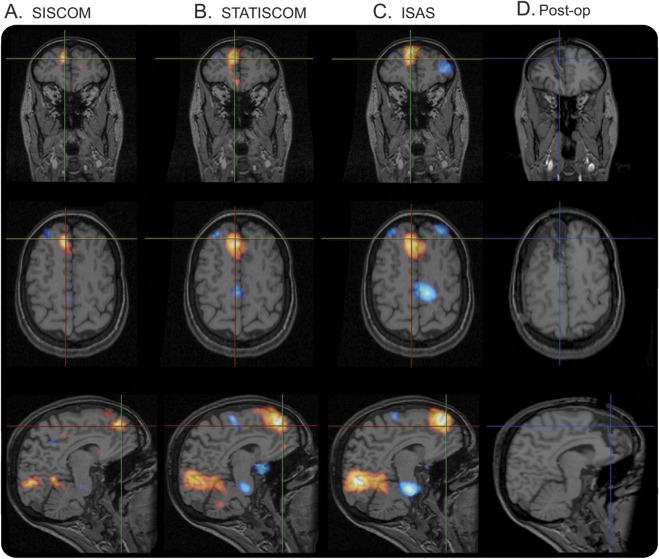
Contrasts were set up to reflect relative cerebral perfusion increases and decreases. A cluster threshold of 125 voxels was used as described by McNally et al., corresponding to the approximate spatial resolution of SPECT in tissue (1 cm3). Perfusion maps were created with thresholds p = 0.001 (uncorrected) for ISAS, p = 0.027 (uncorrected) for STATISCOM, and 2 SDs for SISCOM (figures 1 and 2). The threshold for SISCOM was based on a widely clinically used setting. To minimize potential reviewer bias caused by different sizes of perfusion changes, thresholds for SPM methods were optimized using a training set of 5 cases with prominent hyperperfusion to create consistent and equally sized perfusion maps for all analysis methods. Hyperperfusion and hypoperfusion maps were transformed to the patient's space and displayed on each patient's MRI. A summary of data processing comparing all 3 methods is presented in figure 3.
Figure 1. SISCOM, STATISCOM, and ISAS images demonstrate areas of hyperperfusion in a patient with temporal lobe epilepsy.
(A) Subtraction ictal–interictal SPECT coregistered with MRI (SISCOM), (B) statistical ictal SPECT coregistered to MRI analysis (STATISCOM), (C) ictal–interictal SPECT analyzed by statistical parametric mapping (ISAS). Areas of hyperperfusion (red and yellow) and hypoperfusion (blue and white) were identified by blinded reviewers.
Figure 2. SISCOM, STATISCOM, and ISAS demonstrate areas of hyperperfusion.
The images ([A] subtraction ictal–interictal SPECT coregistered with MRI [SISCOM], [B] statistical ictal SPECT coregistered to MRI analysis [STATISCOM], [C] ictal–interictal SPECT analyzed by statistical parametric mapping [ISAS]) show area of hyperperfusion in right frontal lobe in a patient who was ultimately rendered seizure-free. Postoperative MRI (D) demonstrates good overlap of hyperperfusion (in warm color scale) with the region of focal cortical resection.
Figure 3. Summary of image processing.
Reviewing.
A custom software tool for reviewing and annotating the image data was created. The BlindStudy software tool (based on the Analyze/AVW software platform, Biomedical Imaging Resource, Mayo Clinic) displays hyperperfusion and hypoperfusion images after thresholding in sagittal, axial, and coronal planes simultaneously on patient's MRI. Three reviewers (V.S., L.C.W.-K., J.W.B.), blinded to all clinical data and analysis method used (ISAS, STATISCOM, or SISCOM), marked up to 3 regions of the most prominent hyperperfusion or hypoperfusion and rated their confidence (scale of 1 to 4) in the significance of the localization.
Each of the cerebral hemispheres was divided into frontal, temporal, insular, parietal, and occipital region for a total of 10 regions per patient. In total, each reviewer marked 153 scans presented in random order by the software tool.
Statistical analysis.
We compared SISCOM, STATISCOM, and ISAS with the following variables:
Localization of perfusion changes (side and region colocalized with resection)
Interobserver agreement among the 3 reviewers
Identification of dominant hyperperfusion focus
Association of excellent outcome and localizing perfusion changes in patients with longer than 1 year follow-up
Interobserver agreement among primary reviewers was determined using Fleiss kappa scores. Agreement was considered poor for kappa <0.4, good for kappa >0.4 but <0.75, and excellent for kappa >0.75.20 McNemar χ2 test was used to compare the proportion of patients localized by SPM-based methods vs SISCOM evaluation. For nonpaired data, the Mann-Whitney U test (2-tailed) was used for ordinal and continuous variables (excellent outcome and localization to the region of surgery).
RESULTS
Localization value.
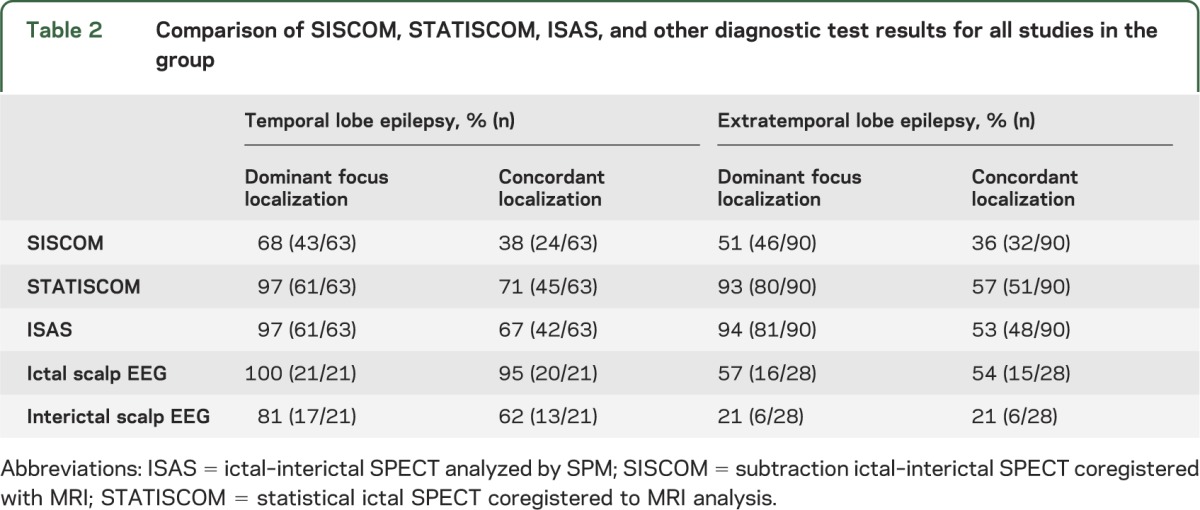
Concordance of SISCOM (38%) to the resection site (relevant temporal lobe) in MRI-negative focal TLE (nTLE) was lower than in STATISCOM (71%, p < 0.001) and ISAS (67%, p < 0.001). In MRI-negative ETLE (nETLE), concordance of SISCOM to the resection site (36%) was also lower than in STATISCOM (57%, p = 0.0017) and ISAS (53%, p = 0.0046).
Dominant hyperperfusion focus.
Dominant hyperperfusion focus, concordant or discordant to the resection, was identified in significantly more patients by SPM-based analysis than SISCOM. In nTLE patients, SISCOM was localizing in 68% vs 97% in STATISCOM (p < 0.001) and 97% in ISAS (p < 0.001). In nETLE patients, SISCOM was localizing in 51% vs 93% in STATISCOM (p < 0.001) and 94% in ISAS (p < 0.001).
Interobserver agreement.
Interobserver agreement (kappa score, Fleiss kappa) for chosen region (resection site) was also higher for SPM-SPECT analysis. In nTLE, kappa score was 0.32 for SISCOM vs 0.55 for STATISCOM and 0.67 for ISAS. In nETLE, the agreement was 0.40 for SISCOM, 0.56 for STATISCOM, and 0.46 for ISAS.
The confidence with which the reviewers believed images were localizing was also higher for SPM-SPECT analysis. Mean confidence rating with SISCOM in nTLE was 1.90 (SD ± 1.00), with STATISCOM 2.94 (SD ± 0.79), and with ISAS 2.92 (SD ± 0.80). Mean confidence rating in nETLE with SISCOM was 1.51 (SD ± 0.83), with STATISCOM 2.34 (SD ± 0.79), and with ISAS 2.33 (SD ± 0.83). The differences between SPM methods and SISCOM for nTLE and nETLE were statistically significant (p < 0.001).
Comparison with other diagnostic modalities.
Comparison with other diagnostic modalities is shown in table 2. In nTLE, the dominant focus localization by STATISCOM and ISAS was comparable to the results from ictal EEG, and concordance of resection site and marked focus was lower than in iEEG. In nETLE, the concordance of SPM SPECT analysis to the resection site was similar to results of ictal EEG. Overall, these results were complementary, as some patients with indeterminate findings from ictal EEG had positive SPECT results (in 8 cases with STATISCOM, in 8 cases with ISAS, and in 2 cases with SISCOM).
Table 2.
Comparison of SISCOM, STATISCOM, ISAS, and other diagnostic test results for all studies in the group
Surgical outcome and pathology.
Analysis was performed for patients with longer than 1 year follow-up. In nTLE (n = 17), localization to the region of surgery and excellent outcome was significantly higher in STATISCOM (p = 0.008) and ISAS (p = 0.046), but not in SISCOM (p = 0.17). In nETLE (n = 23), association with excellent outcome was not significant for any modality. Seizure generalization in nTLE was associated with nonlocalizing findings by STATISCOM (p = 0.043), but not by ISAS (p = 0.095) or SISCOM (p = 0.055). In nETLE, there was no significant correlation of seizure generalization and localizing findings for any method used.
Pathology in nTLE patients showed 17 cases of nonspecific gliosis, 3 cases of mesial temporal sclerosis, and 1 case of a cortical dysplasia. In nETLE, pathology showed nonspecific gliosis in 25 cases and a cortical dysplasia in 3 cases.
DISCUSSION
The ultimate goal of epilepsy surgery is to render a patient seizure-free. To achieve this outcome, precise localization of epileptogenic zone is necessary. In MRI-negative cases, scalp EEG is helpful in localizing the epileptogenic zone but it is often difficult to interpret, especially in ETLE, and it lacks the spatial resolution of diagnostic imaging methods. Functional imaging modalities such as PET and ictal SPECT can show localized metabolic or perfusion changes that are independent of structural abnormities and can help guide implantation of intracranial EEG electrodes.13 A study in children with focal cortical dysplasia21 showed that ictal SPECT was comparable to MRI and EEG and favorable surgical outcome was achieved when the ictal hyperperfusion was completely resected. Another study compared magnetoencephalography (MEG), SPECT, and PET and found that SISCOM and PET had higher odds ratio for predicting seizure-free outcome compared to MEG.22 In ETLE patients, SISCOM frequently localized extratemporal seizures when neither EEG nor MRI was localizing.11
Previous studies of SPM-based SPECT analysis in epilepsy were limited to a small number of MRI-negative patients (n = 6 extratemporal and n = 7 temporal)17 or inclusion of only temporal epilepsy patients.18 Using only ictal SPECT image with database of healthy controls, SPM analysis was comparable to the subtraction method in TLE, but a majority of studied patients had MRI findings of hippocampal atrophy.23 Furthermore, without an interictal study, when interictal hypoperfusion is profound, the ictal increase in perfusion may not exceed that in control subjects.24,25 We specifically analyzed only patients with MRI-negative epilepsy, and our results show that use of a control group for analyzing ictal–interictal perfusion difference further improves the localization value of ictal SPECT. The higher confidence rating and interobserver agreement also suggest that SPM-processed images are easier to interpret, probably due to suppression of perfusion differences caused by physiologic interscan variability.
In the current study, the concordance between SISCOM localization and surgical site in temporal epilepsy was only 38%, which is lower than in previous SISCOM studies that included both lesional and nonlesional patients.11,18 Also, image reviewers in previous studies were informed about the seizure duration and the timing of SPECT injection when reviewing each patient study, a fact that could have influenced their decision in localizing the SISCOM abnormality. The sensitivity of SISCOM in nETLE was 36%, which is consistent with previously reported results in patients with normal preoperative MRI.7,26,27 The concordance rate of MRI, PET, SPECT, and pathologic diagnosis in nETLE is known to be lower than in nTLE.28–31 This may be caused by multiple factors that include more rapid and variable seizure propagation, shorter duration of seizure, and delayed time of radionuclide injection, although in our study the only statistically significant differences between the 2 groups were patients' age and age at seizure onset. The reason for the relative better sensitivity of SPM methods in TLE compared to ETLE in this study is unclear. SPM analysis with ISAS32 and STATISCOM enhanced localization of epileptogenic brain in nETLE by SPECT by at least 15% and its localizing rate was comparable with those of ictal EEG.
A limitation of our study is that a fixed perfusion threshold was used, but having multiple threshold levels would be impractical for a blind review. A study on determining an optimal SISCOM threshold was recently published33 and showed that the z score of 1.5 was significantly more sensitive and specific than traditionally used z score of 2. In a clinical setting, reviewers are usually fully aware of results of other diagnostic methods used, which could bias the reported area of hyperperfusion, e.g., in the reported EEG onset location. It is important to note that the patient cohort was highly selected and includes only patients with nonlesional MRI who underwent epilepsy surgery. The number of patients with MRI-negative epilepsy considered for epilepsy surgery is approximately 3–4 times higher than the final number that proceed to surgery.10 Concordance of diagnostic studies is usually lower in noncandidates than in the epilepsy surgery group and the overall sensitivity of SPM-SPECT lower.10 The need for normal controls for statistical analysis can be a limiting factor in practice. However, it is possible to use freely available control images provided that the SPECT tracer is the same.17
Statistical analysis of SPECT data using a group of normal controls is a useful addition to the standard clinical practice of SPECT processing and can further improve localization value of already available SPECT data. SPM-SPECT is especially useful in MRI-negative epilepsy where localized perfusion changes complement other diagnostic modalities in guiding iEEG electrode implantation and subsequent surgical resection.
Supplementary Material
ACKNOWLEDGMENT
Portions of this work were presented at the American Epilepsy Society annual meeting, San Diego, CA, December 2012. The authors thank Karla Crockett and Cindy Nelson for technical support.
GLOSSARY
- ETLE
extratemporal lobe epilepsy
- FWHM
full-width at half-maximum
- iEEG
intracranial EEG
- IRB
institutional review board
- ISAS
ictal–interictal SPECT analyzed by statistical parametric mapping
- MEG
magnetoencephalography
- nETLE
MRI-negative extratemporal lobe epilepsy
- nTLE
MRI-negative focal temporal lobe epilepsy
- SISCOM
subtraction ictal–interictal SPECT coregistered with MRI
- SPM
statistical parametric mapping
- STATISCOM
statistical ictal SPECT coregistered to MRI analysis
- TLE
temporal lobe epilepsy
Footnotes
Editorial, page 910
AUTHOR CONTRIBUTIONS
V. Sulc: design of the study, analysis or interpretation of the data, drafting the manuscript for intellectual content. S. Stykel: conceptualization of the study. D.P. Hanson: conceptualization of the study, drafting the manuscript for intellectual content. B.H. Brinkmann: conceptualization of the study. D.T. Jones: conceptualization of the study. D.R. Holmes III: conceptualization of the study, drafting the manuscript for intellectual content. R.A. Robb: drafting the manuscript for intellectual content. M.L. Senjem: conceptualization of the study. B.P. Mullan: conceptualization of the study. R.E. Watson, Jr: revising the manuscript for intellectual content. D. Horinek: revising the manuscript for intellectual content. G.D. Cascino: revising the manuscript for intellectual content. L.C. Wong-Kisiel: interpretation of the data. J.W. Britton: interpretation of the data. E.L. So: revising the manuscript for intellectual content. G.A. Worrell: drafting the manuscript for intellectual content.
STUDY FUNDING
Supported by a gift from Mr. and Mrs. David Hawk, Mayo CTSA grant number UL1TR000135, NIH R01-NS63039 (G.A.W.), IGA MZCR NT/11536-5, European Regional Development Fund–Project FNUSA–ICRC (No. CZ.1.05/1.1.00/02.0123), and the European Social Fund within the project Young Talent Incubator II (reg. no. CZ.1.07/2.3.00/20.0117).
DISCLOSURE
V. Sulc and S. Stykel report no disclosures relevant to the manuscript. D. Hanson has received license fee payments from Analyze Direct. B. Brinkmann and D. Jones report no disclosures relevant to the manuscript. D. Holmes has received license fee payments from Analyze Direct. R. Robb has received license fee payments from Analyze Direct. M. Senjem, B. Mullan, R. Watson, and D. Horinek report no disclosures relevant to the manuscript. G. Cascino has received personal compensation in an editorial capacity for Neurology®. L. Wong-Kisiel, J. Britton, and E. So report no disclosures relevant to the manuscript. G. Worrell has received personal compensation for activities with NeuroVista as a consultant. Go to Neurology.org for full disclosures.
REFERENCES
- 1.Sylaja PN, Radhakrishnan K, Kesavadas C, Sarma PS. Seizure outcome after anterior temporal lobectomy and its predictors in patients with apparent temporal lobe epilepsy and normal MRI. Epilepsia 2004;45:803–808 [DOI] [PubMed] [Google Scholar]
- 2.Jayakar P, Dunoyer C, Dean P, et al. Epilepsy surgery in patients with normal or nonfocal MRI scans: integrative strategies offer long-term seizure relief. Epilepsia 2008;49:758–764 [DOI] [PubMed] [Google Scholar]
- 3.Holmes M, Born D. Outcome after surgery in patients with refractory temporal lobe epilepsy and normal MRI. Seizure 2000;9:407–411 [DOI] [PubMed] [Google Scholar]
- 4.Radhakrishnan K, So EL, Silbert PL, et al. Predictors of outcome of anterior temporal lobectomy for intractable epilepsy. Neurology 1998;51:465–471 [DOI] [PubMed] [Google Scholar]
- 5.Siegel AM, Jobst BC, Thadani VM, et al. Medically intractable, localization-related epilepsy with normal MRI: presurgical evaluation and surgical outcome in 43 patients. Epilepsia 2001;42:883–888 [DOI] [PubMed] [Google Scholar]
- 6.Chapman K, Wyllie E, Najm I, et al. Seizure outcome after epilepsy surgery in patients with normal preoperative MRI. J Neurol Neurosurg Psychiatry 2005;76:710–713 [DOI] [PMC free article] [PubMed] [Google Scholar]
- 7.Lee SK, Lee SY, Kim KK, Hong KS, Lee DS, Chung CK. Surgical outcome and prognostic factors of cryptogenic neocortical epilepsy. Ann Neurol 2005;58:525–532 [DOI] [PubMed] [Google Scholar]
- 8.Bell ML, Rao S, So EL, et al. Epilepsy surgery outcomes in temporal lobe epilepsy with a normal MRI. Epilepsia 2009;50:2053–2060 [DOI] [PMC free article] [PubMed] [Google Scholar]
- 9.Jeha LE, Najm I, Bingaman W, Dinner D, Widdess-Walsh P, Lüders H. Surgical outcome and prognostic factors of frontal lobe epilepsy surgery. Brain 2007;130:574–584 [DOI] [PubMed] [Google Scholar]
- 10.Noe KH, Sulc V, Wong-Kisiel L, et al. Long term outcomes in nonlesional extratemporal lobe epilepsy surgery. JAMA Neurol 2013;70:1003–1008 [DOI] [PMC free article] [PubMed] [Google Scholar]
- 11.O’Brien TJ, So EL, Mullan BP, et al. Subtraction peri-ictal SPECT is predictive of extratemporal epilepsy surgery outcome. Neurology 2000;55:1668–1677 [DOI] [PubMed] [Google Scholar]
- 12.Cascino GD, Buchhalter JR, Mullan BP, So EL. Ictal SPECT in nonlesional extratemporal epilepsy. Epilepsia 2004;45(suppl 4):32–34 [DOI] [PubMed] [Google Scholar]
- 13.Tan KM, Britton JW, Buchhalter JR, et al. Influence of subtraction ictal SPECT on surgical management in focal epilepsy of indeterminate localization: a prospective study. Epilepsy Res 2008;82:190–193 [DOI] [PubMed] [Google Scholar]
- 14.Friston KJ, Holmes AP, Worsley KJ, Poline JP, Frith CD, Frackowiak RSJ. Statistical parametric maps in functional imaging: a general linear approach. Hum Brain Mapp 1994;2:189–210 [Google Scholar]
- 15.Brinkmann BH, O'Brien TJ, Webster DB, Mullan BP, Robins PD, Robb RA. Voxel significance mapping using local image variances in subtraction ictal SPET. Nucl Med Commun 2000;21:545–551 [DOI] [PubMed] [Google Scholar]
- 16.Chang DJ, Zubal IG, Gottschalk C, et al. Comparison of statistical parametric mapping and SPECT difference imaging in patients with temporal lobe epilepsy. Epilepsia 2002;43:68–74 [DOI] [PubMed] [Google Scholar]
- 17.McNally KA, Paige AL, Varghese G, et al. Localizing value of ictal-interictal SPECT analyzed by SPM (ISAS). Epilepsia 2005;46:1450–1464 [DOI] [PubMed] [Google Scholar]
- 18.Kazemi NJ, Worrell GA, Stead SM, et al. Ictal SPECT statistical parametric mapping in temporal lobe epilepsy surgery. Neurology 2010;74:70–76 [DOI] [PMC free article] [PubMed] [Google Scholar]
- 19.O'Brien TJ, So EL, Mullan BP, et al. Subtraction ictal SPECT co-registered to MRI improves clinical usefulness of SPECT in localizing the surgical seizure focus. Neurology 1998;50:445–454 [DOI] [PubMed] [Google Scholar]
- 20.Landis JR, Koch GG. The measurement of observer agreement for categorical data. Biometrics 1977;33:159–174 [PubMed] [Google Scholar]
- 21.Krsek P, Kudr M, Jahodova A, et al. Localizing value of ictal SPECT is comparable to MRI and EEG in children with focal cortical dysplasia. Epilepsia 2013;54:351–358 [DOI] [PubMed] [Google Scholar]
- 22.Knowlton RC, Elgavish RA, Bartolucci A, et al. Functional imaging: II: prediction of epilepsy surgery outcome. Ann Neurol 2008;64:35–41 [DOI] [PubMed] [Google Scholar]
- 23.Lee JD, Kim HJ, Lee BI, Kim OJ, Jeon TJ, Kim MJ. Evaluation of ictal brain SPET using statistical parametric mapping in temporal lobe epilepsy. Eur J Nucl Med Mol Imaging 2000;27:1658–1665 [DOI] [PubMed] [Google Scholar]
- 24.Newton MR, Berkovic SF, Austin MC, Rowe CC, McKay WJ, Bladin PF. Postictal switch in blood flow distribution and temporal lobe seizures. J Neurol Neurosurg Psychiatry 1992;55:891–894 [DOI] [PMC free article] [PubMed] [Google Scholar]
- 25.Zubal IG, Spencer SS, Imam K, et al. Difference images calculated from ictal and interictal technetium-99m-HMPAO SPECT scans of epilepsy. J Nucl Med 1995;36:684–689 [PubMed] [Google Scholar]
- 26.Knowlton RC, Elgavish RA, Limdi N, et al. Functional imaging: I: relative predictive value of intracranial electroencephalography. Ann Neurol 2008;64:25–34 [DOI] [PubMed] [Google Scholar]
- 27.Weil S, Noachtar S, Arnold S. Ictal ECD-SPECT differentiates between temporal and extratemporal epilepsy: confirmation by excellent postoperative seizure control. Nucl Med 2001;22:233–237 [DOI] [PubMed] [Google Scholar]
- 28.Won HJ, Chang KH, Cheon JE, et al. Comparison of MR imaging with PET and ictal SPECT in 118 patients with intractable epilepsy. AJNR Am J Neuroradiol 1999;20:593–599 [PMC free article] [PubMed] [Google Scholar]
- 29.Hwang SI, Kim JH, Park SW, et al. Comparative analysis of MR imaging, positron emission tomography, and ictal single-photon emission CT in patients with neocortical epilepsy. AJNR Am J Neuroradiol 2001;22:937–946 [PMC free article] [PubMed] [Google Scholar]
- 30.Meyer PT, Cortés-Blanco A, Pourdehnad M, et al. Inter-modality comparisons of seizure focus lateralization in complex partial seizures. Eur J Nucl Med 2001;28:1529–1540 [DOI] [PubMed] [Google Scholar]
- 31.Spencer SS. The relative contributions of MRI, SPECT, and PET imaging in epilepsy. Epilepsia 1994;35(suppl 6):S72–S89 [DOI] [PubMed] [Google Scholar]
- 32.Scheinost D, Teisseyre TZ, Distasio M, DeSalvo MN, Papademetris X, Blumenfeld H. New open-source ictal SPECT analysis method implemented in BioImage Suite. Epilepsia 2010;51:703–707 [DOI] [PMC free article] [PubMed] [Google Scholar]
- 33.Newey CR, Wong C, Wang ZI, Chen X, Wu G, Alexopoulos AV. Optimizing SPECT SISCOM analysis to localize seizure-onset zone by using varying z scores. Epilepsia 2013;54:793–800 [DOI] [PubMed] [Google Scholar]
Associated Data
This section collects any data citations, data availability statements, or supplementary materials included in this article.


