

Abstract
Although significant progress has recently been made towards realizing the goal of direct nanopore based DNA sequencing [1], there are still numerous hurdles that need to be overcome. One such hurdle associated with the use of the biological nanopore α-hemolysin (αHL) is the fact that the wild type channel contains three very distinct recognition or sensing regions within the β-barrel [2, 3], making identification of the bases residing within or moving through the pore very difficult. Through site directed mutagenesis, we have been able to selectively remove one of two sensing regions while simultaneously enhancing the third. Our approach has led to the creation of αHL pores containing single sensing zones and provides the basis for engineering αHL pores suitable for direct DNA sequencing.
Keywords: Nanopore, DNA sequencing, alpha-Hemolysin, site directed mutagenesis, sensing zone
INTRODUCTION
The general concept of using a nanopore for DNA sequencing is to electrophoretically drive single stranded DNA (ssDNA) through the nanopore under aqueous conditions and identify each individual nucleotide (nt) of the polymer as it passes through the sensing region of the pore based on the characteristic current modulation of each nucleotide [4-6]. The potential advantage of this approach relative to current sequencing-by-synthesis methods, besides a much more direct methodology, is an inherent capability to perform very long bidirectional reads for true de-novo sequencing [5]. In addition, due to the fact that the technique operates on the single nucleotide level, nanopores will require little to no DNA amplification depending on initial sample quantity. However, in order to make nanopore based sequencing a reality, various challenges must be overcome [5]. More specifically, the following areas need to be addressed: the nanopore must contain a single sensing region capable of distinguishing between only a few nucleotides at a time [7, 8], with single nucleotide resolution being preferable [1, 5]; a method must be developed to slow down the rate of translocation through the nanopore (freely translocating ssDNA typically translocates αHL at a rate of 1-20 μs/nt under a potential of ~100 mv) [4, 5, 9-13], such that the base-to-base transitions are identifiable at a given bandwidth [5, 14]; and lastly, a method of accounting for the inherent insertion and deletion errors associated with back stepping (i.e. counting a base twice) or forward jumping (i.e. skipping a base), respectively, as the DNA molecule translocates the nanopore needs to be developed.
Recently, Manrao et al. demonstrated the ability to read DNA at single nucleotide resolution with a mutant mycobacterium smegmatis porin A (MspA) nanopore [1], focusing on the strategy of slowing the DNA translocation rate. In their work they utilized MspA, due to its inherently single sharp sensing region that is capable of discriminating between approximately 3 to 4 nucleotides at a time [9], in combination with phi29 DNA polymerase [14, 15], a protein that incorporates a single nucleotide onto single stranded DNA and in turn ratchets ssDNA up through the MspA pore at a rate of approximately 28 ms/nt [1, 14]. Here however, we demonstrate the ability to solve a perceived issue with the biologic pore αHL, that being that the β-barrel is too long and contains multiple sensing regions, making it non-ideal for direct DNA sequencing [2, 3, 7, 9, 16]. Using site directed mutagenesis, we demonstrate for the first time the ability to remove specific sensing regions from within the wild type αHL (wt-αHL) pore and create a single, relatively narrow, sensing region within a mutant αHL pore that is capable of resolving the differences in current blockades associated with all four nucleotides.
Due to the fact that ssDNA translocates the wt-αHL pore at a fast rate, as described above, it is beneficial to hold the ssDNA within the pore to fully characterize the DNA-nanopore interaction and determine how and where nucleotide differentiation is occurring. In 2000, Henrickson et al. demonstrated that a biotin (BTN) and streptavidin capped ssDNA molecule could be driven into an αHL pore and electrostatically trapped at voltages above 70 mV [17], as depicted in Figure 1A. Since then, various groups have used immobilization techniques to hold a ssDNA molecule within an αHL pore and measure to what extent and where nucleotide differentiation is occurring at a resolution not previously obtained during translocation experiments. In 2005, Ashkenasy et al. demonstrated that when ssDNA is held within an αHL pore, via a hairpin, two bases could be distinguished from one another at a specific location within the pore [18]. In 2009, Stoddart et al. used both homooligomeric and heterooligomeric DNA, held within the αHL pore by a BTN/streptavidin cap, to map the profile of the αHL pore, demonstrating that wt-αHL contains three distinct recognition sites that can be used to identify all four DNA bases [2]. They also demonstrated that site directed mutagenesis of residues within these recognition sites could alter the resolution or current levels associated with a specific nucleotide residing within one of these sites. That same year, Purnell et al. performed a similar measurement on wt-αHL with a single adenine, cytosine, or guanine nucleotide moved down through a thymine 40-mer strand [16]. While the results were not identical to Stoddart’s, the presence of multiple localized sensing zones in the wt-αHL pore were observed. Also in 2009, Gyarfas et al. used the Klenow fragment of the Escherichia coli DNA polymerase I (KF) to hold a ssDNA fragment within the wt-αHL pore and effectively mapped the β-barrel of the pore using a sequence of three consecutive abasic sites contained in their ssDNA fragment [19]. More recently, Stoddart et al. used BTN/streptavidin capped ssDNA to examine how base resolution is affected in the primary sensing zone, or the first recognition site, of αHL by modifying the M113 residue in this zone to sixteen different amino acids [3], further demonstrating that nucleotide resolution or contrast could be altered by altering the identity of specific amino acids in the pore.
Figure 1.
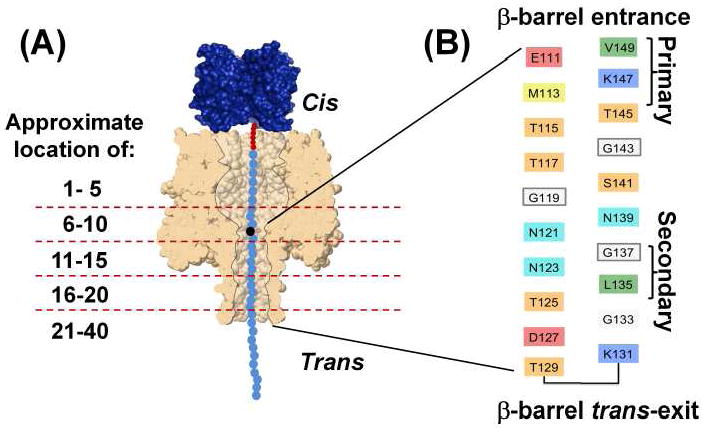
(A) Immobilization of a ssDNA heteropolymer with a BTN/streptavidin cap within an αHL pore. The dashed red lines depict the approximate distance, in terms of the number of nucleotides, from the BTN linker. (B) The individual amino acids associated with the β-barrel of the αHL pore [29], with the primary and secondary sensing regions labeled.
In this study, we examine where nucleotide differentiation is occurring in the β-barrel of engineered αHL pores using a 5’ biotinylated ssDNA template, with a free 3’ terminus. The ssDNA contains a single adenine (A), thymine (T), or guanine (G) within a polycytosine background, poly(dC)39Xn, where X is the identity of the single substitution and n is its position from the 5’-BTN/streptavidin cap, as depicted in Figure 2A. The single base substitution was moved from position n=6 to n=22 to fully map the β-barrel profile. In these experiments, our DNA strand was allowed to complex with streptavidin prior to detection. The streptavidin-complexed ssDNA was then electrophoretically driven into the αHL and trapped, resulting in a stable blocking current, as shown in Figure 2B. The voltage used to drive the DNA into the pore (-120 mV) was then inverted (+120 mV), releasing the DNA molecule back into bulk solution. All experiments were carried out in 3 M NaCl, 10 mM Tris-HCl (pH 7.2), 1 mM EDTA at 20 ± 0.5 °C. By repeatedly capturing and releasing DNA molecules hundreds of times, blocking current histograms specific to the captured DNA molecule were created. Systematically moving the position of the single substitution site along the strand relative to the 5’ terminus and comparing the residual current difference to that of the homooligomeric background, (poly(dC)40), produced a profile map of the αHL pore. This methodology was used to map wt-αHL and engineered αHL pores.
Figure 2.

(A) The chemical structure of the ssDNA oligomers used in this study, where X is a single adenine [A], thymine [T], or guanine [G] nucleotide. (B) Representative plot of current as a function of time trace, illustrating the capture and subsequent release of a ssDNA oligomer.
1. EXPERIMENTAL
1.1 Chemicals and Materials
NaCl (Alpha Aesar), tris (Sigma), HCl (Alpha Aesar), EDTA (Sigma), and streptavidin (Sigma) were used as received. Wild-type α-hemolysin (wt-αHL) (lyophilized powder, monomer, List Laboratories) was diluted in H2O. 1,2-diphytanoyl-sn-glycero-3-phosphocholine (DPhPC) (Avanti) was obtained in powdered form and diluted to a concentration of 5 mg/ml in decane (Aldrich). All solutions were prepared using H2O (18 MΩ•cm) from a Barnstead E-pure water purification system.
PAGE purified DNA: 5’-BTN-TEG-C40-3’ (poly(dC)40), 5’-BTN-TEG-C39Xn-3’ (poly(dC)39Xn), where X is adenine, thymine, or guanine (Gene Link), were obtained at 20 μM in 10 mM Tris (pH 8.5), 1 mM EDTA. Before each experiment, DNA samples were mixed with 100 μM streptavidin in 10 mM Tris-HCl (pH 7.2), 1 mM EDTA solution at a 2 to 1 ratio (by volume) and allowed to sit at room temperature for 10 minutes.
1.2 Protein Production
A wt-αHL gene sequence (GenBank ID M90536.1) was synthesized and sub-cloned into a pET15b vector for expression. Mutants E111S/M113S/T145S/K147S (4S) L135I, 4S L135I T125N, and 4S L135I D127K were generated by site directed mutagenesis using the pET15b-wt-αHL vector as a template. These were transformed into appropriate E. coli cells and amplified to obtain SC Grade (≥ 95% supercoiled, ≤ 0.03 EU/μg endotoxin) quality plasmids. All gene synthesis, cloning, site directed mutagenesis and plasmid amplification steps were performed by GenScript USA, Inc. In addition, GenScript USA, Inc. verified sequences of all mutant genes.
Proteins were expressed by a coupled in-vitro transcription and translation (IVTT) reaction using an E. Coli T7 S30 extract (Promega) supplemented with [S35]-Methionine (American Radiolabeled Chemicals) and incubated at 37 °C to initiate IVTT reactions. Rabbit red blood cell membranes (rRBCM), prepared by washing and lysis of heparin-stabilized rabbit red blood cells (Hemostat Inc.), were added to the IVTT mix after an hour and the resulting mixture was incubated for an additional 2 hours at 37 °C to allow heptameric αHL pores to form. Reactions were stopped by incubation on ice for 10 minutes. Following incubation, the solution was spun at 25,000 g and the resulting pellet was solubilized in SDS buffer and loaded onto a 6% SDS-PAGE gel for overnight separation at 50 V. Resulting gels were vacuum dried at 50 °C and then exposed to radiography film (Kodak) overnight at -80 °C. After development, the film was overlaid on the dried gel to identify and excise sections of the gel containing the αHL heptamers. Excised gel pieces were rehydrated in a Tris-glycine buffer, pH 8.8, and the protein was recovered using a Whatman Elutrapelectroelution system (GE Healthcare). Electroeluted proteins were buffer exchanged into deionized water and concentrated using an Amicon Ultra centrifugal filter (Millipore). Aliquots of concentrated proteins were stored at -80 °C until use.
1.3 Glass Nanopore Membranes
The fabrication of the glass nanopore membranes (GNMs), which consists of a single conical nanopore embedded in a thin glass membrane, has previously been reported [20-24]. Briefly, the GNM is fabricated by flame sealing the tip (~25-75 μm) of an electrochemically sharpened Pt wire into the end of a glass capillary using a H2 torch. The sealed end of the glass capillary is then polished until a Pt electrode of a desired diameter is exposed. The Pt nanodisk is electrochemically etched in a CaCl2 solution that loosens the sealed Pt inside the glass. The remaining Pt is physically removed from the glass, leaving a single conical shaped nanopore.
Prior to using the GNM as a support platform for lipid bilayers, the surface of the GNMs are chemically modified with 3-cyanopropyldimethylchlorosilane (Gelest, Inc.) [22]. This surface modification allows the deposition of a lipid monolayer on the glass surface where the hydrophobic alkyl chain tails of the lipid are oriented in a tails down configuration.
1.4 Experimental Setup and Data Analysis
The use of GNMs for holding PLBs and single αHL pores has previously been described [22-25]. DC current through the αHL pores was measured using a custom built high impedance, low noise amplifier and instrumentation. All experiments were carried out in 3 M NaCl, 10 mM Tris-HCl (pH 7.2), 1 mM EDTA at room temperature (20 ± 0.5 °C). Data were collected at an acquisition rate of 1.25 MHz and then digitally low pass filtered to a cutoff frequency of 10 kHz followed by resampling at 50 kHz.
Upon bilayer formation across the aperture of the GNM via the solution raise method or painting, αHL samples were added to the cell (outside of the GNM) to a final concentration of ~50 nM. Once a single channel insertion was obtained, the first DNA sample was added to the cell to a final concentration of ~0.35 μM. A DC bias of -120 mV, relative to the electrode inside of the GNM, was then applied in order to drive the DNA molecules into the αHL pore. Once captured, as denoted by at least an ~65% drop in the open channel current, the DNA molecule was held within the αHL pore for ~1 s before the applied DC bias was inverted to +120 mV for ~200 ms in order to release the DNA from the pore. After which, the applied bias was inverted back to -120 mV in order to reset the capture experiment. The current levels, applied bias and current as a function of time data were monitored, controlled and collected, respectively, via custom LabView (National Instruments) software. After acquiring a minimum of 200 capture events, a second DNA sample was added to the cell followed by further data collection. This process could be repeated with up to 5 different DNA samples being examined at the same time. In all experiments, the background DNA molecule (i.e. poly(dC)40) was added first in order to have a reference blocking level with which the other DNA molecules (i.e. poly(dC)39Xn) could be compared. Data analysis was performed using custom Python software.
2. RESULTS AND DISCUSSION
2.1 Wt-αHL Mapping
In order to acquire a standard against which the effects of site directed mutagenesis could be compared, wt-αHL was initially mapped. Figure 3 shows the wt-αHL map (red traces) associated with moving a single adenine down through a DNA strand consisting of 39 cytosines, poly(dC)39An,. In this figure, negative and positive values correspond to more or less blocking, respectively, by the poly(dC)39An heterooligomer relative to the poly(dC)40 homooligomer background. This mapping profile resembles the wt-αHL mapping results originally reported by Stoddart et al [2]. Slight differences in our results are primarily due to a reversal in the DNA orientation, 3’ entry in our case and 5’ entry in the case of theirs. The blocking levels and associated interactions of ss-DNA with a nanopore have previously been shown to be highly sensitive to the orientation of the nucleotides within the pore [9, 26-28]. 3’ entry was used in this work because this orientation preferentially enters the pore over 5’ entry in freely translocating DNA experiments conducted at approximately -120 mV and 20 °C [26-28], thus producing mapping profiles potentially more indicative of to what extent and where nucleotide differentiation is occurring during freely translocating DNA sequencing experiments.
Figure 3.
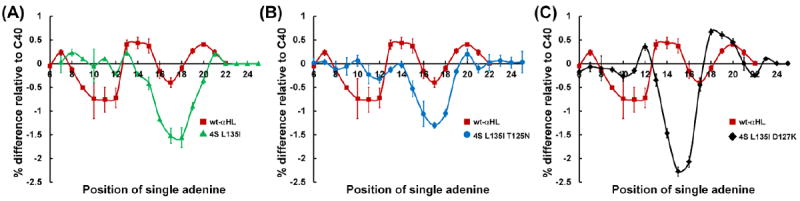
Blocking current difference between a cytosine heteropolymer containing a single adenine substitution, poly(dC)39An, and a cytosine homopolymer, poly(dC)40, plotted as a function of the position (n) of the single adenine substitution. (A) Blocking current map for the 4S L135I mutant and wt-αHL. (B) Blocking current map for the 4S L135I T125N mutant and wt-αHL. (C) Blocking current map for the 4S L135I D127K mutant and wt-αHL.
In the mapping profiles presented here, blocking percentages are based on a normalized residual current (i.e. the residual blocking current level divided by the open channel current) as opposed to the actual blocking currents due to variations between experimental setups and protein pores. Further, this normalization eliminates conductance variations due to small differences in electrolyte concentration and temperature. Even when accounting for these small changes in conductance due to temperature and electrolyte concentration, the open channel current has been found to vary between individual protein pores with the same nominal composition and structure. Open channel current values of -210 pA ± 3 pA for the wt-αHL protein were measured during the course of this work.
Our wt-αHL mapping profile contains multiple peaks located at positions n=11, 14, 17, and 20, known here as the primary, secondary, and trans-exit sensing regions. The primary constriction or sensing zone located at position 11, originally described by Song et al. [29], is located approximately mid-way through the αHL pore where the β-barrel meets the cap and consists of residues E111, K147, and M113 [2, 3, 29, 30], as shown in Figure 1B. The secondary constriction, located approximately midway through the β-barrel (n= 14) is thought to be most closely associated with residue L135 [2, 3, 30]. The trans-exit sensing region (n= 17 to 20) is likely associated with the final 5 or so residues located at the trans-exit. Interestingly, the contrast between adenine and cytosine associated with the peaks located at positions 14 and 20 are inverted relative to positions 11 and 17 even though adenine is larger than cytosine. These results suggest that volumetric changes in the pore profile are clearly not the only factor controlling current contrast between bases. It is likely that dipole-dipole interactions and Van der Waals forces between the DNA molecule and the walls of the αHL pore have a significant effect on the contrast obtained between bases.
2.2 Mutant Mapping
One of the long standing goals of nanopore based DNA sequencing is to create a nanopore that contains a single sharp sensing zone that is approximately one nucleotide in width [5]. Unfortunately, as detailed above, the wt-αHL pore has a geometry that is not optimal. In order to create an αHL pore with a more ideal sensing zone, we examined the effect of altering the known residues associated with the primary (E111, K147, and M113) and secondary (L135) constriction via site directed mutagenesis. The ability to remove the primary constriction of the αHL pore, while at the same time enhancing the secondary sensing zone, is depicted in Figure 3A, 3B, and 3C. Here, the poly(dC)39An mapping profiles for three different mutant pores, 4S L135I, 4S L135I T125N, and 4S L135I D127K, where the “4S” nomenclature represents the mutations associated with converting all three residues associated with the primary constriction (E111, K147, and M113) along with the neighboring T145 residue to the smallest polar residue, serine (S), are shown relative to wt-αHL. In addition, the nonpolar leucine (L) located at position 135, known to be associated with the secondary constriction, was changed to the larger nonpolar isoleucine (I), effectively enhancing the secondary constriction in all three mutants. In the 4S L135I T125N, mutant the threonine (T) residue, located immediately below L135I, was converted to the larger polar asparagine (N). This modification should slightly narrow the constriction, as is depicted, and will affect hydrogen bonding with the DNA strand. In the 4S L135I D127K mutant, the negatively charged aspartic acid (D), located three amino acids from the trans-exit of the β-barrel, was converted to a positively charged lysine (K).
In the mapping profile of the 4S L135I D127K mutant, the newly enhanced sensing region appears to shift towards the 5’ BTN containing terminus of the DNA strand or cis entrance of the pore relative to the 4S L135I and 4S L135I T125N mutations. This shift is likely due to an increase in the inter-nucleotide distance of the ssDNA in the 4S L135I D127K pore. In these profile maps, we are using the flexible DNA strand as our “ruler,” and as such, any modifications to the pore that stretch or compress the DNA strand will thus affect the obtained mapping profile. Because the 4S L135I and 4S L135I D127K have the same base mutation, it is likely that their sensing regions are located at the same spot within the pores themselves. However, if the D127K mutation stretched the DNA within the pore, then it is anticipated that the single adenine substitution would enter the sensing region sooner (a lower n position) than without the D127K mutation, as is depicted in Figure 3C relative to Figure 3A.
The open channel currents, the poly(dC)40 background blocking levels, and the integrated area under each mapping profile are listed in Table 1, for comparison. The integrated area under each mapping profile provides an assessment of how well the mutant would be able of differentiating between homooligomeric segments (i.e. A vs C), filling the entire sensing region of the pore.
Table 1.
Comparison of mutants mapped.
| Mutant | -Iopen (pA) | +Iopen (pA) | 3’ poly(dC)40 blocking level (pA) |
|
|
|---|---|---|---|---|---|
| wt-αHL | -210 +/- 3 | -189 +/- 2 | -30 +/- 3 | -1.2% | |
| 4S L135I | -255 +/- 3 | -266 +/- 3 | -71 +/- 2 | -5.5% | |
| 4S L135I T125N | -260 +/- 4 | -270 +/- 5 | -73 +/- 3 | -4.7% | |
| 4S L135I D127K | -237 +/- 4 | -274 +/- 5 | -44 +/- 3 | -5.6% |
2.3 Mapping A, C, G and T Contrast
An important aspect of direct nanopore based DNA sequencing is that the bases need to be identified at the same location within the pore. If adenine was differentiated from cytosine at one location due to specific nanopore/nucleotide interactions and guanine was differentiated from cytosine at a different sensing zone due to different nanopore/nucleotide interactions, direct readout of the bases as they pass through the pore sequentially would be hopelessly complex. A demonstration that A, T, and G are all identified within the same sensing region of the 4S L135I D127K mutant is shown in Figure 4. These mapping profiles were obtained by systematically moving a single A, T, or G down through a C background, i.e. poly(dC)39Xn, as described above. As is depicted, each mapping profile contains a sharp peak at position 15, demonstrating that all four nucleotides are differentiated at the same location within the pore, when they are contained within the same background context. Unfortunately, in the G mapping profile there is significant discrimination of the single G near the trans-exit, illustrated by the peak in the G in C mapping profile at position 18. Efforts are currently underway to eliminate this region so that nucleotide differentiation occurs at only one location within the pore. The integrated areas under the A, T, and G mapping profiles are -5.6%, -1.8%, and -1.2%, respectively.
Figure 4.

Blocking current difference between a cytosine heteropolymer containing a single adenine, poly(dC)39An (A in C), thymine, poly(dC)39Tn (T in C), or guanine, poly(dC)39Gn (G in C), substitution and a cytosine homopolymer, poly(dC)40, plotted as a function of the position of the single substitution, for the 4S L135I D127K mutant.
3. CONCLUSIONS
The studies presented here have confirmed that wt-αHL has a non-ideal and complex sensing region that is composed of multiple sensing zones, as previously demonstrated [2, 3, 16]. This complex sensing region appears to span the complete length of the β-barrel of the pore (from position n=7 to n=22) as depicted in Figure 3A. Assuming an internucleotide distance of 0.4 nm [23, 31, 32], the results yield a barrel length of ~ 6 nm, which is consistent with crystallographic measurements of the pore [29]. As alluded to above, this estimated sensing region length is highly dependent on the stretching and compression of DNA within the pore and is thus only used for a qualitative comparison. While the perception to date has been that this complex sensing region makes the pore non-ideal for direct DNA sequencing applications [2, 3, 7, 9, 16], by making a few, fairly simple mutations to αHL, we have demonstrated the ability to create a single, relatively narrow, sensing region within the pore. Based on the mapping profiles of the 4S L135I, 4S L135I T125N, and 4S L135I D127K mutants, shown in Figure 3A, B, and C respectively, we have effectively decreased the length of the αHL sensing region to ~ 1.6 ± 0.4 nm, based on it spanning 3 to 5 positions. This sensing region is comparable in length to that found in the MspA pore, 4 nucleotides [9], which superficially appears to have a much narrower physical constriction [1]. Furthermore, the blockade currents associated with these new mutant αHL pores are dependent on the identity of the base residing within the sensing region. The work presented here, along with experiments currently underway, should prove integral in creating a class of mutant αHL pores capable of direct DNA sequencing and provide a foundation for future engineering strategies.
Acknowledgments
This work was supported by NIH grant 1R01HG005095 and DHS grant HSHQDC-09-C-0009
References
- 1.Manrao EA, Derrington IM, Laszlo AH, Langford KW, Hopper MK, Gillgren N, Pavlenok M, Niederweis M, Gundlach JH. Reading DNA at single-nucleotide resolution with a mutant MspA nanopore and phi29 DNA polymerase. Nat Biotechnol. 2012;30:349–353. doi: 10.1038/nbt.2171. [DOI] [PMC free article] [PubMed] [Google Scholar]
- 2.Stoddart D, Heron AJ, Mikhailova E, Maglia G, Bayley H. Single-nucleotide discrimination in immobilized DNA oligonucleotides with a biological nanopore. Proc Natl Acad Sci U S A. 2009;106:7702–7707. doi: 10.1073/pnas.0901054106. [DOI] [PMC free article] [PubMed] [Google Scholar]
- 3.Stoddart D, Heron AJ, Klingelhoefer J, Mikhailova E, Maglia G, Bayley H. Nucleobase Recognition in ssDNA at the Central Constriction of the α-Hemolysin Pore. Nano lett. 2010:3633–3637. doi: 10.1021/nl101955a. [DOI] [PMC free article] [PubMed] [Google Scholar]
- 4.Kasianowicz JJ, Brandin E, Branton D, Deamer DW. Characterization of individual polynucleotide molecules using a membrane channel. Proc Natl Acad Sci U S A. 1996;93:13770–13773. doi: 10.1073/pnas.93.24.13770. [DOI] [PMC free article] [PubMed] [Google Scholar]
- 5.Branton D, Deamer DW, Marziali A, Bayley H, Benner SA, Butler T, Di Ventra M, Garaj S, Hibbs A, Huang X. The potential and challenges of nanopore sequencing. Nat Biotechnol. 2008;26:1146–1153. doi: 10.1038/nbt.1495. [DOI] [PMC free article] [PubMed] [Google Scholar]
- 6.Deamer DW, Akeson M. Nanopores and nucleic acids: prospects for ultrarapid sequencing. Trends in Biotechnology. 2000;18:147–151. doi: 10.1016/s0167-7799(00)01426-8. [DOI] [PubMed] [Google Scholar]
- 7.Venta K, Shemer G, Puster M, Rodriguez-Manzo JA, Balan A, Rosenstein JK, Shepard K, Drndic M. Differentiation of Short Single-Stranded DNA Homopolymers in Solid-State Nanopores. ACS nano. 2013;7:4629–4636. doi: 10.1021/nn4014388. [DOI] [PMC free article] [PubMed] [Google Scholar]
- 8.Timp W, Comer J, Aksimentiev A. DNA Base-Calling from a Nanoproe Using a Viterbi Algorithm. Biophys J. 2012;102:L37–L39. doi: 10.1016/j.bpj.2012.04.009. [DOI] [PMC free article] [PubMed] [Google Scholar]
- 9.Manrao EA, Derrington IM, Pavlenok M, Niederweis M, Gundlach JH. Nucleotide discrimination with DNA immobilized in the MspA nanopore. PLoS One. 2011;6:e25723. doi: 10.1371/journal.pone.0025723. [DOI] [PMC free article] [PubMed] [Google Scholar]
- 10.Meller A, Nivon L, Brandin E, Golovchenko J, Branton D. Rapid nanopore discrimination between single polynucleotide molecules. Proc Natl Acad Sci U S A. 2000;97:1079–1084. doi: 10.1073/pnas.97.3.1079. [DOI] [PMC free article] [PubMed] [Google Scholar]
- 11.Meller A. Dynamics of polynucleotide transport through nanometre-scale pores. J Phys : Condens Matter. 2003;15:R581. [Google Scholar]
- 12.Meller A, Nivon L, Branton D. Voltage-driven DNA translocations through a nanopore. Phys rev lett. 2001;86:3435–3438. doi: 10.1103/PhysRevLett.86.3435. [DOI] [PubMed] [Google Scholar]
- 13.Deamer DW, Branton D. Characterization of nucleic acids by nanopore analysis. Acc Chem Res. 2002;35:817–825. doi: 10.1021/ar000138m. [DOI] [PubMed] [Google Scholar]
- 14.Cherf GM, Lieberman KR, Rashid H, Lam CE, Karplus K, Akeson M. Automated forward and reverse ratcheting of DNA in a nanopore at 5-A precision. Nat Biotechnol. 2012;30:344–348. doi: 10.1038/nbt.2147. [DOI] [PMC free article] [PubMed] [Google Scholar]
- 15.Lieberman KR, Cherf GM, Doody MJ, Olasagasti F, Kolodji Y, Akeson M. Processive replication of single DNA molecules in a nanopore catalyzed by phi29 DNA polymerase. J Am Chem Soc. 2010;132:17961–17972. doi: 10.1021/ja1087612. [DOI] [PMC free article] [PubMed] [Google Scholar]
- 16.Purnell RF, Mehta KK, Schmidt JJ. Nucleotide identification and orientation discrimination of DNA homopolymers immobilized in a protein nanopore. Nano lett. 2008;8:3029–3034. doi: 10.1021/nl802312f. [DOI] [PubMed] [Google Scholar]
- 17.Henrickson SE, Misakian M, Robertson B, Kasianowicz JJ. Driven DNA transport into an asymmetric nanometer-scale pore. Phys rev lett. 2000;85:3057–3060. doi: 10.1103/PhysRevLett.85.3057. [DOI] [PubMed] [Google Scholar]
- 18.Ashkenasy N, Sanchez-Quesada J, Bayley H, Ghadiri MR. Recognizing a single base in an individual DNA strand: a step toward DNA sequencing in nanopores. Angew Chem Int Ed. 2005;117:1425–1428. doi: 10.1002/anie.200462114. [DOI] [PMC free article] [PubMed] [Google Scholar]
- 19.Gyarfas B, Olasagasti F, Benner S, Garalde D, Lieberman KR, Akeson M. Mapping the Position of DNA Polymerase-Bound DNA Templates in a Nanopore at 5 Å Resolution. ACS nano. 2009;3:1457–1466. doi: 10.1021/nn900303g. [DOI] [PubMed] [Google Scholar]
- 20.Zhang B, Galusha J, Shiozawa PG, Wang G, Bergren AJ, Jones RM, White RJ, Ervin EN, Cauley CC, White HS. Bench-Top Method for Fabricating Glass-Sealed Nanodisk Electrodes, Glass Nanopore Electrodes, and Glass Nanopore Membranes of Controlled Size. Anal Chem. 2007;79:4778–4787. doi: 10.1021/ac070609j. [DOI] [PubMed] [Google Scholar]
- 21.White RJ, Zhang B, Daniel S, Tang JM, Ervin EN, Cremer PS, White HS. Ionic Conductivity of the Aqueous Layer Separating a Lipid Bilayer Membrane and a Glass Support. Langmuir. 2006;22:10777–10783. doi: 10.1021/la061457a. [DOI] [PubMed] [Google Scholar]
- 22.White RJ, Ervin EN, Yang T, Chen X, Daniel S, Cremer PS, White HS. Single Ion-Channel Recordings Using Glass Nanopore Membranes. J Am Chem Soc. 2007;129:11766–11775. doi: 10.1021/ja073174q. [DOI] [PubMed] [Google Scholar]
- 23.Ervin EN, Kawano R, White RJ, White HS. Simultaneous Alternating and Direct Current Readout of Protein Ion Channel Blocking Events Using Glass Nanopore Membranes. Anal Chem. 2008;80:2069–2076. doi: 10.1021/ac7021103. [DOI] [PubMed] [Google Scholar]
- 24.Lathrop DK, Ervin EN, Barrall GA, Keehan MG, Kawano R, Krupka MA, White HS, Hibbs AH. Monitoring the Escape of DNA from a Nanopore Using an Alternating Current Signal. J Am Chem Soc. 2009;132:1878–1885. doi: 10.1021/ja906951g. [DOI] [PMC free article] [PubMed] [Google Scholar]
- 25.Schibel AEP, An N, Jin Q, Fleming AM, Burrows CJ, White HS. Nanopore Detection of 8-Oxo-7, 8-dihydro-2 -deoxyguanosine in Immobilized Single-Stranded DNA via Adduct Formation to the DNA Damage Site. J Am Chem Soc. 2010;132:17992–17995. doi: 10.1021/ja109501x. [DOI] [PMC free article] [PubMed] [Google Scholar]
- 26.Butler TZ, Gundlach JH, Troll M. Ionic Current Blockades from DNA and RNA Molecules in the α-Hemolysin Nanopore. Biophys J. 2007;93:3229–3240. doi: 10.1529/biophysj.107.107003. [DOI] [PMC free article] [PubMed] [Google Scholar]
- 27.Wanunu M, Chakrabarti B, Mathe J, Nelson DR, Meller A. Orientation-dependent interactions of DNA with an α-hemolysin channel. Phys Rev E. 2008;77:031904. doi: 10.1103/PhysRevE.77.031904. [DOI] [PubMed] [Google Scholar]
- 28.Mathe J, Aksimentiev A, Nelson DR, Schulten K, Meller A. Orientation discrimination of single-stranded DNA inside the α-hemolysin membrane channel. Proc Natl Acad Sci U S A. 2005;102:12377–12382. doi: 10.1073/pnas.0502947102. [DOI] [PMC free article] [PubMed] [Google Scholar]
- 29.Song L, Hobaugh MR, Shustak C, Cheley S, Bayley H, Gouaux JE. Structure of staphylococcal α-hemolysin, a heptameric transmembrane pore. Science. 1996;274:1859–1865. doi: 10.1126/science.274.5294.1859. [DOI] [PubMed] [Google Scholar]
- 30.Movileanu L, Cheley S, Howorka S, Braha O, Bayley H. Location of a constriction in the lumen of a transmembrane pore by targeted covalent attachment of polymer molecules. J Gen Physiol. 2001;117:239–251. doi: 10.1085/jgp.117.3.239. [DOI] [PMC free article] [PubMed] [Google Scholar]
- 31.Nakane J, Wiggin M, Marziali A. A Nanosensor for Transmembrane Capture and Identification of Single Nucleic Acid Molecules. Biophys J. 2004 Jul 1;87:615–621. doi: 10.1529/biophysj.104.040212. [DOI] [PMC free article] [PubMed] [Google Scholar]
- 32.DeGuzman VS, Lee CC, Deamer DW, Vercoutere WA. Sequence-dependent gating of an ion channel by DNA hairpin molecules. Nucl Acids Res. 2006 Dec 2;34:6425–6437. doi: 10.1093/nar/gkl754. [DOI] [PMC free article] [PubMed] [Google Scholar]