

Abstract
An unstable genome is a hallmark of many cancers. It is unclear, however, whether some mutagenic features driving somatic alterations in cancer are encoded in the genome sequence and whether they can operate in a tissue-specific manner. We performed a genome-wide analysis of 663,446 DNA breakpoints associated with somatic copy-number alterations (SCNAs) from 2,792 cancer samples classified into 26 cancer types. Many SCNA breakpoints are spatially clustered in cancer genomes. We observed a significant enrichment for G-quadruplex sequences (G4s) in the vicinity of SCNA breakpoints and established that SCNAs show a strand bias consistent with G4-mediated structural alterations. Notably, abnormal hypomethylation near G4s-rich regions is a common signature for many SCNA breakpoint hotspots. We propose a mechanistic hypothesis that abnormal hypomethylation in genomic regions enriched for G4s acts as a mutagenic factor driving tissue-specific mutational landscapes in cancer.
Loss of genomic integrity is a common hallmark of cancer genomes1. Recent technological advances have led to several large-scale cancer genome profiling studies2–5 that have identified genome-wide patterns of alterations in many cancer samples. Notably, DNA breakpoints in cancer genomes, and also in the genomes of apparently healthy subjects, are distributed nonrandomly2,5–7, suggesting that some regions within the human genome—so-called breakpoint hotspots—are exquisitely prone to rearrangement of genetic material. Some of these regions are common across many cancer types, whereas others are specific to particular types, indicating that genomic instability may manifest itself differentially in neoplasms of diverse origin.
Many exogenous factors (such as nicotine exposure in lung cancer) and endogenous factors (such as repeat elements) as well as molecular mechanisms can cause double strand breaks and erroneous DNA repair, leading to genomic alterations1,8–10. Under certain circumstances, DNA can adopt non-B conformations, and recently two such secondary structures (H-DNA and Z-DNA) were shown to contribute to DNA damage11–13. Guanine-rich sequences (G3N1–7 G3N1–7G3N1–7G3), which are frequent in the human genome, can adopt four-stranded structures called G-quadruplexes (G4) both in vivo and in vitro14–16. G4 structures obstruct the movement of DNA polymerase17, thereby increasing the risk of DNA breakage or nonallelic homologous recombination. Indeed, G4 structures have been implicated in germline deletion18,19 and recombination20 events. However, the role of G4 structures in genomic instability in cancer has so far not been systematically investigated.
In addition to genetic factors, various epigenetic factors are also associated with genomic instability both during the somatic evolution of cancer21,22 and in germline evolution during speciation23. Moreover, epigenetic patterns differ between cell types and thus possess the potential to generate tissue-specific patterns of alterations. Selective epigenetic states such as CpG methylation interact with G4 (refs. 24-26) and other non-B-DNA structures27,28, potentially interfering with their formation and stability. The D4Z4 region, for instance, which is hypomethylated in some cancer types and hypermethylated in others, contains a sub-region that is resistant to hypermethylation and harbors G4s motifs29. Furthermore, the CpG dinucleotide frequently resides within G4s, whose CpG methylation is usually low—especially at gene promoters, exons and untranslated regions30. These findings raise the possibility that the mutagenic potential of DNA secondary structures may be modulated by epigenetic states.
Here we set out to systematically investigate the role of DNA secondary structures in genomic instability in cancer. We integrated published data on genomic alterations from over 2,700 cancer samples, as well as potentially G-quadruplex-forming sequences (PG4s) and DNA methylation. We propose that hypomethylation and G4 structures together could have a causal role in genomic instability in cancer, thus representing one of the mechanistic bases for tissue-specific mutational landscapes of cancers.
Results
DNA breakpoints in cancer are often clustered in hotspots
We obtained data for 663,446 SCNA breakpoints from Beroukhim et al.2. Although the breakpoints of some SCNAs occur adjacent to known oncogenes and tumor suppressor genes, some SCNAs span tens of kilobases containing multiple genes or gene desert regions. As examples, Figure 1 shows the frequency distributions of SCNA breakpoints around EGFR (Fig. 1a), a gene commonly mutated in many cancer types2, and PAX5 (Fig. 1b), which is altered primarily in acute lymphoblastic leukemia2,31. In some cases, the SCNAs may include additional previously undescribed target genes or functional elements, which are important for tumorigenesis or the development of a precancerous state. However, another and not mutually exclusive scenario is that some regions in the genome are particularly prone to rearrangement of genetic material, leading to the presence of inherent genomic instability in one or more tissue types. In order to investigate the genome-wide distribution of breakpoints, we first divided the cancer genomes into 1-Mb nonoverlapping blocks and determined the number of SCNA breakpoints within each block. We found that 248 of the 3,029 genomic blocks, covering almost 8% of the human genome, were significantly enriched (FDR-corrected P < 0.05) for SCNA breakpoints in cancer (Fig. 1c; see Online Methods). We dubbed these regions breakpoint hotspots. Using cancer type-specific analyses, Beroukhim et al.2 identified 199 frequently altered regions across 3,131 cancer samples, 177 of which shared their boundaries with the breakpoint hotspots we identified (Fig. 1d). Using data from three additional cancer genomes and three personal genomes, we found that many breakpoint hotspots were shared across samples, suggesting that they are perhaps inherently unstable during both somatic and germline evolution (Supplementary Methods and Supplementary Table 1). The observation that the SCNA breakpoints are organized in hotspots led us to investigate whether some genomic properties of those regions drive their instability.
Figure 1.
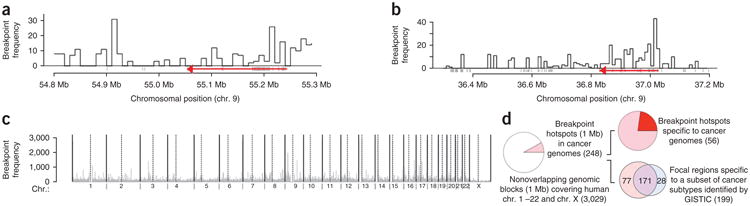
Spatial distribution of breakpoint hotspots in cancer genomes and genomes of healthy human subjects. (a) SCNA breakpoints can occur at high frequencies tens of kilobases away from EGFR (a known cancer gene shared across multiple cancer subtypes), shown in red. The direction of the red arrow shows the direction of transcription of EGFR. (b) SCNA breakpoints can occur at high frequency tens of kilobases away from PAX5 (a known cancer gene specific to acute lymphoblastic leukemia), shown in red. The red arrow shows the direction of transcription of PAX5. (c) SCNA breakpoint densities calculated over 1-Mb nonoverlapping genomic blocks across the human genome. Dotted vertical lines mark centromeres. (d) Summary statistics for SCNA breakpoint hotspots. Frequencies are shown in parentheses.
Breakpoint hotspots are associated with PG4s
To assess whether G4 structures are associated with DNA breakpoints in cancer, we overlaid information about PG4s32–34 with the SCNA breakpoint data and analyzed the joint distribution of PG4s and SCNA breakpoint frequencies within 1-Mb nonoverlapping windows tiling the genome. We found that the breakpoint hotspots were significantly enriched for PG4s (FDR-corrected P = 9.19 × 10⁻⁶, Mann-Whitney test; Table 1, Supplementary Methods and Supplementary Table 2). To evaluate whether this association is independent of other covariates, we overlaid information about other factors, such as repeat sequences35, recombination frequency35 and fragile sites36. We found that the breakpoint hotspots were also enriched for simple repeats, Alu repeats and CR1 repeats35 (FDR-corrected P < 0.005, Mann-Whitney test; Table 1). We also observed that these sites were moderately enriched for sites of frequent recombination (recombination hotspots)35 and common fragile sites36 (FDR-corrected P <0.05, Mann-Whitney test; Table 1). For two of the three personal genomes we analyzed, comprehensive structural variation data was available. When focusing on cancer-only breakpoint hotspots—those for which no structural variation was present in those two personal genomes—we found a significant enrichment for PG4s and a moderate depletion of repeats (Table 1 and Supplementary Methods).
Table 1. Association between genomic features and breakpoint hotspots.
| Genomic features | FDR-corrected P value | |
|---|---|---|
|
| ||
| SCNA breakpoint hotspots in cancera | SCNA breakpoint hotspots occurring only in cancer genomesa | |
| Sequence features | ||
| Common repeats | 3.66 × 10⁻³ | 1.50 × 10⁻² |
| Alu elements | 6.88 × 10⁻² | |
| CR1 elements | 8.96 × 10⁻³ | |
| L1 elements | 3.19 × 10⁻³ | 9.08 × 10⁻³ |
| L2 elements | 4.54 × 10⁻³ | 6.95 × 10⁻² |
| Secondary structure features | ||
| G4 secondary structures | 9.19 × 10⁻⁶ | 4.35 × 10⁻³ |
| DNA breakage and recombination features | ||
| Fragile sites | 3.52 × 10⁻² | |
| Meiotic recombination rate | 1.87 × 10⁻² | |
| Evolutionary features | ||
| 28 way most evolutionarily conserved elements | 2.43 × 10⁻² | |
The second column represents the statistical significance corresponding to all breakpoint hotspots found in cancer genomes, while the third column represents the statistical significance for those breakpoint hotspots that occur in cancer genomes but not in the three personal genomes analyzed.
Because the above genomic features are functionally interdependent, establishing a primary association is challenging. For instance, recombination hotspots can form G4 structures37 and often overlap with cancer breakpoints. Further, recombination hotspots, G4 structures and fragile sites are enriched for specific repeat sequences36,38; such repetitive elements show relatively low levels of evolutionary conservation35. We found that the variation in PG4s explains most of the variation in the density of cancer-specific breakpoint hotspots, and that the association between PG4s and breakpoint density exists even after controlling for other genomic features, such as meiotic recombination rate (Supplementary Methods and Supplementary Table 3). We then performed our analysis at a higher resolution: we identified 10-kb windows centering on DNA breakpoints for each SCNA, and for each such window, we counted the total number of base pairs belonging to PG4s. When the windows from multiple breakpoints partially overlapped, we fused them and determined whether these regions were enriched for PG4s relative to the genome-wide distribution of such sequences. Indeed, the vicinity of SCNA breakpoints was significantly enriched for PG4s compared to the numbers expected by chance (Fig. 2a; P < 2.2 × 10⁻¹⁶, Mann-Whitney test). We found similar results at the resolution of 20 kb, 50 kb and 100 kb (Supplementary Methods and Supplementary Table 4). The association existed even after we controlled for SNP density on the Affymetrix chip and when we excluded centromeric and telomeric regions (Supplementary Methods). These findings suggest that the association between PG4s and SCNA breakpoints is probably genuine.
Figure 2.
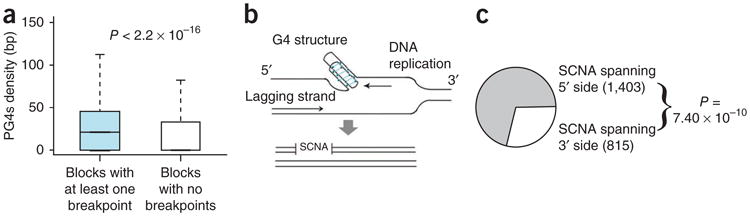
Association between G-quadruplex– forming sequences and breakpoint hotspots. (a) The distribution of the density (bp) of PG4s in 10-kb genomic blocks that have at least one SCNA breakpoint in cancer is markedly higher than the distribution of PG4s in those genomic blocks that harbor no breakpoints. The whiskers of the box plots represent the range of the PG4s density for the respective groups. (b) A schematic representation of DNA replication near a G4 structure and generation of an SCNA. Arrows indicate the direction of motion of the DNA polymerase. Only the leading strand obstructs the motion of the DNA polymerase and therefore SCNAs are more likely to occur at the 5′ side of G4 structures. (c) Cancer SCNAs with at least two PG4s within 10 kb are significantly likely to occur at the 5′ side of the G4 structures, an observation that is consistent with the hypothesis that these structures inhibit the action of DNA polymerase. Frequencies are shown within parentheses. The pattern is independent of the choice of parameters (see Supplementary Table 5).
G4 structures are strand specific—the G-rich DNA strand forms a G4 structure that can obstruct the movement of the DNA polymer-ase17,20 and cause mutagenic events18–20 (Fig. 2b). Therefore, G4-mediated deletion and duplication events occur predominantly toward the 5′ direction of the G4 sequence18–20. Although the C-rich strand can potentially form an i-motif structure39, a mutagenic potential of this structure has not been demonstrated. We therefore tested whether the SCNA events in cancer associated with G4 structures also show a strand bias. We identified SCNA breakpoints that had at least two PG4s within a 10-kb window and found that in more than two-thirds of these cases, the breakpoints resided on the same strand. For these cases, we observed a significant enrichment (Fig. 2c; P = 7.40 × 10⁻¹⁰, binomial test) for structural alterations to extend to the 5′ direction relative to that expected by chance. This finding was independent of how the enrichment of G4 structures on one strand was determined (Supplementary Methods and Supplementary Table 5). We obtained similar results at the resolutions of 20 kb and 50 kb, but the statistical significance decayed quickly for larger window sizes, suggesting that the effect is local (Supplementary Methods and Supplementary Table 5). Our observations point toward a causal role of PG4s in the generation of structural alterations in cancer.
G4 structure formation is facilitated by negative DNA supercoil-ing25,40, which occurs not only during DNA replication41,42 but also during repair and transcription43. Although the effects of replication are genome wide, transcription-associated events are likely to be localized to the neighborhood of transcribed regions. Overlaying transcription start sites (TSS), PG4s and SCNA breakpoints onto the human genome, we found that the 1-Mb genomic blocks with above-median PG4s density and above-median TSS density had significantly higher SCNA breakpoint densities than the remaining blocks (P = 1.727 × 10⁻¹⁵, Mann-Whitney test). We obtained similar results using different block sizes and cutoffs for PG4s and TSS densities (Supplementary Methods and Supplementary Table 6). Thus, gene promoters with high PG4s density are at an increased risk of DNA breakage in cancer.
G4-dense breakpoint hotspots are hypomethylated in cancer
Because the genomic sequence is the same in all cells within an individual, one might expect that PG4s-driven genomic aberrations would be recurrent in both normal and cancer cells and would be similar across all tissue types. In contrast, the mutational patterns observed in cancer genomes differ between cancer types—as do the patterns of epigenetic states such as DNA methylation44. In normal tissues, the genome is usually hypermethylated and does not show genomic instability, whereas genome-wide hypomethylation is a hallmark of many cancer types21,22. Notably, almost 50% of PG4s motifs contain CpG dinucleotides, and for a majority of those cases, the guanine participates in G-quadruplex formation (Supplementary Methods). PG4s motifs show depletion of CpG methylation and nucleosome occupancy26,30, and DNA methylation patterns have a role in the stability of other noncanonical DNA structures such as Z-DNA and H-DNA27,28. Furthermore, chemical modifications such as O6-methylguanine inhibit G4 structure formation45. Therefore, we investigated the patterns of DNA methylation in several normal and cancer tissues in the context of PG4s and DNA breakpoints.
We obtained methylation data for several healthy colon, brain, liver and spleen samples and DNA methylation data for 13 pairs of colorectal cancer samples and their matched normal colonic mucosa44. We first analyzed the patterns of hypomethylation in the normal brain, liver and spleen samples. We found that in those tissues, regions of hypomethylation were in general depleted for PG4s relative to their genome-wide distribution (P = 4.16 × 10⁻⁵, Kolmogorov-Smirnov test). Moreover, genomic blocks that harbor an above-median PG4s density were significantly more hypermethylated (P < 2.2 × 10⁻¹⁶, Mann-Whitney test) than those blocks that have below-median PG4s density in all three normal tissue types. Taken together, our data indicate that extensive hypomethylation and high PG4s density rarely co-occur in normal tissues.
We then overlaid differential methylation patterns, PG4s and cancer breakpoint densities for 13 colorectal cancer samples, and we found that sites of acute hypomethylation and high PG4s density often overlap with breakpoint hotspots (Fig. 3a). Furthermore, sites with both above-average PG4s density and differential hypomethylation harbored significantly more breakpoints than would be expected from the genome-wide distribution (Fig. 3b; P = 1.55 × 10⁻⁸, Mann-Whitney test). Our observation was independent of the threshold for hypomethylation and PG4s density (Table 2) and remained significant even after we excluded genomic blocks that were within 1 Mb of telomeres or centromeres (P = 2.36 × 10⁻⁷). Moreover, SCNA breakpoint hotspots with above-median PG4s density showed a significant enrichment for differential hypomethylation compared to the genome-wide background (Fig. 3c; P = 1.18 × 10⁻², Mann-Whitney test). As these SCNA breakpoints were derived from various cancer types, we then focused our analysis on the colorectal cancer–specific breakpoint hotspots2, and we found a similar trend (Fig. 3c). The association of PG4s with SCNA breakpoint density is significant even after controlling for DNA methylation, and the association between methylation and SCNA breakpoint density is marginally significant after controlling for PG4s (Supplementary Methods and Supplementary Table 7). We then repeated our analysis using breast cancer46 and osteosarcoma47 data (Supplementary Methods, Supplementary Table 8 and Supplementary Figs. 1 and 2) and obtained similar results. Finally, we analyzed copy number, DNA methylation and gene expression data for glioblastoma samples5 and found that loss of methylation in the CpG dinucleotides within PG4s was associated with genomic alterations (Supplementary Methods, Supplementary Fig. 3 and Supplementary Table 9). Taken together, our data indicate that hypomethylation near regions of high PG4s density, which is rare in normal tissues but common in cancer genomes, is a signature of many DNA breakpoints across many cancer types.
Figure 3.
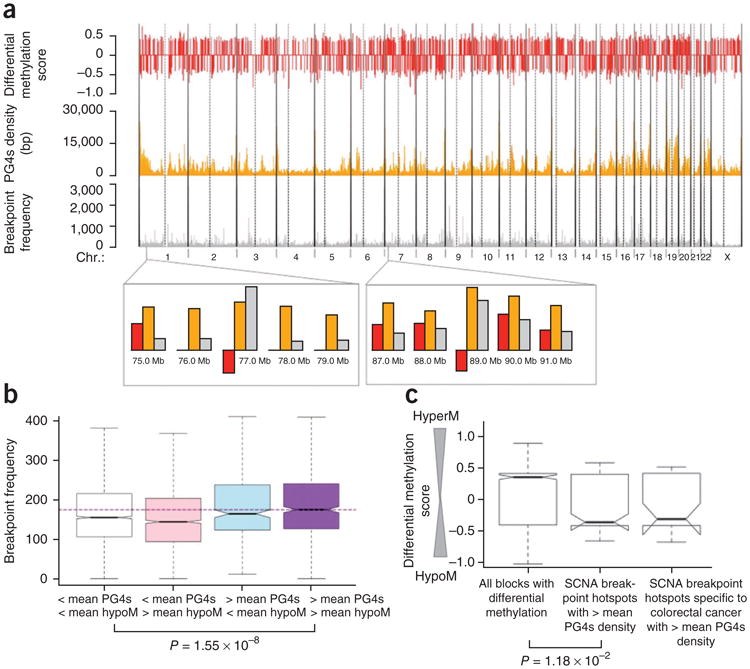
Role of G-quadruplex structures in the generation of breakpoint hotspots. (a) Extent of differential methylation in colon cancer relative to normal colon (red), density of G4 sequences (orange) and density of DNA breakpoints in cancer (gray) are shown across the human chromosomes. Vertical dotted lines mark centromeres. A negative value of differential methylation indicates differential hypomethylation. (b) The density of DNA breakpoints in cancer is higher in genomic blocks that have both above-average hypomethylation and above-average PG4s density than that in genomic blocks that do not have above-average representation of either of the factors. The purple horizontal dashed line shows the median breakpoint density corresponding to the rightmost group. The whiskers of the box plots represent the range of the breakpoint frequencies for the respective groups. (c) SCNA breakpoint hotspots with above-average PG4s density are significantly differentially hypomethylated (low differential methylation score) relative to the genome-wide background. SCNA breakpoint hotspots specific to colorectal cancers with above-average PG4s density show a similar trend (P value > 0.05 because there are fewer data points).
Table 2. Enrichment for cancer breakpoint hotspots in genomic blocks with over-representation of G4 sequences and hypomethylation.
| Total no. genomic blocks | SCNA breakpoint hotspots (A) | Genomic blocks with: | ||||
|---|---|---|---|---|---|---|
|
| ||||||
| PG4s density | Differential methylation | No. blocks (B) | Overlap between groups A and B | Corresponding P value | ||
| 3,029 | 248 | > mean | < mean | 579 | 72 | 2.47 × 10⁻⁵ |
| 3,029 | 248 | > mean + s.d. | < mean | 205 | 30 | 5.09 × 10⁻⁴ |
| 3,029 | 248 | > mean | < mean − s.d. | 272 | 39 | 1.26 × 10⁻⁴ |
| 3,029 | 248 | > mean + s.d. | < mean − s.d. | 122 | 22 | 1.69 × 10⁻⁴ |
Discussion
Here we have established that SCNA breakpoints in cancer are often clustered into hotspots, which are markedly enriched for PG4s. The strand bias of the SCNAs relative to PG4s indicates that G4 structures are likely to have a causal role in cancer genome instability. Furthermore, we found that genomic regions rich in PG4s are on average hypermethylated in normal tissue, but hypomethylation in those regions is substantially associated with DNA breakpoint hotspots across a wide range of cancer types. Our results show that G4 structures and aberrant hypomethylation have a key role in generating genomic alterations in cancer.
On the basis of our analyses and supporting lines of evidence, we propose a mechanistic model of the potential contribution of hypomethylation and PG4s to the generation of genomic instability, thus bridging the roles of genetic and epigenetic factors driving tumorigenesis (Fig. 4). In normal tissues, the genome is generally hypermethylated, which is a marker for closed chromatin—a state generally unfavorable for G4 formation. In contrast, hypomethylation and open chromatin create a favorable condition for G4 structure formation in the presence of stabilizing proteins and negative supercoiling—for example, during transcription25,40,43 or replication41,42. In addition, the CpG dinucleotide often occurs within PG4s, and methyl-ation of those CpGs may also play a direct role in the stability of G4 structures through chemical and steric effects, as is the case for several other non–B-DNA structures27,28. Furthermore, CpG dinucleotide methylation regulates local nucleosome occupancy and chromatin structure48, which may in turn influence DNA accessibility, G4 formation and DNA breakage. Aberrant genome-wide DNA hypomethylation, which can arise during aging49 and tumorigenesis46, exposes large genomic regions where G4 structures can form frequently and perhaps nonspecifically; aberrant hypomethylation may work in concert with other epigenetic modifications, which cannot yet be systematically investigated because of insufficient data. Although such events are likely to be crucial during replication, some G4 structures formed during transcription may be recognized and mis-repaired by transcription-coupled repair or persist until subsequent replication. During replication, G4 structures obstruct DNA polymerase17, increasing the risk of fork stalling and template switching (FosTes), erroneous microhomology-mediated replication-dependent recombination (MMRDR) and nonhomologous end joining (NHEJ)9; these processes then increase the risk of genomic alterations.
Figure 4.

A mechanistic hypothesis of epigenetic involvement in the generation of breakpoints in cancer genomes. Genomes in normal tissue are generally hypermethylated and stable. Genome-wide hypomethylation, which occurs stochastically during aging and tumorigenesis, offers a favorable environment in which PG4s can fold into G4 structures in the presence of stabilizing proteins and negative supercoiling. G4 structures are mutagenic and have the potential to generate deletion, insertion or rearrangement events of genetic material on which selection can act to drive cancer evolution. See Discussion for further details.
This proposed mutagenic process may work alongside other endogenous and exogenous mutagens to create genomic instability and generate mutations on which selection can operate during tumor evolution. If G4-associated structural alterations involve cancer genes or other functional elements, they may alter cellular fitness and thus change the course of cancer progression by leading to clonal expansion. Recent experimental findings that aberrant methylation promotes tumorigenesis21 and is associated with PG4s24,26,30, and that the formation of G4 structures is mutagenic18–20, are consistent with our model. Because PG4s are widespread in the genome38, methylation patterns differ between tissue types44 and between cells within a tissue49, and G4-mediated structural alteration is a stochastic event45, this mechanism has the potential to generate tissue-specific mutational landscapes in cancer as well as heterogeneity among single cells within a tumor. Our model has attractive preventative, diagnostic and therapeutic implications, as agents that counteract hypomethylation and/or dissolve G4 structures may stabilize the rates of genomic aberrations and thus contribute to preventing cancer progression and the evolution of resistance. Our findings also contribute to the ongoing debate about epigenetic origins of cancer8.
Online Methods
Data sets
We obtained data for DNA breakpoints associated with somatic copy-number alterations from several different cancer types from a published report2. The authors originally studied a total of ∼130,000 cases of gains and losses in 3,131 samples classified into 26 histological types, and each cancer type in this dataset was represented by at least 20 samples2. A subset of the data (∼10% of samples) were not publicly available, and therefore we restricted our analysis to the set of publicly available 663,446 DNA breakpoints from 2,792 samples (89% of the complete dataset). SCNAs were obtained by comparing the signal intensities from the Affymetrix 250k array data of each cancer sample to the matched normal tissue2; the boundaries of alterations, which we denote as SCNA breakpoints, were determined with a precision of 8–10 kb. We also obtained a list of structural variations in 24 breast cancer samples from Stephens et al.7, who used a paired-end sequencing strategy to identify somatic rearrangements. We obtained methylation data for colon cancer and also from healthy brain, liver and spleen samples from Irizarry et al.44; these authors performed a high-throughput array-based relative methylation analysis (CHARM) and also pyrosequencing-based revalidation analysis on an additional set of colon cancer samples.
Identification of breakpoint hotspots
To identify breakpoint hotspots, first we divided the cancer genomes into 1-Mb nonoverlapping blocks and counted the number of SCNA breakpoints in each block. Next, we randomized the position of the breakpoints 100,000 times for each chromosome and generated a distribution of breakpoint densities for the 1-Mb blocks. The genomic blocks that had a higher breakpoint frequency than that expected from the top 5% from the simulation across the whole genome were identified as breakpoint hotspots.
Genomic features
We obtained the genomic locations of PG4s from (http://www.quadruplex.org/)38, where the PG4s were predicted using the Quadparser algorithm, which is based on the Folding rule postulating that a sequence of the form d(G3N1–7G3N1–7G3N1–7G3) will fold into a quadruplex under near-physiological conditions, where G is guanine and N is any nucleotide (A, T, G or C). We obtained the list of fragile sites from Durkin and Glover36. Common fragile sites are loci that preferentially show chromosomal aberrations visible as gaps and breaks on metaphase chromosomes after partial inhibition of DNA synthesis, and are present in normal individuals. Different families of repeat elements, recombination rate and 28-way evolutionary conservation information were obtained from the UCSC Genome Browser35. Data on recombination rate and fragile sites had about megabase resolution. The list of the genes causally implicated in cancer was obtained from The Cancer Gene Census database50.
Analysis
All statistical analyses were performed using R. The Supplementary Methods, Supplementary Figures 1–3 and Supplementary Tables 1–9 contain details of all analyses.
Supplementary Material
Acknowledgments
We would like to thank G. Parmigiani, J. Widom, N. Maizels, G.-Ch. Yuan, R. Beroukhim and D. Patel for discussions and comments. S.D. is a recipient of Human Frontier Science Program long-term fellowship and is a Research Fellow at King's College, Cambridge. This work was funded by the US National Cancer Institute's initiative to found Physical Science–Oncology Centers (U54CA143798).
Footnotes
Author Contributions: S.D. and F.M. designed the research and wrote the manuscript. S.D. performed the research.
Competing Financial Interests: The authors declare no competing financial interests.
Note: Supplementary information is available on the Nature Structural & Molecular Biology website.
Reprints and permissions information is available online at http://www.nature.com/reprints/index.html.
References
- 1.Hanahan D, Weinberg RA. The hallmarks of cancer. Cell. 2000;100:57–70. doi: 10.1016/s0092-8674(00)81683-9. [DOI] [PubMed] [Google Scholar]
- 2.Beroukhim R, et al. The landscape of somatic copy-number alteration across human cancers. Nature. 2010;463:899–905. doi: 10.1038/nature08822. [DOI] [PMC free article] [PubMed] [Google Scholar]
- 3.Leary RJ, et al. Integrated analysis of homozygous deletions, focal amplifications, and sequence alterations in breast and colorectal cancers. Proc Natl Acad Sci USA. 2008;105:16224–16229. doi: 10.1073/pnas.0808041105. [DOI] [PMC free article] [PubMed] [Google Scholar]
- 4.Parsons DW, et al. An integrated genomic analysis of human glioblastoma multiforme. Science. 2008;321:1807–1812. doi: 10.1126/science.1164382. [DOI] [PMC free article] [PubMed] [Google Scholar]
- 5.Cancer Genome Atlas Research Network. Comprehensive genomic characterization defines human glioblastoma genes and core pathways. Nature. 2008;455:1061–1068. doi: 10.1038/nature07385. [DOI] [PMC free article] [PubMed] [Google Scholar]
- 6.Kim JI, et al. A highly annotated whole-genome sequence of a Korean individual. Nature. 2009;460:1011–1015. doi: 10.1038/nature08211. [DOI] [PMC free article] [PubMed] [Google Scholar]
- 7.Stephens PJ, et al. Complex landscapes of somatic rearrangement in human breast cancer genomes. Nature. 2009;462:1005–1010. doi: 10.1038/nature08645. [DOI] [PMC free article] [PubMed] [Google Scholar]
- 8.Feinberg AP, Ohlsson R, Henikoff S. The epigenetic progenitor origin of human cancer. Nat Rev Genet. 2006;7:21–33. doi: 10.1038/nrg1748. [DOI] [PubMed] [Google Scholar]
- 9.Hastings PJ, Lupski JR, Rosenberg SM, Ira G. Mechanisms of change in gene copy number. Nat Rev Genet. 2009;10:551–564. doi: 10.1038/nrg2593. [DOI] [PMC free article] [PubMed] [Google Scholar]
- 10.Stratton MR, Campbell PJ, Futreal PA. The cancer genome. Nature. 2009;458:719–724. doi: 10.1038/nature07943. [DOI] [PMC free article] [PubMed] [Google Scholar]
- 11.Wang G, Christensen LA, Vasquez KM. Z-DNA-forming sequences generate large-scale deletions in mammalian cells. Proc Natl Acad Sci USA. 2006;103:2677–2682. doi: 10.1073/pnas.0511084103. [DOI] [PMC free article] [PubMed] [Google Scholar]
- 12.Wang G, Vasquez KM. Naturally occurring H-DNA-forming sequences are mutagenic in mammalian cells. Proc Natl Acad Sci USA. 2004;101:13448–13453. doi: 10.1073/pnas.0405116101. [DOI] [PMC free article] [PubMed] [Google Scholar]
- 13.Zhao J, Bacolla A, Wang G, Vasquez KM. Non-B DNA structure-induced genetic instability and evolution. Cell Mol Life Sci. 2010;67:43–62. doi: 10.1007/s00018-009-0131-2. [DOI] [PMC free article] [PubMed] [Google Scholar]
- 14.Huppert JL. Structure, location and interactions of G-quadruplexes. FEBS J. 2010;277:3452–3458. doi: 10.1111/j.1742-4658.2010.07758.x. [DOI] [PubMed] [Google Scholar]
- 15.Lipps HJ, Rhodes D. G-quadruplex structures: in vivo evidence and function. Trends Cell Biol. 2009;19:414–422. doi: 10.1016/j.tcb.2009.05.002. [DOI] [PubMed] [Google Scholar]
- 16.Maizels N. Dynamic roles for G4 DNA in the biology of eukaryotic cells. Nat Struct Mol Biol. 2006;13:1055–1059. doi: 10.1038/nsmb1171. [DOI] [PubMed] [Google Scholar]
- 17.Sun D, Hurley LH. Biochemical techniques for the characterization of G-quadruplex structures: EMSA, DMS footprinting, and DNA polymerase stop assay. Methods Mol Biol. 2010;608:65–79. doi: 10.1007/978-1-59745-363-9_5. [DOI] [PMC free article] [PubMed] [Google Scholar]
- 18.Kruisselbrink E, et al. Mutagenic capacity of endogenous G4 DNA underlies genome instability in FANCJ-defective C. elegans. Curr Biol. 2008;18:900–905. doi: 10.1016/j.cub.2008.05.013. [DOI] [PubMed] [Google Scholar]
- 19.Pontier DB, Kruisselbrink E, Guryev V, Tijsterman M. Isolation of deletion alleles by G4 DNA-induced mutagenesis. Nat Methods. 2009;6:655–657. doi: 10.1038/nmeth.1362. [DOI] [PubMed] [Google Scholar]
- 20.Boán F, Gomez-Marquez J. In vitro recombination mediated by G-quadruplexes. ChemBioChem. 2010;11:331–334. doi: 10.1002/cbic.200900612. [DOI] [PubMed] [Google Scholar]
- 21.Eden A, Gaudet F, Waghmare A, Jaenisch R. Chromosomal instability and tumors promoted by DNA hypomethylation. Science. 2003;300:455. doi: 10.1126/science.1083557. [DOI] [PubMed] [Google Scholar]
- 22.Kanai Y. Genome-wide DNA methylation profiles in precancerous conditions and cancers. Cancer Sci. 2010;101:36–45. doi: 10.1111/j.1349-7006.2009.01383.x. [DOI] [PMC free article] [PubMed] [Google Scholar]
- 23.Carbone L, et al. Evolutionary breakpoints in the gibbon suggest association between cytosine methylation and karyotype evolution. PLoS Genet. 2009;5:e1000538. doi: 10.1371/journal.pgen.1000538. [DOI] [PMC free article] [PubMed] [Google Scholar]
- 24.Halder K, Halder R, Chowdhury S. Genome-wide analysis predicts DNA structural motifs as nucleosome exclusion signals. Mol Biosyst. 2009;5:1703–1712. doi: 10.1039/b905132e. [DOI] [PubMed] [Google Scholar]
- 25.Huppert JL, Balasubramanian S. G-quadruplexes in promoters throughout the human genome. Nucleic Acids Res. 2007;35:406–413. doi: 10.1093/nar/gkl1057. [DOI] [PMC free article] [PubMed] [Google Scholar]
- 26.Wong HM, Huppert JL. Stable G-quadruplexes are found outside nucleosomebound regions. Mol Biosyst. 2009;5:1713–1719. doi: 10.1039/b905848f. [DOI] [PubMed] [Google Scholar]
- 27.Behe M, Felsenfeld G. Effects of methylation on a synthetic polynucleotide: the B–Z transition in poly(dG-m5dC)•poly(dG-m5dC) Proc Natl Acad Sci USA. 1981;78:1619–1623. doi: 10.1073/pnas.78.3.1619. [DOI] [PMC free article] [PubMed] [Google Scholar]
- 28.Vargason JM, Ho PS. The effect of cytosine methylation on the structure and geometry of the Holliday junction: the structure of d(CCGGTACm5CGG) at 1.5 A resolution. J Biol Chem. 2002;277:21041–21049. doi: 10.1074/jbc.M201357200. [DOI] [PubMed] [Google Scholar]
- 29.Tsumagari K, et al. Epigenetics of a tandem DNA repeat: chromatin DNaseI sensitivity and opposite methylation changes in cancers. Nucleic Acids Res. 2008;36:2196–2207. doi: 10.1093/nar/gkn055. [DOI] [PMC free article] [PubMed] [Google Scholar]
- 30.Halder R, et al. Guanine quadruplex DNA structure restricts methylation of CpG dinucleotides genome-wide. Mol Biosyst. 2010;6:2439–2447. doi: 10.1039/c0mb00009d. [DOI] [PubMed] [Google Scholar]
- 31.O'Neil J, Look AT. Mechanisms of transcription factor deregulation in lymphoid cell transformation. Oncogene. 2007;26:6838–6849. doi: 10.1038/sj.onc.1210766. [DOI] [PubMed] [Google Scholar]
- 32.Sen D, Gilbert W. Formation of parallel four-stranded complexes by guanine-rich motifs in DNA and its implications for meiosis. Nature. 1988;334:364–366. doi: 10.1038/334364a0. [DOI] [PubMed] [Google Scholar]
- 33.Sundquist WI, Klug A. Telomeric DNA dimerizes by formation of guanine tetrads between hairpin loops. Nature. 1989;342:825–829. doi: 10.1038/342825a0. [DOI] [PubMed] [Google Scholar]
- 34.Williamson JR, Raghuraman MK, Cech TR. Monovalent cation-induced structure of telomeric DNA: the G-quartet model. Cell. 1989;59:871–880. doi: 10.1016/0092-8674(89)90610-7. [DOI] [PubMed] [Google Scholar]
- 35.Rhead B, et al. The UCSC Genome Browser database: update 2010. Nucleic Acids Res. 2010;38:D613–D619. doi: 10.1093/nar/gkp939. [DOI] [PMC free article] [PubMed] [Google Scholar]
- 36.Durkin SG, Glover TW. Chromosome fragile sites. Annu Rev Genet. 2007;41:169–192. doi: 10.1146/annurev.genet.41.042007.165900. [DOI] [PubMed] [Google Scholar]
- 37.Mani P, Yadav VK, Das SK, Chowdhury S. Genome-wide analyses of recombination prone regions predict role of DNA structural motif in recombination. PLoS ONE. 2009;4:e4399. doi: 10.1371/journal.pone.0004399. [DOI] [PMC free article] [PubMed] [Google Scholar]
- 38.Huppert JL, Balasubramanian S. Prevalence of quadruplexes in the human genome. Nucleic Acids Res. 2005;33:2908–2916. doi: 10.1093/nar/gki609. [DOI] [PMC free article] [PubMed] [Google Scholar]
- 39.Gehring K, Leroy JL, Gueron M. A tetrameric DNA structure with protonated cytosine•cytosine base pairs. Nature. 1993;363:561–565. doi: 10.1038/363561a0. [DOI] [PubMed] [Google Scholar]
- 40.Sun D, Hurley LH. The importance of negative superhelicity in inducing the formation of G-quadruplex and i-motif structures in the c-Myc promoter: implications for drug targeting and control of gene expression. J Med Chem. 2009;52:2863–2874. doi: 10.1021/jm900055s. [DOI] [PMC free article] [PubMed] [Google Scholar]
- 41.Crabbe L, Verdun RE, Haggblom CI, Karlseder J. Defective telomere lagging strand synthesis in cells lacking WRN helicase activity. Science. 2004;306:1951–1953. doi: 10.1126/science.1103619. [DOI] [PubMed] [Google Scholar]
- 42.Sarkies P, Reams C, Simpson LJ, Sale JE. Epigenetic instability due to defective replication of structured DNA. Mol Cell. 2010;40:703–713. doi: 10.1016/j.molcel.2010.11.009. [DOI] [PMC free article] [PubMed] [Google Scholar]
- 43.Basundra R, et al. A novel G-quadruplex motif modulates promoter activity of human thymidine kinase 1. FEBS J. 2010;277:4254–4264. doi: 10.1111/j.1742-4658.2010.07814.x. [DOI] [PubMed] [Google Scholar]
- 44.Irizarry RA, et al. The human colon cancer methylome shows similar hypo- and hypermethylation at conserved tissue-specific CpG island shores. Nat Genet. 2009;41:178–186. doi: 10.1038/ng.298. [DOI] [PMC free article] [PubMed] [Google Scholar]
- 45.Mekmaysy CS, et al. Effect of O6-methylguanine on the stability of G-quadruplex DNA. J Am Chem Soc. 2008;130:6710–6711. doi: 10.1021/ja801976h. [DOI] [PubMed] [Google Scholar]
- 46.Shann YJ, et al. Genome-wide mapping and characterization of hypomethylated sites in human tissues and breast cancer cell lines. Genome Res. 2008;18:791–801. doi: 10.1101/gr.070961.107. [DOI] [PMC free article] [PubMed] [Google Scholar]
- 47.Sadikovic B, et al. In vitro analysis of integrated global high-resolution DNA methylation profiling with genomic imbalance and gene expression in osteosarcoma. PLoS ONE. 2008;3:e2834. doi: 10.1371/journal.pone.0002834. [DOI] [PMC free article] [PubMed] [Google Scholar]
- 48.Chodavarapu RK, et al. Relationship between nucleosome positioning and DNA methylation. Nature. 2010;466:388–392. doi: 10.1038/nature09147. [DOI] [PMC free article] [PubMed] [Google Scholar]
- 49.Maegawa S, et al. Widespread and tissue specific age-related DNA methylation changes in mice. Genome Res. 2010;20:332–340. doi: 10.1101/gr.096826.109. [DOI] [PMC free article] [PubMed] [Google Scholar]
- 50.Futreal PA, et al. A census of human cancer genes. Nat Rev Cancer. 2004;4:177–183. doi: 10.1038/nrc1299. [DOI] [PMC free article] [PubMed] [Google Scholar]
Associated Data
This section collects any data citations, data availability statements, or supplementary materials included in this article.