

Summary
Segmentation is a fundamental problem that dominates the success of microscopic image analysis. In almost 25 years of cell detection software development, there is still no single piece of commercial software that works well in practice when applied to early mouse embryo or stem cell image data. To address this need, we developed MINS (modular interactive nuclear segmentation) as a MATLAB/C++-based segmentation tool tailored for counting cells and fluorescent intensity measurements of 2D and 3D image data. Our aim was to develop a tool that is accurate and efficient yet straightforward and user friendly. The MINS pipeline comprises three major cascaded modules: detection, segmentation, and cell position classification. An extensive evaluation of MINS on both 2D and 3D images, and comparison to related tools, reveals improvements in segmentation accuracy and usability. Thus, its accuracy and ease of use will allow MINS to be implemented for routine single-cell-level image analyses.
Graphical Abstract
Highlights
-
•
Software for automated 2D/3D nuclear segmentation of image data
-
•
Identification of nuclei, with links to information on position
-
•
Quantitative fluorescence data for each channel
-
•
Computational identification of inner versus outer cells in preimplantation embryos
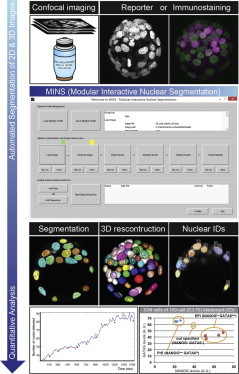
MINS (modular interactive nuclear segmentation) is a MATLAB/C++ based segmentation tool tailored for counting cells and fluorescent intensity measurements of 2D and 3D image data. MINS is accurate and efficient, yet straightforward and user-friendly. The MINS pipeline comprises three major cascaded modules: detection, segmentation, and cell position classification.
Introduction
Imaging of optically sectioned nuclei provides an unprecedented opportunity to observe the details of fate specification, tissue patterning, and morphogenetic events at single-cell resolution in space and time. Imaging is now recognized as the requisite tool for acquiring information to investigate how individual cells behave, as well as the determination of mRNA or protein localization or levels within individual cells. To this end, fluorescent labeling techniques, using genetically encoded fluorescent reporters or dye-coupled immunodetection, can reveal the sites and levels of expression of certain genes or proteins during biological processes. The availability of nuclear-localized fluorescent reporters, such as human histone H2B-green fluorescent protein (GFP) fusion proteins enables 3D time-lapse (i.e., 4D) live imaging at single-cell resolution (Hadjantonakis and Papaioannou, 2004; Kanda et al., 1998; Nowotschin et al., 2009) (Figures 1A–1C). However, to begin to probe intrinsic characteristics and cellular behaviors represented within image data requires the extraction of quantitatively meaningful information. To do this, one should perform a detailed image data analysis, identifying each cell by virtue of a single universally present descriptor (usually the nucleus), obtaining quantitative measurements of fluorescence for each nuclear volume, and eventually being able of identifying the position and division of cells and connecting them over time for cell tracking and lineage tracing.
Figure 1.

Image Analysis of Cells and Mouse Embryos and a Schematic of Preimplantation Embryo Development
(A) Schematic showing the experimental setup used for static and live imaging of stem cell and mouse embryo specimens. Notably, samples are maintained in liquid culture, and images are acquired on inverted microscope systems.
(B) Examples of imaging acquisition of 3D static immunostaining (left) or 3D live imaging of fluorescent reporter (right).
(C) Schematic diagram showing 2D, 3D, and 4D image data acquisition and analysis.
(D) Differential interference contrast (DIC) images of CAG:H2B-GFP transgenic fluorescent reporter expressing embryos at two-cell, compact morula, early, and late blastocyst stages merged with 2D and 3D renderings of GFP channel showing nuclei labels and a schematic diagram of lineage specification during preimplantation development (Schrode et al., 2013). Scale bar, 20 μm.
Automated nuclear segmentation of cells grown in culture and in early embryos is a necessary first step for a variety of image analysis applications in mammalian systems. First, automated segmentation can facilitate efficient and accurate identification (ID) of individual cells, especially in a context of an emergent complex tissue organization; for example, during tissue morphogenesis. This issue is exemplified by studies on early, or preimplantation, stages of mammalian embryo development, which result in the formation of a blastocyst. Mouse blastocyst development offers a relatively simple but relevant model for investigating the coordination of cell lineage commitment and morphogenesis (Schrode et al., 2013). The blastocyst is also a unique stage of development when stem cells representing each of the constituent lineages can be derived, propagated, differentiated, and interconverted ex vivo. Embryonic stem (ES) cells are well known as representative of the pluripotent epiblast (EPI) and are characterized by their ability to generate all somatic and germline lineages in vivo and, most likely, in vitro. Likewise, trophectoderm (TE) stem cells represent the trophoblast, and extraembryonic endoderm stem (XEN) cells represent the primitive endoderm (PrE) (Artus and Hadjantonakis, 2012). Given the ease of in vitro culture of preimplantation embryos, their small size (<120 μm), and limited cell number (up to 140 cells), they provide an attractive model for live imaging the coupling of cell lineage commitment and morphogenesis and can serve as a proof of principle for studies on larger, more developmentally advanced and complex mammalian embryos.
With the increasing level complexity and detail of analyses performed on mammalian preimplantation embryos, it is becoming routine to stage embryos based on total cell numbers rather than solely by embryonic day (E). For example, the blastocyst is a descriptor of a stage having a distinctive morphology, with an outer TE epithelial layer that encapsulates an inner cell mass (ICM) and a fluid-filled cavity (Figure 1D). In the mouse, the blastocyst stage covers an approximately 36 hr period, from E3.0 at the initiation of cavitation until the time of embryo implantation into the maternal uterus, which occurs at around E4.5 (Rossant and Tam, 2009; Schrode et al., 2013). During this time, mouse embryos more than triple their cell number, as they go from around 32 cells to over 140 cells. The blastocyst stage designation is, therefore, quite broad. Indeed, it is now known that critical molecular changes take place between early blastocyst (32-cell) and late blastocyst (>80-cell) stages (Figure 1D) (Schrode et al., 2013). One of the arguments made against determining total cell numbers in individual embryos has been the relative inefficiency of this measurement, in terms of effective automated segmentation and/or the large amount of effort required for manual and semiautomated manually corrected segmentation using generic image analysis software. Thus, a simple universal tool able to perform this task would be highly desirable, not only for studies on preimplantation mouse embryos but also for analyzing early embryos from more complex later stages or tissue samples, as well as other mammalian systems, including the human (Kuijk et al., 2012; Niakan and Eggan, 2013; Roode et al., 2012). Since much information on preimplantation-stage mammalian embryos is gathered using optical sectioning, most frequently by confocal imaging, it is inherently 3D and is, therefore, amenable to nuclear segmentation for cell number calculations.
Additionally, robust segmentation is requisite for proper quantitative analysis of individual cells within populations. Immunostaining using antibodies directed against factors present in early embryos or fluorescent mRNA in situ hybridization experiments reveal the site of expression of any given protein or gene but also, when combined with quantitative analysis, allow the determination of levels of expression within individual cells (G. Chia Le bin, S.M.-D., S. Leitch, X.L., W. Mansfield, N. Grabole, H. Niwa, A.K.H., and J. Nichols, unpublished data; Muñoz Descalzo et al., 2012). This is of particular importance in various contexts. For example, in preimplantation mammalian embryos, it is known that the levels of expression of certain transcription factors can dictate the lineage choice in any given cell (Guo et al., 2010; Ohnishi et al., 2014); however, biochemical analyses—for example, western blots—are limited due to the small size of embryo and small amount of material routinely available.
Finally, nuclear segmentation is the first step toward the tracking of individual cells in situ in populations and facilitates the quantitative analysis of cell cohorts over time as development progresses (Kang et al., 2013b; Nowotschin et al., 2009). Automated nuclear segmentation, subsequent tracking of nuclei, and the detection of cell division or cell death and subsequent fluorescence intensity quantitation are requisite for understanding the dynamic and heterogeneous populations that emerge within stem cell cultures and in situ in embryos (Artus et al., 2013; Kang et al., 2013a).
Nuclear segmentation, therefore, comprises the first stage of any analysis involving the ID of individual cells on static or time-lapse 2D or 3D data generated after immunostaining or time-lapse movies of transgenic reporters (Kang et al., 2013b). In segmented images, the set of pixels belonging to each individual nucleus within a cohort of cells in culture or within an embryo or a tissue can be identified (Roeder et al., 2012). Most software available with commercial microscope systems (for example, Zeiss ZEN, Leica LAS, or Perkin-Elmer Volocity) usually include standard plug-ins that allow the user to perform basic quantitative analyses. In addition, commercial software specifically designed for image analysis (for example, Bitplane’s Imaris or VSG’s Amira) usually provide a user-friendly platform suitable for more comprehensive data analysis. Although these latter programs are designed for 2D/3D/4D analysis, their application to complex biological samples with high or irregular cell densities, such as mouse ES cell colonies or mouse embryos, usually requires various parameters to be optimized, and such analyses are often not straightforward to perform. As a consequence, generic programs cannot be considered for simple automated use and cannot be applied for routine medium- to high-throughput analyses of multiple samples. For this reason, manual segmentation is still favored in many situations, but this can be highly error prone and often proves too laborious and time consuming to be practical.
Since nuclear segmentation is not straightforward due to cell deformations, irregularity in the shape and size of nuclei, debris from sample preparations or culture conditions, imaging artifacts, and, most noticeably, noise and blurring, several groups have resorted to developing their own methods. Many segmentation methods have been applied in the context of embryogenesis and cell culture studies. They can be categorized by their underlying image processing technique. Deformable models (Yu et al., 2009; Zanella et al., 2010) are usually computationally expensive and not suitable for 3D data. Blob or local maximum detection (Bao et al., 2006; Keller et al., 2008, 2010) is computationally efficient but subject to shrinking bias, which technically serves the purpose of detection rather than segmentation. Segmentation by gradient flow tracking is very sensitive to object texture (Li et al., 2007). The Watershed method is also fast yet produces loose boundaries that cover the background (Fernandez et al., 2010; Olivier et al., 2010). Discrete Markov random field optimization allows for incorporation of prior information such as shape (X.L. et al., 2012, IEEE, conference), but the underlying pipeline is overly complicated and, thus, impractical. It is important to note the growing trend of developing generic, trainable software frameworks that are based on machine learning methods that can interact with biologists and solve a variety of problems (Carpenter et al., 2006; A. Sommer et al., 2011, IEEE, symposium). However, the tradeoff for such generality is specificity. These tools usually do not capture the very essential characteristics of nuclear imaging and so do not provide a precise analysis and quantitation.
To meet this current need, our goal was to develop a tool that would make automated cell segmentation feasible and efficient in analyzing data from higher organisms, as has been applied to less complex data from lower organisms, such as in bacteria (Locke and Elowitz, 2009). The objective was to assemble a segmentation framework that is accurate enough to allow high-fidelity analysis over a variety of images while being robust enough to make it practical for routine use across laboratories. A major goal was that the software had to be a simple and intuitive application that could run on a desktop computer having routine processing power. Usability is a particularly important feature that we sought to incorporate in modular interactive nuclear segmentation (MINS), as this has been raised as an important issue for bioimaging software development (Carpenter et al., 2012). We wanted to allow biological researchers to analyze large 3D imaging data with only a few mouse clicks and minimum parameter tuning.
Here, we report an efficient and user-friendly nuclear segmentation and quantitation framework (i.e., MINS) for the analysis of cohorts of cells in both stem cell cultures and in preimplantation stage mouse embryos. Our method consists of three core cascaded modules: detection, segmentation, and classification. Detection provides accurate localization of cell nuclei only. Segmentation expands the detection output to cover the full nuclear body. Finally, classification serves multiple purposes, including the separation of multiple embryos and removal of outliers, as well as the classification of inner and outer cells (ICM versus TE cells) within blastocyst-stage embryos. MINS is hosted at http://katlab-tools.org.
Results
Core Algorithmic Components of MINS
We chose specimens of increasing complexity for analysis using MINS software (Figure 1C). Mouse XEN stem cells representing the PrE lineage of the blastocyst grow as adherent monolayer cultures (Artus et al., 2012; Kunath et al., 2005; Niakan et al., 2013). By contrast, mouse ES cells grow as adherent multilayered dome-shaped cultures (Nichols and Smith, 2011). Like ES cells, preimplantation mouse embryos comprise spatially complex cohorts of cells (Rossant and Tam, 2009). A direct segmentation of every nucleus is computationally difficult and also error prone; for example, the active contour method is prone to undersegmentation (Roeder et al., 2012). We therefore opted to break down the problem into two steps: a detection module that identifies each nucleus followed by a segmentation module that propagates this ID information to the entire body of the respective nucleus. We also added a classification module for TE versus ICM cell lineage ID, which was based on inner versus outer cell position, respectively, within preimplantation mouse embryos (Figure 1D).
In brief, the core of MINS consists of three algorithmic components: detection, segmentation, and classification. Each component was devised and tailored according to the specific characteristics of cell culture and mouse embryo imaging experiments. The underlying algorithms are chosen so that the overall pipeline satisfies our goals: high performance and high usability.
Step 1: Detection
For the detection of nuclei, we applied the multiscale blob detection technique developed previously (X.L. et al., 2012, IEEE, conference). It uses the very robust eigenvalue of the image Hessian matrix to identify nuclei and also uses scale-space analysis to suppress noise because noise does not yield stable response across different scales, in contrast to real nuclei, which do. A connected component analysis assigns a unique ID to each nucleus for retrospective ID. Given a 3D image that contains bloblike objects (e.g., nuclei; Figure 2A), we start by smoothing the image with a Gaussian kernel and compute the eigenvalues at each pixel, which, if they are all negative, indicate that the pixel belongs to a local region of strong intensity, i.e., the central region of a nucleus (Figures 2B1 and 2B2). We then threshold these eigenvalues to obtain a binary mask of foreground nuclei (Figure 2C). This process is repeated using different kernel widths of the smoothing Gaussian kernels (Figure 2Ci [small], Figure 2Cii [medium], and Figure 2Ciii [large]). By combing the results from all scales (a logic AND operation), we leverage the advantages provided by each size of kernel in terms of robustness against noise and detection accuracy.
Figure 2.
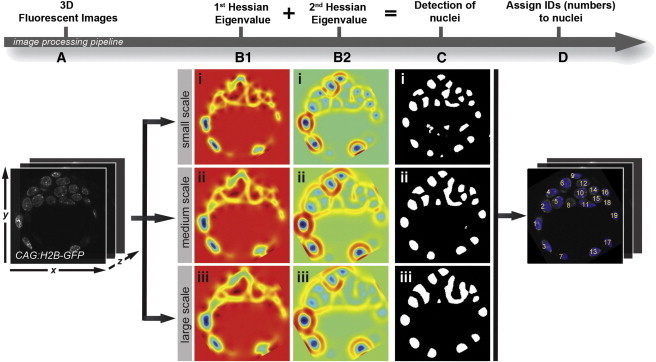
Procedure for Nuclei Detection and ID
(A) Users provide an input image from, for example, a mouse embryo, as shown here.
(B1 and B2) The first (B1) and second (B2) eigenvalues of the Hessian matrix are computed from the smoothed image at different scales.
(C) A binary segmentation is obtained by thresholding the respective eigenvalues in (B1) and (B2).
(D) The final detection is obtained by combining the binary segmentations in (C), and each nucleus is assigned with a unique number using connected component analysis.
Step 2: Segmentation
After ID of each nucleus, the next task is to propagate this ID to the entire body of a respective nucleus. We present three examples of this module in Figure 3 (see additional details in Supplemental Information available online). To do this, we chose seeded geodesic image segmentation (SGIS) as the base algorithm because of its runtime efficiency (A. Criminisi et al., 2008, European Conference on Computer Vision). Geodesic image segmentation applies a geodesic distance transform over a grid graph that represents the image. In particular, the geodesic distance between two nodes is the shortest path over a grid graph where the edges are weighted according to the continuity of neighboring pixels (normally based on the intensity gradient). Therefore, geodesic image segmentation is also referred to as the shortest path segmentation. Notably, the geodesic distance accounts for the “landscape” of the image; that is, the change in intensity between neighboring pixels along the path. Intuitively, two pixels will be considered “far” from one another if an edge (represented by a large intensity change) exists between them. Assuming a homogeneous intensity distribution within a nucleus, this technique allows one to efficiently expand the detection (a.k.a. seed) to the entire body of the nucleus, but not beyond, because of the existence of the boundary of the nucleus (edge). However, hundreds of identified nuclei could be present in the same image; thus, SGIS would run on each of them sequentially. To speed up this procedure, we developed a parallel SGIS based on graph coloring (PSGIS-GC). This propagates multiple IDs simultaneously in a single SGIS run. However, if nuclei in the same SGIS run are proximate, then they will be merged into one nucleus, causing undersegmentation. This issue was addressed using graph coloring, which assures that (1) proximate nuclei are always assigned to different SGIS runs, and (2) the total number of SGIS runs is minimized. This strategy significantly increases speed: we only need at most eight SGIS runs (parallelized in multicore systems) rather than hundreds of SGIS runs as in the naive (or sequential) approach, in which one has to run SGIS per seed against the other seeds.
Figure 3.
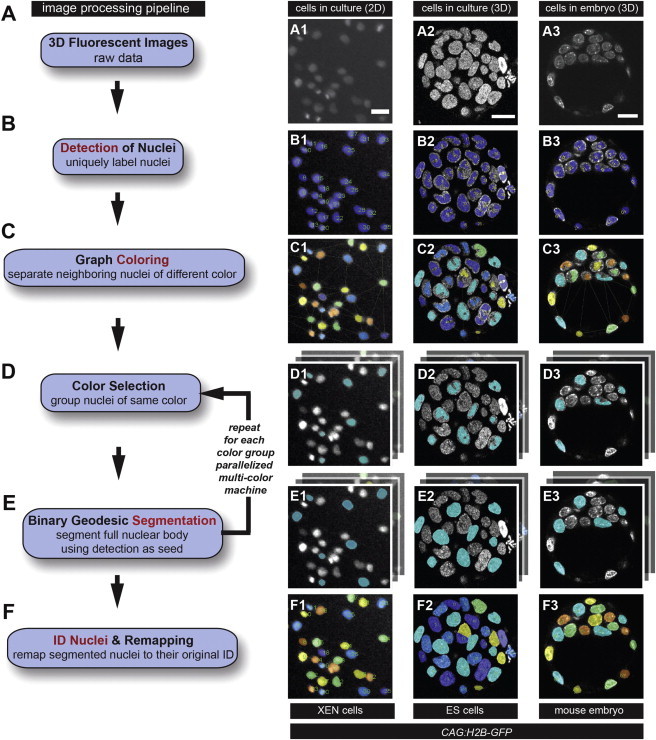
Flow Diagram of Proposed Algorithm for Nuclear Segmentation
(A) Users provide an input image from either cell culture imaging, in columns (A1) and (A2), or live embryo imaging, in column (A3).
(B) Detection is performed to locate each nucleus.
(C) Graph coloring is used to separate proximate nuclei by assigning different colors to them.
(D and E) Iteratively, a color is selected (D), and geodesic segmentation is called to segment the entire body of the nuclei (E).
(F) The final segmentation is obtained by combining the segmentations from (E). Scale bar, 20 μm.
Step 3: Classification
Once nuclei have been efficiently segmented, additional challenges during the analysis need to be tackled. First, multiple specimens (i.e., embryos) may be in the same image; this is especially common during 3D time-lapse movies where cohorts of embryos are simultaneously imaged (Figure 4A). Second, false detections exist due to noise and background disturbance (Figure 4B). Finally, as the cell position within the mouse embryo determines its developmental outcome, cells need to be classified into either inner cells within the specimen, which constitute ICM and contribute to the embryo proper, or outer cells, which are allocated to the TE lineage (Figure 5).
Figure 4.
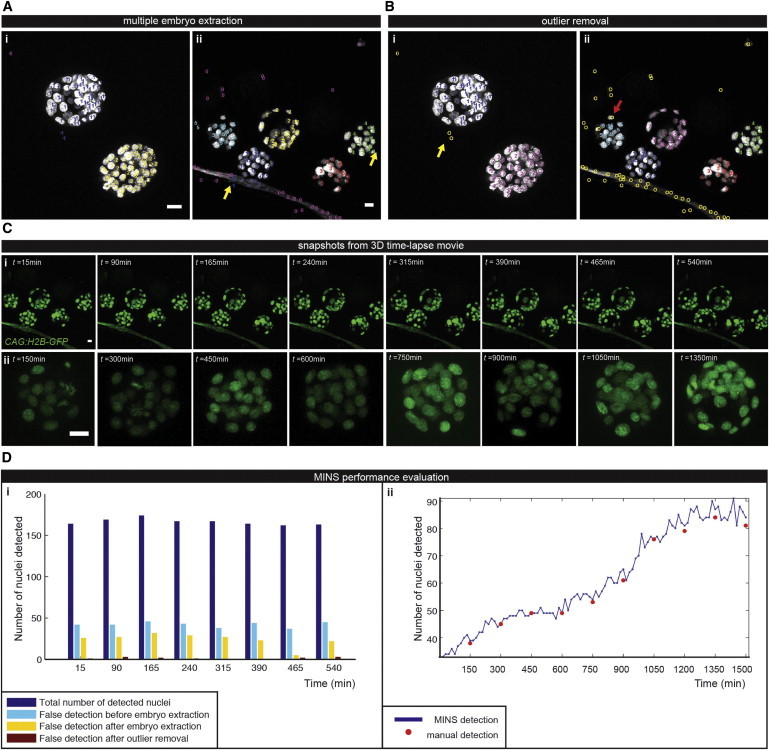
Multistep Classification: Multiple Embryo Extraction and Outlier Removal
(A) The embryo separation algorithm successfully detects two embryos in (i) and five embryos in (ii). False detections from the background are mistaken for true embryonic cell nuclei (yellow arrows).
(B) Outlier removal discards most of false detections (yellow arrows). True cell nuclei can be misclassified as outliers if they are located at the embryo boundary (red arrow).
(C) Maximum intensity projections at single time points 3D time-lapse movie over (i) a 540 min period and (ii) a 1500 min period.
(D) Performance evaluation of (i) multiple embryo extraction with outlier removal on the data set described in (C) and (ii) nuclear segmentation over an extended period. Scale bar, 20μm.
Figure 5.
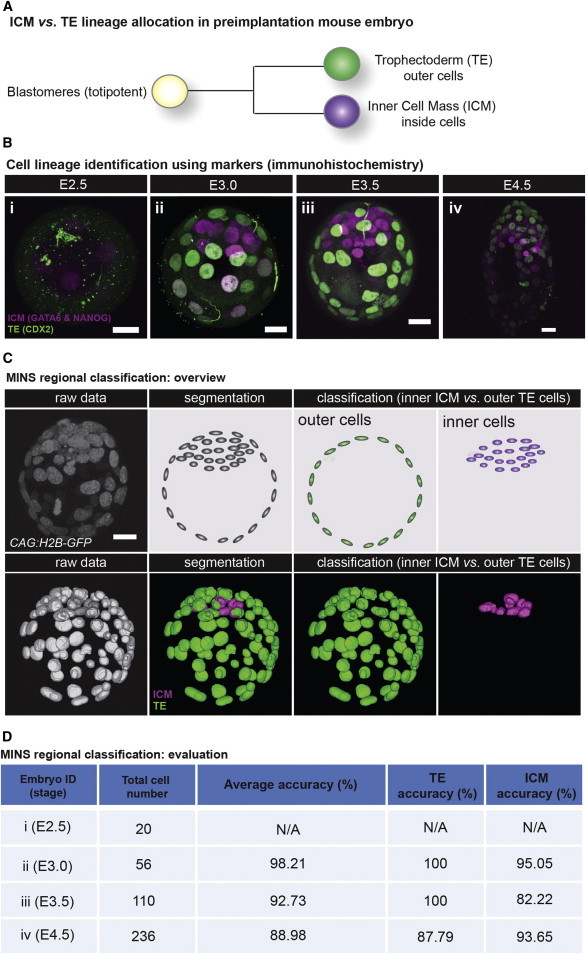
Multistep Classification: TE versus ICM Classification
(A) Schematic of TE versus ICM lineage allocation in preimplantation mouse embryo.
(B) Preimplantation embryos over various stages immunostained with TE (CDX2, green) and ICM (NANOG and GATA6, magenta) markers.
(C) Schematic diagram of TE versus ICM classification procedure by MINS.
(D) Performance evaluation of lineage classification. Scale bar, 20 μm.
Embryo Separation
We followed a clustering-based approach to extract multiple embryos in the same image (Figure 4A). This problem becomes difficult when false detections emerge from a noisy background (Figure 4B). Therefore, local distance-based clustering techniques such as k-means or spectral clustering are inappropriate. Instead, we used mean-shift (Comaniciu and Meer, 2002) which is a mode-seeking method that fits a “template” (a kernel) to the image. In our case, the kernel is a Gaussian, and the key is noticing that the width of the kernel naturally corresponds to the embryo size.
Outlier Removal
Outlier removal is performed per embryo using a robust shape-fitting approach and ellipse as the underlying shape model. Our approach consists of two ingredients: random sample consensus (referred to as RANSAC; Fischler and Bolles, 1981) and 2D/3D ellipse fitting (see Supplemental Information for details).
ICM/TE Classification in Blastocysts
After removal of outliers, the remaining nuclei are to be classified into either ICM or TE cells. Briefly, we fitted an ellipsoidal model to the detections, and this ellipse essentially describes the surface of the embryo. Considering this ellipsoid as a function, after fitting, the surface of the ellipsoid is of value 1 and the center of the ellipsoid (i.e., the embryo) is of value 0. Therefore, ICM cells are those whose center is of a value lower than 0.95, while the rest are considered TE cells.
Performance Evaluation
Segmentation Accuracy
To judge whether a segmented nucleus is truly meaningful, we followed the following criterion throughout evaluation: a segmented nucleus is considered meaningful if the automated segmentation has at least 75% overlap with the manual segmentation. This percentage overlap provides a rough estimate to justify whether a segmented nucleus is quantitatively useful, which mainly takes into account its size. Moreover, this threshold is expected to be sufficient for resolving phenotypes among various embryonic genotypes, even though a sufficient number of differently genetically manipulated embryos will, in practice, be necessary for a detailed analysis. We performed a manual evaluation by first overlaying the MINS output on top of the raw image and then recording all errors (missing, false-positive, etc.), which were used to compute the following basic metrics: number of segmented nuclei, ; number of true segmentation, (i.e., true-positive); number of false segmentation, (i.e., false-positive); and number of missing nuclei, (i.e., false-negative). Given the true number of nuclei, , we further compute precision , recall , and f score (which equals the harmonic mean of precision and recall). The results on 2D and 3D data sets are shown in Table S1 and Table S2.
Multiple Embryo Extraction
We evaluated our multiple embryo extraction approach on two types of data sets. The first type contains two embryos of large size (radius, 120 pixels) and has a clean background (Figure 4Ai). The second type is more challenging, with five embryos and a significant background structure (Figure 4Aii). In each image, segmented nuclei are highlighted with its embryo ID. Although all embryos are successfully separated, not all resulting embryos are clean because of false detections from the background structure (yellow arrows in Figure 4). We addressed this issue in the next outlier removal step.
Outlier Removal
We evaluated our outlier removal approach on 2D and 3D data. As shown in Figure 4, outliers are marked “O” in yellow. Our approach can separate true cell nuclei from false detections. Direct comparison between Figure 4A and Figure 4B immediately indicates the improvement. Occasionally, true cell nuclei are misclassified as outliers if they are located at the embryo boundary (red arrow in Figure 4Bii). Overall, application of embryo extraction and outlier removal successfully discarded false detections. Figure 4D quantitatively shows the step-by-step effect on eight images (Figure 4C) from 4D mouse embryo image data.
TE versus ICM Cell Classification
We evaluated our TE/ICM classification approach on four data sets with different density and embryo shape (Figure 5D). Quantitatively, we achieved an average accuracy of 93.30 ± 4.64 (n = 3).
Data Interfaces and Graphical User Interface
Data Import
To be compatible with the common formats provided by major imaging vendors, we used Bio-Formats as a Java library that reads most common file formats (Linkert et al., 2010).
Graphical User Interface
We designed a straightforward graphical user interface (GUI) that guides users through the entire processing pipeline (Figures 6A–6C). After each step, users can visualize the result and decide whether they want to proceed to the next step or refine the current one. Users are also allowed to save or load their specific parameterization at any given stage. The interface only requires four key parameters from the users: (1) average nuclear radius, (2) noise threshold, (3) embryo diameter, and (4) number of embryos for classification. We also implemented batch processing to automatically process large quantities of data sets using the same parameter set. See the detailed parameter selection guide in the Supplemental Information.
Figure 6.
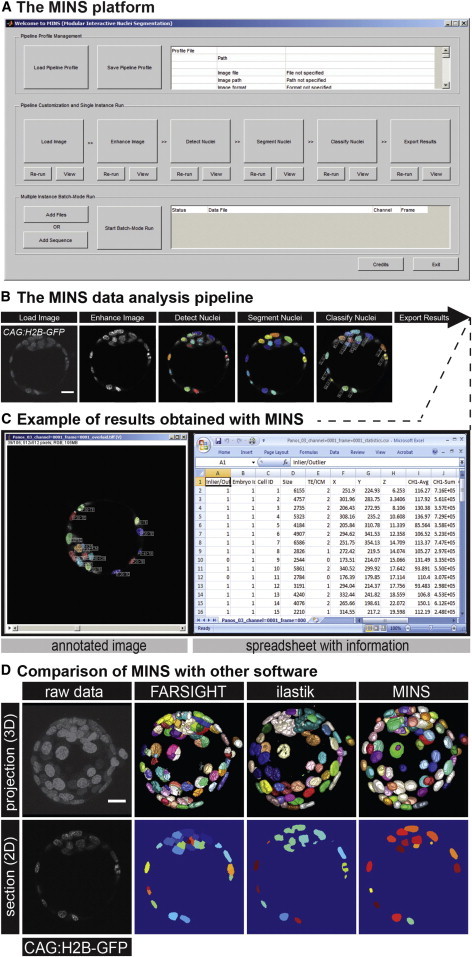
Overview of the MINS Platform and Its Comparison with Related Tools
(A) The main GUI of MINS. The top boxes contain functions for parameter loading and saving. The middle boxes correspond to the entire processing pipeline. The bottom boxes allow batch processing on a large number of data sets.
(B) The processing pipeline and the output of each modules.
(C) Detailed outputs ease any downstream analyses, either manually or by integration with other software tools. Overlay of segmentation and raw data allow rapid and straightforward inspection of the results. A segmentation information summary provides easy access to quantitation results.
(D) Top: volume rendering of a raw 3D CAG:H2B-GFP mouse embryo data set and the segmentation output generated by FARSIGHT, ilastik, and MINS. For each segmentation, each segmented object is assigned a unique color descriptor. Bottom: visualization of a 2D section of the same data set. Scale bar, 20 μm.
Export of Results
The segmentation and classification results are exported into images and a table. The segmentation image and overlay on the raw data (TIFF format) allows for simple inspection, validation of the results, and analysis using other software packages. The table provides a detailed summary of basic characteristics of each of the segmented nuclei (with information on size, position, etc.), quantitation (sum/average of fluorescence intensity from all channels in the data set), and classification (the embryo it belongs to, outlier or not, TE or ICM cell). MINS treats interphase, mitotic, and apoptotic nuclei equally, but using the output table, one can easily discern distinct types of nuclei. High-fluorescence intensity is usually associated with mitosis, while multiple objects with a reduced size are indicative of apoptotic bodies (Figure S1).
We and others have used the framework on various types of image data sets (2D and 3D) where it has accelerated phenotypic analysis (Le Bin et al., 2014). MINS software and a detailed user guide are hosted at http://katlab-tools.org for implementation by any users.
Comparison of MINS to Semiautomated Methods and Related Software Tools
We compared MINS against several popular tools in the community, including ilastik (http://www.ilastik.org), FARSIGHT (http://www.farsight-toolkit.org/wiki/FARSIGHT_Toolkit), and CellSegmentation3D (http://www.biomedcentral.com/1471-2121/8/40/additional). We tried multiple parameter sets for FARSIGHT and chose the best result. For the machine learning-based ilastik, no parameter tuning is required, but a training data set has to be created; this took 10 min. For our tool, after two rounds of parameter tuning, the result was satisfactory. For CellSegmentation3D, unfortunately after several round of trials, we did not manage to run through due to the limitation of the hardware to complete the processing. The top series of panels from Figure 6D depict the segmentation achieved by these tools on a typical 3D mouse blastocyst-stage embryo data set. It appears that both FARSIGHT and ilastik have difficulties segmenting the dense nuclear region, which corresponds to cells of the ICM. In addition, with FARSIGHT, the segmented boundary appears more rectangular, and it also erroneously splits some nuclei. On the other hand, ilastik shows significant undersegmentation and produces nuclei with holes inside. MINS appears more robust in dealing with those issues and achieves an accuracy of approximately 95%. By contrast, we found that the accuracy for FARSIGHT and ilastik was below 85%. MINS has been designed to serve the specific needs of the preimplantation embryo analysis beyond the basic segmentation function, such as embryo separation and cell classification. However, the quality of MINS data analysis is absolutely dependent on the quality of raw data itself. MINS shows decreases in the accuracy during the analysis of more developed or complex structures, such as embryos with more than 200 cells (Figure 5D). Therefore, it is important to apply MINS in various biological images or specimens to improve the algorithms.
Application of MINS Software for Segmentation and Quantitative Fluorescence Measurements
There is an imperative and growing need for quantitative analysis of fluorescently labeled cells within early embryos, as well as in stem cell populations. Our results suggest that MINS will accelerate this process. This is summarized in the following three practical applications.
First, we applied MINS on ES cell populations that have been cultured under different conditions (Figure 7A). It is well established that mouse ES cells grown in standard conditions (serum and leukemia inhibitory factor [LIF]) express the stem cell-associated transcription factor NANOG in a heterogeneous manner, reflecting the potential of cells within the population to remain pluripotent or to differentiate (Chambers et al., 2007; Kalmar et al., 2009). Using MINS, we measured the level of the pluripotency-associated factor NANOG after fluorescent immnunostaining. The measurements using MINS revealed a heterogeneous pattern of NANOG expression. When LIF is withdrawn from the culture media, ES cells are more prone to differentiate and thus express lower levels of NANOG. For these cells, MINS provided us with values indicative of their low NANOG expression status. Finally, it has been demonstrated that, by adding two signaling inhibitors (2i), stem cells are locked into a more homogeneous state of naive (or ground-state) pluripotency and express elevated levels of NANOG (Ying et al., 2008). Once again, analysis with MINS revealed that cells grown in these “2i” conditions expressed high levels of this transcription factor (Figure 7A).
Figure 7.
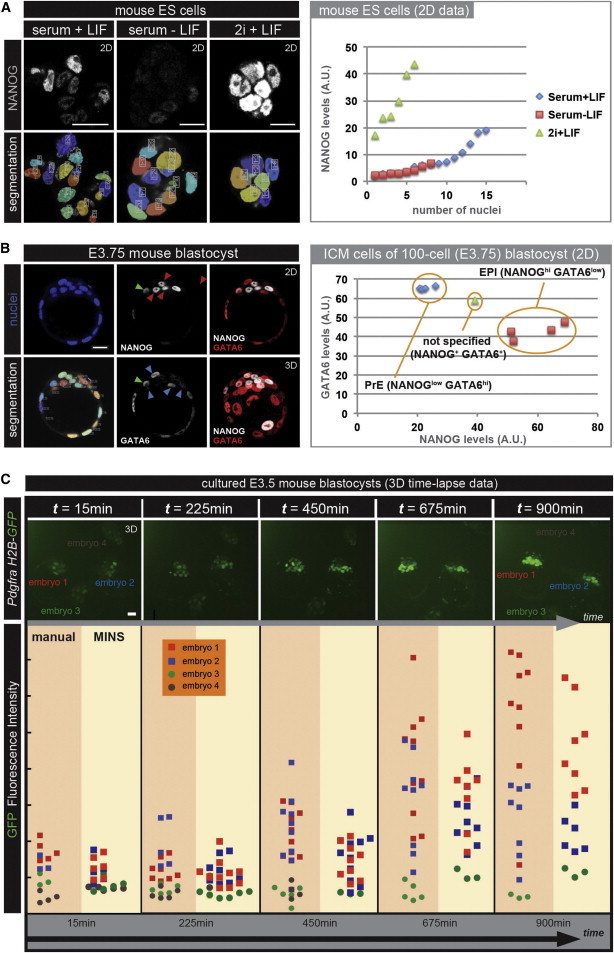
Application of MINS for Quantitative Fluorescent Measurements
(A) Nuclear segmentation and quantitative fluorescent measurements of mouse ES cells grown under different conditions that have been stained for the pluripotency-associated factor NANOG. Stem cells display a heterogeneous pattern of NANOG expression when grown under standard serum + LIF conditions (left column) but either downregulate its expression when LIF is absent (middle column) or markedly increase its expression in the presence of the 2i inhibitors (right column). Quantitative fluorescent measurements via MINS are indicative of the culture conditions used (scatterplot at right).
(B) Nuclear segmentation and quantitative immunofluorescence of a 100-cell-stage embryo stained for the EPI-specific factor NANOG and the PrE-specific factor GATA6. There are two distinct population of cells within the ICM, either expressing high levels of GATA6 (blue arrowheads) or high levels of NANOG (red arrowheads). A single cell expresses similar levels of NANOG and GATA6 and could thus be categorized as unspecified for either EPI or PrE (green arrowhead). Quantitative fluorescent measurements via MINS are indicative of the two distinct cell populations within the ICM (scatterplot at the right).
(C) Comparison of quantitative analysis of 3D time-lapse imaging data performed either manually or with MINS software on embryos carrying the PdgfrαH2B-GFP reporter cultured ex utero. Select single time points from a representative 3D time-lapse movie are shown on the top row. GFP intensities of individual cells identified in each embryo at selected time points are shown at the scatterplot to the bottom. Scale bar, 20 μm.
We also evaluated the performance of MINS software in the analysis of early mouse embryos that had been fixed and immunostained for transcription factors associated with the two ICM lineages (Figure 1D), namely, the EPI and PrE. These two cell populations originate from a common pool of precursor cells within the ICM (Figure 1D). In approximately 100-cell-stage embryos, these lineages are segregated and are distinctly identified by the expression of NANOG in the EPI and GATA6 in the PrE (Chazaud et al., 2006; Plusa et al., 2008). Running MINS on fixed and stained 100-cell- stage embryo provided fluorescent measurement values that were indicative of two discrete populations (Figure 7B): one specified for EPI (NANOGhi; GATA6low) and another for PrE (NANOGlow; GATA6hi). Notably, the MINS analysis also allowed the unexpected ID of an unspecified cell that had not committed to the EPI or PrE lineages and that expressed both NANOG and GATA6 at comparable levels at this relatively late stage. While developing an understanding of this observation is outside the scope of the present study, it demonstrates the power of such a large-scale (hundreds to thousands of cells analyzed from tens to hundreds of embryos) single-cell resolution data analysis in revealing detailed information that is critical in the formulation of a mechanistic understanding of a process.
Finally, we applied MINS to analyze fluorescence intensity levels of cells in the ICMs of embryos cultured ex utero and imaged in 3D time lapse (i.e., 4D). This type of live imaging allows the visualization of the dynamics of lineage-specific gene expression. For this analysis, we used embryos carrying a nuclear fluorescent reporter cassette (H2B-GFP) targeted in the locus encoding the platelet-derived growth factor receptor alpha (PDGFRα), a marker for the PrE lineage (Plusa et al., 2008). We previously described that dynamic and heterogeneous populations with respect to PdgfrαH2B-GFP expression emerge; specifically, GFP-positive cells were initially positioned randomly within the ICM and are then sorted forming the epithelial PrE layer facing the blastocyst cavity (Kang et al., 2013a; Plusa et al., 2008). Moreover, as embryos developed and the PrE lineage is formed, GFP expression increased. Previously, this type of analysis was performed by manual or semiautomated nuclear segmentation using commercially available software and subsequent fluorescent quantitation measurements (Kang et al., 2013a). Consequently, this process was labor intensive, taking a total of between 15 and 20 hr to complete for the movie illustrated in Figure 7C. Conversely, by applying MINS to the same data, we found that comparable results were obtained, and notably, a significantly reduced amount of time was needed for the completion of the analysis (approximately 2 hr; Figure 7C).
Discussion
Motivated by the increasing need for quantitative analysis of image data from preimplantation mouse embryos for staging and phenotyping (Miyanari and Torres-Padilla, 2012; Plusa et al., 2008), we sought to develop a software tool that would allow simple rapid high-throughput semiautomated nuclear segmentation of image data varying from 2D to more complex 3D data sets. Here, we report the development of a tool that has been specifically trained and tailored for use on 3D preimplantation mouse embryo and stem cell data, cell number calculation for embryo staging, quantitative fluorescence at a single-cell level, and positional classification and nuclear size. Our framework achieves a balance between computational complexity and runtime. We use basic, simple operations that are suitable for the detection of nuclei and segmentation. In addition, we used parallel computing to fully exploit the potential of the modern multicore computer systems. This enables a 2D image to be processed in less than 10 s and a normal 3D image (for example, 512 × 512 × 100) to be processed in less than 3 min on a workstation such as an Intel Xeon, quad core, 2.4G Hz. It is important to note that batch processing allows the unsupervised processing of several data sets with the same settings.
More important, we have attempted to make the software user friendly and intuitive to use. MINS does not require users to create a pipeline comprising basic modules as in CellProfiler. Similarly, there is no need for any extra effort on training data as is the case for ilastik. Furthermore, MINS software can be easily coupled with other tools for downstream advanced visualization or analysis.
The applications of MINS software are multiple, as it allows single-cell measurements of confocal images. These include: (1) determination of cell number that, when applied to preimplantation mouse embryos, gives precise developmental staging; (2) quantitative documentation of nuclear size that can be used to monitor changes in size as development or differentiation progresses; (3) fluorescent intensity measurements that can be used as readouts of concentrations of specific proteins, in immunofluorescence data, or promoter activity, in fluorescent reporter-expressing cells or embryos; and (4) cell lineage allocation for mouse preimplantation embryos. It should be noted that, when quantitative fluorescent intensities are being determined, additional considerations should be taken into account during the acquisition of images and processing of the data. These include normalization, intensity loss compensation of, for example, confocal images, and background subtraction. These are nontrivial issues that will be addressed as the software is implemented and feedback is provided by the community.
It should be noted that we were interested in developing a tool, which, as a first step, would segment relatively simple stem cell or mammalian early embryo data sets. Thus far, we have only tested it on stem cell and preimplantation embryo samples. In principle, the software should be applicable to other types of data; however, we have not yet optimized the software for these data. Since the software will be freely available to download online, other researchers interested in using MINS for image analysis of their own biological samples will have the opportunity to test it and provide feedback.
Furthermore, although the design of MINS assumes a certain shape of nuclei (sphere or oval), segmentation by MINS is not limited to nuclei with those conformations. MINS accurately detects nuclei with condensed chromosomes or dividing nuclei during metaphase (Figure S1, yellow arrowhead). However, MINS does not distinguish these nuclei from interphase nuclei during the detection process; to this end, an increased signal intensity of these nuclei correctly reflects their mitotic status. In addition, apoptotic events, as recognized by nuclear debris, can occasionally be detected by MINS having a significantly lower volume (Figure S1, red arrowhead) compared to properly shaped nuclei (Figure S1, white arrowhead). Had we incorporated the ID of fragmenting nuclei, we would have reduced the efficiency of segmentation leading to oversegmentation of data.
Looking to the future, we envisage two key directions for improving the performance of the MINS software, as well as its availability to end users. First, user editing should be integrated within the pipeline, so that specific errors can be corrected after each step of the pipeline. For example, in the current version of the software, an error from the detection step cannot be fixed by the segmentation step, and user correction is needed. Second, in the future, the migration of the MINS software to the freely available python platform (http://www.python.org) will be important. This improvement will allow independence from the commercial MATLAB environment, making the software more readily accessible to a wider audience of users.
Experimental Procedures
Stem Cells and Mouse Strains
CAG:H2B-GFP mES cells have been described previously (Hadjantonakis and Papaioannou, 2004). XEN cells hemizygous for the CAG:H2B-GFP transgene were derived from CAG:H2B-GFP mouse embryos using standard protocols (Kunath et al., 2005; Niakan et al., 2013). Embryos were collected from CD-1 (Charles River) or CAG:H2B-GFP strains of mice (Hadjantonakis and Papaioannou, 2004). Additional details on ES and embryo culture and imaging are provided in the Supplemental Information. Mouse husbandry and all experiments were performed in accordance with Memorial Sloan Kettering Cancer Center Institutional Animal Care and Use Committee-approved protocols.
Software Implementation Details and Availability
MINS was implemented using a combination of MATLAB and C++. MATLAB serves as the high-level glue language that provides the GUI and also for construction of the overall pipeline. C++, on the other hand, was used to implement the underlying algorithms for better computational efficiency. All core algorithmic components are implemented in C++ and invoked in MATLAB as functions. Furthermore, some algorithms are paralleled including the PSGIS algorithm. The implementation has GUI support and is available to interested users. Additional technical details on the algorithms supporting MINS are provided in the Supplemental Information. MINS software and a detailed user guide are hosted at http://katlab-tools.org.
Currently, MINS runs on a PC with 64-bit Windows OS. Necessary supporting software includes MATLAB with the Image Processing and Statistics Toolboxes. Java Runtime Environment is also required. For segmenting large 3D data, we used an Intel Xeon Processor E5530 Quad Core 2.40 GHz with 24G memory.
Acknowledgments
We thank T. Fujimori and N. Schrode for providing data for analysis and J. Mackenzie, N. Saiz, and N. Schrode for feedback on the software and comments on the manuscript. Work in our laboratory is supported by the Human Frontiers Sciences Program, National Institutes of Health (RO1-HD052115 and RO1-DK084391) and NYSTEM.
Footnotes
This is an open-access article distributed under the terms of the Creative Commons Attribution-NonCommercial-No Derivative Works License, which permits non-commercial use, distribution, and reproduction in any medium, provided the original author and source are credited.
Contributor Information
Xinghua Lou, Email: xinghua.lou@gmail.com.
Anna-Katerina Hadjantonakis, Email: hadj@mskcc.org.
Supplemental Information
Side-by-side view of segmentation result on the DCellIQ sequence (3D). Quantitative results are provided in Table S1.
Side-by-side view of segmentation result on the Mitocheck sequence (2D). Quantitative results are provided in Table S1.
Side-by-side view of segmentation result on the MK volume (MK-1). Quantitative results are provided in Table S2.
Side-by-side view of segmentation result on the NS volume (NS-4). Quantitative results are provided in Table S2. This result shows the robustness of MINS against strong background.
Side-to-side view of segmentation result on the NS volume (NS-5). Quantitative results are provided in Table S2. This result shows the robustness of MINS against strong background.
Side-by-side view of segmentation result on the PX volume (PX-4). Quantitative results are provided in Table S2. This result shows ICM/TE classification on an ellipsoidal embryo.
Side-by-side view of segmentation result on the PX volume (PX-5). Quantitative results are provided in Table S2. This result shows ICM/TE classification on a round (e.g. blastocyst stage mouse) embryo.
References
- Artus J., Hadjantonakis A.K. Troika of the mouse blastocyst: lineage segregation and stem cells. Curr. Stem Cell Res. Ther. 2012;7:78–91. doi: 10.2174/157488812798483403. [DOI] [PMC free article] [PubMed] [Google Scholar]
- Artus J., Douvaras P., Piliszek A., Isern J., Baron M.H., Hadjantonakis A.K. BMP4 signaling directs primitive endoderm-derived XEN cells to an extraembryonic visceral endoderm identity. Dev. Biol. 2012;361:245–262. doi: 10.1016/j.ydbio.2011.10.015. [DOI] [PMC free article] [PubMed] [Google Scholar]
- Artus J., Kang M., Cohen-Tannoudji M., Hadjantonakis A.K. PDGF signaling is required for primitive endoderm cell survival in the inner cell mass of the mouse blastocyst. Stem Cells. 2013;31:1932–1941. doi: 10.1002/stem.1442. [DOI] [PMC free article] [PubMed] [Google Scholar]
- Bao Z., Murray J.I., Boyle T., Ooi S.L., Sandel M.J., Waterston R.H. Automated cell lineage tracing in Caenorhabditis elegans. Proc. Natl. Acad. Sci. USA. 2006;103:2707–2712. doi: 10.1073/pnas.0511111103. [DOI] [PMC free article] [PubMed] [Google Scholar]
- Carpenter A.E., Jones T.R., Lamprecht M.R., Clarke C., Kang I.H., Friman O., Guertin D.A., Chang J.H., Lindquist R.A., Moffat J. CellProfiler: image analysis software for identifying and quantifying cell phenotypes. Genome Biol. 2006;7:R100. doi: 10.1186/gb-2006-7-10-r100. [DOI] [PMC free article] [PubMed] [Google Scholar]
- Carpenter A.E., Kamentsky L., Eliceiri K.W. A call for bioimaging software usability. Nat. Methods. 2012;9:666–670. doi: 10.1038/nmeth.2073. [DOI] [PMC free article] [PubMed] [Google Scholar]
- Chambers I., Silva J., Colby D., Nichols J., Nijmeijer B., Robertson M., Vrana J., Jones K., Grotewold L., Smith A. Nanog safeguards pluripotency and mediates germline development. Nature. 2007;450:1230–1234. doi: 10.1038/nature06403. [DOI] [PubMed] [Google Scholar]
- Chazaud C., Yamanaka Y., Pawson T., Rossant J. Early lineage segregation between epiblast and primitive endoderm in mouse blastocysts through the Grb2-MAPK pathway. Dev. Cell. 2006;10:615–624. doi: 10.1016/j.devcel.2006.02.020. [DOI] [PubMed] [Google Scholar]
- Comaniciu D., Meer P. Mean shift: A robust approach toward feature space analysis. Pattern Analysis and Machine Intelligence. IEEE Trans. Biomed. Eng. 2002;24:603–619. [Google Scholar]
- Fernandez R., Das P., Mirabet V., Moscardi E., Traas J., Verdeil J.L., Malandain G., Godin C. Imaging plant growth in 4D: robust tissue reconstruction and lineaging at cell resolution. Nat. Methods. 2010;7:547–553. doi: 10.1038/nmeth.1472. [DOI] [PubMed] [Google Scholar]
- Fischler M.A., Bolles R.C. Random sample consensus: a paradigm for model fitting with applications to image analysis and automated cartography. Commun. ACM. 1981;24:381–395. [Google Scholar]
- Guo G., Huss M., Tong G.Q., Wang C., Li Sun L., Clarke N.D., Robson P. Resolution of cell fate decisions revealed by single-cell gene expression analysis from zygote to blastocyst. Dev. Cell. 2010;18:675–685. doi: 10.1016/j.devcel.2010.02.012. [DOI] [PubMed] [Google Scholar]
- Hadjantonakis A.K., Papaioannou V.E. Dynamic in vivo imaging and cell tracking using a histone fluorescent protein fusion in mice. BMC Biotechnol. 2004;4:33. doi: 10.1186/1472-6750-4-33. [DOI] [PMC free article] [PubMed] [Google Scholar]
- Kalmar T., Lim C., Hayward P., Muñoz-Descalzo S., Nichols J., Garcia-Ojalvo J., Martinez Arias A. Regulated fluctuations in nanog expression mediate cell fate decisions in embryonic stem cells. PLoS Biol. 2009;7:e1000149. doi: 10.1371/journal.pbio.1000149. [DOI] [PMC free article] [PubMed] [Google Scholar]
- Kanda T., Sullivan K.F., Wahl G.M. Histone-GFP fusion protein enables sensitive analysis of chromosome dynamics in living mammalian cells. Curr. Biol. 1998;8:377–385. doi: 10.1016/s0960-9822(98)70156-3. [DOI] [PubMed] [Google Scholar]
- Kang M., Piliszek A., Artus J., Hadjantonakis A.K. FGF4 is required for lineage restriction and salt-and-pepper distribution of primitive endoderm factors but not their initial expression in the mouse. Development. 2013;140:267–279. doi: 10.1242/dev.084996. [DOI] [PMC free article] [PubMed] [Google Scholar]
- Kang M., Xenopoulos P., Muñoz-Descalzo M., Lou X., Hadjantonakis A.K. Live imaging, identifying and tracking single cells in complex populations in vivo and ex vivo. In: Turksen K., editor. Methods in Molecular Biology. Springer-Verlag; New York: 2013. pp. 109–123. [DOI] [PMC free article] [PubMed] [Google Scholar]
- Keller P.J., Schmidt A.D., Wittbrodt J., Stelzer E.H. Reconstruction of zebrafish early embryonic development by scanned light sheet microscopy. Science. 2008;322:1065–1069. doi: 10.1126/science.1162493. [DOI] [PubMed] [Google Scholar]
- Keller P.J., Schmidt A.D., Santella A., Khairy K., Bao Z., Wittbrodt J., Stelzer E.H. Fast, high-contrast imaging of animal development with scanned light sheet-based structured-illumination microscopy. Nat. Methods. 2010;7:637–642. doi: 10.1038/nmeth.1476. [DOI] [PMC free article] [PubMed] [Google Scholar]
- Kuijk E.W., van Tol L.T., Van de Velde H., Wubbolts R., Welling M., Geijsen N., Roelen B.A. The roles of FGF and MAP kinase signaling in the segregation of the epiblast and hypoblast cell lineages in bovine and human embryos. Development. 2012;139:871–882. doi: 10.1242/dev.071688. [DOI] [PMC free article] [PubMed] [Google Scholar]
- Kunath T., Arnaud D., Uy G.D., Okamoto I., Chureau C., Yamanaka Y., Heard E., Gardner R.L., Avner P., Rossant J. Imprinted X-inactivation in extra-embryonic endoderm cell lines from mouse blastocysts. Development. 2005;132:1649–1661. doi: 10.1242/dev.01715. [DOI] [PubMed] [Google Scholar]
- Le Bin G.C., Muñoz-Descalzo S., Kurowski A., Leitch H., Lou X., Mansfield W., Etienne-Dumeau C., Grabole N., Mulas C., Niwa H., Hadjantonakis A.K., Nichols J. Oct4 is required for lineage priming in the developing inner cell mass of the mouse blastocyst. Development. 2014;141:1001–1010. doi: 10.1242/dev.096875. Published online February 6, 2014. [DOI] [PMC free article] [PubMed] [Google Scholar]
- Li G., Liu T., Tarokh A., Nie J., Guo L., Mara A., Holley S., Wong S.T. 3D cell nuclei segmentation based on gradient flow tracking. BMC Cell Biol. 2007;8:40. doi: 10.1186/1471-2121-8-40. [DOI] [PMC free article] [PubMed] [Google Scholar]
- Linkert M., Rueden C.T., Allan C., Burel J.M., Moore W., Patterson A., Loranger B., Moore J., Neves C., Macdonald D. Metadata matters: access to image data in the real world. J. Cell Biol. 2010;189:777–782. doi: 10.1083/jcb.201004104. [DOI] [PMC free article] [PubMed] [Google Scholar]
- Locke J.C., Elowitz M.B. Using movies to analyse gene circuit dynamics in single cells. Nat. Rev. Microbiol. 2009;7:383–392. doi: 10.1038/nrmicro2056. [DOI] [PMC free article] [PubMed] [Google Scholar]
- Miyanari Y., Torres-Padilla M.E. Control of ground-state pluripotency by allelic regulation of Nanog. Nature. 2012;483:470–473. doi: 10.1038/nature10807. [DOI] [PubMed] [Google Scholar]
- Muñoz Descalzo S., Rué P., Garcia-Ojalvo J., Martinez Arias A. Correlations between the levels of Oct4 and Nanog as a signature for naïve pluripotency in mouse embryonic stem cells. Stem Cells. 2012;30:2683–2691. doi: 10.1002/stem.1230. [DOI] [PubMed] [Google Scholar]
- Niakan K.K., Eggan K. Analysis of human embryos from zygote to blastocyst reveals distinct gene expression patterns relative to the mouse. Dev. Biol. 2013;375:54–64. doi: 10.1016/j.ydbio.2012.12.008. [DOI] [PubMed] [Google Scholar]
- Niakan K.K., Schrode N., Cho L.T., Hadjantonakis A.K. Derivation of extraembryonic endoderm stem (XEN) cells from mouse embryos and embryonic stem cells. Nat. Protoc. 2013;8:1028–1041. doi: 10.1038/nprot.2013.049. [DOI] [PMC free article] [PubMed] [Google Scholar]
- Nichols J., Smith A. The origin and identity of embryonic stem cells. Development. 2011;138:3–8. doi: 10.1242/dev.050831. [DOI] [PubMed] [Google Scholar]
- Nowotschin S., Eakin G.S., Hadjantonakis A.K. Live-imaging fluorescent proteins in mouse embryos: multi-dimensional, multi-spectral perspectives. Trends Biotechnol. 2009;27:266–276. doi: 10.1016/j.tibtech.2009.02.006. [DOI] [PMC free article] [PubMed] [Google Scholar]
- Ohnishi Y., Huber W., Tsumura A., Kang M., Xenopoulos P., Kurimoto K., Oles A.K., Arauzo-Bravo M.J., Saitou M., Hadjantonakis A.K. Cell-to-cell expression variability followed by signal reinforcement progressively segregates early mouse lineages. Nat. Cell Biol. 2014;16:27–37. doi: 10.1038/ncb2881. [DOI] [PMC free article] [PubMed] [Google Scholar]
- Olivier N., Luengo-Oroz M.A., Duloquin L., Faure E., Savy T., Veilleux I., Solinas X., Débarre D., Bourgine P., Santos A. Cell lineage reconstruction of early zebrafish embryos using label-free nonlinear microscopy. Science. 2010;329:967–971. doi: 10.1126/science.1189428. [DOI] [PubMed] [Google Scholar]
- Plusa B., Piliszek A., Frankenberg S., Artus J., Hadjantonakis A.K. Distinct sequential cell behaviours direct primitive endoderm formation in the mouse blastocyst. Development. 2008;135:3081–3091. doi: 10.1242/dev.021519. [DOI] [PMC free article] [PubMed] [Google Scholar]
- Roeder A.H., Cunha A., Burl M.C., Meyerowitz E.M. A computational image analysis glossary for biologists. Development. 2012;139:3071–3080. doi: 10.1242/dev.076414. [DOI] [PubMed] [Google Scholar]
- Roode M., Blair K., Snell P., Elder K., Marchant S., Smith A., Nichols J. Human hypoblast formation is not dependent on FGF signalling. Dev. Biol. 2012;361:358–363. doi: 10.1016/j.ydbio.2011.10.030. [DOI] [PMC free article] [PubMed] [Google Scholar]
- Rossant J., Tam P.P. Blastocyst lineage formation, early embryonic asymmetries and axis patterning in the mouse. Development. 2009;136:701–713. doi: 10.1242/dev.017178. [DOI] [PubMed] [Google Scholar]
- Schrode N., Xenopoulos P., Piliszek A., Frankenberg S., Plusa B., Hadjantonakis A.K. Anatomy of a blastocyst: cell behaviors driving cell fate choice and morphogenesis in the early mouse embryo. Genesis. 2013;51:219–233. doi: 10.1002/dvg.22368. [DOI] [PMC free article] [PubMed] [Google Scholar]
- Ying Q.L., Wray J., Nichols J., Batlle-Morera L., Doble B., Woodgett J., Cohen P., Smith A. The ground state of embryonic stem cell self-renewal. Nature. 2008;453:519–523. doi: 10.1038/nature06968. [DOI] [PMC free article] [PubMed] [Google Scholar]
- Yu W., Lee H.K., Hariharan S., Bu W., Ahmed S. Quantitative neurite outgrowth measurement based on image segmentation with topological dependence. Cytometry A. 2009;75:289–297. doi: 10.1002/cyto.a.20664. [DOI] [PubMed] [Google Scholar]
- Zanella C., Campana M., Rizzi B., Melani C., Sanguinetti G., Bourgine P., Mikula K., Peyrieras N., Sarti A. Cells segmentation from 3-D confocal images of early zebrafish embryogenesis. IEEE Trans. Image Process. 2010;19:770–781. doi: 10.1109/TIP.2009.2033629. [DOI] [PubMed] [Google Scholar]
Associated Data
This section collects any data citations, data availability statements, or supplementary materials included in this article.
Supplementary Materials
Side-by-side view of segmentation result on the DCellIQ sequence (3D). Quantitative results are provided in Table S1.
Side-by-side view of segmentation result on the Mitocheck sequence (2D). Quantitative results are provided in Table S1.
Side-by-side view of segmentation result on the MK volume (MK-1). Quantitative results are provided in Table S2.
Side-by-side view of segmentation result on the NS volume (NS-4). Quantitative results are provided in Table S2. This result shows the robustness of MINS against strong background.
Side-to-side view of segmentation result on the NS volume (NS-5). Quantitative results are provided in Table S2. This result shows the robustness of MINS against strong background.
Side-by-side view of segmentation result on the PX volume (PX-4). Quantitative results are provided in Table S2. This result shows ICM/TE classification on an ellipsoidal embryo.
Side-by-side view of segmentation result on the PX volume (PX-5). Quantitative results are provided in Table S2. This result shows ICM/TE classification on a round (e.g. blastocyst stage mouse) embryo.