

Abstract
The assembly of 30S ribosomes requires the precise addition of 20 proteins to the 16S ribosomal RNA. How early binding proteins change the rRNA structure so that later proteins may join the complex is poorly understood. Here we use single molecule fluorescence resonance energy transfer (smFRET) to observe real-time encounters between ribosomal protein S4 and the 16S 5′ domain RNA at an early stage of 30S assembly. Dynamic initial S4-RNA complexes pass through a stable non-native intermediate before converting to the native complex, showing that non-native structures can offer a low free energy path to protein-RNA recognition. Three-color FRET and molecular dynamics (MD) simulations reveal how S4 changes the frequency and direction of RNA helix motions, guiding a conformational switch that enforces the hierarchy of protein addition. This protein-guided dynamics offers an alternative explanation for induced fit in RNA-protein complexes.
The ribosome is a large cellular complex that synthesizes proteins. During assembly of the small (30S) subunit of the E. coli ribosome, 20 ribosomal proteins associate with the 16S rRNA in a defined hierarchy1–3 that arises from protein-induced changes in the structure of the rRNA4. Despite progress in visualizing ribosome assembly intermediates5, the physical basis for cooperative assembly is poorly understood because it depends on short-lived conformational states6. The simplest model is that early binding proteins capture the native structure of a helix junction7–9, pre-organizing adjacent helices so that additional proteins can join the complex10,11. Time-resolved footprinting of 30S assembly showed that some ribosomal proteins contact their rRNA binding-site in stages12, however, indicating that proteins do not capture the folded structure of the rRNA, but remodel it over time. Remodeling of early protein-RNA interactions has important implications for further stages of assembly.
To understand how proteins remodel the rRNA structure, we probed the motions between the rRNA and ribosomal protein S4 (Fig. 1) in real time using smFRET13. smFRET was previously used to observe the Mg2+- or ribosomal protein S15-dependent conformational change of a three-helix rRNA element of the 30S ribosome7. Here, we use two- and three-color FRET to determine the direction of helix motions as S4 binds a 542-nt rRNA fragment.
Figure 1. Fluctuations during early ribosome assembly.

a, Protein S4 (tan surface) bound to the 16S rRNA in the E. coli 30S ribosome (2I2P). 5WJ colored in the ribbon and 16S schematic; rest of 5′ domain, black. S12 (dark red) binds the 50S interface side of 5WJ in the mature 30S ribosome. b, Labeling positions for FRET between S4-Cy3 (green sphere) and 5′domain h3-Cy5 (red sphere). C507 in the h18 pseudoknot is in magenta. c, smFRET traces show two state fluctuations in the distance between S4 and h3. Green: Cy3 fluorescence; red: Cy5 fluorescence; blue: FRET efficiency. The trace at 4 mM Mg2+ exhibits frequent S4 binding and dissociation. d, FRET histograms of wild-type complex in 20 and 4 mM Mg2+ and mutant RNAs in 20 mM Mg2+. Δh18loop lacks the teal region in (a). e, Stacking interactions by A397 and A499 stabilize the h3-h18 junction in the ribosome.
S4 is one of the first proteins to bind the rRNA14, and nucleates 30S ribosome assembly15 by folding a five-way junction (5WJ) in the 16S 5′ domain (Fig. 1a). Footprinting and mutagenesis results showed that the S4–5′ domain complex recapitulates the native 30S protein-rRNA interactions16,17 and is a substrate for further steps of assembly. S4 binding stabilizes the folded 5WJ17, and a conserved pseudoknot between h18 and its internal loop (teal; Fig. 1a, b)18,19 that are crucial for translation fidelity20. Conserved nucleotides in the h18 internal loop only fold correctly after S4 has bound18,19.
RNA helix dynamics in S4-rRNA complexes
To observe internal motions in the S4-rRNA complex, we labeled S4 with a donor fluorophore, Cy3, via an engineered single cysteine (Methods). We also labeled the 5′ domain RNA by annealing a Cy5-conjugated oligonucleotide to a 3′ extension of 16S h3 helix (5′dom-h3). We labeled h3 because it docks under the h18 pseudoknot and contacts S4 in the mature 30S ribosome (Fig. 1b), yet was proposed to point away from h18 and S4 in an assembly intermediate21. Therefore, a label on h3 was likely to capture the dynamics of early assembly intermediates. Chemical footprinting and ensemble binding assays established that these modifications did not significantly change the folding of the 5′ domain RNA or its affinity for S4 (Extended Data Fig. 1–3), which is similar to that of the natural 16S rRNA17.
Extended Data Figure 1. Modification of the 5′ domain RNA preserves its structure.

a, The secondary structures of the wild-type and extended 5′ domain RNAs were probed by selective 2′-hydroxyl acylation analyzed by primer extension (SHAPE)60. The 5′ domain RNA (2 pmol) was annealed to unlabeled oligonucleotides and folded in HKM20 buffer (80 mM K-HEPES pH 7.6, 300 mM KCl, 6 mM 2-mercaptoethanol, 20 mM MgCl2) before treatment with 3 mM N-methylisatoic acid (NMIA) at 42 ºC for 26 min. Modifications were detected by primer extension and quantified as previously described19. Results of SHAPE chemical probing of the free RNA structure for the wild-type 5′ domain (left) and the 5′ domain with h16 and h3 extensions after annealing with oligonucleotides (right). Saturation of grey indicates reactivity with NMIA (see Methods). Dashed circles indicate nucleotides that were not detected in our primer extension assay. The results show that the extensions added for the fluorescent labeling of the rRNA do not significantly perturb the rRNA folding. b, Native PAGE folding assay of 5′dom-h3h16. Fluorescently-labeled oligonucleotide (h3P5-Cy5; 25 nM) was annealed to an equimolar concentration of extended 5′ domain RNA in 10 μL CE buffer (20 mM Na-cacodylate, 0.5 mM Na2EDTA) for 5 min at 70 ºC and 5 min at 25 ºC. The RNA-oligonucleotide complex was then folded at 37 ºC for 30 min in varying [MgCl2] (0–20 mM) before electrophoresis on a native 8% polyacrylamide gel containing 10 mM MgCl2. The folding midpoint was 0.5 ± 0.1 mM MgCl2, similar to that of the wild-type 5′ domain RNA (1.4 ± 0.2 mM) reported previously61.
Extended Data Figure 3. S4 labeling and its binding to the rRNA.

E. coli ribosomal protein S4 was over-expressed, purified, and labeled with Cy3 or Cy5 fluorescent dyes as described in Methods. a, SDS-PAGE of unlabeled protein stained with Coomassie (left) or labeled with Cy5 (right). b, c, Ensemble titration of the modified 5′ domain RNAs in HKM20 shows that S4-Cy5 binds with similar affinity as the wild type S4-rRNA complex. Extended 5′ domain RNAs annealed with h3P5-Cy3 and/or h16 oligonucleotides were titrated with S4-Cy5 in a 500 μL cuvette, and the fluorescence emission was recorded from 550 to 700 nm with 540 nm excitation (Fluorolog-3, Horiba). Excitation and emission slits were fixed at 2 nm and 5 nm, respectively. The sample was incubated at 37 ºC for 1 min after each addition. Two or more independent measurements were averaged and titration curves were fitted to a quadratic binding expression. Equilibrium dissociation constants were 5′dom-h3, 0.11 ± 0.02 nM (statistical error of the fit parameter) and 5′dom-h3h16, 0.2 ± 0.1 nM, at 37 ºC, and were comparable to that of the 5′ domain RNA with wild-type E. coli S4 (0.9 nM)17.
Complexes of S4-Cy3 and 5′dom-h3-Cy5 were immobilized on a polymer-passivated quartz surface via biotin on the oligonucleotide extending from h3, and imaged by total internal reflection fluorescence microscopy. Single complexes over time displayed discrete transitions between two stable FRET states (Fig. 1c). Analysis of the dwell times showed that the low and high FRET states interconvert in 1–10 s in 20 mM Mg2+ (Extended Data Fig. 4). In 20 mM Mg2+, S4 remained bound to the RNA and the complex stayed mostly in the high FRET state (FRET efficiency E ~0.7) (Fig. 1c, d). Because native interactions bring the Cy5 acceptor on h3 close to the Cy3 donor on S422, we inferred that the high FRET state represents the docked conformation of h3 observed in the 30S ribosome, that we take to be the native state of this complex. At 4 mM Mg2+, we observed frequent dissociation and re-binding of S4 (Fig. 1c) and greater occupancy of the low FRET state (E ~0.2) (Fig. 1d). We assigned this low FRET state to a “flipped” assembly intermediate in which h3 has swung away from the body of the complex, in agreement with footprinting of the S4-rRNA complex21.
Extended Data Figure 4. Exchange kinetics of docked and flipped complexes.

a, Sample FRET traces are shown for mutant rRNAs in 20 mM Mg2+. b, The cumulative histograms of the dwell times in the high and low FRET conformations were calculated for wild-type 5′ domain RNA, C507G mutant, and Δh18loop mutant, and fit with both mono-exponential and bi-exponential decay functions. One of the triplicate sets of data is demonstrated for each (refer to Methods for number of traces). Significantly lower χ2 values suggest the data are best fit with two exponential terms, except for transitions from the low FRET state to the high FRET state of the wild-type complex, which was well fit by a single exponential decay function. c, d, All of the dwell time histograms were fit with bi-exponential decay and the fitting parameters were compared between the wild-type and the mutants. Both components of the transition from the high to low FRET state were faster in the mutants than in the wild-type complex. The lifetime of the wild-type low FRET state had a single component; for the mutants we observed an additional slow component in the lifetime.
These structural assignments were validated by rRNA mutations predicted to destabilize the docked conformation of h3 (Fig. 1e). The mutation A397C removes a tertiary interaction between h3 and h4, while the mutation A499U disrupts adenine stacking that maintains a 90º angle between h3 and h1823. These mutations did not reduce S4 binding, but they prevented stable docking of h3 in 20 mM Mg2+, as revealed by a higher population of low FRET structures and a broader distribution of mid to high FRET values (Fig. 1d, Extended Data Fig. 4). Additionally, a base mismatch in the h18 pseudoknot (C507G; magenta in Fig. 1b), or deletion of the h18 loop (Δh18loop; teal in Fig. 1b) reduced the high FRET population, showing that interactions with the folded h18 loop stabilize the docked (native) state of h3 (Fig. 1d, Extended Data Fig. 4).
A dynamic encounter complex
We next asked how S4 initially binds the rRNA. Time-resolved footprinting experiments showed that S4 contacts the 16S rRNA in multiple stages spanning 10 ms to 100 s12. This stretched binding dynamics may arise from conformational changes in the 16S rRNA22 or co-folding of the S4 N-terminus, which interacts extensively with h16 and h18 in the ribosome yet is mostly unstructured in free S424.
We measured the dynamics of S4 binding by flowing S4-Cy3 over immobilized 5′dom-h3-Cy5 RNA pre-folded in 20 mM Mg2+ (Fig. 2a). An abrupt increase in fluorescence defined the moment of initial contact with S4-Cy3 (Fig. 2b; Extended Data Fig. 5). We built a map of the FRET distribution over time by synchronizing single molecule traces to the moment of binding (Fig. 2c). Although the high FRET state was favored at equilibrium in 20 mM Mg2+, the FRET distribution at the moment of binding (histogram in Fig. 2c) showed that more than 80% of complexes passed through the low FRET state before switching to the high FRET state in ~1 s.
Figure 2. Dynamics of S4 binding to the 5′ domain RNA.

a, S4-Cy3 was added to immobilized 5′ domain RNA labeled with Cy5 at h3. b, d, Binding traces in 20 and 4 mM Mg2+, respectively. Arrows indicate when S4-Cy3 binds. c, e, f, Probability density maps of synchronized FRET dynamics. Histograms show FRET distribution at the moment of binding. Orange rectangles denote initial mid-FRET population. g, Binding trace at 4 mM Mg2+ acquired at 10 ms resolution. h, Synchronized FRET density map at 10 ms resolution. Orange rectangle denotes the broad initial FRET distribution converging to the low FRET state.
Extended Data Figure 5. Sample traces of S4 binding and binding trials.

a, In 20 mM Mg2+, the binding occurred mostly at the low FRET state. Infrequently, we observed the dissociation and secondary binding of S4. b, At 4 mM Mg2+, we often observed unsuccessful and transient binding of S4. Arrows indicate the transient fluorescence signals from unstable binding. These traces also exhibit the mid FRET spike at the beginning of successful binding event. c, The portion of the molecules that form a stable complex on the first try to the total molecules that form stable complex within 5 min was plotted with varying [Mg2+]. The error bars represent the 95% confidence interval assuming a binary distribution. The number of molecules used was 76, 81, 318, and 170 for 2, 4, 10, and 20 mM Mg2+, respectively.
In 4 mM Mg2+, closer to the physiological condition, ≥40% of complexes showed transient spikes of fluorescence, meaning that S4 dissociated before the complexes could progress to the native state (Fig. 2d, Extended Data Fig. 5). A synchronized map of successful binding trajectories showed that the FRET values at the initial encounter were broadly distributed and included a mid-FRET state (E ~0.6) that was rarely observed in 20 mM Mg2+ (Fig. 2e). Lowering [Mg2+] to 2 mM shifted the initial FRET values further toward ~0.6 (Fig. 2f). Analysis of individual trajectories showed these diverse initial complexes first transitioned to the low FRET (flipped) state before reaching the high FRET (docked) state (Fig. 2d, Extended Data Fig. 5). This sequential pathway was evident in the synchronized map that showed a transient build-up of low FRET population in the first 1–2 s after initial association (Fig. 2e, f, Extended Data Fig. 6).
Extended Data Figure 6. Progression of FRET population at different [Mg2+].
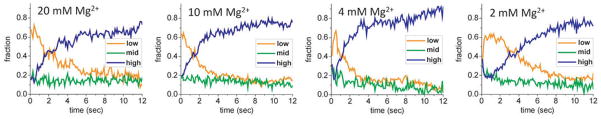
From the synchronized maps of FRET distribution as shown in Fig. 2, the relative populations of low (0–0.35), mid (0.35–0.55), and high (0.55–0.9) FRET states were plotted at different [Mg2+]. In 20 and 10 mM Mg2+, the bound complexes started with large low FRET population that converted to high FRET population within 5–10 s. At 4 and 2 mM Mg2+, there were considerable mid and high FRET populations in the beginning, reflecting the broad initial FRET distribution (Fig. 2e, f). This quickly converted to the low FRET population, which was then followed by slow conversion to the high FRET population within several seconds. The number of molecules used was 112, 239, 116, and 275 for 20, 10, 4, and 2 mM Mg2+, respectively.
To better visualize initial S4 encounters, we made additional observations with 10 ms resolution. These experiments revealed that initial complexes fluctuate rapidly between different structures (Fig. 2g; see also Extended Data Fig. 7) before converging to the low FRET state within ~0.2 s (Fig. 2h, orange rectangle). Though the S4-rRNA complex starts from a disordered ensemble, it does not directly jump to its native structure but progresses through the low FRET intermediate. Thus, S4 interactions steer the system from a heterogeneously fluctuating encounter complex toward a slower dynamic equilibrium between two RNA conformations.
Extended Data Figure 7. Sample traces at 10 ms time resolution.
Single molecule traces at higher time resolution demonstrate the heterogeneous and fluctuating behavior of the encounter complex (S4-Cy3 and 5′dom-h3-Cy5). The change of FRET in different molecules cannot be described as a single behavior. In general, the initial FRET distribution over the complexes is broad and the FRET signal converges to the relatively stable low FRET prior to the transition to the high FRET.
Kinetic model of S4-rRNA binding pathway
Our observations of individual binding events revealed a minimal kinetic pathway for S4-rRNA recognition that accounts for the stretched time frame of RNP assembly (Fig. 3a). In our model, a rapidly fluctuating, heterogeneous S4–5′ domain encounter complex (EC) diffuses to a less dynamic low FRET flipped intermediate (FI), in which h3 swings away from S4 and h18. Finally, h3 docks against S4 and underneath the h18 pseudoknot to form the high FRET native complex (NC).
Figure 3. Kinetic pathway for S4 binding.

a, Model constructed from single molecule data. b-f, [Mg2+]-dependence of rate constants for initial binding (b), decay of the encounter complex (EC) (c), flipped intermediate (FI) (d), and native complex (NC) (e,f) via fast (k-2F) and slow (k-2S) components. g, The fraction of the slow component, AS/(AS + Af), when fitting the NC decay as ASe−k−2St + AFe−k−2Ft. The decay rate of FI state was comparable between initial binding measurements (red) and equilibrium dynamics (black). Error bars represent the standard error of the mean from triplicate measurements (see Methods for data statistics).
The lifetimes of these states in different [Mg2+] provide additional information on the S4 binding mechanism (Fig. 3b–g). First, we estimated the binding rate constant (kon) by observing the delay between the addition of S4-Cy3 and the appearance of a fluorescent signal on the rRNA. The maximum kon ~5·107 M−1s−1 agreed well with time-resolved footprinting12 showing that initial binding occurs near the diffusion limit for macromolecules. S4 bound the 5′ domain RNA fastest in 10 mM Mg2+, which in footprinting experiments22 favors the flipped conformation of h3, but 16 times slower in 20 mM Mg2+, which favors the docked conformation of h3 (Fig. 3b). This supports our observation that the non-native flipped conformation offers a low free energy path for S4 binding, and contrasts with the usual assumption that proteins are more likely to recognize the natively folded RNA.
Second, Mg2+ ions aid transitions from EC to FI, based on faster decay of EC at higher [Mg2+] (Fig. 3c). Conversely, transitions between the FI and NC states slowed down with increasing [Mg2+] (Fig. 3d–f), implying that Mg2+ ions stabilize the flipped and docked complexes more than the transition state between them. Reorientation of h3 may require partial unstacking of the h3-h18 junction and cation release, as observed in DNA and RNA 4-way junctions25,26. Finally, the longer lifetime of NC at higher [Mg2+] (Fig. 3f–g) explains why Mg2+ ions move the equilibrium toward NC27. In the cell, where free [Mg2+] is ~1 mM, other ribosomal proteins may help stabilize NC21.
S4 guides the RNA dynamics
We next investigated how S4 changes pre-existing motions in the free RNA. To compare the conformational dynamics of the rRNA before and after S4 binding, we introduced a second label in the rRNA at the tip of h16 (5′dom-h3h16). Previous smFRET measurements of a minimal 5WJ revealed the complex folding energy landscape of the RNA in the absence of S428. We observed similarly heterogeneous dynamics between h3 and h16 in the larger 5′ domain RNA, with varied transition rates between low and high FRET states in different molecules (Fig. 4a, Extended Data Fig. 8). These changes in RNA structure are reversible as a subset of molecules switched their dynamics within a single trajectory (Extended Data Fig. 9), as observed in other RNAs29–34.
Figure 4. Modulation of the rRNA dynamics by S4 binding.

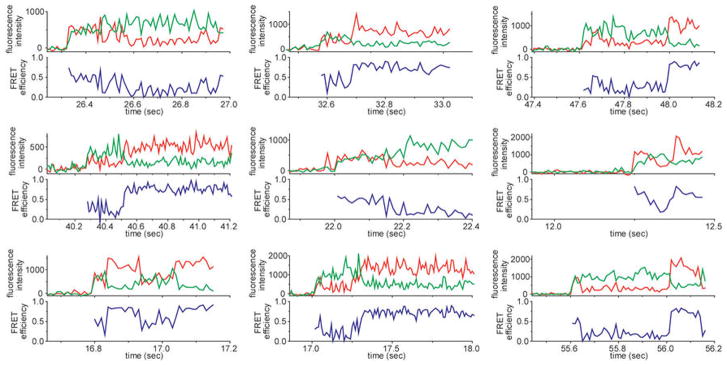
a, Dynamics of the free rRNA in 20 mM Mg2+, based on the fluctuation in the h16-Cy3 to h3-Cy5 distance. b, Three-color FRET shows that the h16-h3 dynamics is suppressed by bound S4, while S4-h3 dynamics is observed. c, Schematic model based on the observed distances and dynamics. Colors of spheres represent the labels for three-color measurements (S4-Cy3; h16-Cy5; h3-Cy7). Isotropic motions of h16 and h3 in the free RNA are denoted by black arrows. Restricted motion of h3 when S4 binds is denoted by blue arrows. d, Distances between S4, h16, and h3 from 35 stable complexes (grey dots) were projected on each face to show the correlation between each pair of distances. The majority of molecules behave as in (c) (blue rectangles); a minor misfolded population shows higher FRET for h16-h3 and S4-h16 and stable high FRET for S4-h3 (violet rectangles)28. e, RNA dynamics from 150 ns all-atom MD simulation with and without S4. Thin lines trace movement (from violet to yellow) of h16 (red cylinder) and h3 (blue cylinder) during the simulation.
Extended Data Figure 8. Dynamics of free 5′dom-h3h16.

a, Schematic of extensions in h16 and h3 with labeled oligonucleotides. b, Sample FRET traces showing the fluctuation between two distinct states. The frequency and distribution of these fluctuations varied between molecules. c, Mg2+ dependence of the molecular heterogeneity. Histograms show the relative high FRET population for each molecule (157, 162, and 74 traces for 20 mM, 5 mM, and 1 mM Mg2+, respectively). At higher [Mg2+], more molecules stay in the high FRET state for longer periods of time. High FRET between h16 and h3 does not necessarily correspond to the native structure of the 5′ domain RNA in complex with protein S4 that is represented by high FRET between S4 and h3.
Extended Data Figure 9. Examples of switching between different h16-h3 dynamics.

Arrows indicate when the fluctuation dynamics switches between stable high FRET, stable low FRET, and alternating high and low FRET behaviors. The RNA was labeled as in Extended Data Figure 8.
To see how S4 modulated RNA dynamics, we performed three-color smFRET35 experiments between S4-Cy3, h16-Cy5, and h3-Cy7. By alternating Cy3 and Cy5 excitation, we measured all pairwise distances pseudo-simultaneously, yielding information on the direction as well as frequency of motion35,36. S4 binding suppressed relative motions of h16, as inferred from the lack of discernible fluctuations in the S4-h16 and h16-h3 FRET efficiencies (Fig. 4b). The FRET from S4 to h3 still fluctuated between high and low values, consistent with two-color data showing that h3 continues to move after S4 binds (Fig. 1c).
We used the observed FRET efficiencies to construct a geometric model of how S4 modulates the motions of the RNA helices. Without S4, the distance between h3 and h16 fluctuates heterogeneously (black arrows in Fig. 4c) as expected for the loosely folded free RNA17. When S4 binds, persistent low FRET between h16 and S4 shows that the motion of h16 is restricted and agrees with the expected distance between these labels in the 30S ribosome (Fig. 4d). Conversely, steady low FRET between h3 and h16, combined with fluctuations in the S4-h3 distance, can be explained by movement of h3 in a plane perpendicular to h16, such that its distance to h16 does not change substantially (blue arrows in Fig. 4c). This dynamics is not likely due to motions in S4, because solution NMR showed the Cy3-labeled domain of S4 is stably folded37.
Molecular dynamics simulations
To gain further insight into how S4 modulates the dynamics of the RNA, we performed all atom MD simulations of a minimal RNA containing just the 5WJ (Fig. 4e). We pictorialized the global motions of the helices by tracing the movements of their tips (Methods). The helix motions in these and other simulations of the 5WJ in 0–30 mM Mg2+ (ref 28) agreed well with the experimentally observed S4-h3-h16 distances. Without S4, h16 explored two distinct regions of space while h3 swept out a wide cone (Fig. 4e, upper panel), consistent with the fluctuations in FRET between h3 and h16 in the free rRNA (Fig. 4a). S4 fixed h16, allowing it to sample only a small region around its native structure (Fig. 4e, lower panel), consistent with the stable S4-h16 FRET signal (Fig. 4b). More interestingly, S4 constrained h3 to an in-plane bending motion toward and away from S4, maintaining a nearly constant distance between h3 and h16.
Separate hybrid MD-Gō simulations of non-equilibrium binding also reproduced the switch from flipped to docked conformations of h3 and the fluctuating encounter conformation at mid-FRET (Extended Data Fig. 10a, b). In the majority of MD-Gō trajectories, initial contact with the C-terminal domain of S4 quickly reduced motions in the 5WJ. This allowed h16 to interact with the disordered N-terminal domain of S4 in the second stage of binding (Extended Data Fig. 10c). Therefore, both experiments and simulations showed that protein S4 alters the frequency and the range of motions in the rRNA: not only are fluctuations in the 5WJ damped as expected, immobilizing h16, but large-scale motions of h3 are confined to a specific direction.
Extended Data Figure 10. S4 binding trajectories from hybrid MD-Gō simulations.
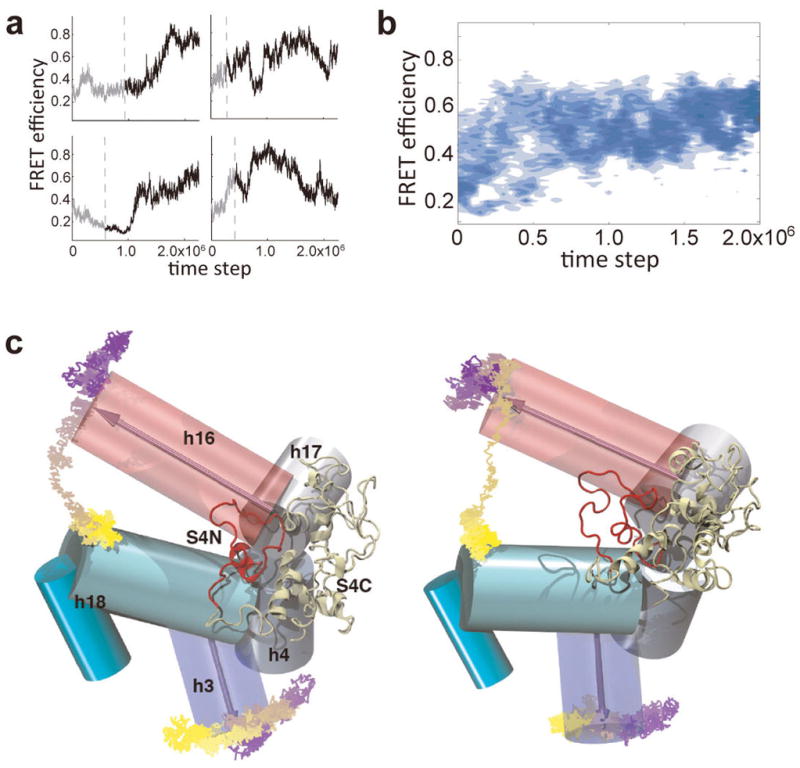
a, Simulated FRET between S4 and h3 from representative binding trajectories displays various binding pathways. b, Density map constructed from 61 successful binding trajectories. The trajectories were synchronized at the moment when the first native contact between S4 and the 5WJ is established (dotted lines in (a)). c, Sample trajectories of successful binding, showing how folding of h16 and h3 is induced by S4 binding.
Discussion
Protein-induced remodeling of RNA structures is widespread and assists the hierarchical assembly of RNA-protein complexes or RNPs4,11,38,39. Unexpectedly, the low free energy path for S4-rRNA recognition passes from a mobile encounter complex through a non-native intermediate before reaching the natively folded complex. S4 not only slows rRNA fluctuations; it induces anisotropic motions between the intermediate and the native complex. These protein-induced changes in the rRNA dynamics are reminiscent of the classical model of substrate induced fit in enzymes40. Induced fit has been proposed as a universal feature in RNA-protein recognition, as both protein and RNA structures often change upon binding41. Our results suggest an alternative picture of induced fit, in which S4 changes the ensemble of thermally accessible RNA conformations by modulating the RNA dynamics. This differs from binding of small ligands to RNA helix junctions, which trap conformations accessed by bending motions of the unliganded RNA42. The ability of S4 to change the RNA dynamics after it binds likely owes to its larger interface with the 16S rRNA, and to the plasticity of its N-terminal domain. Many ribosomal proteins contain flexible segments that change structure upon RNA binding43. Transient protein-RNA interactions may facilitate the search for a high-affinity configuration44–46.
The observed S4-guided dynamics of the rRNA likely contributes to subsequent steps of 30S assembly. First, the conserved h18 loop interacts with tRNA in the mature ribosome, and must fold correctly for normal protein synthesis. h18 folds correctly only after S4 binds the 16S rRNA in a temperature-dependent step18. Our experiments show that folded h18 stabilizes the docked form of h3 (Extended Data Fig. 4). Native interactions between h18 and h3 enable folding of h1 (Fig. 1a) and the central pseudoknot at the end of 30S assembly47,48. S4 mutations that inhibit remodeling of h18 and h3 docking impair 30S assembly in E. coli49.
Second, h3 dynamics affects the recruitment of other proteins to the 16S rRNA. Protein S16, which adds to 30S complexes only when S4 is present, stabilizes the docked conformation of h321. Later in 30S assembly, protein S12 binds the docked h3 on the side opposite S4 (dark red, Fig. 1a). The restricted in-plane motions of h3 between the flipped and docked conformations may reject S12 until the h18 loop has folded correctly and S16 has bound, ensuring the proper hierarchy of protein addition. Thus, protein-guided RNA dynamics creates additional checkpoints for molecular interactions, thereby improving the fidelity of rRNA folding and ribosome assembly.
Methods
Oligonucleotides and design of modified 5′domain RNA for smFRET
Two extensions in the 5′ domain of the E. coli 16S rRNA (nt 21–556, E. coli numbering) created binding sites for fluorescently labeled oligonucleotides as previously described50,51. First, the 3′-end (5′dom-h3) was extended by 38 nucleotides (5′-AGGACGACACACUUUGGACAGGACACACAGGACACAGG-3′) to base pair with DNA oligonucleotide h3P5 derivatized on its 3′-end with the acceptor dye (Cy5 or Cy7) and 5′-end with biotin (5′- biotin-d(agaagactcgtgactactcagctttcgtgaCCTGT GTCCTGTGTGTCCTGTCCAAAGTGTGTCGTCC)-C6amine-Cy5/7-3′). Lowercase residues were base paired with a complementary DNA strand (CPh3; 5′-d(TCACGAAAGCTGAGTAGTCACGAGTCTTCT)-3′) to extend the tether ~60 Å away from the surface. Second, the tetraloop of h16 (nt 420–423) was replaced by a 26-nucleotide extension (5′-CGCGUCGCCAGACCAGACGCTCCGCG-3′) by inverse PCR (5′dom-h3h16). This extension was base-paired with a 15-nucleotide RNA, h16P3, modified with the donor dye (Cy3 or Cy5) (r(AGGCGACAGGAGTGG)-C6amine-Cy3/5-3′). Fluorescent dyes (Cy3, Cy5, or Cy7) were conjugated as required to the 3′-end of oligonucleotides (Integrated DNA Technologies) through C6-amine modification.
Extended 5′ domain RNAs were transcribed in vitro using T7 RNA polymerase by standard methods and purified using 4% (w/v) polyacrylamide gel electrophoresis. The RNA concentration was determined from the absorbance at 260 nm (ε = 5.38 μM−1cm−1). Stable hybridization of oligonucleotides with the extended 5′ domain RNA was confirmed by electrophoretic gel mobility shift. SHAPE probing and ensemble binding assays (Extended Data Figs. 1–2) confirmed that these modifications did not perturb the S4-rRNA complex.
Extended Data Figure 2. Annealing of labeled oligonucleotides to the 5′ domain RNA.
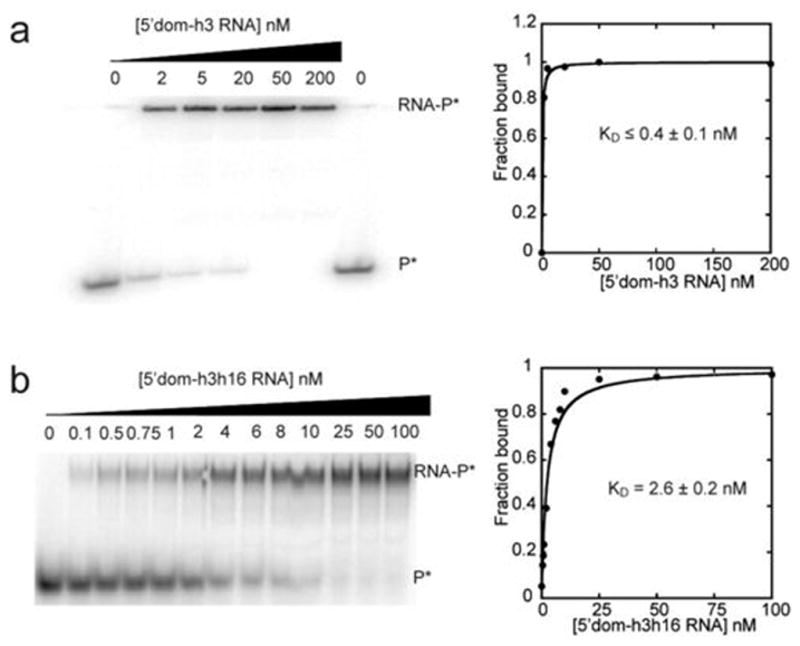
32P-labeled oligonucleotides were annealed to the 3′ extension of h3 of 5′dom-h3 (h3P5, DNA) (a) or to the extended loop of h16 of 5′dom-h3h16 (h16P2-2, RNA) (b). Annealing reactions were performed in HK buffer and 6 mM 2-mercaptoethanol at 25 ºC. Binding data were fit to the quadratic form of a two-state binding isotherm. Apparent dissociation constants were ≤0.4 nM and 2.6 ± 0.2 nM for h3 and h16 oligonucleotides, respectively. Equilibrium constants are the average and S.D. of two or more independent trials. The lengths of the labeled oligonucleotides were varied to optimize affinity with the extended 5′ domain RNA, while avoiding perturbations to S4 binding (see Extended Data Fig. 1).
Labeling protein S4
A single cysteine for fluorescent labeling of E. coli protein S4 was created by site-directed mutagenesis (QuikChange) of pET24b/rpS4 gene plasmid52. The natural cysteine at position 32 was replaced with serine while serine 189 was replaced with cysteine (E. coli numbering). S4:C32S,S189C was overexpressed and purified using cation exchange chromatography52. Isolated proteins were dialyzed against 80 mM K-HEPES pH 7.6, 1 M KCl, 1 mM TCEP and stored at −80 ºC in 500 μL aliquots.
S4 protein (15 μM in 80 mM K-HEPES pH 7.6, 1 M KCl, 1 mM TCEP, 3 M urea) was incubated at 20 ºC for 30 min, and then treated with 6-fold molar excess cysteine-reactive Cy3-maleimide (GE Healthcare) at 20 ºC for 2 hr. The reaction was quenched by adding 20 mM Tris-HCl pH 7.0, 6 M urea, 6 mM 2-mercaptoethanol. Unreacted dye was removed by ion exchange chromatography followed by overnight dialysis against 80 mM K-HEPES pH 7.6, 1 M KCl, 6 mM 2-mercaptoethanol. Protein and Cy3 concentrations were determined from the absorbance at 280 nm (ε280 = 17,843 M−1cm−1) and 550 nm (ε550 = 250,000 M−1cm−1). The labeling efficiency measured by SDS-PAGE53 was ~100%. Labeled protein was stored at −80 ºC protected from light.
smFRET measurements
RNA 5′dom-h3 (10 nM), biotinylated h3 oligonucleotide (h3P5, 5 nM), and the complementary strand (CPh3, 10 nM) were mixed in HK buffer. In case of 5′dom-h3h16, h16 oligonucleotide (h16P2-2 (5′-r(AGGCGACAGGAGTGG)-C6amine-3′), 60 nM) was added. The solution was heated to 75 °C for 5 min and slowly cooled to 37 °C by leaving the microcentrifuge tube in the heating block. The desired amount of MgCl2 was added and the solution was held at 37 °C for 5 min to fold the rRNA. For equilibrium measurements, the reaction was diluted fivefold in the same buffer and incubated with 5 nM S4-Cy3 for 5 min at 37 °C. The complex was immobilized on quartz slides covered with a 30:1 mixture of polyethylene glycol (PEG) and biotinylated PEG and treated with neutravidin54. For flow-in measurements, the complex was prepared without S4-Cy3 and immobilized on the surface. S4-Cy3 was added using a syringe attached to the micro-chamber while the movie was recorded. smFRET traces were measured using a total internal reflection fluorescence microscope as previously described55. The imaging solution contained HK buffer, the stated amount of MgCl2, 2 mM Trolox, 0.6% glucose, 0.1 mg/mL glucose oxidase (Sigma), and 0.02 mg/mL catalase (Sigma). For two-color FRET, we calculated the FRET efficiency defined with leakage correction as EFRET = (IA − 0.06 ID)/(ID + IA) where ID and IA are the measured intensities of the donor and acceptor, respectively. For three-color FRET, we further considered the direct excitation of Cy7 by the red laser (for exciting Cy5) and corrected for the lower detection efficiency for Cy7. Details of the corrections needed to calculate multi-color FRET efficiencies are described elsewhere56.
smFRET data analysis
FRET histograms were made from FRET values at each time frame (100 or 10 ms). In Fig. 1d, traces of 224, 64, 139, 611, 187, and 253 molecules were collected for 20 mM Mg2+, 4 mM Mg2+, A397C, A499U, C507G, and Δh18loop, respectively. Post-synchronized density plots were constructed from the traces that eventually progressed into the high FRET state before the dyes photobleached, in order to exclude non-specific binding events. The traces were synchronized at the moment of the increase of total fluorescence above a threshold, which was determined as half of the total fluorescence of the bound state. The overlaid traces were normalized at each frame and then converted to density maps by the contour plot method of Matlab (The Mathworks, Inc). In Fig. 2, 112, 116, 275, and 117 traces were collected to build the maps at 100 ms resolution in 20, 4, and 2 mM Mg2+ and 10 ms resolution in 4 mM Mg2+, respectively. Kinetic rate constants were estimated as follows: Individual traces were smoothed by a Savitzky-Golay filter of degree 3 over 5 points. By defining the threshold in the middle of two FRET levels, the transition moments were determined. The dwell time at each state was either averaged over a number of traces (Fig. 3b–f) or plotted as a cumulative histogram, which was then fitted with single or double exponential decay curve (Extended Data Fig. 4). At each condition, the error bar represents the standard error of either mean values (Fig. 3b–f) or fitted decay constants from three repeated measurements (Extended Data Fig. 4). For Fig. 3, the number of traces collected and analyzed from triplicate measurements were 36/41/72 (2 mM Mg2+), 13/14/30 (4 mM Mg2+), 31/29/91 (10 mM Mg2+), and 68/72/58 (20 mM Mg2+). For Extended Data Fig. 4c–d, it was 76/72/50 (wild-type), 62/56/56 (C507G), and 59/41/38 (Δh18loop). For Extended Data Fig. 4b, the first set of data at each condition was presented.
Molecular dynamics simulations
Initial models for the molecular simulations were created using the crystal structure of the 5WJ and S4 from the 30S ribosomal subunit of E. coli (PDB code: 2I2P). The 5WJ was modeled according to the minimal S4 binding system suggested by Bellur et al.17 The systems were neutralized with Mg2+ and K+ ions, initially placed in positions occupied by metal ions in the crystal structure or according to the electrostatic potential around the RNA. The complex was solvated by well-equilibrated water molecules with periodic boundary conditions. 400 mM KCl was added to the final solution. MD simulations were run for 150 ns (1 fs timesteps) under constant pressure (1 atm) and constant temperature (25 ºC) using NAMD2.957 with the CHARMM27 force field58. Although CHARMM is known to allow fluctuations in base pairs and base stacking, the RNA secondary structure remained intact during the simulation, indicating the base pairing potential was not unduly biased by the force field. Single nucleotide fluctuations in our simulations agreed with results from the SHAPE experiments28. As all-atom simulations cannot cover the experimental timescales (s), we performed additional simulations of the RNA in which Mg2+ ions were removed to increase sampling of the RNA unfolding landscape.
From the simulated data, we calculated the trajectories of the helix motions as follows: First, we aligned the MD trajectories to the crystal structure using heavy atoms in helices 4, 17, and 18, so that the alignment remained mostly invariant among different simulations. Next, we defined the orientation of h3 and h16 using the third principal axis of inertia for all heavy atoms on the helix (purple arrows in Fig. 4e), and set the end point of the helix with the furthest projection of the backbone atoms onto this axis. Finally, we linked the end points of h3 or h16 from each frame in the aligned trajectories to generate the time trace of helix motion in Fig. 4e. All calculations were done using the software VMD59.
The hybrid MD-Gō simulations were prepared starting from a snapshot representing the extended state of the 5WJ (state II in ref. 19) identified by MD simulations. A partially unfolded S4 conformation (RMSD ~5.2 Å with respect to crystal structure) was also chosen from the MD simulation and it was placed ~38 Å (center-of-mass distance) away from the 5WJ, such that the closest contacts between them were just under the non-bonded interaction cutoff (12 Å). The folding of the 5WJ and S4, as well as the binding between the two molecules were driven by the Lennard-Jones-style Gō potential that we developed within the framework of NAMD28. An ensemble of one hundred simulations of simultaneous folding and binding were performed to obtain proper statistics.
In Extended Data Fig. 10, the FRET efficiency was calculated using the standard formula, with the donor-to-acceptor distance measured from the phosphorus atom of G557 at the 3′ end of h3 in the 5WJ RNA, and Cα atom of Ser188 of S4, assuming the same Förster radius (55 Å) used in the analysis of experimental data. 61 of 100 trajectories showed successful binding of S4 within the simulation time (2,250,000 steps) and were taken for analysis. These trajectories were further synchronized such that the time step where the first native contact between S4 and the 5WJ was established in each trajectory was set as time 0 to generate the density map.
Acknowledgments
This work was supported by grants from the National Institutes of Health (R01 GM60819 to S.A.W.; R01 GM65367 to T.H.) and from the National Science Foundation (PHY0822613 to T.H. and MCB12-44570 to Z. L-S.). Supercomputer computing time was provided by NSF XSEDE (TG-MCA03S027). T.H. is an investigator with the Howard Hughes Medical Institute.
Footnotes
Author Contributions
H.K., S.A., Z.L.-S., T.H. and S.A.W. designed the research. H.K., S.A., K.R., and M.M. conducted experiments, S.A. and M.M. provided samples, K.C. performed MD simulations, H.K. and K.R. analyzed the data and H.K. and S.A.W. wrote the paper with input from other authors.
Competing financial interests
The authors declare no competing financial interests.
References
- 1.Held WA, Ballou B, Mizushima S, Nomura M. Assembly mapping of 30S ribosomal proteins from Escherichia coli. Further studies. J Biol Chem. 1974;249:3103–3111. [PubMed] [Google Scholar]
- 2.Nierhaus KH, Dohme F. Total reconstitution of functionally active 50S ribosomal subunits from Escherichia coli. Proc Natl Acad Sci USA. 1974;71:4713–4717. doi: 10.1073/pnas.71.12.4713. [DOI] [PMC free article] [PubMed] [Google Scholar]
- 3.Traub P, Nomura M. Structure and function of Escherichia coli ribosomes. VI. Mechanism of assembly of 30S ribosomes studied in vitro. J Mol Biol. 1969;40:391–413. doi: 10.1016/0022-2836(69)90161-2. [DOI] [PubMed] [Google Scholar]
- 4.Stern S, Powers T, Changchien LM, Noller HF. RNA-protein interactions in 30S ribosomal subunits: folding and function of 16S rRNA. Science. 1989;244:783–790. doi: 10.1126/science.2658053. [DOI] [PubMed] [Google Scholar]
- 5.Shajani Z, Sykes MT, Williamson JR. Assembly of bacterial ribosomes. Annu Rev Biochem. 2011;80:501–526. doi: 10.1146/annurev-biochem-062608-160432. [DOI] [PubMed] [Google Scholar]
- 6.Woodson SA. RNA folding pathways and the self-assembly of ribosomes. Acc Chem Res. 2011;44:1312–1319. doi: 10.1021/ar2000474. [DOI] [PMC free article] [PubMed] [Google Scholar]
- 7.Ha T, et al. Ligand-induced conformational changes observed in single RNA molecules. Proc Natl Acad Sci USA. 1999;96:9077–9082. doi: 10.1073/pnas.96.16.9077. [DOI] [PMC free article] [PubMed] [Google Scholar]
- 8.Weeks KM, Cech TR. Assembly of a ribonucleoprotein catalyst by tertiary structure capture. Science. 1996;271:345–348. doi: 10.1126/science.271.5247.345. [DOI] [PubMed] [Google Scholar]
- 9.Caprara MG, Mohr G, Lambowitz AM. A tyrosyl-tRNA synthetase protein induces tertiary folding of the group I intron catalytic core. J Mol Biol. 1996;257:512–531. doi: 10.1006/jmbi.1996.0182. [DOI] [PubMed] [Google Scholar]
- 10.Agalarov SC, Sridhar Prasad G, Funke PM, Stout CD, Williamson JR. Structure of the S15,S6,S18-rRNA complex: assembly of the 30S ribosome central domain. Science. 2000;288:107–113. doi: 10.1126/science.288.5463.107. [DOI] [PubMed] [Google Scholar]
- 11.Kuglstatter A, Oubridge C, Nagai K. Induced structural changes of 7SL RNA during the assembly of human signal recognition particle. Nat Struct Biol. 2002;9:740–744. doi: 10.1038/nsb843. [DOI] [PubMed] [Google Scholar]
- 12.Adilakshmi T, Bellur DL, Woodson SA. Concurrent nucleation of 16S folding and induced fit in 30S ribosome assembly. Nature. 2008;455:1268–1272. doi: 10.1038/nature07298. [DOI] [PMC free article] [PubMed] [Google Scholar]
- 13.Ha T, et al. Probing the interaction between two single molecules: fluorescence resonance energy transfer between a single donor and a single acceptor. Proc Natl Acad Sci USA. 1996;93:6264–6268. doi: 10.1073/pnas.93.13.6264. [DOI] [PMC free article] [PubMed] [Google Scholar]
- 14.Talkington MW, Siuzdak G, Williamson JR. An assembly landscape for the 30S ribosomal subunit. Nature. 2005;438:628–632. doi: 10.1038/nature04261. [DOI] [PMC free article] [PubMed] [Google Scholar]
- 15.Nowotny V, Nierhaus KH. Assembly of the 30S subunit from Escherichia coli ribosomes occurs via two assembly domains which are initiated by S4 and S7. Biochemistry. 1988;27:7051–7055. doi: 10.1021/bi00418a057. [DOI] [PubMed] [Google Scholar]
- 16.Stern S, Wilson RC, Noller HF. Localization of the binding site for protein S4 on 16S ribosomal RNA by chemical and enzymatic probing and primer extension. J Mol Biol. 1986;192:101–110. doi: 10.1016/0022-2836(86)90467-5. [DOI] [PubMed] [Google Scholar]
- 17.Bellur DL, Woodson SA. A minimized rRNA-binding site for ribosomal protein S4 and its implications for 30S assembly. Nucleic Acids Res. 2009;37:1886–1896. doi: 10.1093/nar/gkp036. [DOI] [PMC free article] [PubMed] [Google Scholar]
- 18.Powers T, Noller HF. A temperature-dependent conformational rearrangement in the ribosomal protein S4.16S rRNA complex. J Biol Chem. 1995;270:1238–1242. doi: 10.1074/jbc.270.3.1238. [DOI] [PubMed] [Google Scholar]
- 19.Mayerle M, Bellur DL, Woodson SA. Slow formation of stable complexes during coincubation of minimal rRNA and ribosomal protein S4. J Mol Biol. 2011;412:453–465. doi: 10.1016/j.jmb.2011.07.048. [DOI] [PMC free article] [PubMed] [Google Scholar]
- 20.Powers T, Noller HF. A functional pseudoknot in 16S ribosomal RNA. EMBO J. 1991;10:2203–2214. doi: 10.1002/j.1460-2075.1991.tb07756.x. [DOI] [PMC free article] [PubMed] [Google Scholar]
- 21.Ramaswamy P, Woodson SA. S16 throws a conformational switch during assembly of 30S 5′ domain. Nat Struct Mol Biol. 2009;16:438–445. doi: 10.1038/nsmb.1585. [DOI] [PMC free article] [PubMed] [Google Scholar]
- 22.Ramaswamy P, Woodson SA. Global Stabilization of rRNA Structure by Ribosomal Proteins S4, S17, and S20. J Mol Biol. 2009:666–677. doi: 10.1016/j.jmb.2009.07.032. [DOI] [PMC free article] [PubMed] [Google Scholar]
- 23.Grabow WW, Zhuang Z, Swank ZN, Shea JE, Jaeger L. The right angle (RA) motif: a prevalent ribosomal RNA structural pattern found in group I introns. J Mol Biol. 2012;424:54–67. doi: 10.1016/j.jmb.2012.09.012. [DOI] [PMC free article] [PubMed] [Google Scholar]
- 24.Sayers EW, Gerstner RB, Draper DE, Torchia DA. Structural preordering in the N-terminal region of ribosomal protein S4 revealed by heteronuclear NMR spectroscopy. Biochemistry. 2000;39:13602–13613. doi: 10.1021/bi0013391. [DOI] [PubMed] [Google Scholar]
- 25.Hohng S, et al. Conformational flexibility of four-way junctions in RNA. J Mol Biol. 2004;336:69–79. doi: 10.1016/j.jmb.2003.12.014. [DOI] [PubMed] [Google Scholar]
- 26.McKinney SA, Declais AC, Lilley DM, Ha T. Structural dynamics of individual Holliday junctions. Nat Struct Biol. 2003;10:93–97. doi: 10.1038/nsb883. [DOI] [PubMed] [Google Scholar]
- 27.Gerstner RB, Pak Y, Draper DE. Recognition of 16S rRNA by ribosomal protein S4 from Bacillus stearothermophilus. Biochemistry. 2001;40:7165–7173. doi: 10.1021/bi010026i. [DOI] [PubMed] [Google Scholar]
- 28.Chen K, et al. Assembly of the five-way junction in the ribosomal small subunit using hybrid MD-Go simulations. J Phys Chem B. 2012;116:6819–6831. doi: 10.1021/jp212614b. [DOI] [PMC free article] [PubMed] [Google Scholar]
- 29.Zhuang X, et al. Correlating structural dynamics and function in single ribozyme molecules. Science. 2002;296:1473–1476. doi: 10.1126/science.1069013. [DOI] [PubMed] [Google Scholar]
- 30.Tan E, et al. A four-way junction accelerates hairpin ribozyme folding via a discrete intermediate. Proc Natl Acad Sci USA. 2003;100:9308–9313. doi: 10.1073/pnas.1233536100. [DOI] [PMC free article] [PubMed] [Google Scholar]
- 31.Xie Z, Srividya N, Sosnick TR, Pan T, Scherer NF. Single-molecule studies highlight conformational heterogeneity in the early folding steps of a large ribozyme. Proc Natl Acad Sci USA. 2004;101:534–539. doi: 10.1073/pnas.2636333100. [DOI] [PMC free article] [PubMed] [Google Scholar]
- 32.Ditzler MA, Rueda D, Mo J, Hakansson K, Walter NG. A rugged free energy landscape separates multiple functional RNA folds throughout denaturation. Nucleic Acids Res. 2008;36:7088–7099. doi: 10.1093/nar/gkn871. [DOI] [PMC free article] [PubMed] [Google Scholar]
- 33.Solomatin SV, Greenfeld M, Chu S, Herschlag D. Multiple native states reveal persistent ruggedness of an RNA folding landscape. Nature. 2010;463:681–684. doi: 10.1038/nature08717. [DOI] [PMC free article] [PubMed] [Google Scholar]
- 34.Haller A, Altman RB, Souliere MF, Blanchard SC, Micura R. Folding and ligand recognition of the TPP riboswitch aptamer at single-molecule resolution. Proc Natl Acad Sci USA. 2013;110:4188–4193. doi: 10.1073/pnas.1218062110. [DOI] [PMC free article] [PubMed] [Google Scholar]
- 35.Hohng S, Joo C, Ha T. Single-molecule three-color FRET. Biophys J. 2004;87:1328–1337. doi: 10.1529/biophysj.104.043935. [DOI] [PMC free article] [PubMed] [Google Scholar]
- 36.Munro JB, Altman RB, Tung CS, Sanbonmatsu KY, Blanchard SC. A fast dynamic mode of the EF-G-bound ribosome. EMBO J. 2010;29:770–781. doi: 10.1038/emboj.2009.384. [DOI] [PMC free article] [PubMed] [Google Scholar]
- 37.Markus MA, Gerstner RB, Draper DE, Torchia DA. The solution structure of ribosomal protein S4 delta41 reveals two subdomains and a positively charged surface that may interact with RNA. EMBO J. 1998;17:4559–4571. doi: 10.1093/emboj/17.16.4559. [DOI] [PMC free article] [PubMed] [Google Scholar]
- 38.Rose MA, Weeks KM. Visualizing induced fit in early assembly of the human signal recognition particle. Nat Struct Biol. 2001;8:515–520. doi: 10.1038/88577. [DOI] [PubMed] [Google Scholar]
- 39.Stone MD, et al. Stepwise protein-mediated RNA folding directs assembly of telomerase ribonucleoprotein. Nature. 2007;446:458–461. doi: 10.1038/nature05600. [DOI] [PMC free article] [PubMed] [Google Scholar]
- 40.Koshland DE. Application of a Theory of Enzyme Specificity to Protein Synthesis. Proc Natl Acad Sci USA. 1958;44:98–104. doi: 10.1073/pnas.44.2.98. [DOI] [PMC free article] [PubMed] [Google Scholar]
- 41.Williamson JR. Induced fit in RNA-protein recognition. Nat Struct Biol. 2000;7:834–837. doi: 10.1038/79575. [DOI] [PubMed] [Google Scholar]
- 42.Zhang Q, Stelzer AC, Fisher CK, Al-Hashimi HM. Visualizing spatially correlated dynamics that directs RNA conformational transitions. Nature. 2007;450:1263–1267. doi: 10.1038/nature06389. [DOI] [PubMed] [Google Scholar]
- 43.Klein DJ, Moore PB, Steitz TA. The roles of ribosomal proteins in the structure assembly, and evolution of the large ribosomal subunit. J Mol Biol. 2004;340:141–177. doi: 10.1016/j.jmb.2004.03.076. [DOI] [PubMed] [Google Scholar]
- 44.Bokinsky G, et al. Two distinct binding modes of a protein cofactor with its target RNA. J Mol Biol. 2006;361:771–784. doi: 10.1016/j.jmb.2006.06.048. [DOI] [PMC free article] [PubMed] [Google Scholar]
- 45.Rau M, Stump WT, Hall KB. Intrinsic flexibility of snRNA hairpin loops facilitates protein binding. RNA. 2012;18:1984–1995. doi: 10.1261/rna.035006.112. [DOI] [PMC free article] [PubMed] [Google Scholar]
- 46.Boehr DD, Nussinov R, Wright PE. The role of dynamic conformational ensembles in biomolecular recognition. Nat Chem Biol. 2009;5:789–796. doi: 10.1038/nchembio.232. [DOI] [PMC free article] [PubMed] [Google Scholar]
- 47.Holmes KL, Culver GM. Mapping structural differences between 30S ribosomal subunit assembly intermediates. Nat Struct Mol Biol. 2004;11:179–186. doi: 10.1038/nsmb719. [DOI] [PubMed] [Google Scholar]
- 48.Clatterbuck Soper SF, Dator RP, Limbach PA, Woodson SA. In Vivo X-Ray Footprinting of Pre-30S Ribosomes Reveals Chaperone-Dependent Remodeling of Late Assembly Intermediates. Mol Cell. 2013;52:506–516. doi: 10.1016/j.molcel.2013.09.020. [DOI] [PMC free article] [PubMed] [Google Scholar]
- 49.Mayerle M, Woodson SA. Specific contacts between protein S4 and ribosomal RNA are required at multiple stages of ribosome assembly. RNA. 2013;19:574–585. doi: 10.1261/rna.037028.112. [DOI] [PMC free article] [PubMed] [Google Scholar]
- 50.Smith GJ, Sosnick TR, Scherer NF, Pan T. Efficient fluorescence labeling of a large RNA through oligonucleotide hybridization. RNA. 2005;11:234–239. doi: 10.1261/rna.7180305. [DOI] [PMC free article] [PubMed] [Google Scholar]
- 51.Dorywalska M, et al. Site-specific labeling of the ribosome for single-molecule spectroscopy. Nucleic Acids Res. 2005;33:182–189. doi: 10.1093/nar/gki151. [DOI] [PMC free article] [PubMed] [Google Scholar]
- 52.Culver GM, Noller HF. Efficient reconstitution of functional Escherichia coli 30S ribosomal subunits from a complete set of recombinant small subunit ribosomal proteins. RNA. 1999;5:832–843. doi: 10.1017/s1355838299990714. [DOI] [PMC free article] [PubMed] [Google Scholar]
- 53.Hickerson R, Majumdar ZK, Baucom A, Clegg RM, Noller HF. Measurement of internal movements within the 30S ribosomal subunit using Forster resonance energy transfer. J Mol Biol. 2005;354:459–472. doi: 10.1016/j.jmb.2005.09.010. [DOI] [PubMed] [Google Scholar]
- 54.Joo C, Ha T. Preparing sample chambers for single-molecule FRET. Cold Spring Harb Protoc. 2012;2012:1104–1108. doi: 10.1101/pdb.prot071530. [DOI] [PubMed] [Google Scholar]
- 55.Kim H, Tang GQ, Patel SS, Ha T. Opening-closing dynamics of the mitochondrial transcription pre-initiation complex. Nucleic Acids Res. 2012;40:371–380. doi: 10.1093/nar/gkr736. [DOI] [PMC free article] [PubMed] [Google Scholar]
- 56.Lee J, et al. Single-molecule four-color FRET. Angew Chem Int Ed Engl. 2010;49:9922–9925. doi: 10.1002/anie.201005402. [DOI] [PMC free article] [PubMed] [Google Scholar]
- 57.Phillips JC, et al. Scalable molecular dynamics with NAMD. J Comput Chem. 2005;26:1781–1802. doi: 10.1002/jcc.20289. [DOI] [PMC free article] [PubMed] [Google Scholar]
- 58.MacKerell AD, Jr, Banavali N, Foloppe N. Development and current status of the CHARMM force field for nucleic acids. Biopolymers. 2000;56:257–265. doi: 10.1002/1097-0282(2000)56:4<257::AID-BIP10029>3.0.CO;2-W. [DOI] [PubMed] [Google Scholar]
- 59.Humphrey W, Dalke A, Schulten K. VMD: visual molecular dynamics. J Mol Graph. 1996;14:33–38. 27–38. doi: 10.1016/0263-7855(96)00018-5. [DOI] [PubMed] [Google Scholar]
- 60.Wilkinson KA, Merino EJ, Weeks KM. Selective 2′-hydroxyl acylation analyzed by primer extension (SHAPE): quantitative RNA structure analysis at single nucleotide resolution. Nat Protoc. 2006;1:1610–1616. doi: 10.1038/nprot.2006.249. [DOI] [PubMed] [Google Scholar]
- 61.Adilakshmi T, Ramaswamy P, Woodson SA. Protein-independent folding pathway of the 16S rRNA 5′ domain. J Mol Biol. 2005;351:508–519. doi: 10.1016/j.jmb.2005.06.020. [DOI] [PubMed] [Google Scholar]