

Significance
The bacterial cytoskeletal protein FtsZ, which forms a constricting “Z-ring” during cell division, is the major cytoskeletal protein involved in cell division in almost all prokaryotes, and is a key next-generation antibiotic target. However, the small size of the Z-ring, approximately 500 nm in diameter, makes it difficult to observe in vivo. We provide a quantitative nanoscale picture of Z-ring organization in live cells; these results improve our understanding of the structural and force-generating roles of FtsZ in bacterial cell division. To achieve this, we created an automated modality of superresolution fluorescence microscopy, allowing high-throughput live cell microscopy at nanoscale resolution; this technique should be broadly useful in prokaryotic and eukaryotic systems.
Keywords: bacterial cytoskeleton, SOS response
Abstract
We created a high-throughput modality of photoactivated localization microscopy (PALM) that enables automated 3D PALM imaging of hundreds of synchronized bacteria during all stages of the cell cycle. We used high-throughput PALM to investigate the nanoscale organization of the bacterial cell division protein FtsZ in live Caulobacter crescentus. We observed that FtsZ predominantly localizes as a patchy midcell band, and only rarely as a continuous ring, supporting a model of “Z-ring” organization whereby FtsZ protofilaments are randomly distributed within the band and interact only weakly. We found evidence for a previously unidentified period of rapid ring contraction in the final stages of the cell cycle. We also found that DNA damage resulted in production of high-density continuous Z-rings, which may obstruct cytokinesis. Our results provide a detailed quantitative picture of in vivo Z-ring organization.
FtsZ is the major cytoskeletal protein involved in cell division in almost all prokaryotes. FtsZ is required for recruitment of the rest of the cell division machinery (1) and may have a force-generating role in cell-membrane constriction (2, 3). As it is almost universally essential for cell division in bacteria, FtsZ is a key next-generation antibiotic target (4, 5).
The microscale localization profile of FtsZ is well-established and largely conserved among prokaryotes (6). Early in the division process, FtsZ assembles into a band located at midcell, known as the Z-ring, which constricts to a small spot as cell division progresses (Fig. 1A shows this process for Caulobacter crescentus). FtsZ is a highly conserved tubulin homolog that forms homopolymeric linear protofilaments upon GTP binding, which disassemble upon GTP hydrolysis (7). EM studies of FtsZ protofilaments reconstituted in vitro have shown them to be ∼120–250 nm in length (8).
Fig. 1.

Localization and hypothesized structure of the Z-ring. (A) Microscale localization of FtsZ (in green) during the C. crescentus cell cycle. (B) The patchy band model proposes a scattered band of FtsZ protofilaments without lateral contacts. (C) The lateral interaction model proposes (i) a single ring or (ii) a compressed helix stabilized by lateral interactions between individual protofilaments. Transitions between states B and C might also occur: FtsZ protofilaments could initially form a patchy band, but a transition to a continuous ring might be required for constriction.
An accurate picture of the in vivo nanoscale organization of FtsZ is crucial to the understanding of its structural and force-generating roles. Two main models of FtsZ organization have been proposed (9, 10). The “patchy band” model (Fig. 1B) proposes that short FtsZ protofilaments are arranged in a discontinuous band at midcell, without strong lateral contacts. Cryo-EM images of plunge-frozen dividing C. crescentus cells (10) showed FtsZ filaments that did not form a continuous ring but instead were distributed sparsely at midcell, supporting the patchy band model. In contrast, the “lateral interaction” model (Fig. 1C) proposes a single continuous ring, or possibly a compressed helix, stabilized by direct lateral interactions between FtsZ protofilaments (9). In particular, this model is supported by striking negative stain EM images (9) of continuous Escherichia coli and Mycobacterium tuberculosis Z-rings reconstituted in artificial lipid tubules. A final possibility is that either structure could exist during different stages of the cell cycle; e.g., the Z-ring could be a patchy band during early cell cycle, but a transition to a continuous ring/helix might be required for onset of constriction (Fig. 1 B and C).
Superresolution fluorescence microscopies (11, 12) are ideally suited for studying FtsZ organization. In contrast to cryo-EM, which offers high spatial resolution in fixed cells without labeling specificity, superresolution microscopy is capable of accessing nanometer-scale features in living cells, and possesses the labeling specificity essential to discriminate between competing models of Z-ring organization. Two-dimensional photoactivated localization microscopy (PALM) studies of the E. coli Z-ring (13, 14) (spatial resolution, 35 nm xy) found evidence that the Z-ring is a loose, continuous bundle composed of multiple overlapping filaments. A 3D structured illumination microscopy (SIM) study of in vivo FtsZ localization in the Gram-positive organisms Bacillus subtilis and Staphylococcus aureus (15) revealed a dynamic “bead-like” Z-ring structure (spatial resolution, 120 nm xy, 300 nm z). Large variations in intensity were observed around the ring, at spacings of ∼200 nm, as well as occasional small 100–200-nm gaps. A 3D PALM study of FtsZ in live C. crescentus (16) provided several high-resolution images of Z-rings (localization precision, 30 nm xy, 100 nm z), which appeared to be organized into loosely packed continuous bands.
However, all these measurements have failed to conclusively prove the lateral interaction or the patchy band model. Additionally, it does not seem that the patchy band or lateral interaction models represent a complete description of Z-ring organization, as they do not address its cell cycle dependence, or sensitivity to perturbations to cytokinesis such as DNA damage.
Previous measurements have failed to answer these questions because they have lacked one or more of the following essential capabilities: labeling specificity, in vivo imaging, high 3D spatial resolution, large sample size, or ability to study cell cycle variation. Negative stain EM measurements of continuous Z-rings used FtsZ reconstituted in artificial lipid tubules (9), and a mutated version of FtsZ containing a membrane targeting sequence absent in native FtsZ, meaning that the degree to which these observations represent in vivo FtsZ organization is unclear. Cryo-EM observations of sparsely distributed FtsZ filaments in C. crescentus (10) cannot exclude the presence of a thin but complete Z-ring as a result of an inability to specifically discriminate structures based solely on electron density. Two-dimensional PALM measurements of the E. coli Z-ring (13, 14) could not conclusively prove either model because of the inherent limitations in using 2D imaging to study a 3D structure oriented perpendicular to the xy plane; a weakly interacting compressed helix model (13) was proposed based on observed axial thickness and density. Although recent 3D PALM measurements of the C. crescentus Z-ring provided a tantalizing initial glimpse of in vivo Z-ring organization, they suffered critically from a small sample size [a single 3D image of a Z-ring in a live cell (16), and a second image in a fixed cell], preventing conclusions on ring morphology from being drawn. Three-dimensional SIM measurements of B. subtilis and S. aureus Z-rings (15) containing small gaps and large density variations provided evidence for the patchy band model. However, these data were also consistent with the lateral interaction model. Many of the images showed continuous Z-rings, and only small single gaps were observed in any of the rings shown (15); these could quite reasonably be between the head and tail of an otherwise continuous Z-ring.
To draw clear and quantitative conclusions on Z-ring organization, and to measure cell cycle-dependent variation in ring morphology, we realized it would be necessary to perform 3D PALM for large numbers of cells throughout the bacterial cell cycle. We thus developed the hardware and software to implement high-throughput PALM (HTPALM), which can automatically acquire 3D PALM images of hundreds of cells over time scales of hours. We chose the C. crescentus model system, as the cell cycle of this Alphaproteobacterium is easily synchronizable (17), allowing us to image the Z-ring in hundreds of C. crescentus cells as a function of their cell cycle. We determined the in vivo 3D structure of the Z-ring, and measured changes in ring morphology during cell division and during an SOS response.
Results
HTPALM Allows Automated 3D PALM Measurements for Large Numbers of Bacteria Throughout the Cell Cycle.
We created a modality of PALM whereby hundreds of measurements can be performed without manual intervention. Briefly, this required the following technical issues to be addressed (SI Appendix, Fig. S1):
-
i)
Automated control of the density of active fluorophores. The density of active fluorophores (fluorophores in their bright state) must be low enough to allow single molecule localization. We implemented automated closed-loop feedback control of the density of active fluorophores (SI Appendix, Supplementary Note 1 and Fig. S2).
-
ii)
Reduction of drift. Drift during a PALM measurement causes loss of resolution, and is usually corrected by using randomly distributed fiducial markers as a spatial reference (18). However, the nonuniform distribution of these fiducial markers within the sample is incompatible with automation. We built a highly stable microscope that reduces xy-drift such that fiducial markers are not required and minimized z-drift by using a commercial autofocus system.
-
iii)
Automated identification of cells. Before acquisition, cells must be located within the sample; this is typically done manually via bright-field microscopy. However, bright-field microscopy offers insufficient contrast for robust automated identification of cells. Phase-contrast microscopy offers much higher contrast, but is usually incompatible with PALM, because the high-N.A. microscope objectives required do not contain a phase ring. We implemented external phase-contrast microscopy on our custom microscope; this allowed phase contrast-based automated identification of bacteria within the sample.
-
iv)
Location of superresolved structures relative to the rest of the cell. For biological interpretation of images, it is usually insufficient to merely resolve a labeled structure; it is also necessary to locate it relative to the rest of the cell. We oriented PALM localizations relative to outlines of the cell membrane generated by analysis of phase-contrast images with MicrobeTracker (19).
To address the evolution of Z-ring organization over the cell cycle, one could follow single cells over time. This was not technically feasible because the number of fluorescently labeled molecules in the cell limits the possible number of time-lapse PALM images of single cells. This limit is especially problematic in small cells such as bacteria or for low copy number proteins. To obtain high-quality images of in vivo FtsZ-Dendra2 localization throughout the cell cycle, we used HTPALM to carry out sequential imaging of hundreds of living cells (Fig. 2) by using a synchronized population of C. crescentus cells. Their stage in the cell cycle was determined by the time after synchrony at which the image of each cell was acquired, providing a complete picture of the time evolution of FtsZ localization at the nanoscale. It was also possible to use HTPALM to image cell-cycle variation in asynchronous populations by using cell length as an estimator of cell cycle position (19) (SI Appendix, Fig. S4), showing that our method can potentially also be used to study diverse nonsynchronizable bacterial species.
Fig. 2.

The 3D structure of the Z-ring throughout the C. crescentus cell cycle. (A) FtsZ axial localization relative to cell center as a function of time for 275 cells. Color map ranges from white (lowest density) to blue and then red (highest density). (B–E) Representative PALM images of FtsZ localization throughout the cell cycle, in xy (Left) and in zd cross-section (Right), where d is lateral distance from cell midplane in transformed xy coordinates, which removes the effect of cell curvature. Arrow indicates region shown in z cross-section. Yellow line indicates automatically determined cell outline. Corresponding phase-contrast images are shown in SI Appendix, Fig. S3A. (Scale bars, 500 nm.)
HTPALM of FtsZ-Dendra2 During the C. crescentus Cell Cycle.
We prepared cultures of a C. crescentus merodiploid strain containing the WT ftsZ gene and a chromosomal copy of a ftsZ-dendra2 fusion under the control of the native xylose-inducible xylX promoter (16). Cells were induced in M2G minimal medium containing 0.003% xylose for 3 h before isolating swarmer cells by density centrifugation, and mounting them on an agarose pad containing M2G and 0.003% xylose. The swarmer cell cycle duration (i.e., time until cells divided) under these conditions was ∼5 h. Growth curves and time-lapse images of cells grown in liquid media and on agarose pads, supplemented with 0.003% xylose, were indistinguishable from those for WT cells, showing that cell growth was not disturbed at this low level of induction. Immunoblot analysis showed that FtsZ-Dendra2 was expressed at lower levels than native FtsZ at this concentration of inducer, confirming that these cells did not accumulate a large excess of FtsZ or FtsZ-Dendra2 (SI Appendix, Fig. S5).
Imaging was performed on synchronized populations of swarmer cells as they transitioned into stalked cells and divided. Each PALM acquisition lasted 80 s and was performed at an exposure time of 10 ms with the use of astigmatic imaging for 3D localization (11). Spatial resolution (i.e., minimum resolvable distance between two objects; SI Appendix) was 35 nm in xy and 120 nm in z. Note that Z-ring images appear slightly (∼5%) elongated along the z axis compared with xy: this is most likely because of a small amount of image distortion along the z axis, rather than actual Z-ring asymmetry (SI Appendix).
Images of 280 fields of view were acquired in an automated fashion in 350 min. Cells were immobilized at low density to minimize errors in detection of the cell outline. After filtering the data (SI Appendix), we were left with HTPALM data for 275 bacteria. FtsZ-Dendra2 localizations were projected along the length of the cell and plotted as a function of time after synchrony, creating a low-resolution kymograph of FtsZ localization (Fig. 2A), which, together with PALM images (Fig. 2 B–E), recapitulated the expected microscale FtsZ localization profile (Fig. 1A). At the beginning of the cell cycle (Fig. 2B), cells contained mainly polar spots. In early predivisional cells (Figs. 2C and 3A), FtsZ was localized at midcell. In mid-/late predivisional cells (Figs. 2D and 3B), Z-ring diameter decreased, but morphology remained similar to that in the early predivisional stage. Finally, late predivisional/postdivisional cells mainly showed small spots (Figs. 2E). Interestingly, a few cells (Fig. 2B, ii) showed both polar spots and a midcell Z-ring during the early stages of the cell cycle, which we believe corresponds to the transition point between polar and midcell localization.
Fig. 3.

FtsZ predominantly forms patches or incomplete rings. (A) (i–v) Three-dimensional volume reconstruction of midcell FtsZ localization for five separate bacteria in the early predivisional stage of cell cycle. Complete rings (v) are much less common than the other morphologies shown. (B) (i–v) Midcell FtsZ localization for five bacteria in mid-/late predivisional stage of cell cycle. Corresponding 2D cross-section images are shown in SI Appendix, Fig. S6. Corresponding phase-contrast images are shown in SI Appendix, Fig. S3. A, ii and iv, and B, ii, correspond to the cells shown in Fig. 2 C, i and ii, and D, i, respectively.
Quantification of Cell Cycle Dependent Z-Ring 3D Morphology.
We analyzed Z-ring morphology by analyzing z cross-sections (Fig. 2 and SI Appendix, Fig. S6) and 3D volume reconstructions of the data (Fig. 3). An initial qualitative analysis of the data showed several distinct ring morphologies throughout the cell cycle. At the beginning of the cell cycle (Fig. 2B), cells contained mainly polar spots, which did not contain observable structure. In early predivisional cells (Figs. 2C and 3A and SI Appendix, Videos S1 and S2), FtsZ was localized at midcell, mainly as patches (Figs. 2 C, ii, and 3 A, i and iii and SI Appendix, Video S1), but also as incomplete rings (Figs. 2 C, i, and 3 A, ii and iv), and only rarely as complete rings (Fig. 3 A, v, and SI Appendix, Video S2). In mid-/late predivisional cells (Figs. 2D and 3B and SI Appendix, Videos S3 and S4), Z-ring radius decreased, but ring morphology remained similar to the early predivisional stage. Finally, late predivisional/postdivisional cells mainly showed small spots (Fig. 2E). Our initial qualitative analysis suggested that continuous rings were relatively rare at all stages of the cell cycle, conflicting with the lateral interactions model (Fig. 1C).
Next, we quantified Z-ring morphology for the same dataset. By using semiautomated analysis (SI Appendix, Fig. S7), FtsZ localizations for each of 275 cells were classified as patchy (SI Appendix, Fig. S7 A, ii, and B, ii, discontinuous annulus with all arcs <180°), incomplete rings (SI Appendix, Fig. S7 A, iii, and B, iii, discontinuous annulus with an arc >180°), complete rings (SI Appendix, Fig. S7 A, iv, and B, iv, continuous annulus), or spots/discs (SI Appendix, Fig. S7 A, i, and B, i, ellipsoid containing no holes).
The large sample size of the HTPALM dataset allowed us to quantify the occurrence of the different ring morphologies at different stages of the cell cycle. Initially, in the swarmer cell stage, 90% of bacteria show a polar spot/disk morphology (Fig. 4A, yellow area), with the remaining 10% being patchy. As the cell cycle progressed, the percentage of spots/disk dropped, reaching a minimum at approximately 170 min after synchrony. Subsequently, the percentage of spots/disks increased again, reaching 70% by the end of the experiment when new progeny swarmer and stalked cells could be observed. Analysis of ring-like morphologies (i.e., excluding the spot/disk morphology) showed that midcell patchy patterns are the most common (62%; Fig. 4A, green area), followed by incomplete rings (28%; Fig. 4A, purple area), with only a small fraction of complete rings (10%; Fig. 4A, orange area). Complete rings were observed more frequently for mid-/late predivisional cells (35% of ring-like morphology, 250–300 min post synchrony; Fig. 4A), but never became the dominant morphology. Again, these results conflict with the lateral interactions model (Fig. 1B).
Fig. 4.

Quantification of Z-ring contraction and morphology. (A) Semiautomated classification of Z-ring morphology as a function of the cell cycle (n = 275). (B–D) Z-ring diameter (B; n = 263), axial thickness (C: n = 263), and radial thickness (D; n = 141) as a function of the cell cycle. Because radial thickness could not be measured for the spot morphology, spots are not included in D. Ring contraction rate (B) is 0.8 nm/min. Mean axial thickness (C) is 71 nm. Mean radial thickness (D) is 64 nm. Gray circles indicate polar spots; yellow circles indicate midcell spots; green circles indicate patchy Z-rings; purple circles indicate incomplete Z-rings; orange circles indicate complete Z-rings; red line indicate fitted ring contraction rate. Orange shading indicates values below spatial resolution of measurement: axial and radial thickness, 35 nm (xy); diameter, 120 nm (z).
We also analyzed the dimensions of the Z-ring during the cell cycle (Fig. 4 B–D and SI Appendix). Ring diameter (Fig. 4B) and axial thickness (Fig. 4C) were estimated for 263 bacteria throughout the cell cycle. Radial thickness (Fig. 4D) was estimated for 141 bacteria containing Z-rings; i.e., the spot morphology was excluded from this analysis. Rings were classified as polar (Fig. 4 B and C, circles with no outline) or midcell (Fig. 4 B–D, outlined circles) based on their position relative to midcell.
At the beginning of the synchrony, all cells showed polar localization, with ring diameter of 100–200 nm (Fig. 4B, gray circles). At ∼50 min postsynchrony, cells began to display midcell Z-ring localization, and by 120 min postsynchrony, polar localization was rare (Fig. 4B). From 50 to 150 min postsynchrony, midcell Z-ring diameter remained at ∼550 nm. Soon after appearance of midcell rings, ring contraction commenced (t > 150 min, coincident with the onset of invagination; SI Appendix, Fig. S10). A linear fit to the data (Fig. 4B, red line) gave an estimated contraction rate of 0.8 nm/min for these experimental conditions. Contractile rings reached a minimum diameter of ∼350 nm at t 300 min. For t > 250 min, midcell spots (Fig. 4B, yellow circles) were common, with diameters of approximately 100–200 nm. Interestingly, the population of data points corresponding to contracting rings (Fig. 4B, data points in region of fitted red line) was well separated from the data points corresponding to late-cell cycle midcell spots of diameter ∼150 nm (Fig. 4B, yellow circles). This suggests that there may be a final period of rapid Z-ring constriction at the end of the cell cycle. Finally, after t > 300 min, a small number of larger-diameter rings (diameter ∼500 nm) were observed, which presumably corresponds to the beginning of a second round of cytokinesis by daughter cells.
Axial Z-ring thickness (Fig. 4C) was approximately constant with time, with a thickness of 50–100 nm and a mean of 71 nm. Radial ring thickness was similarly constant (Fig. 4C), with a thickness between 50 and 100 nm and a mean thickness of 64 nm. The minimum observed thickness was ∼40 nm for radial and axial measurements, close to the spatial resolution (35 nm xy; SI Appendix).
Induction of DNA Damage by Mitomycin C Produced Continuous Axially Extended Nonconstricting Z-Rings.
Bacteria respond to DNA damage with a gene expression program known as the SOS response (20), which inhibits cell division until DNA repair is complete. In C. crescentus, this leads to cytokinesis arrest, cell filamentation, and a persistent Z-ring (20). We investigated whether DNA damage induced changes in Z-ring organization.
DNA damage was induced by adding cells to agarose pads containing mitomycin C (MMC) (20). Cells grew very slowly and became filamentous, with persistent Z-rings, as expected. After growth for >5 h in the presence of MMC, Z-rings with a continuous, high-density, axially extended structure were observed (SI Appendix, Fig. S12 and Videos S5 and S6). Comparison of Z-ring volume for native and MMC treated cells showed a highly statistically significant difference (SI Appendix, Fig. S12C). This structural change suggests that FtsZ protofilaments may be stabilized during the DNA damage response in C. crescentus. Because the arrest of cytokinesis correlates with complete Z-rings, this also supports the patchy band model because it suggests that the sparse patchy Z-rings, rather than high-density continuous Z-rings, are required for division to proceed.
We investigated whether induction of the SOS response by deleting the SOS regulator lexA (21) would affect also affect Z-ring organization. Although Z-ring volume increased (SI Appendix, Fig. S13), this effect was minor and not statistically significant compared with that observed after MMC-induced DNA damage. This indicates that the continuous high-density Z-rings can only partly be explained by a LexA-induced response, and that other mechanism(s) affect Z-ring organization after DNA damage.
Discussion
HTPALM: An Automated Modality of 3D PALM.
We developed HTPALM, and used it to perform 3D PALM imaging of FtsZ-Dendra2 on hundreds of live C. crescentus cells throughout the cell cycle. This allowed us to perform quantitative analysis of the nanoscale morphology of the Z-ring. It should be possible to extend it to even larger sample sets by using cameras with larger fields of view and by combining it with established high-throughput technologies such as multiwell plates and microfluidics. HTPALM is equally applicable to eukaryotic systems, and may be especially useful in efforts to image the connectivity of neural circuits over large volumes (22).
C. crescentus Z-Ring Organization Throughout the Cell Cycle.
Two main models for FtsZ organization have been proposed: the lateral interaction model (Fig. 1C) (9), whereby a continuous ring or compressed helix is stabilized by lateral interactions between FtsZ protofilaments, and the patchy band model (Fig. 1B) (10), whereby short largely noninteracting FtsZ protofilaments are arranged in a scattered midcell band. Z-ring organization might also be cell cycle-dependent; e.g., the Z-ring may initial form a noninteracting patchy band, but reorganize into a continuous ring before onset of constriction. The development of HTPALM allowed us to investigate each of these possibilities.
HTPALM of the C. crescentus Z-ring revealed a patchy band as the most common morphology, with continuous rings being rare (Fig. 4A). Although continuous Z-rings became more common later in the cell cycle (250–300 min postsynchrony; Fig. 4A) they never became the dominant morphology, as would have been predicted by the lateral interactions model. The Z-ring was observed to begin constriction soon after formation at midcell (Fig. 4B), constricting linearly from 550 nm to 350 nm at 0.8 nm/min. Interestingly, the linear contraction stage stopped at ∼350 nm minimum diameter (t ∼ 300 min; Fig. 4B). At approximately this time, a population of midcell spots with ∼150-nm diameters appeared (Fig. 4B, yellow circles); the populations of data points corresponding to the linear contraction stage and the midcell spots are well separated. The lack of intermediate states, despite the large number of cells imaged, suggests that a period of rapid ring contraction from 350-nm to 150-nm diameter occurs at the end of the cell cycle, perhaps related to the final scission step in cytokinesis. We note that it would have been difficult to detect indications of this transition without the quantitative analysis of large numbers of cells facilitated by HTPALM.
The radial and axial Z-ring thicknesses changed little over the cell cycle, and were in the range of 50–100 nm, with mean thicknesses of 64 nm and 71 nm, respectively (Fig. 4 C and D). Z-ring minimum thickness in each case was ∼40 nm, which is close to the limit of spatial resolution of our measurements (35 nm xy; Fig. 4, orange shaded region). These observations are consistent with a patchy distribution of single protofilaments, some of which are nonoverlapping, and thus resolution-limited with a thickness of ∼40 nm, and some of which overlap, and thus have increased apparent thickness of 50–100 nm. It is also possible that the frequently observed axial thickness of ∼50 nm corresponds not to overlapping single protofilaments, but to a ribbon consisting of two to four protofilaments stabilized by lateral interactions. In this case, intermediate between the two models in Fig. 1, patchy Z-rings could be composed of randomly distributed FtsZ ribbons of several protofilaments stabilized by lateral interactions.
We interpret these results as consistent with the patchy band model (Fig. 1B) between the late stalked to late predivisional cell cycle stages (Fig. 5 A, i and ii), followed by a period of rapid Z-ring contraction of unknown mechanism, coincident with or just before scission into two cells (Fig. 5 A, iii). At the late stalked stage, the Z-ring assembles at midcell. Between the late stalked to late predivisional stages, we assume a Z-ring composed of a limited number of protofilaments that lack lateral interactions and are randomly distributed (Fig. 5 A, i). When the Z-ring has large diameter in early predivisional cells, it is largely patchy, i.e., composed of isolated protofilaments that only occasionally overlap. As the cell cycle progresses, the ring diameter decreases, increasing the probability that protofilaments will overlap sufficiently to appear as incomplete or continuous rings given the spatial resolution of PALM (Fig. 5 A, ii). During this period, the Z-ring contracts at a linear rate from ∼550-nm diameter to ∼350-nm diameter. Finally, at the end of the late predivisional stage (Fig. 5 A, iii), based on our measurements of ring diameter throughout the cell cycle, we hypothesize a period of rapid ring contraction from 350-nm diameter to a spot-like structure of 100-nm diameter, followed by or coincident with scission. Because we could not directly observe this transition, Z-ring organization during the hypothesized rapid contraction stage is unknown, and requires further investigation.
Fig. 5.
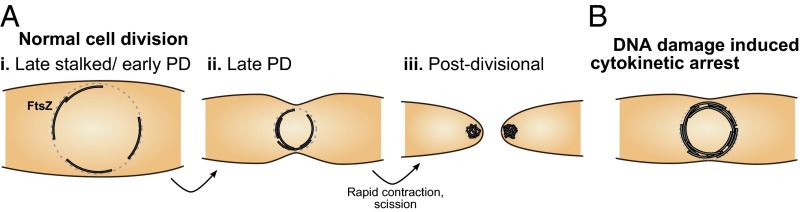
Model of Z-ring organization, including information from HTPALM measurements. (A) (i) During the late stalked/early predivisional (PD) cell-cycle stage, the Z-ring assembles at midcell. Sparsely distributed noninteracting protofilaments are randomly distributed around the circumference of the inner membrane, forming a patchy band. (ii) As the cell cycle progresses (late PD), Z-ring radius decreases. Reduced radius means randomly distributed protofilaments are more likely to overlap circumferentially. (iii) At the end of the late PD stage, a period of rapid Z-ring contraction occurs, coincident with or followed by scission. (B) During DNA damage-induced cytokinesis arrest, many FtsZ protofilaments assemble at midcell to form a high-density Z-ring, which may obstruct cytokinesis.
The Patchy Z-Ring Is Unlikely to Be an Experimental Artifact.
The conclusions of this study require that the 3D PALM images of FtsZ-Dendra2 are an accurate representation of native FtsZ structure. One possible problem would be present if insufficient molecule localizations were obtained to reconstruct a high-resolution Z-ring structure; however, on average, 849 ± 394 single molecules were localized for each Z-ring (SI Appendix, Table S1), and the number of localizations per image was sufficient to obtain a Nyquist–Shannon limited resolution (23) of 20 nm (SI Appendix), smaller than the size of structures studied here. We also acquired Z-ring images in 20 s instead of 80 s (SI Appendix, Fig. S8). Although fewer molecules were localized molecules per Z-ring (205 ± 157), this did not significantly change the image resolution; it reduced the Nyquist-limited resolution to 40 nm (SI Appendix), similar to the (photon count-limited) 35-nm xy spatial resolution of the 80-s and 20-s data. Z-ring morphology for the 20-s condition was very similar to that in the 80-s data.
Another possibility is that FtsZ-Dendra2 structures were not representative of the native Z-ring structure. We tested this by increasing the relative concentration of FtsZ-Dendra2 to FtsZ. FtsZ-Dendra2 was expressed at a low level (FtsZ 17% of native level, 0.003% xylose; SI Appendix, Fig. S5) to avoid perturbing native FtsZ localization, and to avoid inducing cell filamentation. Induction at a higher level (0.015% xylose) increased the proportion of fluorescently labeled FtsZ in the ring to 75% of the native level (SI Appendix, Fig. S5) but did not alter ring morphology (SI Appendix, Fig. S4), showing that ring morphology is not simply dependent on FtsZ-Dendra2 intracellular levels.
The fact that that it is indeed possible to observe complete Z-rings (Fig. 3) also argues against the possibility of aggregative, nonfunctional FtsZ-Dendra2. Similarly, DNA damage induces complete Z-rings that are dense and axially extended, showing that FtsZ-Dendra2 organization is responsive to biological perturbations to cytokinesis, and therefore likely reflects native FtsZ structure. Finally, in a 3D-SIM study of Z-ring organization in B. subtilis (15), native FtsZ was entirely replaced with an FtsZ-GFP fusion; large intensity variations and occasional small gaps were observed in the Z-ring. This evidence for a patchy Z-ring, obtained in a different organism, by using a different labeling strategy and imaging technique, further suggests that it is not an artifact of incomplete labeling.
Together, these data strongly suggest that the patchy Z-ring observed by imaging of FtsZ-Dendra2 accurately represents native FtsZ localization.
DNA Damage Produces Axially Extended Continuous Rings.
During the SOS response, which occurs in response to DNA damage, bacterial cell division is inhibited until the chromosomes have been repaired. In E. coli, the SOS response triggers the expression of DNA repair genes as well as a cell division inhibitor SulA, which inhibits FtsZ polymerization and prevents cell division (24). C. crescentus does not encode a SulA homolog, but DNA damage induces expression of the SidA protein, which probably targets the late cell division protein FtsW and inhibits constriction (20). It is probable that additional mechanisms of cell division inhibition exist in C. crescentus (20).
We observed that induction of the DNA damage not only produced persistent Z-rings, but significantly altered ring morphology, producing continuous, axially extended, high-density rings (SI Appendix, Fig. S12). We speculate that this high-density structure could physically obstruct cell constriction, and thus that an additional mechanism may directly target the polymerization dynamics of FtsZ to prevent cytokinesis after DNA damage, as is the case in E. coli and Pseudomonas (25). Induction of the SOS response by deleting the master regulator LexA did not produce high density Z-rings (although a minor increase in volume was observed; SI Appendix, Fig. S13), suggesting that DNA damage mostly affects Z-ring organization independent of LexA.
These data also have implications for the models of Z-ring organization, as they reinforce the correspondence between discontinuous ring morphology and contractility; i.e., whereas patchy Z-rings are contractile, DNA damage-induced high-density continuous rings are not. This may be a result of the dynamicity of the FtsZ protofilaments under normal growth conditions, which are stabilized to form complete rings after DNA damage.
Implications of a Patchy Z-Ring for Models of Cytokinesis.
Our data show the Z-ring is a not continuous ring or compressed helix in C. crescentus, as the majority of Z-rings studied were composed of one or more short arcs <180° in extent. Rather, it is most likely a patchy band that is sparsely distributed with isolated protofilaments, or short ribbons of protofilaments stabilized by lateral interactions. This has important implications for our understanding of the role of FtsZ in cytokinesis.
FtsZ may provide a constrictive force during cytokinesis (2, 9, 26). It is straightforward to devise models of constrictive force generation based on the lateral interactions model, as an extended Z-ring structure provides a simple platform for large-scale transduction of constrictive force. However, the patchy band model would appear to support fewer mechanisms for generation of a sustained (rather than transient) constrictive force, especially because individual protofilaments undergo rapid turnover on the time scale of ∼10 s (27, 28). A previously suggested force generation model compatible with a patchy Z-ring is the “iterative pinching model” (10), which posits that membrane-bound FtsZ protofilaments undergo a GTP hydrolysis-driven transition to a highly curved conformation, followed quickly by filament unbinding/depolymerization, providing a constrictive force. If this model is correct, we anticipate that it might be possible to directly resolve this process of rapid ring remodeling by using fast (5–10 s per image) time-resolved 3D PALM; this is an exciting target for further research.
It has also been proposed that the Z-ring may provide a stable scaffold around which the >20 other divisome proteins (29) might assemble. However, it is difficult to imagine how a patchy dynamic band could act as an efficient scaffold. Perhaps FtsZ instead acts only as a recruiter of other divisome proteins, with one of the other divisome proteins acting as a scaffold; HTPALM imaging of other divisome proteins may resolve this question.
Materials and Methods
Detailed materials and methods are provided in the SI Appendix. Strain construction, sample preparation, microscope hardware, and data analysis procedures are described.
Supplementary Material
Acknowledgments
We thank Erin Goley (John Hopkins University, Baltimore, MD) for plasmids and comments on the manuscript, Philip Groeger for technical assistance, and Pavan Ramdya for comments on the manuscript. This work was supported by European Research Council Starting Grant 243016 (to S.J.H. and S.M.), Marie Curie Intra-European Fellowship PIEF-GA-2011-297918 (to S.J.H.), the Brazilian Swiss Joint Research Programme (T.P.), the University of Lausanne (J.C. and C.F.F.), and Swiss National Science Foundation Fellowships 3100A0_122541 and 31003A_140758 (to J.C. and C.F.F.).
Footnotes
The authors declare no conflict of interest.
This article is a PNAS Direct Submission. J.L. is a guest editor invited by the Editorial Board.
This article contains supporting information online at www.pnas.org/lookup/suppl/doi:10.1073/pnas.1313368111/-/DCSupplemental.
References
- 1.Goehring NW, Beckwith J. Diverse paths to midcell: Assembly of the bacterial cell division machinery. Curr Biol. 2005;15(13):R514–R526. doi: 10.1016/j.cub.2005.06.038. [DOI] [PubMed] [Google Scholar]
- 2.Osawa M, Anderson DE, Erickson HP. Curved FtsZ protofilaments generate bending forces on liposome membranes. EMBO J. 2009;28(22):3476–3484. doi: 10.1038/emboj.2009.277. [DOI] [PMC free article] [PubMed] [Google Scholar]
- 3.Li Y, et al. FtsZ protofilaments use a hinge-opening mechanism for constrictive force generation. Science. 2013;341(6144):392–395. doi: 10.1126/science.1239248. [DOI] [PMC free article] [PubMed] [Google Scholar]
- 4.Margalit DN, et al. Targeting cell division: Small-molecule inhibitors of FtsZ GTPase perturb cytokinetic ring assembly and induce bacterial lethality. Proc Natl Acad Sci USA. 2004;101(32):11821–11826. doi: 10.1073/pnas.0404439101. [DOI] [PMC free article] [PubMed] [Google Scholar]
- 5.Haydon DJ, et al. An inhibitor of FtsZ with potent and selective anti-staphylococcal activity. Science. 2008;321(5896):1673–1675. doi: 10.1126/science.1159961. [DOI] [PubMed] [Google Scholar]
- 6.Bi EF, Lutkenhaus J. FtsZ ring structure associated with division in Escherichia coli. Nature. 1991;354(6349):161–164. doi: 10.1038/354161a0. [DOI] [PubMed] [Google Scholar]
- 7.Romberg L, Levin PA. Assembly dynamics of the bacterial cell division protein FTSZ: Poised at the edge of stability. Annu Rev Microbiol. 2003;57:125–154. doi: 10.1146/annurev.micro.57.012903.074300. [DOI] [PMC free article] [PubMed] [Google Scholar]
- 8.Romberg L, Simon M, Erickson HP. Polymerization of Ftsz, a bacterial homolog of tubulin. is assembly cooperative? J Biol Chem. 2001;276(15):11743–11753. doi: 10.1074/jbc.M009033200. [DOI] [PubMed] [Google Scholar]
- 9.Milam SL, Osawa M, Erickson HP. Negative-stain electron microscopy of inside-out FtsZ rings reconstituted on artificial membrane tubules show ribbons of protofilaments. Biophys J. 2012;103(1):59–68. doi: 10.1016/j.bpj.2012.05.035. [DOI] [PMC free article] [PubMed] [Google Scholar]
- 10.Li Z, Trimble MJ, Brun YV, Jensen GJ. The structure of FtsZ filaments in vivo suggests a force-generating role in cell division. EMBO J. 2007;26(22):4694–4708. doi: 10.1038/sj.emboj.7601895. [DOI] [PMC free article] [PubMed] [Google Scholar]
- 11.Huang B, Wang W, Bates M, Zhuang X. Three-dimensional super-resolution imaging by stochastic optical reconstruction microscopy. Science. 2008;319(5864):810–813. doi: 10.1126/science.1153529. [DOI] [PMC free article] [PubMed] [Google Scholar]
- 12.Gustafsson MGL, et al. Three-dimensional resolution doubling in wide-field fluorescence microscopy by structured illumination. Biophys J. 2008;94(12):4957–4970. doi: 10.1529/biophysj.107.120345. [DOI] [PMC free article] [PubMed] [Google Scholar]
- 13.Fu G, et al. In vivo structure of the E. coli FtsZ-ring revealed by photoactivated localization microscopy (PALM) PLoS ONE. 2010;5(9):e12682. doi: 10.1371/journal.pone.0012680. [DOI] [PMC free article] [PubMed] [Google Scholar]
- 14.Buss J, et al. In vivo organization of the FtsZ-ring by ZapA and ZapB revealed by quantitative super-resolution microscopy. Mol Microbiol. 2013;89(6):1099–1120. doi: 10.1111/mmi.12331. [DOI] [PMC free article] [PubMed] [Google Scholar]
- 15.Strauss MP, et al. 3D-SIM super resolution microscopy reveals a bead-like arrangement for FtsZ and the division machinery: Implications for triggering cytokinesis. PLoS Biol. 2012;10(9):e1001389. doi: 10.1371/journal.pbio.1001389. [DOI] [PMC free article] [PubMed] [Google Scholar]
- 16.Biteen JS, Goley ED, Shapiro L, Moerner WE. Three-dimensional super-resolution imaging of the midplane protein FtsZ in live Caulobacter crescentus cells using astigmatism. ChemPhysChem. 2012;13(4):1007–1012. doi: 10.1002/cphc.201100686. [DOI] [PMC free article] [PubMed] [Google Scholar]
- 17.Collier J, Shapiro L. Spatial complexity and control of a bacterial cell cycle. Curr Opin Biotechnol. 2007;18(4):333–340. doi: 10.1016/j.copbio.2007.07.007. [DOI] [PMC free article] [PubMed] [Google Scholar]
- 18.Betzig E, et al. Imaging intracellular fluorescent proteins at nanometer resolution. Science. 2006;313(5793):1642–1645. doi: 10.1126/science.1127344. [DOI] [PubMed] [Google Scholar]
- 19.Sliusarenko O, Heinritz J, Emonet T, Jacobs-Wagner C. High-throughput, subpixel precision analysis of bacterial morphogenesis and intracellular spatio-temporal dynamics. Mol Microbiol. 2011;80(3):612–627. doi: 10.1111/j.1365-2958.2011.07579.x. [DOI] [PMC free article] [PubMed] [Google Scholar]
- 20.Modell JW, Hopkins AC, Laub MT. A DNA damage checkpoint in Caulobacter crescentus inhibits cell division through a direct interaction with FtsW. Genes Dev. 2011;25(12):1328–1343. doi: 10.1101/gad.2038911. [DOI] [PMC free article] [PubMed] [Google Scholar]
- 21.da Rocha RP, Paquola AC, Marques MdoV, Menck CFM, Galhardo RS. Characterization of the SOS regulon of Caulobacter crescentus. J Bacteriol. 2008;190(4):1209–1218. doi: 10.1128/JB.01419-07. [DOI] [PMC free article] [PubMed] [Google Scholar]
- 22.Alivisatos AP, et al. Nanotools for neuroscience and brain activity mapping. ACS Nano. 2013;7(3):1850–1866. doi: 10.1021/nn4012847. [DOI] [PMC free article] [PubMed] [Google Scholar]
- 23.Shroff H, Galbraith CG, Galbraith JA, Betzig E. Live-cell photoactivated localization microscopy of nanoscale adhesion dynamics. Nat Methods. 2008;5(5):417–423. doi: 10.1038/nmeth.1202. [DOI] [PMC free article] [PubMed] [Google Scholar]
- 24.Erill I, Campoy S, Barbé J. Aeons of distress: an evolutionary perspective on the bacterial SOS response. FEMS Microbiol Rev. 2007;31(6):637–656. doi: 10.1111/j.1574-6976.2007.00082.x. [DOI] [PubMed] [Google Scholar]
- 25.Chen Y, Milam SL, Erickson HP. SulA inhibits assembly of FtsZ by a simple sequestration mechanism. Biochemistry. 2012;51(14):3100–3109. doi: 10.1021/bi201669d. [DOI] [PMC free article] [PubMed] [Google Scholar]
- 26.Osawa M, Erickson HP. Liposome division by a simple bacterial division machinery. Proc Natl Acad Sci USA. 2013;110(27):11000–11004. doi: 10.1073/pnas.1222254110. [DOI] [PMC free article] [PubMed] [Google Scholar]
- 27.Stricker J, Maddox P, Salmon ED, Erickson HP. Rapid assembly dynamics of the Escherichia coli FtsZ-ring demonstrated by fluorescence recovery after photobleaching. Proc Natl Acad Sci USA. 2002;99(5):3171–3175. doi: 10.1073/pnas.052595099. [DOI] [PMC free article] [PubMed] [Google Scholar]
- 28.Anderson DE, Gueiros-Filho FJ, Erickson HP. Assembly dynamics of FtsZ rings in Bacillus subtilis and Escherichia coli and effects of FtsZ-regulating proteins. J Bacteriol. 2004;186(17):5775–5781. doi: 10.1128/JB.186.17.5775-5781.2004. [DOI] [PMC free article] [PubMed] [Google Scholar]
- 29.Goley ED, et al. Assembly of the Caulobacter cell division machine. Mol Microbiol. 2011;80(6):1680–1698. doi: 10.1111/j.1365-2958.2011.07677.x. [DOI] [PMC free article] [PubMed] [Google Scholar]
Associated Data
This section collects any data citations, data availability statements, or supplementary materials included in this article.