Abstract
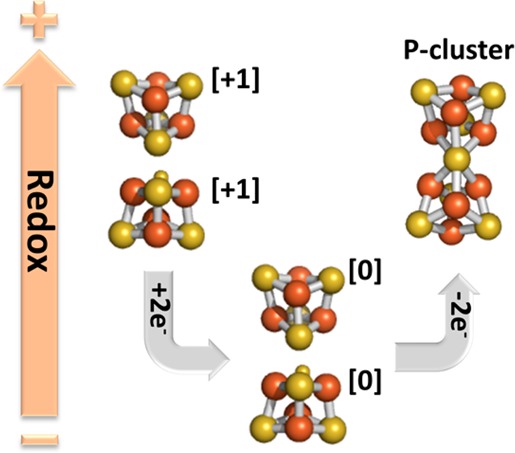
The P-cluster in the nitrogenase MoFe protein is a [Fe8S7] cluster and represents the most complex FeS cluster found in Nature. To date, the exact mechanism of the in vivo synthesis of the P-cluster remains unclear. What is known is that the precursor to the P-cluster is a pair of neighboring [Fe4S4]-like clusters found on the ΔnifH MoFe protein, a protein expressed in the absence of the nitrogenase Fe protein (NifH). Moreover, incubation of the ΔnifH MoFe protein with NifH and MgATP results in the synthesis of the MoFe protein P-clusters. To improve our understanding of the mechanism of this reaction, we conducted a magnetic circular dichroism (MCD) spectroscopic study of the [Fe4S4]-like clusters on the ΔnifH MoFe protein. Reducing the ΔnifH MoFe protein with Ti(III) citrate results in the quenching of the S = 1/2 electron paramagnetic resonance signal associated with the [Fe4S4]+ state of the clusters. MCD spectroscopy reveals this reduction results in all four 4Fe clusters being converted into the unusual, all-ferrous [Fe4S4]0 state. Subsequent increases of the redox potential generate new clusters. Most significantly, one of these newly formed clusters is the P-cluster, which represents approximately 20–25% of the converted Fe concentration. The other two clusters are an X cluster, of unknown structure, and a classic [Fe4S4] cluster, which represents approximately 30–35% of the Fe concentration. Diamagnetic FeS clusters may also have been generated but, because of their low spectral intensity, would not have been identified. These results demonstrate that the nitrogenase P-cluster can be generated in the absence of NifH and MgATP.
FeS clusters are ubiquitous in Nature, existing mainly as 2Fe, 3Fe, and 4Fe structures.1,2 These clusters aid in electron transfer and also serve as structural and catalytic units.3 Over the past decade, a great deal of research has been undertaken to understand the mechanism of the enzymatic synthesis of these clusters. Numerous enzymes, mainly associated with the synthesis of [Fe2S2] and [Fe4S4] clusters, have been identified in both eukaryotic and prokaryotic systems.4
The biosynthesis of larger (>4Fe) clusters is less understood. This work focuses on the synthesis of the large P-cluster of the nitrogenase system. Nitrogenase catalyzes the reduction of atmospheric N2 to NH3. The enzyme consists of two separable proteins, the Fe protein (NifH) and the MoFe protein (NifDK).5 NifH is a γ2 dimer containing a single [Fe4S4] cluster bound between the two subunits and one ATP binding site within each subunit. NifDK is an α2β2 tetramer and contains two different metallocenters per αβ subunit pair: a P-cluster ([Fe8S7]) bound at each αβ subunit interface and an FeMo cofactor (FeMoco, [MoFe7S9C-homocitrate])6 bound within each α subunit.7 During enzymatic turnover, NifH binds to NifDK and donates an electron to the latter in a process involving ATP hydrolysis. Electron transfer progresses from the [Fe4S4] cluster of NifH through the P-cluster to the FeMoco portion of NifDK, where substrate reduction occurs. For nitrogen fixation, this process is repeated eight times in a cycle known as the Lowe–Thorneley (LT) scheme.5
The P-cluster (Figure 1) can be viewed as two [Fe4S4] clusters sharing a common S atom, and the structure of this cluster is redox-dependent.8 Consistent with this view, recent research9−13 has identified the precursor of the P-cluster as two neighboring [Fe4S4]-like clusters per αβ subunit pair of the tetrameric ΔnifH NifDK. As the name implies, ΔnifH NifDK is generated by deleting nifH, a gene that encodes NifH. Because NifH is necessary for FeMoco biosynthesis, the resultant ΔnifH NifDK lacks FeMoco and contains only the P-cluster precursor, which is a pair of [Fe4S4]-like clusters.
Figure 1.
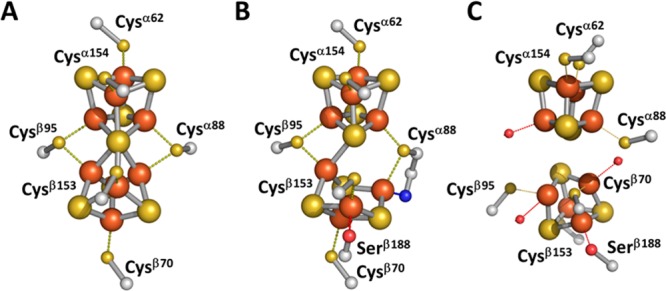
Structure of the P-cluster in (A) the DTN-reduced (PN) state and (B) the IDS-oxidized (P2+ or POX) state and (C) proposed structure of the P-cluster precursor in ΔnifH NifDK.
The in vitro enzymatic synthesis of the P-cluster occurs when ΔnifH NifDK is incubated with NifH, MgATP, and a reductant [typically dithionite (DTN)].13 The mechanism of this conversion is currently unknown but likely involves a NifH-mediated, reductive coupling of the neighboring clusters on ΔnifH NifDK. To investigate the mechanism of this synthesis, a magnetic circular dichroism (MCD) spectroscopic study of the [Fe4S4]-like clusters in ΔnifH NifDK, poised at different redox potentials, was undertaken. This study reveals that the [Fe4S4]-like clusters on ΔnifH NifDK can be reduced to the all-ferrous [Fe4S4]0 state. Subsequent increases in the redox potential of the all-ferrous clusters result in the nonenzymatic formation of P-clusters in the absence of NifH and MgATP.
Experimental Procedures
Unless noted otherwise, all chemicals and reagents were obtained from Fisher Scientific or Sigma-Aldrich.
Cell Growth and Protein Purification
All Azobacter vinelandii strains were grown in 180 L batches in a 200 L New Brunswick fermentor in Burke’s minimal medium supplemented with 2 mM ammonium acetate. The growth rate was measured by cell density at 436 nm. After ammonia had been consumed, the cells were de-repressed for 3 h and subsequently harvested by using a flow-through centrifugal harvester (Cepa, Lahr/Schwarzwald, Germany). The cell paste was washed with 50 mM Tris-HCl (pH 8.0). The ΔnifH NifDK, ΔnifB NifDK, and wild-type NifH proteins used in this work were purified as described previously.9,14
Sample Preparation
All MCD samples were prepared in an Ar-filled anaerobic chamber (Vacuum Atmospheres, Hawthorne, CA) at an oxygen level of <4 ppm.11 The Ti(III) citrate solution was prepared as described previously.15 DTN-reduced protein samples were in 25 mM Tris-HCl (pH 8.0), 10% glycerol, and 2 mM dithionite (Na2S2O4). Ti(III) citrate-reduced protein samples were prepared by incubating protein with 12 mM Ti(III) citrate for 5 min and subsequently removing excess Ti(III) citrate with a G25 size-exclusion column. Indigo disulfonate (IDS)-oxidized protein samples were prepared by incubating samples with IDS for 5 min and subsequently removing excess IDS with a G25 size-exclusion column. Samples were then concentrated to ∼70 mg/mL in a Centricon-50 concentrator (Amicon) as described previously,14 transferred to MCD sample cuvettes, and frozen in a liquid nitrogen/pentane slush. All samples contained 50% glycerol to ensure the formation of an optical glass upon freezing, and they were kept on dry ice during transit.
MCD Spectroscopy
MCD spectra were recorded with a modified CD spectropolarimeter (model J-715, Jasco) interfaced with a superconducting magnet (model 400-7T Spectromag, Oxford). Sample temperatures were monitored with two thin film resistance temperature sensors [model CX1050-Cu-1-4L (Lakeshore, Westerville, OH)] positioned directly (1 mm) above and below the sample cuvette. The linearity of the magnetic field was monitored with a calibrated Hall generator [model HGCA-3020 (Lakeshore)] placed directly outside the superconducting magnet.
MCD sample cells were constructed from optical-quality Spectrosil quartz [170–2200 nm, 1 mm path length, model BS-1-Q-1, Starna, model SUV R-1001 or FUV (Spectrocell, Oreland, PA)]. Each cuvette was cut into the appropriate dimensions to fit the sample holder (2.0 cm × 12.5 mm), resulting in a sample volume of approximately 160 μL.
MCD spectra were recorded at a rate of 50 nm/min and a resolution of 10 nm. Two different photomultipliers were used, one with a spectral range of 200–900 nm and the other with a spectral range of 700–1050 nm. Because of the strong absorbance of DTN, all of the spectra presented herein start at ≥350 nm. Because optical glasses formed at low temperatures often generate a strain-induced background CD spectrum, the CD spectrum was recorded in zero magnetic field to determine whether the background signal was excessive. To eliminate interference by any background CD signal, the corrected MCD spectrum was obtained for each sample by first recording the spectrum with the magnetic field in one direction and then subtracting from it the spectrum with the field in the opposite direction. All spectral intensities were corrected for path length and sample concentration.
Analysis of Magnetization Data
Magnetization curves were recorded at a set wavelength and temperature while the magnetic field was linearly varied from 0 to 6 T at a rate of 0.1 A/s with a resolution of 2 s. MCD magnetization data were analyzed by a previously published fit/simulation program.16 The program allows the calculation of best-fit saturation magnetization curves using experimental data as a basis set and is valid for any spin state, half-integer or integer, at any specified temperature.
Experimental data were analyzed by fitting the Spin Hamiltonian parameters (g for S = 1/2 and D and E/D for S > 1/2) and the effective transition moment products, Mxyeff, Mxz, and Mxyeff, with a scaling parameter Asatlim = γ/4πS, where γ is the magnetogyric ratio. The effective transition moment products represent the planes of polarization that reflect the anisotropy of the g factors. Because the initial slope of the magnetization curve is dependent on the g factors, the transition polarizations relate the transition dipole to the g factor axes of a powder or randomly oriented sample.
Results
ΔnifH NifDK contains two P-cluster precursors (i.e., two pairs of [Fe4S4]-like clusters) and exhibits several highly unusual and fascinating properties. A previous MCD spectroscopic study11,17 on the as-isolated ΔnifH NifDK revealed the first unusual property of this protein. As expected, all four clusters exist in the classic [Fe4S4]+ state in the presence of DTN, exhibiting an S = 1/2 EPR signal. Oxidation with IDS converts all four clusters into the EPR-silent [Fe4S4]2+ state. However, contrary to all past studies of [Fe4S4]2+ clusters, which have always shown them to be diamagnetic, the [Fe4S4]2+ clusters in ΔnifH NifDK are paramagnetic. This observation suggests that the clusters possess an unusual structure or coupling, which is different from that of any previously investigated [Fe4S4] cluster. Moreover, the unusual structure or coupling may be instrumental in converting the neighboring [Fe4S4]-like clusters into an 8Fe P-cluster.
The [Fe4S4]-like clusters in the as-isolated ΔnifH NifDK exhibit another fascinating property. Addition of the strong reductant Ti(III) citrate bleaches the S = 1/2 EPR signal that is associated with the [Fe4S4]+ state, making the system EPR-silent.9 This observation suggests that the clusters may be further reduced to an all-ferrous [Fe4S4]0 state. The [Fe4S4]0 state is highly unusual. To date, only two [Fe4S4] proteins, namely, NifH15,18,19 and 2-hydroxyglutaryl-CoA-dehydratase,20 have been shown to exhibit the all-ferrous state. The all-ferrous [Fe4S4]0 cluster in NifH is paramagnetic with an S = 4 spin state, as verified by Mössbauer, EPR, and MCD spectroscopic techniques.15,19,21 To determine whether the clusters in ΔnifH NifDK can similarly exist in the all-ferrous state, MCD spectra of Ti(III) citrate-reduced NifH and ΔnifH NifDK were recorded and compared. The two spectra (Figure 2) are nearly identical except that the intensity of the ΔnifH NifDK spectrum is approximately 4 times that of NifH. This ratio is consistent with the stoichiometry of the clusters in each protein and reveals that all four of the clusters in ΔnifH NifDK can exist in the all-ferrous [Fe4S4]0 state. To further verify the identity of the all-ferrous clusters in ΔnifH NifDK, magnetization curves of the spectra of both NifH and ΔnifH NifDK at 720 nm and 1.6 K were constructed and compared. The near-identical nature of both curves (Figure 3) further supports the conclusion that all of the [Fe4S4]-like clusters in ΔnifH NifDK can be reduced to the unusual all-ferrous state and also implies that these clusters have an S = 4 spin state.
Figure 2.
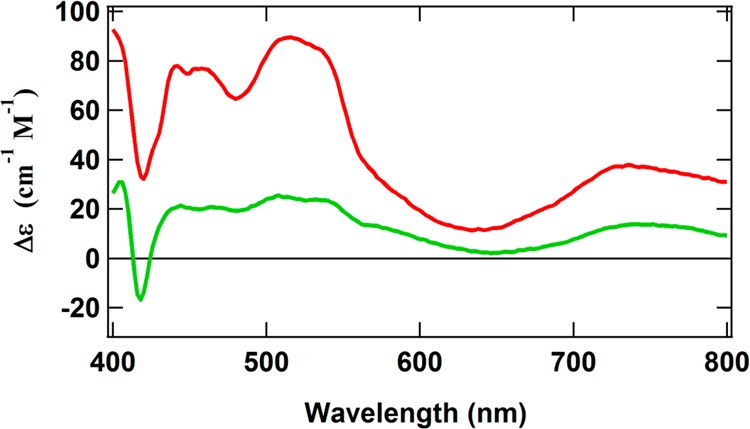
MCD spectra of Ti(III) citrate-reduced ΔnifH NifDK (red) and Ti(III) citrate-reduced NifH (green). Both spectra were recorded at 1.6 K and 6 T. The sharp inflections around 420 nm in both spectra are likely due to a minor heme impurity.
Figure 3.
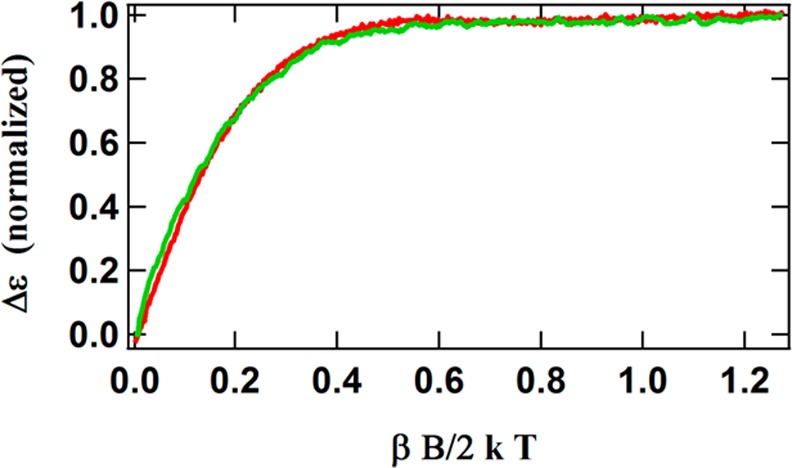
Magnetization curves of Ti(III) citrate-reduced ΔnifH NifDK (red) and NifH (green) recorded at 1.6 K and 720 nm.
A spectral property that has been associated with the all-ferrous [Fe4S4]0 cluster is its color. In the past, both synthetic and protein-bound [Fe4S4]0 clusters (including the [Fe4S4]0 cluster in NifH) have been shown to exhibit a red hue.15,22,23 This characteristic has been associated with the presence of a transition around 500–520 nm in the absorption spectrum. Contrary to this trend, the color of the Ti(III) citrate-reduced ΔnifH NifDK remains brown. However, a Gaussian fit of the MCD spectra of NifH and ΔnifH NifDK reveals the presence of nearly identical transitions in both spectra, including one at 510 nm (Figure S1A,B and Table T1 of the Supporting Information). This observation suggests that the red color associated with the all-ferrous cluster is not just due to the presence of a transition around 500–520 nm; rather, it is also due to the intensity of that transition relative to the intensities of the neighboring transitions.
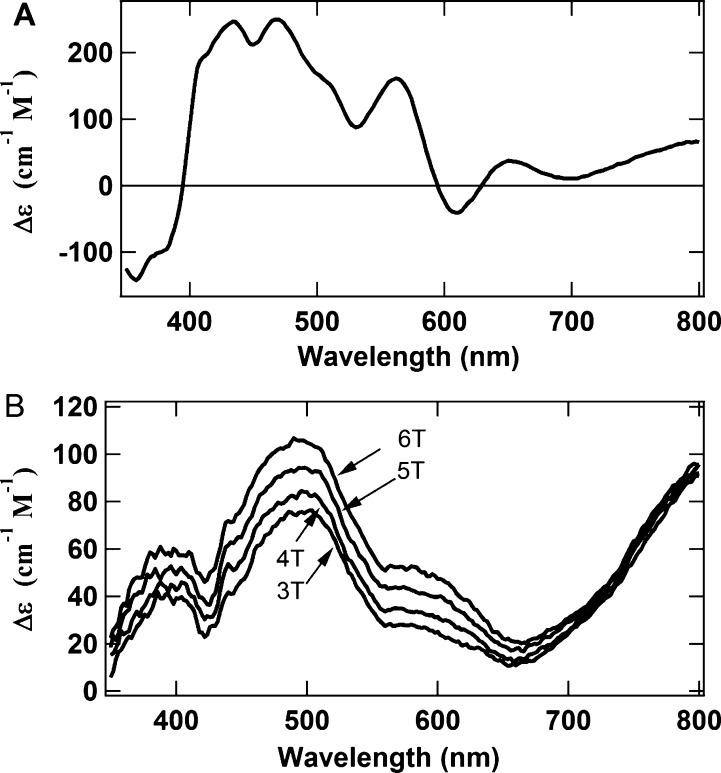
Interconversion between the [Fe4S4]+ and [Fe4S4]2+ states of as-isolated ΔnifH NifDK has been shown to be completely reversible.17 The [Fe4S4]0 state in NifH is likewise reversible with the more oxidized 1+ and 2+ states.18 To test whether the [Fe4S4]0 state in ΔnifH NifDK is similarly reversible with its oxidized states, a Ti(III) citrate-reduced sample was oxidized with IDS followed by the recording of the MCD spectrum of this sample. When compared with the spectrum of the IDS-oxidized as-isolated protein (Figure 4A), the spectrum of the IDS-oxidized protein following Ti(III) citrate reduction (Figure 4B) is obviously completely different. Therefore, increasing the redox potential of Ti(III) citrate-reduced ΔnifH NifDK converts the all-ferrous [Fe4S4]-like clusters into a new set of clusters.
Figure 4.
Comparison of the MCD spectra of (A) IDS-oxidized as-isolated ΔnifH NifDK and (B) IDS-oxidized-after-Ti(III)-citrate-reduced (OAR) ΔnifH NifDK. The spectrum in panel A was recorded at 1.6 K and 6 T, while the spectra in panel B were recorded at 1.6 K and magnetic fields of 6, 5, 4, and 3 T. Note that the intensities of the spectral features at 500 nm decrease much more rapidly with a decreasing magnetic field than the intensities of the spectral features at 800 nm.
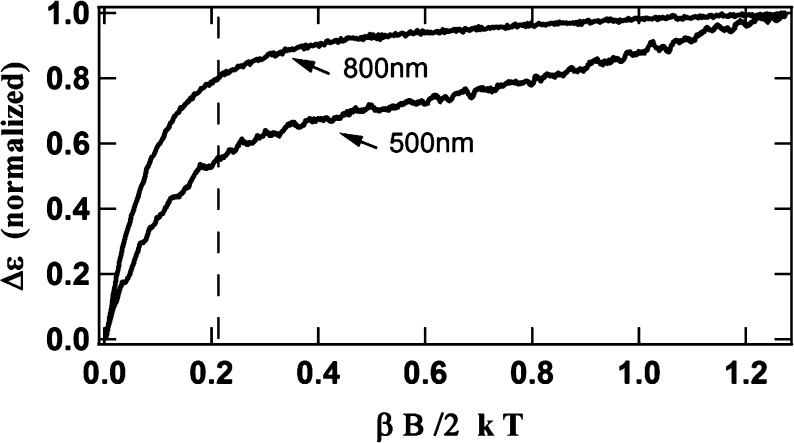
To investigate the nature of the new clusters, the MCD spectrum of the IDS-oxidized-after-Ti(III)-citrate-reduced (OAR) protein was recorded at 1.6 K and different magnetic fields. Recording the MCD spectrum of a single paramagnetic species at one temperature and various magnetic fields typically results in a series of spectra that undergo uniform decreases in intensity with a decreasing field (different directional polarizations arising from anisotropy in the ground state, however, can produce wavelength-dependent differences). That is not what is observed with the OAR protein (Figure 4B). Specifically, the spectral intensity around 500 nm decreases rapidly with a decreasing field, while the intensity around 800 nm exhibits only a slight decrease. Magnetization curves (Figure 5) recorded at 1.6 K and at 500 and 800 nm further illustrate this difference and suggest the presence of two different species with two different spin states. The steep initial slope and rapid saturation of the magnetization curve at 800 nm suggest a high-spin state, while the gradual slope and the slow approach to saturation of the curve at 500 nm imply a small spin state. These magnetization curves also illustrate that, while the spectra of both spin states contribute significantly to the overall spectrum at 6 T (βB/2kT = 1.26 at 6 T in Figure 5), the spectrum at 1 T (vertical dashed line in Figure 5) is dominated by the spectrum of the high-spin species.
Figure 5.
Magnetization curves of OAR ΔnifH NifDK in IDS, recorded at 500 and 800 nm and at 1.6 K. The dashed vertical line indicates the magnetic field of 1 T (note that on this graph a magnetic field of 6 T corresponds to βB/2kT = 1.26).
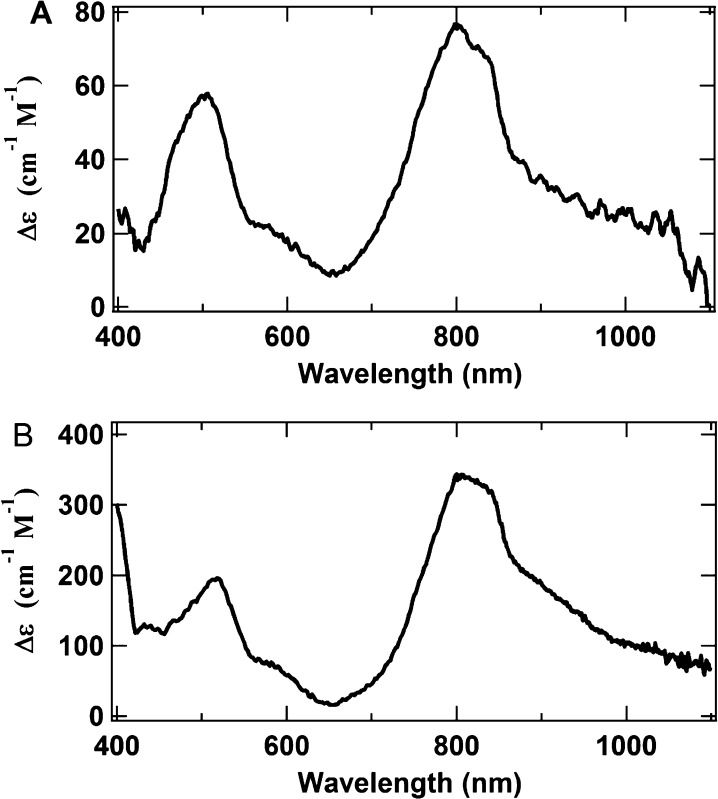
Figure 6A shows the OAR spectrum recorded at 1.6 K and 1 T, which approximates the spectrum of the high-spin species. The spectral range was extended to 1100 nm for better characterization. There are two telling features in this spectrum. First, the spectrum is very broad, lacking sharp transitions. The broadness of the spectrum suggests that it originates from a large cluster, which would have many overlapping and unresolved transitions that result in composite broad transitions. Second, the transition at around 800 nm is very intense, larger than any of the other inflections. While most FeS clusters yield MCD spectra with intensity in the 800 nm wavelength region, the majority of these spectra exhibit intensities at 800 nm that are lower than the intensity of the rest of the spectrum. Therefore, the intense transition at 800 nm is a characteristic of the unknown high-spin cluster. The spectrum in Figure 6A is very similar to the spectrum of the IDS-oxidized ΔnifB NifDK in Figure 6B.11,24,25 ΔnifB NifDK does not contain FeMoco, and therefore, the spectrum of this protein in IDS (Figure 6B) represents the sole contribution of its oxidized P-cluster species (P2+ or POX; S = 3 or 4).11,24,25 It is clear that the spectra in panels A and B of Figure 6 are nearly identical. Consistent with this identification is the strong similarity of the magnetization curves for both spectra (Figure 7), suggesting that both spectra arise from the same high-spin state. The small deviation of the OAR magnetization curve from that of oxidized ΔnifB NifDK at low fields is likely due to the presence of a small contribution from the second low-spin component [labeled X (see below)] to the overall trace of the OAR curve.
Figure 6.
MCD spectra (extended to 1100 nm for better spectral characterization) of (A) OAR ΔnifH NifDK, recorded at 1.6 K and 1 T ,and (B) IDS-oxidized ΔnifB NifDK (i.e., the P2+ spectrum), recorded at 1.6 K and 6 T.
Figure 7.
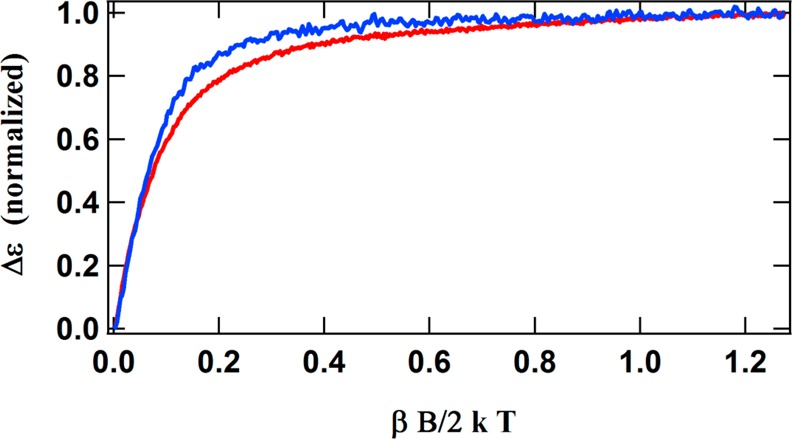
Magnetization curves of IDS OAR ΔnifH NifDK (red) and IDS-oxidized ΔnifB NifDK (blue) recorded at 800 nm and 1.6 K. The lack of complete overlap of the two curves in the region of 0.5–2.0 T is likely due to a small contribution from the low-spin component (X) in the composite spectrum of OAR ΔnifH NifDK.
The presence of P2+ can also be monitored by EPR spectroscopy. The spin state of P2+ has been predicted to be S = 3 or 4. This assignment is partially based on its EPR spectrum in the parallel mode. At low temperatures, P2+ exhibits a weak g = 11.9 signal, which is associated with an excited state.26,27 Figure 8 shows the protein concentration-normalized, parallel-mode EPR spectra of IDS-oxidized ΔnifBΔnifZ NifDK (containing one P2+) and OAR ΔnifH NifDK [predicted to contain ∼20–25% P2+ (see below)] at 10 K, both of which exhibit the characteristic g = 11.9 signal of the P2+ cluster.
Figure 8.
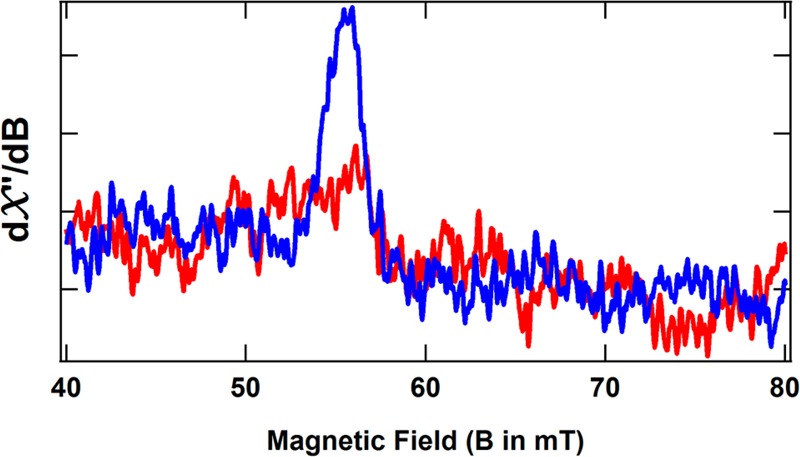
Parallel-mode EPR spectrum of IDS-oxidized ΔnifBΔnifZ NifDK containing one P2+ per protein (blue) and OAR ΔnifH NifDK predicted (from its MCD spectrum) to contain 20–25% P2+ per protein (red, or ∼45% of the blue spectrum). Both spectra were recorded at 9.384 GHz with a modulation amplitude of 1.0 G, a temperature of 10 K, and a microwave power of 50 mW and have been normalized for protein concentration.
Finally, it has been demonstrated13 that the amount of P-cluster formed during its biosynthesis can be quantified by the amount of acetylene reduction activity generated upon addition of FeMoco (along with NifH, DTN, and MgATP). Table 1 lists the activity obtained when isolated FeMoco was added to as-isolated ΔnifH NifDK, the OAR protein, and ΔnifB NifDK. The ΔnifB NifDK protein contains two P-clusters and acts as a reference, representing 100% activity regeneration. As can be seen, activity cannot be regenerated in as-isolated ΔnifH NifDK (possessing no P-clusters), while approximately 20% activity can be regenerated with the OAR protein. Therefore, consistent with the outcome of the MCD analysis (see Figures 6 and 7) and the EPR spectrum (Figure 8), these results show that reducing ΔnifH NifDK to the all-ferrous state triggers the [Fe4S4]-like clusters into an irreversible mode, which allows the subsequent formation of P-clusters upon oxidation.
Table 1. Comparison of the Activity of MoFe Proteins upon Addition of Isolated FeMoco.
| protein | C2H2 reducing activity (nmol mg–1 min–1) | percentage activitya (%) |
|---|---|---|
| ΔnifH NifDK (as isolated) | 0 | 0 |
| ΔnifH NifDK (OAR) | 213 ± 38 | 20 |
| ΔnifB NifDK | 1083 ± 138 | 100 |
Percentage activity was calculated by setting the activity of reconstituted ΔnifB NifDK to 100% and comparing the activity of reconstituted ΔnifH NifDK with that of reconstituted ΔnifB NifDK.
A comparison between the normalized intensity of the pure P2+ MCD spectrum and that of the OAR protein in IDS (Figure 6) shows that the latter protein contains only ∼20–25% of the P-cluster in the holoprotein. To help identify the remaining FeS clusters, the OAR protein was subjected to one more redox change back to the DTN state. It is well-known that, in the presence of DTN, the P-cluster exists as PN, a diamagnetic state with no significant MCD spectrum.11,28 Therefore, the DTN spectrum of the OAR protein should not have any interfering contributions from the P-cluster. Indeed, the MCD spectrum of reduced OAR ΔnifH NifDK in DTN (Figure 9, red) is clearly that of a single paramagnetic species, as its intensity decreases uniformly with temperature at a constant field (Figure S3 of the Supporting Information). The overall structure of the spectrum, namely, the broad derivative-shaped curve, is centered at ∼600 nm with a small positive inflection at 700 nm, which clearly identifies the paramagnetic species as a classic [Fe4S4]+ cluster. An essentially identical spectrum is obtained by directly increasing the redox potential of the Ti(III) citrate-reduced protein to the DTN state (Figure 9, black). A comparison of these spectra with that of the original, as-isolated ΔnifH NifDK in DTN shows that all three spectra have essentially identical inflections above 450 nm (Figure 9). The main difference among the three spectra is their intensities, where the spectrum of the as-isolated protein has a little more than 3 times the intensity of the other two spectra. In other words, ∼30–35% of the clusters exist as the [Fe4S4]-type clusters upon oxidation of the all-ferrous state of the protein. Given the proposed conversion of 20–25% of the remainder of the clusters into P-clusters (see Discussion), there is a yet-unknown FeS cluster(s) that comprises 40–50% of the total cluster population in this protein.
Figure 9.
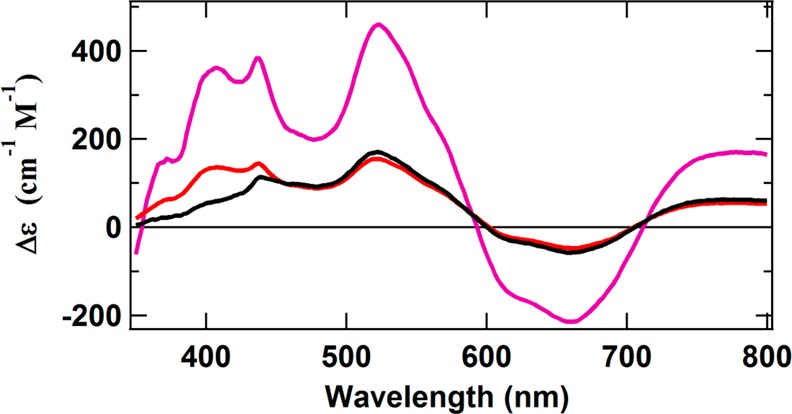
MCD spectra of as-isolated ΔnifH NifDK in DTN (magenta), Ti(III) citrate-reduced ΔnifH NifDK following equilibration with DTN (black), and OAR ΔnifH NifDK following DTN reduction (red). The difference in the <450 nm region for the black spectrum may be due to the presence of a small paramagnetic contaminant, likely a heme.
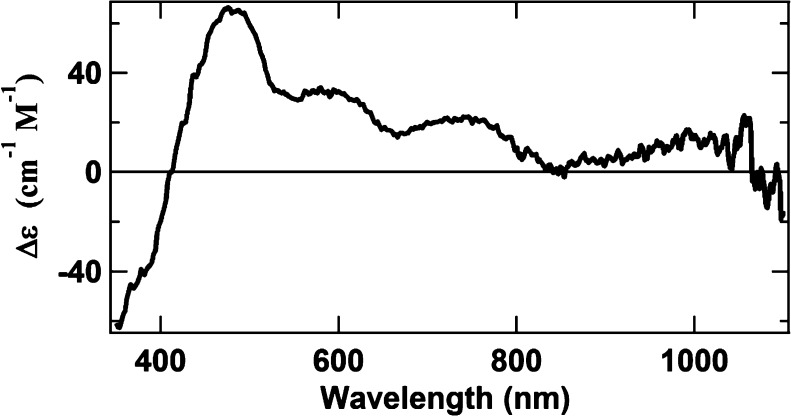
The spectrum of the OAR protein can be used to characterize one of the remaining unknown FeS clusters, labeled X. As discussed above, the OAR spectrum (Figure 4A) appears to be composed of two overlapping spectra. One spectrum in OAR has been tentatively assigned to P2+, while the other spectrum is assigned to the unknown X, a species with a low-spin state. Figure 10 shows the difference spectrum obtained by subtracting the MCD spectrum of approximately 25% pure P2+ (Figure 6B) from the spectrum of OAR ΔnifH NifDK (Figure 4B) at 1.6 K and 6 T. This difference spectrum roughly approximates the spectrum of X but does not correspond to any previously published spectrum. Because the identity of this cluster is unknown, its relative concentration cannot be estimated. Nevertheless, it is interesting to note that X has several spectral properties that are analogous to those of the P-cluster: (i) both clusters are paramagnetic with an integer spin in IDS; (ii) the spectra of both clusters in IDS are very broad, characteristic of large FeS clusters; and (iii) both clusters are diamagnetic in DTN.
Figure 10.
Approximation of the MCD spectrum of X obtained by subtracting the spectrum of IDS-oxidized ΔnifB NifDK (i.e., the P2+ spectrum, shown in Figure 6B) from the spectrum of OAR ΔnifH NifDK (i.e., the 6 T spectrum in Figure 4B). Both spectra were recorded at 1.6 K and 6 T. The intensity of the spectrum of ΔnifB NifDK used in the subtraction was reduced to 1/4 to approximate the concentration of the P2+ cluster in the composite spectrum.
Because X is EPR-silent and has a very small spin state (see below), there is also the possibility that X is diamagnetic and not paramagnetic in IDS. The major argument against this assignment is the MCD spectrum of X, which is much more intense than the spectra of typical diamagnetic species. For example, the spectrum of X is >10 times more intense than that expected from a conventional [Fe4S4]2+ cluster.29 However, the possibility of X being diamagnetic cannot be completely ruled out by our data.
Using an approach analogous to the one used above to approximate the MCD spectrum of X, the magnetization curve of X was similarly approximated. The success of this procedure is aided by the apparently large difference between the spin states of the IDS-oxidized P-cluster and X, as well as the presence of previously published magnetization curves of the oxidized P-cluster at various wavelengths. At 800 nm, the magnetization curve of IDS-oxidized P-cluster has been shown11 to rapidly reach the saturation limit, after which it only slightly increases with an increase in magnetic field strength. Therefore, above this saturation point, increases in recorded magnetization are mainly due to X. The extracted magnetization curve of X was simulated for various integer spin states, with the best-fit simulation occurring at S = 1 (Figure S3 of the Supporting Information).
Taken together, combined MCD and EPR spectroscopic studies have identified three different FeS clusters generated in the OAR protein. This identification was facilitated by the fact that both EPR and MCD spectroscopic techniques respond to paramagnetic states, with EPR spectroscopy responding best to half-integer states and MCD spectroscopy responding equally well to half-integer and integer states. While MCD spectroscopy also responds to diamagnetic states, it does so with much lower intensity than it does to paramagnetic states. Thus, the apparent lack of additional paramagnetic MCD and EPR signals of any other FeS clusters does not negate the possibility of the presence of one or more diamagnetic states being generated, but not detected, in the OAR protein.
Discussion
The results presented here are summarized in a flow diagram (Figure 11). ΔnifH NifDK is just one of two proteins shown to exhibit a paramagnetic [Fe4S4]2+ state.17 The other protein, NifEN, is also associated with nitrogen fixation and is instrumental in FeMoco biosynthesis.30,31 NifEN has a protein structure32 homologous to that of ΔnifH NifDK but contains only a single [Fe4S4]-like cluster at each α/β subunit interface instead of two found at each α/β subunit interface in ΔnifH NifDK. ΔnifH NifDK is also only the third protein shown to exhibit an all-ferrous [Fe4S4]0 state. As demonstrated above, the all-ferrous state is a necessary intermediate in the proposed nonenzymatic synthesis of the P-cluster in ΔnifH NifDK. As such, this is one of the first examples demonstrating a clear mechanistic function of an all-ferrous [Fe4S4]0 state. It is also interesting to note that, while the MCD spectra of the [Fe4S4]+- and [Fe4S4]2+-like clusters in both NifEN and ΔnifH NifDK are virtually identical,17 the clusters in NifEN cannot be reduced to the all-ferrous state. This is consistent with the suggested necessity of an all-ferrous [Fe4S4]0 intermediate state in the formation of the P-cluster, a reaction not associated with NifEN.
Figure 11.
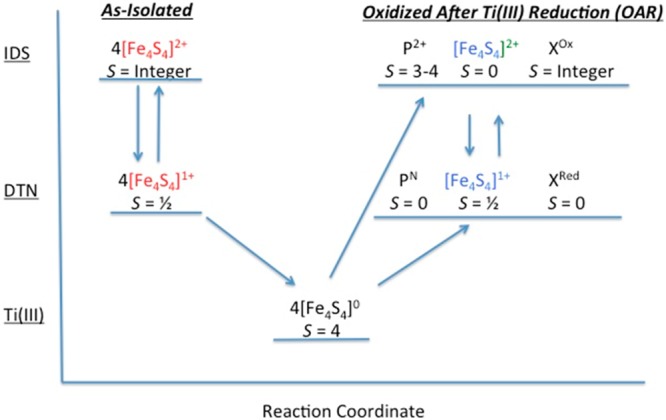
Flow diagram showing the spin states of the different FeS clusters in IDS, DTN, and Ti(III) citrate from different preparations. The different states of the clusters are placed along a reaction coordinate to show the irreversibility of the system following reduction by Ti(III) citrate to the all-ferrous state and subsequent oxidation with IDS or DTN. Note the different colors of the [Fe4S4] clusters in the as-isolated protein (red), the Ti(III) citrate-reduced protein (black), and the OAR protein (blue). These different colors are used to signify that these [Fe4S4]-like clusters differ from one another [i.e., the clusters in the as-isolated protein are paramagnetic in the 2+ state, the all-ferrous clusters in the Ti(III) citrate-reduced protein cannot be converted back to the cluster type of the as-isolated protein, and the OAR clusters are diamagnetic in the 2+ state].
The nonenzymatic synthesis of P-clusters requires a specific series of redox changes (Figure 11). The neighboring [Fe4S4]-like clusters in ΔnifH NifDK, poised in either DTN (i.e., [Fe4S4]+) or Ti(III) citrate (i.e., [Fe4S4]0), do not spontaneously form the P-cluster. Furthermore, P-clusters are not formed during the reduction of the [Fe4S4]-like clusters from the 1+ state to the 0 state. The only mechanistic change that generates P-clusters is an increase in the redox environment (to either DTN or IDS) of the [Fe4S4]0 clusters. This observation suggests that there is a redox, structural, or mechanistic change specific to that step that is necessary for P-cluster synthesis.
Two possible mechanisms can be proposed for this synthesis. One mechanism involves oxidation of the all-ferrous [Fe4S4]-like clusters, while the second mechanism involves oxidation of atoms or ligands associated with the [Fe4S4]-like clusters. To understand the first proposed mechanism, a notation will be introduced to specify the clusters in different redox and structural states. The two clusters in the two αβ subunit pairs will be labeled Cnm. In this notation, C identifies the cluster source (in the α or β subunit), m represents the charge on the cluster (2+, 1+, or 0), and n represents the structure the cluster has at a given charge (2+, 1+, or 0). Therefore, the cluster that resides in the α subunit with a charge of 2+ (i.e., [Fe4S4]2+ state) but with the structure of the cluster in the 1+ state (i.e., [Fe4S4]+ structure) would be labeled α1+. Using this terminology, the mechanism for the one-electron reduction of the cluster on the α subunit from the 1+ state to the all-ferrous 0 state would be represented as
| 1 |
This equation reflects the fact that electron transfer (the first arrow) occurs faster than structural rearrangement (the second arrow). Reduction of the β subunit-associated cluster would undergo an analogous change but not necessarily in synchrony with the reduction of the α subunit-associated cluster.
Conversely, oxidation of the α subunit-associated cluster from the all-ferrous 0 state to the 1+ state would be represented by the equation
| 2 |
As stated above, the resting state of the cluster pair poised in either DTN or Ti(III) citrate (i.e., α1+1+β1+ or α00β0, respectively) does not lead to P-cluster formation. Similarly, P-cluster formation does not occur during reduction of the 1+ state to the all-ferrous state, implying that the intermediate states α1+0 and β1+ (eq 1) are not instrumental in P-cluster formation. Therefore, the only states that appear to be involved in P-cluster formation are α01+ and β0, which are generated during oxidation (eq 2). These transient states have the charge and electronic/vibrational characteristics of a 1+ cluster but the structure of an all-ferrous 0 cluster.
Equation 2 states that during oxidation, each cluster in ΔnifH NifDK exists in one of three states (C00, C0, or C1+1+). Therefore, the pair of clusters on a given αβ subunit has 9 (3 × 3) different possible configurations during oxidation. Of the 9 configurations, 5 (α0β00, α0β01+, α0β1+1+, α1+β01+, and α0β01+) contain the required C0 state and, therefore, are most likely involved in the mechanism of P-cluster formation. However, while configuration α01+β0 might be involved in P-cluster formation, there is a very low probability of neighboring clusters simultaneously existing in the highly transient C01+ state. Therefore, the 4 remaining configurations are more likely involved in P-cluster formation.
A logical question is why these configurations promote P-cluster formation and not the analogous configurations (containing C1+0 in place of C0) that occur during reduction (eq 1). The difference may originate from the structural and energetic differences between the [Fe4S4]+ and [Fe4S4]0 clusters. The X-ray crystal structures of the clusters in ΔnifH NifDK are currently not known. However, the crystal structures of both [Fe4S4]+ and [Fe4S4]0 clusters in NifH have been determined and shown to differ.33,34 Compared to the structure of the [Fe4S4]+ cluster, the structure of the [Fe4S4]0 cluster has two large S–S distances (3.80 Å), an increased Fe1–Fe3 distance (2.79 Å), and a shorter Fe1–Fe4 distance (2.57 Å). Optimized density functional theory calculations support this structure of [Fe4S4]0 and show the presence of three equivalent Fe atoms with one distant Fe atom.35,36 A recent Fe extended X-ray absorption fine structure (EXAFS) study on NifH36 similarly shows a deformation of the [Fe4S4]0 cluster relative to the [Fe4S4]+ cluster. There are also differences in the vibrational frequencies for the various oxidation states of the [Fe4S4] cluster in NifH, as each one-equivalent reduction step decreases the different stretching frequencies by approximately 20 cm–1 on average.36
Fe EXAFS studies have been performed on the [Fe4S4]+-like clusters in ΔnifH NifDK, which reveal that the pair of neighboring [Fe4S4]-like clusters are not typical. While one of the clusters has the standard [Fe4S4] architecture, the other cluster is distorted, likely with a coordinating light atom (N or O), as well as a cysteine in place of the normal bridging sulfide.13,37 The proposed elongation of one of the Fe bonds, present in the all-ferrous structure and/or the distortion of one of the clusters, along with the increase in vibrational frequency, may facilitate fusion of the two clusters when one of the paired clusters becomes oxidized to C01+.
A second possible mechanism for P-cluster formation involves oxidation of a ligand or atom associated with the all-ferrous [Fe4S4]-like clusters of ΔnifH NifDK instead of a direct oxidation of the clusters themselves. In this case, oxidation would initiate a shift of the cluster or metal–ligand bond breakage, resulting in fusion of the two [Fe4S4]-like clusters into a P-cluster. Unlike the first proposed mechanism, in which there is an oxidation change of the Fe atoms, this mechanism involves no cluster redox change and, therefore, is more consistent with the presumed overall reaction mechanism for P-cluster formation, where all the Fe atoms remain ferrous. This reaction can be depicted as follows:
| 3 |
Because this reaction is initiated by an oxidation, the absence of oxidation in the metal cluster suggests that the oxidation occurs on a sulfide or ligand of the polypeptide.
Summary
Under the experimental conditions used in this study, at least three different FeS clusters are generated on the OAR protein. One of the clusters is proposed to be the P-cluster, which represents ∼20–25% of the total FeS cluster content. This low yield is not totally unexpected. Enzymatic synthesis initially generates only one P-cluster in ΔnifH NifDK, followed by a very slow (>1 h) generation of the second P-cluster.13 A similar partitioning of synthesis of the two P-clusters may occur in the nonenzymatic process.
A second cluster generated in the nonenzymatic reaction is labeled X. While the identity of X is unknown, it has several spectroscopic characteristics similar to those of the P-cluster. Given that both clusters are paramagnetic in IDS and diamagnetic in DTN, as well as the fact that the spectra of both clusters in IDS are broad, X may also be a large cluster with a structure similar to that of the P-cluster. It is tempting to infer from this observation that X is either a mechanistic intermediate between the [Fe4S4]-like cluster pair and the P-cluster or a faulty cluster formed by a mismatch of neighboring [Fe4S4]-type clusters. In either case, X may be an intermediate in the generation of the second, slow-forming P-cluster in the enzymatic reaction. To test this hypothesis and determine whether the all-ferrous state is an intermediate in P-cluster biosynthesis, we are currently conducting a study of the enzymatic reaction, which is analogous to the MCD study described here on the nonenzymatic reaction.
The third cluster formed in the nonenzymatic reaction is a classic [Fe4S4] cluster. The great degree of similarity between the MCD spectrum of this cluster and that of the [Fe4S4]+-type clusters in the as-isolated protein (Figure 9) illustrates a conservation of the overall electronic structure between the two clusters. Why some [Fe4S4] clusters remain after the series of redox changes is unknown, but they may represent clusters that failed to fuse to form either the P-cluster or X. However, most surprisingly, the [Fe4S4]-type clusters in the as-isolated protein (labeled in red in Figure 11) are actually slightly different from those after the redox cycle (labeled in blue in Figure 11). Specifically, the [Fe4S4]-type clusters in the as-isolated ΔnifH NifDK possess the highly unusual property of being paramagnetic in the [Fe4S4]2+ state,17 whereas the OAR [Fe4S4]-type clusters exhibit the diamagnetism characteristic of classic [Fe4S4]2+ clusters,1,2 which is illustrated by the absence of paramagnetic species other than the P-cluster from the protein (see Figures 6 and 7). Clearly, reducing the cluster to the all-ferrous state and then increasing the redox potential eliminate the unusual coupling that is associated with the paramagnetic [Fe4S4]2+ state and revert the cluster back to the conventional coupling that is associated with a traditional diamagnetic [Fe4S4]2+ cluster.
Acknowledgments
Parallel-mode, X-band EPR spectra were recorded by Brian Bennett at the National Biomedical EPR Center (supported by National Institutes of Health Grant P41 EB001980) of the Medical College of Wisconsin (Milwaukee, WI).
Glossary
Abbreviations
- MCD
magnetic circular dichroism
- NifH
Fe protein of nitrogenase
- NifDK
MoFe protein of nitrogenase
- FeMoco
FeMo cofactor at the active site on the MoFe protein of nitrogenase
- IDS
indigo disulfonate
- DTN
sodium dithionite
- nifB
gene that encodes NifB, a protein necessary in the initial synthesis of FeMoco
- OAR
oxidized-after-Ti(III)-citrate-reduced.
Supporting Information Available
Plots showing Gaussian fits of the spectra of Ti(III) citrate-reduced NifH and ΔnifH MoFe protein, a table of the areas under the major MCD absorptions for the spectra of Ti(III) citrate-reduced NifH and ΔnifH MoFe protein, and MCD spectra of the OAR ΔnifH MoFe protein in DTN and Ti(III) citrate reduced in DTN, at both 1.6 and 4.2 K. This material is available free of charge via the Internet at http://pubs.acs.org.
The authors declare no competing financial interest.
This work is supported by the Louisiana Board of Regents [EPSCoR 2013 Pfund-308 (B.J.H.)] and the National Institutes of Health (Grant R01GM67626 to M.W.R.).
Funding Statement
National Institutes of Health, United States
Supplementary Material
References
- Beinert H.; Holm R. H.; Münck E. (1997) Iron-Sulfur Clusters: Nature’s Modular, Multipurpose Structures. Science 277, 653–659. [DOI] [PubMed] [Google Scholar]
- Beinert H. (2000) Iron-Sulfur Proteins: Ancient Structures, Still Full of Surprises. JBIC, J. Biol. Inorg. Chem. 5, 2–15. [DOI] [PubMed] [Google Scholar]
- Fontecave M. (2006) Iron-Sulfur Clusters: Ever Expanding Role. Nat. Chem. Biol. 2, 171–174. [DOI] [PubMed] [Google Scholar]
- Shepard E. M.; Biyd E. S.; Broderick J. B.; Peters J. W. (2011) Biosynthesis of Complex Iron-Sulfur Enzymes. Curr. Opin. Chem. Biol. 15, 319–327. [DOI] [PubMed] [Google Scholar]
- Burgess B. K.; Lowe D. J. (1996) Mechanism of Molybdenum Nitrogenase. Chem. Rev. 96, 2983–3011. [DOI] [PubMed] [Google Scholar]
- Lancaster K. M.; Roemelt M.; Ettenhuber P.; Hu Y.; Ribbe M. W.; Neese F.; Bergmann U.; DeBeer S. (2011) X-ray Emission Spectroscopy Evidences a Central Carbon in the Nitrogenase Iron-Molybdenum Cofactor. Science 334, 974–977. [DOI] [PMC free article] [PubMed] [Google Scholar]
- Einsle O.; Tezcan F. A.; Andrade S. L. A.; Schmid B.; Yoshida M.; Howard J. B.; Rees D. C. (2002) Nitrogenase MoFe-Protein at 1.16 Å Resolution: A Central Ligand in the FeMo-Cofactor. Science 297, 1696–1700. [DOI] [PubMed] [Google Scholar]
- Peters J. W.; Stowell M. H. B.; Soltis S. M.; Finnegan M. G.; Johnson M. K.; Rees D. C. (1997) Redox-Dependent Structural Changes in the Nitrogenase P-Cluster. Biochemistry 36, 1181–1187. [DOI] [PubMed] [Google Scholar]
- Ribbe M.; Hu Y.; Guo M.; Schmid B.; Burgess B. K. (2002) The FeMoco-Deficient MoFe Protein Produced by the nifH Deletion Strain of Azotobacter vinelandii Shows Unusual P-Cluster Features. J. Biol. Chem. 277, 23469–23476. [DOI] [PubMed] [Google Scholar]
- Campbell M.; Hu Y.; Naderi F.; Ribbe M. W.; Hedman B.; Hodgson K. O. (2004) Comparison of Iron-Molybdenum Cofactor-deficient Nitrogenase MoFe Proteins by X-ray Absorption Spectroscopy: Implication for P-cluster Biosynthesis. J. Biol. Chem. 279, 28276–28282. [DOI] [PubMed] [Google Scholar]
- Broach R. B.; Rupnik K.; Hu Y.; Fay A. W.; Cotton M.; Ribbe M. W.; Hales B. J. (2006) VTVH-MCD Spectroscopic Study of the Metal Clusters in the ΔnifB and ΔnifH MoFe Proteins of Nitrogenase from Azotobacter vinelandii. Biochemistry 45, 15039–15048. [DOI] [PubMed] [Google Scholar]
- Hu Y.; Fay A. W.; Lee C. C.; Ribbe M. W. (2007) P-Cluster Maturation in Nitrogenase MoFe Protein. Proc. Natl. Acad. Sci. U.S.A. 104, 10424–10429. [DOI] [PMC free article] [PubMed] [Google Scholar]
- Lee C. C.; Blank M. A.; Fay A. W.; Yoshizawa J. M.; Hu Y.; Hodgson K. O.; Hedman B.; Ribbe M. W. (2009) Stepwiese formation of P-clusters in nitrogenase MoFe protein. Proc. Natl. Acad. Sci. U.S.A. 106, 18474–19478. [DOI] [PMC free article] [PubMed] [Google Scholar]
- Bursey E. H.; Burgess B. K. (1998) The Role of Methionine 156 in Cross-subunit Nucleotide Interactions in the Iron Protein of Nitrogenase. J. Biol. Chem. 273, 29678–29685. [DOI] [PubMed] [Google Scholar]
- Angove H. C.; Yoo S. J.; Burgess B. K.; Münck E. (1997) Mössbauer and EPR Evidence for an All-Ferrous Fe4S4 Cluster with S = 4 in the Fe Protein of Nitrogenase. J. Am. Chem. Soc. 119, 8730–8731. [Google Scholar]
- Neese F.; Solomon E. I. (1999) MCD C-Term Signs, Saturation Behavior, and Determination of Band Polarizations in Ramdomly Oriented Systems with S ≥ 1/2. Applications to S = 1/2 and S = 5/2. Inorg. Chem. 38, 1847–1865. [DOI] [PubMed] [Google Scholar]
- Rupnik K.; Lee C. C.; Hu Y.; Ribbe M. W.; Hales B. J. (2011) [4Fe4S]2+ Clusters Exhibit Ground-State Paramagnetism. J. Am. Chem. Soc. 133, 6871–6873. [DOI] [PMC free article] [PubMed] [Google Scholar]
- Watt G. D.; Reddy K. R. N. (1994) Formation of an all Ferrous Fe4S4 Cluster in the Iron Protein Component of Azotobacter vinelandii Nitrogenase. J. Inorg. Biochem. 53, 281–294. [Google Scholar]
- Angove H. C.; Yoo S. J.; Münck E.; Burgess B. K. (1998) An All-Ferrous State of the Fe Protein of Nitrogenase. J. Biol. Chem. 273, 26330–26337. [DOI] [PubMed] [Google Scholar]
- Hans M.; Buckel W.; Bill E. (2008) Spectroscopic Evidence for an All-ferrous [4Fe-4S]0 Cluster in the Superreduced Activator of 2-hydroxyglytaryl-CoA Dehydrogenase from Acidaminococcus fernentans. JBIC, J. Biol. Inorg. Chem. 13, 563–574. [DOI] [PMC free article] [PubMed] [Google Scholar]
- Yoo S. J.; Angove H. C.; Burgess B. K.; Münck E.; Peterson J. (1998) Magnetic Circular Dichroism Study of the All-Ferous [4Fe-4S] Cluster of the Fe-Protein of Azotobacter vinelandii Nitrogenase. J. Am. Chem. Soc. 120, 9704–9705. [Google Scholar]
- Scott T. A.; Berlinguette C. P.; Holm R. H.; Zhou H.-C. (2005) Initial Synthesis and Structure of an All-Ferrous Analogue of the Fully-Reduced [Fe4S4]0 Cluster of the Nitrogenase Fe Protein. Proc. Natl. Acad. Sci. U.S.A. 102, 9741–9744. [DOI] [PMC free article] [PubMed] [Google Scholar]
- Deng L.; Holm R. H. (2008) Stabilization of Fully Reduced Iron-Sulfur Clusters by Carbene Ligation: The [FenSn]0 Oxidation Levels (n = 4, 8). J. Am. Chem. Soc. 130, 9878–9886. [DOI] [PMC free article] [PubMed] [Google Scholar]
- Johnson M. K.; Thomson A. J.; Robinson A. E.; Smith B. E. (1981) Characterization of the Paramagnetic Centres of the Molybdenum-Iron Protein of Nitrogenase from Klebsiella pneumoniae Using Low-Temperature Magnetic Circular Dichroism Spectroscopy. Biochim. Biophys. Acta 671, 61–70. [Google Scholar]
- Morningstar J. E.; Johnson M. K.; Case E. E.; Hales B. J. (1987) Characterization of the Metal Clusters in the Nitrogenase Molybdenum-Iron and Vanadium-Iron Proteins of Azotobacter vinelandii Using Magnetic Circular Dichroism Spectroscopy. Biochemistry 26, 1795–1800. [DOI] [PubMed] [Google Scholar]
- Pierik A. J.; Wassink H.; Haaker H.; Hagen W. R. (1993) Redox Properties and EPR Spectroscopy of the P Clusters of Azotobacter vinelandii MoFe Protein. Eur. J. Biochem. 212, 51–61. [DOI] [PubMed] [Google Scholar]
- Surerus K. K.; Hendrich M. P.; Christie P. D.; Rottgardt D.; Orme-Johnson W. H.; Münck E. (1992) Mössbauer and Integer-Spin EPR of the Oxidized P-Clusters of Nitrogenase: Pox is a Non-Kramers System with a Nearly Degenerate Ground Doublet. J. Am. Chem. Soc. 114, 8579–8590. [Google Scholar]
- Münck E.; Rhodes H.; Orme-Johnson W. H.; Davis L. C.; Brill W. J.; Shah V. K. (1975) The MoFe Protein Component from Azotobacter vinelandii. Biochim. Biophys. Acta 400, 32–53. [DOI] [PubMed] [Google Scholar]
- Thomson A. J.; Cheesman M. R.; George S. J. (1993) Variable-Temperature Magnetic Circular Dichroism. Methods Enzymol. 246, 199–231. [DOI] [PubMed] [Google Scholar]
- Hu Y.; Fay A. W.; Ribbe M. W. (2005) Identification of a nitrogenase FeMo cofactor precursor on NifEN complex. Proc. Natl. Acad. Sci. U.S.A. 102, 3236–3241. [DOI] [PMC free article] [PubMed] [Google Scholar]
- Corbett M. C.; Hu Y.; Ribbe M. W.; Hedman B.; Hodgson K. O. (2006) Structural Insights into a Protein-Bound Iron-Molybdenum Cofactor Precursor. Proc. Natl. Acad. Sci. U.S.A. 103, 1238–1243. [DOI] [PMC free article] [PubMed] [Google Scholar]
- Kaiser J. T.; Hu Y.; Wiig J. A.; Rees D. C.; Ribbe M. W. (2011) Structure of Precursor-Bound NifEN: A Nitrogenase FeMo Cofactor Maturase/Insertase. Science 331, 91–94. [DOI] [PMC free article] [PubMed] [Google Scholar]
- Georgiadis M. M.; Komiya H.; Chakrabarti P.; Woo D.; Kornuc J. J.; Rees D. C. (1992) Crystallographic Structure of the Nitrogenase Iron Protein from Azotobacter vinelandii. Science 257, 1653–1659. [DOI] [PubMed] [Google Scholar]
- Strop P.; Takahara P. M.; Chiu H.-C.; Angove H. C.; Burgess B. K.; Rees D. C. (2001) Crystal Structure of the All-Ferrous [4Fe-4S]0 Form of the Nitrogenase Iron Protein from Azotobacter vinelandii. Biochemistry 40, 651–656. [DOI] [PubMed] [Google Scholar]
- Chakrabarti M.; Münck E.; Bominaar E. L. (2011) Density Function Theory Study of an All Ferrous 4Fe-4S Cluster. Inorg. Chem. 50, 4322–4326. [DOI] [PMC free article] [PubMed] [Google Scholar]
- Mitra D.; George S. J.; Guo Y.; Kamali S.; Keable S.; Peters J. W.; Pelmenschikov V.; Case D. A.; Cramer S. P. (2013) Characterization of [4Fe-4S] Cluster Vibrations and Structure in Nitrogenase Fe Protein at Three Oxidation Levels via Combined NRVS, EXAFS, and DFT Analyses. J. Am. Chem. Soc. 135, 2530–2543. [DOI] [PMC free article] [PubMed] [Google Scholar]
- Corbett M. C.; Hu Y.; Naderi F.; Ribbe M. W.; Hedman B.; Hodgson K. O. (2004) Comparison of iron-molybdenum cofactor deficient nitrogenase MoFe proteins by X-ray absorption spectroscopy: Implications for P-cluster biosynthesis. J. Biol. Chem. 279, 28276–28282. [DOI] [PubMed] [Google Scholar]
Associated Data
This section collects any data citations, data availability statements, or supplementary materials included in this article.


