

Abstract
Aims
The population with stable coronary artery disease (SCAD) is growing but validated models to guide their clinical management are lacking. We developed and validated prognostic models for all-cause mortality and non-fatal myocardial infarction (MI) or coronary death in SCAD.
Methods and results
Models were developed in a linked electronic health records cohort of 102 023 SCAD patients from the CALIBER programme, with mean follow-up of 4.4 (SD 2.8) years during which 20 817 deaths and 8856 coronary outcomes were observed. The Kaplan–Meier 5-year risk was 20.6% (95% CI, 20.3, 20.9) for mortality and 9.7% (95% CI, 9.4, 9.9) for non-fatal MI or coronary death. The predictors in the models were age, sex, CAD diagnosis, deprivation, smoking, hypertension, diabetes, lipids, heart failure, peripheral arterial disease, atrial fibrillation, stroke, chronic kidney disease, chronic pulmonary disease, liver disease, cancer, depression, anxiety, heart rate, creatinine, white cell count, and haemoglobin. The models had good calibration and discrimination in internal (external) validation with C-index 0.811 (0.735) for all-cause mortality and 0.778 (0.718) for non-fatal MI or coronary death. Using these models to identify patients at high risk (defined by guidelines as 3% annual mortality) and support a management decision associated with hazard ratio 0.8 could save an additional 13–16 life years or 15–18 coronary event-free years per 1000 patients screened, compared with models with just age, sex, and deprivation.
Conclusion
These validated prognostic models could be used in clinical practice to support risk stratification as recommended in clinical guidelines.
Keywords: Stable coronary artery disease, Stable angina, Prognosis, Myocardial infarction, Electronic health records, CALIBER
Introduction
Population ageing and improvements in survival after acute coronary syndromes (ACS) have contributed to worldwide increases in the number of patients with stable coronary artery disease (SCAD). Stable coronary artery disease encompasses a heterogeneous spectrum of syndromes including patients with stable angina and those who have become stable after ACS.1,2 In the USA alone, over 16 million people (7% of the US population) suffer from coronary disease with 500 000 new stable angina cases being reported each year.3 The 2012 ACCF/AHA guidelines for prognostication in SCAD recommend that patients are stratified into high (>3%), intermediate (1–3%), and low (<1%) annual mortality risk groups, which then define different investigation and treatment pathways.4
So far, prognostic models proposed for SCAD (compared in Supplementary material online, Table S1) have been based on data collected for research purposes rather than the information that clinicians record in real-world practice, and none has been recommended for clinical use.4–6 Among their limitations is the failure to incorporate the ‘broad range of relevant data’ identified as important in the guidelines, such as sociodemographic characteristics, cardiovascular (CVD) and non-CVD comorbidities, mental health, symptom severity, and clinically available biomarkers.4 These data are routinely recorded for most patients before more costly information becomes available from further, often invasive, investigations. Other limitations of previous models include the use of selected samples from trials7,8 or voluntary registries,9 and covering a narrow range of SCAD such as excluding9 or being confined to post-ACS patients.7 Furthermore, the ACCF/AHA guidelines emphasize the importance of both all-cause mortality and coronary events as outcomes, but no previous studies have assessed both. Importantly, none of the previous models has been validated in an external data set.
We sought to address these limitations by analysing large-scale, population-based, linked electronic health records data. Our objective was to develop and validate the performance of prognostic models that incorporate clinical measures recommended in guidelines and are commonly available in patients with SCAD.10 Following recent methodological guidance,11,12 we assessed the accuracy of the predictions from the prognostic models based on their calibration, discrimination (C-index), and reclassification improvement.13 To further evaluate potential clinical benefits, we estimated life years saved when the models are used to guide management decisions.14 Based on these analyses, we developed prognostic models to predict all-cause mortality and non-fatal myocardial infarction (MI) or coronary death in SCAD and evaluated their performance in an independent data set.
Methods
Patient population
We report findings from the CALIBER (CArdiovascular disease research using Linked BEspoke studies and Electronic Health Records) collaboration where we linked population-based primary care data from the Clinical Practice Research Datalink (CPRD) to three further sources of electronic health records: the Myocardial Ischaemia National Audit Project registry (MINAP), discharge records from Hospital Episodes Statistics (HES), and cause-specific mortality from the Office for National Statistics (ONS), as previously described.15 Eligible patients were those with a diagnosis of stable angina, patients with history of MI, coronary artery bypass graft (CABG), or percutaneous coronary intervention (PCI) prior to the start of the study period (other CHD) and patients with a diagnosis of ACS within the study period (unstable angina or acute MI). Myocardial infarction was classified into ST-elevation MI (STEMI) and non-ST-elevation MI (NSTEMI) where MI type was recorded (Figure 1). Diagnoses were identified in CPRD, HES, or MINAP records according to definitions in the CALIBER data manual.15 Stable angina was defined by Read codes in CPRD for angina diagnosis, positive ischaemia tests, coronary angiogram results recorded or repeat prescriptions for nitrates, or hospitalizations with a primary spell diagnosis ICD10 code I20.1, I20.8, or I20.9. Unstable angina was defined by Read codes in CPRD or hospital admission with ICD10 code I20.0. ST-elevation MI and NSTEMI were defined according to the discharge diagnosis as recorded in MINAP. Acute MI not otherwise specified was defined by Read codes in CPRD or ICD10 I21–I22 as the primary diagnosis in HES. Further details on the diagnostic codes and definitions used are available at http://www.caliberresearch.org/portal/.
Figure 1.

Study flow diagram.
Patients with prior ACS were defined as stable if they had survived more than 6 months following the acute event, entering the cohort at this point. We chose 6 months (i) to differentiate long-term prognosis from the high-risk period that typically follows ACS or revascularization16 and (ii) because models validated for clinical use following ACS cover the first 6 months post-ACS (e.g. GRACE17).
Prognostic factors
Candidate predictors were drawn based on recommendations in recent guidelines for the management of SCAD.4,5 We included demographic measures (age, sex, ethnicity, social deprivation), SCAD subtype (stable angina, other CHD, unstable angina, MI, STEMI, NSTEMI), use of short- and long-acting nitrates, whether CABG or PCI was performed in the 6 months following CAD diagnosis, previous MI, smoking, body mass index (BMI), blood pressure, diagnosis of hypertension, diabetes, lipids, family history of coronary heart disease, CVD comorbidities [heart failure, peripheral arterial disease (PAD), atrial fibrillation, stroke], non-CVD comorbidities (chronic renal disease, chronic obstructive pulmonary disease, thyroid disorders, peptic ulcer, rheumatoid arthritis, cancer, chronic liver disease), psychosocial characteristics (depression, anxiety), and clinically assessed biomarkers (heart rate, white cell count, haemoglobin, creatinine, liver enzymes, HbA1c). We defined as baseline the most recent measurements encompassing those made up to 6 months prior to cohort entry.
Endpoints
The endpoints were all-cause mortality and a composite of non-fatal MI or coronary death. Patients were censored at the earliest date among date of endpoint of interest, relocation to a new primary care practice, or study end date (25 March 2010).
Model development
Prognostic models were developed and evaluated following the checklist outlined in the Transparent Reporting of a model for Individual Prognosis Or Diagnosis (TRIPOD) guidelines.18 The baseline hazard for both outcomes followed an exponential distribution; hence, we developed exponential proportional hazards models. These are similar to the Cox model in that they assume proportional hazards but the baseline hazard is parametrically estimated based on the exponential model. Log of hazard vs. log of time plots showed no significant violations of the proportional hazards assumption. Nonlinear associations were modelled using splines. Multiple imputation was used to replace missing values in prognostic factors that appeared to have a missing-at-random pattern (details in Supplementary material online). All candidate models a priori included age, sex, SCAD subtype, use of long-acting nitrates, CABG/PCI in the last 6 months, previous/recurrent MI, and CVD risk factors (smoking, hypertension, diabetes, total, and HDL cholesterol). Additional predictors were selected based on their recording coverage and multivariate effect size. Because our data set is large, to decide which variables to include in the models we defined as ‘moderately significant’ those with P-values <0.001, and ‘highly significant’ those with P-values <10−5. Thus, we examined the multiply imputed multivariate associations of candidate predictors, adjusted for all other candidate variables (see Supplementary material online, Tables S4 and S5). Predictors with nonlinear associations (e.g. BMI) were modelled using restricted cubic splines (three knot points were sufficient). Predictors with moderate significance after imputation in the multivariate context were retained in the models if the missing data did not exceed 50%. Predictors with high significance after imputation were included if their coverage was at least 20%. Subsequently, we examined interactions between age and sex with each of the modelled predictors. For simplicity, only the age–sex interaction which was highly significant was included in the final models.
Evaluation of prediction performance
Discrimination was assessed based on Harrell's C-index.19 The contribution of individual prognostic factors to the C-index of the full model was assessed by backward elimination of a different variable at each iteration. The ACCF/AHA guidelines classify low- and high-risk patients as those with <1 and >3% annual mortality, respectively.4 We extended these cut-offs to a 5-year time horizon (low <5%, intermediate 5–14%, high >15%) to assess the net reclassification improvement (NRI)13 upon addition of different prognostic factors to the models. Calibration of 5-year risk predictions was visually assessed by comparing predicted vs. observed (Kaplan–Meier) risk by splitting the data into 10 subgroups with equal numbers of patients.
Estimation of life years saved
We compared the likely clinical impact of using our prognostic models to guide medical decisions by estimating the incremental number of life years saved by using these models over alternative models, as previously described.14 Briefly, suppose that among a cohort of size N a prognostic model identified n patients as high risk. Suppose that upon follow-up the observed survival in these patients was S(t). If a risk management decision associated with benefit (hazard ratio) θ was applied to high-risk patients, the anticipated risk reduction over time t would be S(t)θ–S(t). Estimation of the number of life years saved by using the prognostic model takes into account the number of patients identified as high risk by the model and the expected benefit and cost (medical or other) incurred over time t if specific management decisions were applied to high-risk patients. For the current analysis, we defined as high-risk patients those with ≥15% 5-year risk (20% in sensitivity analysis). We assumed that the management decision (e.g. further testing or treatments) is associated with a hazard ratio of 0.8 (∼20% risk reduction) [for context, antiplatelet therapy has been shown to reduce risk of fatal/non-fatal CVD by ∼20% in patients with prior MI or confirmed CAD20]. Further, we assumed that the cost associated with implementing the decision balances the benefit obtained in patients with 15% 5-year risk (i.e. treating people with higher or lower observed risk results in positive or negative net benefit, respectively).
Validation
We validated models internally (in CALIBER) and externally (different study and clinical setting).21 Within CALIBER, we estimated bootstrap standard errors (200 samples) to obtain optimism-corrected confidence intervals.22 For external validation, the models developed in CALIBER were applied to 4020 patients in the ‘Appropriateness of Coronary Revascularisation’ (ACRE) study, a prospective cohort of patients, with similar case-mix to patients in our data, who underwent coronary angiography at the London Chest Hospital during 1996/1997 and followed up until 2004. Details of this study have been previously described.23 Covariates in ACRE that were incompletely recorded (smoking, TCHOL, HDL, heart rate, blood pressure, creatinine, haemoglobin, white cell count) were multiply imputed as described for the development data set, but independently of the CALIBER data. The following candidate predictors considered in our model development had not been collected by the ACRE investigators: history of anxiety, depression, cancer, liver disease, and atrial fibrillation (all binary). To allow models containing these variables to be evaluated in ACRE, we set these to 0. Discrimination and calibration statistics for 5-year risks predictions in the external data set were assessed as in the main analysis.
All analyses were performed in the R statistical package, version 2.15.2 for Unix.
Results
Baseline patient characteristics in different forms of stable coronary artery disease
We included 102 023 patients, of whom 44.7% had stable angina, 21.5% other CHD, 13.0% unstable angina, 4.7% STEMI, 6.7% NSTEMI, and 9.4% had unclassified MI as their qualifying diagnosis. Compared with other patients with SCAD, STEMI patients were younger, more likely to be male and smokers, more likely to receive PCI, had fewer comorbidities and lower SBP and heart rate (Supplementary material online, Table S2).
Five-year risks of all-cause mortality and non-fatal MI or coronary death
The Kaplan–Meier 5-year mortality risk was 20.6% (95% CI, 20.3, 20.9%) but differed markedly among different SCAD subtypes (Figure 2). The lowest 5-year mortality was observed in stable angina patients and those stable after STEMI and the highest in stable patients after NSTEMI. The observed 5-year risk of non-fatal MI or coronary death was approximately half that of all-cause mortality [9.7% (95% CI, 9.4, 9.9%)], but more heterogeneous among SCAD subtypes, with the lowest seen in patients with stable angina and the highest in stable patients after NSTEMI.
Figure 2.
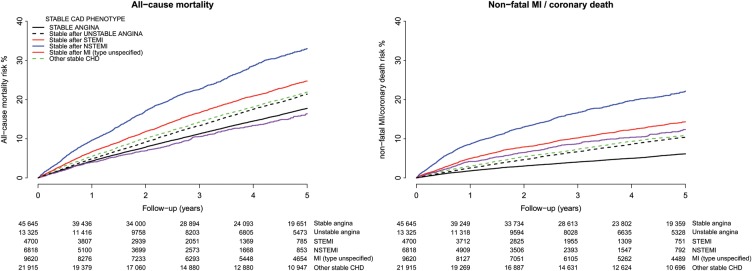
Observed (Kaplan–Meier) risk of all cause-mortality and non-fatal MI or coronary death for stable angina patients and stable patients 6 months after ACS. The numbers of patients at risk per unit time are shown below each plot.
Prognostic factors
The age- and sex-adjusted associations of candidate prognostic factors with either of the two endpoints were comparable among the different SCAD subtypes (Supplementary material online, Tables S3 and S4). Male sex was associated with higher risks in all forms of SCAD except after MI, whereas age was a stronger risk factor in women. Body mass index had a U shape association with all-cause mortality and a positive linear association with coronary outcomes, in both cases changing to L shape after multiple adjustments (Supplementary material online, Table S5). Because of the potential for over-adjustment when diabetes, hypertension, and other factors strongly associated with obesity were included,24 BMI was not included in the final models. Hyperthyroidism and high HbA1c had significant univariate but weak multivariate associations. All continuous predictors appearing in the final models were approximately linearly associated with the corresponding outcomes.
The CALIBER models
We developed models for all-cause mortality and non-fatal MI or coronary death that include the following prognostic factors (different coefficients for each endpoint);age, sex, deprivation, SCAD subtype, recent revascularizations, previous MI, use of long-acting nitrates, diabetes, hypertension, smoking, lipids, heart failure, PAD, atrial fibrillation, stroke, chronic renal disease, chronic obstructive pulmonary disease, cancer, chronic liver disease, depression, anxiety, heart rate, creatinine, white cell count, and haemoglobin (Table 1).
Table 1.
The CALIBER models for prognosis of all-cause mortality and non-fatal myocardial infarction or coronary death in stable coronary artery disease
| Prognostic factors | All-cause mortality, HRa (95% CI) | Non-fatal MI or coronary death, HRb (95% CI) |
|---|---|---|
| Sociodemographic characteristics | ||
| Age in men, per year | 1.065 (1.063–1.067) | 1.046 (1.043–1.048) |
| Age in women, per year | 1.081 (1.078–1.083) | 1.065 (1.061–1.069) |
| Women vs. men | 0.204 (0.162–0.257) | 0.158 (0.112–0.221) |
| Most deprived quintile, yes vs. no | 1.151 (1.111–1.192) | 1.117 (1.060–1.178) |
| SCAD diagnosis and severity | ||
| Other CHD vs. stable angina | 1.024 (0.982–1.067) | 1.180 (1.107–1.257) |
| Unstable angina vs. stable angina | 1.021 (0.970–1.075) | 1.323 (1.232–1.421) |
| NSTEMI vs. stable angina | 1.298 (1.238–1.360) | 2.373 (2.217–2.539) |
| STEMI vs. stable angina | 1.083 (1.006–1.166) | 1.940 (1.750–2.149) |
| PCI in last 6 months, yes vs. no | 0.651 (0.605–0.699) | 0.702 (0.642–0.768) |
| CABG in last 6 months, yes vs. no | 0.516 (0.469–0.566) | 0.424 (0.370–0.486) |
| Previous/recurrent MI, yes vs. no | 1.136 (1.095–1.179) | 1.399 (1.330–1.472) |
| Use of nitrates, yes vs. no | 1.152 (1.118–1.188) | 1.405 (1.342–1.470) |
| CVD risk factors | ||
| Ex-smoker vs. never | 1.110 (1.065–1.157) | 1.094 (1.008–1.188) |
| Current smoker vs. never | 1.315 (1.245–1.389) | 1.215 (1.126–1.311) |
| Hypertension, present vs. absent | 0.965 (0.929–1.001) | 1.064 (1.000–1.131) |
| Diabetes mellitus, present vs. absent | 1.203 (1.160–1.248) | 1.387 (1.315–1.463) |
| Total cholesterol, per 1 mmol/L increase | 1.012 (0.983–1.042) | 1.061 (1.029–1.094) |
| HDL, per 0.5 mmol/L increase | 1.006 (0.987–1.025) | 0.910 (0.879–0.942) |
| CVD co-morbidities | ||
| Heart failure, present vs. absent | 1.543 (1.495–1.593) | 1.181 (1.089–1.281) |
| Peripheral arterial disease, present vs. absent | 1.286 (1.234–1.340) | 1.085 (1.031–1.142) |
| Atrial fibrillation, present vs. absent | 1.280 (1.236–1.326) | 0.952 (0.887–1.021) |
| Stroke, present vs. absent | 1.329 (1.277–1.382) | 1.138 (0.925–1.401) |
| Non-CVD comorbidities | ||
| Chronic kidney disease, present vs. absent | 1.116 (1.058–1.178) | 1.085 (1.031–1.142) |
| Chronic obstructive pulmonary disease, present vs. absent | 1.150 (1.114–1.187) | 1.181 (1.089–1.281) |
| Cancer, present vs. absent | 1.377 (1.324–1.432) | 0.952 (0.887–1.021) |
| Chronic liver disease, present vs. absent | 1.631 (1.443–1.842) | 1.138 (0.925–1.401) |
| Psychosocial characteristics | ||
| Depression at diagnosis, present vs. absent | 1.179 (1.135–1.225) | 1.059 (0.998–1.124) |
| Anxiety at diagnosis, present vs. absent | 1.172 (1.116–1.231) | 1.015 (0.937–1.100) |
| Biomarkers | ||
| Heart rate, per 10 b.p.m increase | 1.098 (1.084–1.112) | 1.069 (1.030–1.110) |
| Creatinine, per 30 μmol/L increase | 1.065 (1.051–1.080) | 1.087 (1.064–1.110) |
| White cell count, per 1.5 109/L increase | 1.120 (1.106–1.135) | 1.111 (1.088–1.135) |
| Haemoglobin, per 1.5 g/dL increase | 0.758 (0.724–0.794) | 0.822 (0.800–0.845) |
| C-index | ||
| Internal cross-validation | 0.811 (0.806–0.816) | 0.778 (0.770–0.785) |
| External validation (ACRE) | 0.735 (0.715–0.755) | 0.718 (0.700–0.736) |
CABG, coronary artery bypass graft; SCAD, stable coronary artery disease; HDL, high-density lipoprotein cholesterol; MI, myocardial infarction; NSTEMI, non-ST-segment elevation MI; PAD peripheral arterial disease; PCI, percutaneous coronary intervention; STEMI, ST-segment elevation MI.
aExponential proportional hazards regression with scale 92 (95% CI, 89, 94).
bExponential proportional hazards regression with scale 88 (95% CI, 84, 92).
Discrimination and calibration
In internal validation, the C-index was 0.811 (95% CI, 0.806, 0.816) for all-cause mortality and 0.778 (95% CI, 0.770, 0.785) for non-fatal MI or coronary death. For interpretation, a model with C-index 0.811 correctly predicts who will have an event earlier between two patients 81.1% of the times, a significant improvement over a random 50% guess. The models were well calibrated throughout the risk range (Supplementary material online, Figure S1).
Contribution of prognostic factors to model performance
Predictors based on initial CAD diagnosis, CVD co-morbidities, and biomarkers contributed the largest increments in the C-index (Figure 3). For prediction of all-cause mortality, the predictors with the largest influence on the discrimination of the model were (in order of decreasing contribution to the C-index): creatinine, total and HDL cholesterol, SCAD subtype with revascularization status, depression, heart rate, and chronic obstructive pulmonary disease. Equivalently for prediction of MI and coronary death, the most influential predictors were SCAD subtype, haemoglobin, heart failure, use of nitrates, diabetes, PAD, white cell count, and previous MI. Other non-CVD comorbidities contributed to the prediction of all-cause mortality only, whereas diagnosis of hypertension did not lead to gain in discrimination performance for either endpoint.
Figure 3.

The contribution of each variable included in the CALIBER model for predicting all-cause mortality in SCAD, assessed by the decrease in the C-index upon its removal from the complete model.
Evaluation of potential clinical impact
To evaluate the potential clinical impact of using these models for clinical evaluation of patients with SCAD, the full models were compared with one with just demographic characteristics (Figure 4 and Supplementary material online, Figure S1). Based on 5-year risk predictions, the NRI was 0.35 (95% CI, 0.34, 0.36) for all-cause mortality and 0.24 (95% CI, 0.23, 0.26) for non-fatal MI or coronary death. For interpretation, an NRI of 0.35 in the current context means that in a population of patients classified into three categories according to their 5-year risk predictions (<5, 5–14, and >15%) based on an existing model, updating the model by including further risk factors correctly reclassifies 35% of the patients into risk groups that are more concordant with their observed event rates, i.e. patients are moved to the lower risk category if their observed event rate was low and vice versa. If specific management strategies were recommended for high-risk patients (>15% 5-year risk), and implementation of these management strategies was associated with hazard ratio 0.8, using the CALIBER models to estimate 5-year risk would save an additional 14.5 (95% CI, 13.0, 16.0) life years or 16.1 (95% CI, 14.6, 17.6) non-fatal MI or coronary death-free years for every 1000 patients screened. Using a 20% threshold to define high-risk patients led to similar conclusions.
Figure 4.

Evaluation of prediction performance upon incremental addition of different sets of predictors, using sociodemographics as the reference model. *Based on guideline definition of low (<1%), intermediate (1–3%), and high (>3%) annual risk. **Assuming that management is associated with hazard ratio 0.8 and is cost-effective at high risk.
External validation
For external validation, we applied the CALIBER models to patients in the ACRE study, summarized in Supplementary material online, Table S6. During a median follow-up of 7.5 years, 872 deaths and 1238 non-fatal MI or coronary deaths were observed among 4020 patients. The C-index was 0.735 (95% CI, 0.715, 0.755) for all-cause mortality and 0.718 (95% CI, 0.700, 0.736) for non-fatal MI or coronary death. Five-year risks were well calibrated (Supplementary material online, Figure S1). In sensitivity analysis, we built and evaluated models in CALIBER that omitted the predictors missing in ACRE (history of depression, anxiety, caner, liver disease, and atrial fibrillation); the corresponding performance was very similar to that observed for the full models (where missing predictors were set to 0).
Risk calculation example
The models proposed are available online at www.caliberresearch.org/model. Scoring tables25 to simplify the estimation of the risk scores offline are provided in Supplementary material online. Suppose we wish to assess the prognosis of a 65-year old man, who recently survived a STEMI and has remained stable for the last 6 months. He is a current smoker, suffers from diabetes, and has frequent bouts of angina, which he controls using nitrates. He has no other history of CVD but suffers with depression and chronic obstructive pulmonary disease. His pulse rate is 80 b.p.m. and his current blood measurements are: total cholesterol 7 mmol/L, HDL cholesterol 2 mmol/L, creatinine 100 mmol/L, white blood count 10 × 109/L, and haemoglobin 14 g/L. No revascularization procedure was performed following his heart attack. From the scoring tables provided, we have total score for death model = 146 , corresponding to ∼12.5% 5-year risk of death; total score for MI/fatal CHD model = 202, corresponding to ∼6% 5-year risk of MI/coronary death. According to the guidelines, patients with annual risk of death or MI >3% (>15% risk over 5 years) are candidates for revascularization. This patient's mortality risk is near this threshold, so he should be assessed further (e.g. ECG, angiography) to confirm his suitability for revascularization.
Discussion
In a population-based study of >100 000 stable patients with a range of previous CAD phenotypes, we found that prognostic models combining a wide range of clinical data commonly available prior to the decision for further investigation can identify patients at high risk of long-term mortality and coronary events. We demonstrate how real-world clinical data (as distinct from research data7,8) contribute important prognostic information in unselected patients. Unlike previous reports of prognostic models,1,7–9 we focus on potential clinical usefulness and demonstrate how each predictor usefully improves predictions beyond more simple models. Importantly, we confirm that the models have good calibration and discrimination when applied to an external study. These validated prognostic models could be used clinically to support risk assessment according to clinical variables, which is ‘essential for determining optimal treatment strategies’.4
Current practice guidelines informed several aspects of this analysis.4,5 Because risks in SCAD are heterogeneous and many patients have low risk, the 2012 ACCF/AHA4 and 2006 ESC5 guidelines propose a stepwise risk assessment to inform management decisions. The assessment should start with evaluating all patients based on simple clinical parameters, followed by advanced investigations (imaging and stress testing) in selected patients, followed by angiography conditional on results from earlier steps. The CALIBER prognostic models incorporate the broad range of clinical characteristics highlighted by these guidelines for the initial evaluation step, many of which (deprivation, atrial fibrillation, cancer, liver disease, depression, anxiety, and haemoglobin) have not previously been incorporated in prognostic models for SCAD. Importantly, to make the evaluation of the models relevant to the guidelines, we used the ACCF/AHA definition of low, intermediate, and high risk to estimate the NRI and life years gained from applying these models. Hence, our evaluation outcomes are clinically relevant.
We present both all-cause mortality and non-fatal MI or coronary death as outcomes because these risks differ and the best course of action in terms of risk management and priorities requires evaluation of both mortality and coronary morbidity. Some prognostic factors included in the CALIBER models were much more useful for predicting all-cause mortality than coronary risks and vice versa. Hence, although smoking, diabetes, CVD comorbidities, and biomarkers were good predictors of either outcome, non-CVD comorbidities, depression, and anxiety were mainly useful for predicting non-coronary death. Importantly, the contribution of hypertension to model discrimination was marginal and confined to coronary events. Since blood pressure lowering trials among people with SCAD26 demonstrate a reduction in both coronary and total mortality rates, the prognostic effect of hypertension may be obscured by treatment.
Widely reported measures of model performance, such as the C-index and the NRI, do not provide clinicians with readily interpretable evidence for making effective, and cost-effective decisions about which patients should be further investigated.27 Following recommendations,10 we therefore sought to estimate the potential impact on patient outcomes of using the CALIBER prognostic models for clinical decision making. Using these models to identify patients at high risk (defined by guidelines as 3% annual mortality) and offer a management strategy with a hazard ratio 0.8 (equivalent to ∼20% absolute risk reduction) would save an additional 13–16 life years or 15–18 coronary-event-free life years over a 5-year time horizon compared with a model including just age, sex, and social deprivation. Hence, since the models are based on clinically available data (i.e. there is no cost increment of collecting new data), our analysis demonstrates that screening with the models is likely to be cost-effective. However, economic evaluation would be needed to establish their appropriateness in practice.
Stringent external validation is essential to ensure that a prognostic model would be applicable to the rest of the population than the patients in our cohort.21 However, a model can achieve impressive performance (as high as in the development data) if applied to an external data set that originates from a similar source of data (e.g. validation of QRISK28 in data from a similar GP database system29). To make our external validation rigorous, we therefore used a data set with major differences from the development data set; the data were collected differently (manually abstracted from case records), the patients were at higher risk (received angiography due to chest pain), and the study period was about a decade earlier with markedly different background use of risk lowering medication. Hence, it was reassuring that the models performed well in this external setting. However, as with any prognostic model, there is an ongoing need for further validation in external data sets and recalibration for different populations and time periods.
We propose that the CALIBER prognostic models are implemented in electronic health records in clinical practice. This should be done alongside evaluation of the impact on decisions and, ultimately, patient outcomes. The models may also be used to support adherence to existing therapies, guide frequency of follow-up, plan trials of new therapies, and serve as a reference on which to evaluate the extent to which novel biomarkers might usefully further stratify risk assessment.
Limitations
A limitation in our study is that the electronic health record does not capture all the information available to clinicians prior to imaging. Thus, while clinicians assess symptom severity, this is not recorded in standard fashion. However, we found that a proxy for symptom severity, the use of long-acting nitrates, or repeat prescription for short nitrates did add prognostic value. Although we had information from the resting ECG on heart rate and the presence of atrial fibrillation, resting ST segment, T wave, or other changes were seldom coded. A further limitation was that for external evaluation, we ignored (assumed absent) comorbidities not collected in the external data set. However, the missing predictors had low impact on the performance of the models in the development data; thus, we do not expect this to have affected the evaluation. Further, in order to represent all relevant clinical parameters that are commonly considered in clinical assessment, the models included a large number of variables. However, these variables are routinely recorded in electronic health records, so their collection is not associated with extra costs. Also, the large size of the data set used to develop the models reduces the likelihood of overfitting. Finally, only multiplicative models were considered; models fitted in the additive scale are a plausible alternative that was not explored.
Conclusions
In summary, we present validated prognostic models for estimating risk of all-cause mortality and coronary outcomes based on clinical parameters that are commonly available in all people with stable coronary disease. These models can be implemented alongside further medical investigations to support medical decision making. However, as with any new prognostic model, further independent evaluation is required in different settings including different electronic health record systems, health care organizations, and geographic locations to guide use in clinical practice. A risk calculator is available online (www.caliberresearch.org/model).
Ethics and registration
We registered the research protocol at clinical trials.gov (NCT01609465) and received approval from the Independent Scientific Advisory Committee (10_160) and the MINAP Academic Group (11-CBR-3).
Supplementary material
Supplementary material is available at European Heart Journal online.
Funding
This work was supported by the National Institute for Health Research (RP-PG-0407-10314), the Wellcome Trust (WT 086091/Z/08/Z), and the Medical Research Council Prognosis Research Strategy Partnership (G0902393/99558) [to H.H., A.T., P.P., A.D.H.], and by awards to establish the Farr Institute of Health Informatics Research at UCLPartners, from the Medical Research Council, Arthritis Research UK, British Heart Foundation, Cancer Research UK, Chief Scientist Office, Economic and Social Research Council, Engineering and Physical Sciences Research Council, National Institute for Health Research, National Institute for Social Care and Health Research, and Wellcome Trust (A.T., S.D., A.D.H., L.S., H.H., grant MR/K006584/1). L.S. is supported by a Wellcome Trust Senior Research Fellowship in Clinical Science. A.T. acknowledges support of Barts and the London Cardiovascular Biomedical Research Unit, funded by the National Institute for Health Research. A.S. is supported by a Wellcome Trust Clinical Research Training Fellowship (0938/30/Z/10/Z). J.G. was funded by an NIHR Doctoral Fellowship (DRF-2009-02-50). Funding to pay the Open Access publication charges for this article was provided by Wellcome Trust and the Medical Research Council.
Conflict of interest: none declared.
Supplementary Material
References
- 1.Bhatt DL, Eagle KA, Ohman EM, Hirsch AT, Goto S, Mahoney EM, Wilson PW, Alberts MJ, D'Agostino R, Liau CS, Mas JL, Rother J, Smith SC, Jr, Salette G, Contant CF, Massaro JM, Steg PG. Comparative determinants of 4-year cardiovascular event rates in stable outpatients at risk of or with atherothrombosis. JAMA. 2010;304:1350–1357. doi: 10.1001/jama.2010.1322. doi:10.1001/jama.2010.1322. [DOI] [PubMed] [Google Scholar]
- 2.Hemingway H, McCallum A, Shipley M, Manderbacka K, Martikainen P, Keskimaki I. Incidence and prognostic implications of stable angina pectoris among women and men. JAMA. 2006;295:1404–1411. doi: 10.1001/jama.295.12.1404. doi:10.1001/jama.295.12.1404. [DOI] [PubMed] [Google Scholar]
- 3.Roger VL, Go AS, Lloyd-Jones DM, Benjamin EJ, Berry JD, Borden WB, Bravata DM, Dai S, Ford ES, Fox CS, Fullerton HJ, Gillespie C, Hailpern SM, Heit JA, Howard VJ, Kissela BM, Kittner SJ, Lackland DT, Lichtman JH, Lisabeth LD, Makuc DM, Marcus GM, Marelli A, Matchar DB, Moy CS, Mozaffarian D, Mussolino ME, Nichol G, Paynter NP, Soliman EZ, Sorlie PD, Sotoodehnia N, Turan TN, Virani SS, Wong ND, Woo D, Turner MB. Executive summary: heart disease and stroke statistics—2012 update: a report from the American Heart Association. Circulation. 2012;125:188–197. doi: 10.1161/CIR.0b013e3182456d46. doi:10.1161/CIR.0b013e3182456d46. [DOI] [PubMed] [Google Scholar]
- 4.Fihn SD, Gardin JM, Abrams J, Berra K, Blankenship JC, Dallas AP, Douglas PS, Foody JM, Gerber TC, Hinderliter AL, King SB, III, Kligfield PD, Krumholz HM, Kwong RY, Lim MJ, Linderbaum JA, Mack MJ, Munger MA, Prager RL, Sabik JF, Shaw LJ, Sikkema JD, Smith CR, Jr, Smith SC, Jr, Spertus JA, Williams SV. 2012 ACCF/AHA/ACP/AATS/PCNA/SCAI/STS guideline for the diagnosis and management of patients with stable ischemic heart disease: executive summary: a report of the American College of Cardiology Foundation/American Heart Association task force on practice guidelines, and the American College of Physicians, American Association for Thoracic Surgery, Preventive Cardiovascular Nurses Association, Society for Cardiovascular Angiography and Interventions, and Society of Thoracic Surgeons. Circulation. 2012;126:3097–3137. doi: 10.1161/CIR.0b013e3182776f83. doi:10.1161/CIR.0b013e3182776f83. [DOI] [PubMed] [Google Scholar]
- 5.Fox K, Garcia MA, Ardissino D, Buszman P, Camici PG, Crea F, Daly C, de Backer G, Hjemdahl P, Lopez-Sendon J, Marco J, Morais J, Pepper J, Sechtem U, Simoons M, Thygesen K, Priori SG, Blanc JJ, Budaj A, Camm J, Dean V, Deckers J, Dickstein K, Lekakis J, McGregor K, Metra M, Morais J, Osterspey A, Tamargo J, Zamorano JL. Guidelines on the management of stable angina pectoris: executive summary: The Task Force on the Management of Stable Angina Pectoris of the European Society of Cardiology. Eur Heart J. 2006;27:1341–1381. doi: 10.1093/eurheartj/ehl001. doi:10.1093/eurheartj/ehl001. [DOI] [PubMed] [Google Scholar]
- 6.Henderson RA, O'Flynn N. Management of stable angina: summary of NICE guidance. Heart. 2012;98:500–507. doi: 10.1136/heartjnl-2011-301436. doi:10.1136/heartjnl-2011-301436. [DOI] [PubMed] [Google Scholar]
- 7.Marschner IC, Colquhoun D, Simes RJ, Glasziou P, Harris P, Singh BB, Friedlander D, White H, Thompson P, Tonkin A. Long-term risk stratification for survivors of acute coronary syndromes. Results from the Long-term Intervention with Pravastatin in Ischemic Disease (LIPID) Study. LIPID Study Investigators. J Am Coll Cardiol. 2001;38:56–63. doi: 10.1016/s0735-1097(01)01360-2. doi:10.1016/S0735-1097(01)01360-2. [DOI] [PubMed] [Google Scholar]
- 8.Clayton TC, Lubsen J, Pocock SJ, Voko Z, Kirwan BA, Fox KA, Poole-Wilson PA. Risk score for predicting death, myocardial infarction, and stroke in patients with stable angina, based on a large randomised trial cohort of patients. BMJ. 2005;331:869. doi: 10.1136/bmj.38603.656076.63. doi:10.1136/bmj.38603.656076.63. [DOI] [PMC free article] [PubMed] [Google Scholar]
- 9.Daly CA, De Stavola B, Sendon JL, Tavazzi L, Boersma E, Clemens F, Danchin N, Delahaye F, Gitt A, Julian D, Mulcahy D, Ruzyllo W, Thygesen K, Verheugt F, Fox KM. Predicting prognosis in stable angina—results from the Euro heart survey of stable angina: prospective observational study. BMJ. 2006;332:262–267. doi: 10.1136/bmj.38695.605440.AE. doi:10.1136/bmj.38695.605440.AE. [DOI] [PMC free article] [PubMed] [Google Scholar]
- 10.Hlatky MA, Greenland P, Arnett DK, Ballantyne CM, Criqui MH, Elkind MS, Go AS, Harrell FE, Jr, Hong Y, Howard BV, Howard VJ, Hsue PY, Kramer CM, McConnell JP, Normand SL, O'Donnell CJ, Smith SC, Jr, Wilson PW. Criteria for evaluation of novel markers of cardiovascular risk: a scientific statement from the American Heart Association. Circulation. 2009;119:2408–2416. doi: 10.1161/CIRCULATIONAHA.109.192278. doi:10.1161/CIRCULATIONAHA.109.192278. [DOI] [PMC free article] [PubMed] [Google Scholar]
- 11.Henriksson M, Palmer S, Chen R, Damant J, Fitzpatrick NK, Abrams K, Hingorani AD, Stenestrand U, Janzon M, Feder G, Keogh B, Shipley MJ, Kaski JC, Timmis A, Sculpher M, Hemingway H. Assessing the cost effectiveness of using prognostic biomarkers with decision models: case study in prioritising patients waiting for coronary artery surgery. BMJ. 2010;340:5606. doi: 10.1136/bmj.b5606. doi:10.1136/bmj.b5606. [DOI] [PMC free article] [PubMed] [Google Scholar]
- 12.Steyerberg EW, Vickers AJ, Cook NR, Gerds T, Gonen M, Obuchowski N, Pencina MJ, Kattan MW. Assessing the performance of prediction models: a framework for traditional and novel measures. Epidemiology. 2010;21:128–138. doi: 10.1097/EDE.0b013e3181c30fb2. doi:10.1097/EDE.0b013e3181c30fb2. [DOI] [PMC free article] [PubMed] [Google Scholar]
- 13.Pencina MJ, D'Agostino RB, Sr, Steyerberg EW. Extensions of net reclassification improvement calculations to measure usefulness of new biomarkers. Stat Med. 2011;30:11–21. doi: 10.1002/sim.4085. doi:10.1002/sim.4085. [DOI] [PMC free article] [PubMed] [Google Scholar]
- 14.Rapsomaniki E, White IR, Wood AM, Thompson SG. A framework for quantifying net benefits of alternative prognostic models. Stat Med. 2012;31:114–130. doi: 10.1002/sim.4362. doi:10.1002/sim.4362. [DOI] [PMC free article] [PubMed] [Google Scholar]
- 15.Denaxas SC, George J, Herrett E, Shah AD, Kalra D, Hingorani AD, Kivimaki M, Timmis AD, Smeeth L, Hemingway H. Data resource profile: cardiovascular disease research using linked bespoke studies and electronic health records (CALIBER) Int J Epidemiol. 2012;41:1625–1638. doi: 10.1093/ije/dys188. doi:10.1093/ije/dys188. [DOI] [PMC free article] [PubMed] [Google Scholar]
- 16.Hirsch A, Verouden NJ, Koch KT, Baan J, Jr, Henriques JP, Piek JJ, Rohling WJ, van der Schaaf RJ, Tijssen JG, Vis MM, de Winter RJ. Comparison of long-term mortality after percutaneous coronary intervention in patients treated for acute ST-elevation myocardial infarction versus those with unstable and stable angina pectoris. Am J Cardiol. 2009;104:333–337. doi: 10.1016/j.amjcard.2009.03.052. doi:10.1016/j.amjcard.2009.03.052. [DOI] [PubMed] [Google Scholar]
- 17.Fox KA, Dabbous OH, Goldberg RJ, Pieper KS, Eagle KA, van de Werf F, Avezum A, Goodman SG, Flather MD, Anderson FA, Jr, Granger CB. Prediction of risk of death and myocardial infarction in the six months after presentation with acute coronary syndrome: prospective multinational observational study (GRACE) BMJ. 2006;333:1091. doi: 10.1136/bmj.38985.646481.55. doi:10.1136/bmj.38985.646481.55. [DOI] [PMC free article] [PubMed] [Google Scholar]
- 18.Steyerberg EW, Moons KG, van der Windt DA, Hayden JA, Perel P, Schroter S, Riley RD, Hemingway H, Altman DG. Prognosis Research Strategy (PROGRESS) 3: prognostic model research. PLoS Med. 2013;10:e1001381. doi: 10.1371/journal.pmed.1001381. [DOI] [PMC free article] [PubMed] [Google Scholar]
- 19.Harrell FE, Jr, Califf RM, Pryor DB, Lee KL, Rosati RA. Evaluating the yield of medical tests. JAMA. 1982;247:2543–2546. doi:10.1001/jama.1982.03320430047030. [PubMed] [Google Scholar]
- 20.Antithrombotic Trialists’ Collaboration. Collaborative meta-analysis of randomised trials of antiplatelet therapy for prevention of death, myocardial infarction, and stroke in high risk patients. BMJ. 2002;324:71–86. doi: 10.1136/bmj.324.7329.71. doi:10.1136/bmj.324.7329.71. [DOI] [PMC free article] [PubMed] [Google Scholar]
- 21.Altman DG, Royston P. What do we mean by validating a prognostic model? Stat Med. 2000;19:453–473. doi: 10.1002/(sici)1097-0258(20000229)19:4<453::aid-sim350>3.0.co;2-5. doi:10.1002/(SICI)1097-0258(20000229)19:4<453::AID-SIM350>3.0.CO;2-5. [DOI] [PubMed] [Google Scholar]
- 22.Harrell FE, Jr, Lee KL, Mark DB. Multivariable prognostic models: issues in developing models, evaluating assumptions and adequacy, and measuring and reducing errors. Stat Med. 1996;15:361–387. doi: 10.1002/(SICI)1097-0258(19960229)15:4<361::AID-SIM168>3.0.CO;2-4. doi:10.1002/(SICI)1097-0258(19960229)15:4<361::AID-SIM168>3.0.CO;2-4. [DOI] [PubMed] [Google Scholar]
- 23.Hemingway H, Crook AM, Feder G, Banerjee S, Dawson JR, Magee P, Philpott S, Sanders J, Wood A, Timmis AD. Underuse of coronary revascularization procedures in patients considered appropriate candidates for revascularization. N Engl J Med. 2001;344:645–654. doi: 10.1056/NEJM200103013440906. doi:10.1056/NEJM200103013440906. [DOI] [PubMed] [Google Scholar]
- 24.Lewis CE, McTigue KM, Burke LE, Poirier P, Eckel RH, Howard BV, Allison DB, Kumanyika S, Pi-Sunyer FX. Mortality, health outcomes, and body mass index in the overweight range: a science advisory from the American Heart Association. Circulation. 2009;119:3263–3271. doi: 10.1161/CIRCULATIONAHA.109.192574. doi:10.1161/CIRCULATIONAHA.109.192574. [DOI] [PubMed] [Google Scholar]
- 25.Sullivan LM, Massaro JM, D'Agostino RB., Sr Presentation of multivariate data for clinical use: the Framingham Study risk score functions. Stat Med. 2004;23:1631–1660. doi: 10.1002/sim.1742. doi:10.1002/sim.1742. [DOI] [PubMed] [Google Scholar]
- 26.Law MR, Morris JK, Wald NJ. Use of blood pressure lowering drugs in the prevention of cardiovascular disease: meta-analysis of 147 randomised trials in the context of expectations from prospective epidemiological studies. BMJ. 2009;338:b1665. doi: 10.1136/bmj.b1665. doi:10.1136/bmj.b1665. [DOI] [PMC free article] [PubMed] [Google Scholar]
- 27.Hemingway H, Croft P, Perel P, Hayden JA, Abrams K, Timmis A, Briggs A, Udumyan R, Moons KG, Steyerberg EW, Roberts I, Schroter S, Altman DG, Riley RD. Prognosis research strategy (PROGRESS) 1: a framework for researching clinical outcomes. BMJ. 2013;346:e5595. doi: 10.1136/bmj.e5595. doi:10.1136/bmj.e5595. [DOI] [PMC free article] [PubMed] [Google Scholar]
- 28.Hippisley-Cox J, Coupland C, Vinogradova Y, Robson J, Minhas R, Sheikh A, Brindle P. Predicting cardiovascular risk in England and Wales: prospective derivation and validation of QRISK2. BMJ. 2008;336:1475–1482. doi: 10.1136/bmj.39609.449676.25. doi:10.1136/bmj.39609.449676.25. [DOI] [PMC free article] [PubMed] [Google Scholar]
- 29.Collins GS, Altman DG. An independent external validation and evaluation of QRISK cardiovascular risk prediction: a prospective open cohort study. BMJ. 2009;339:b2584. doi: 10.1136/bmj.b2584. doi:10.1136/bmj.b2584. [DOI] [PMC free article] [PubMed] [Google Scholar]
Associated Data
This section collects any data citations, data availability statements, or supplementary materials included in this article.