

Abstract
The amount of tissue-specific expression variability (EV) across individuals is an essential characteristic of a gene and believed to have evolved, in part, under functional constraints. However, the determinants and functional implications of EV are only beginning to be investigated. Our analyses based on multiple expression profiles in 41 primary human tissues show that a gene’s EV is significantly correlated with a number of features pertaining to the genomic, epigenomic, regulatory, polymorphic, functional, structural and network characteristics of the gene. We found that (i) EV of a gene is encoded, in part, by its genomic context and is further influenced by the epigenome; (ii) strong promoters induce less variable expression; (iii) less variable gene loci evolve under purifying selection against copy number polymorphisms; (iv) genes that encode inherently disordered or highly interacting proteins exhibit lower variability; and (v) genes with less variable expression are enriched for house-keeping functions, while genes with highly variable expression tend to function in development and extra-cellular response and are associated with human diseases. Thus, our analysis reveals a number of potential mediators as well as functional and evolutionary correlates of EV, and provides new insights into the inherent variability in eukaryotic gene expression.
INTRODUCTION
The multitude of cell types in a multicellular organism exhibit morphological and functional diversity, which is characterized, and in large part determined, by the distinct expression profile of each cell type (1). For instance, perturbing a cell’s expression profile via transfection can change its identity (2,3). As a corollary, expression level of a gene can vary greatly across cell types. Genes involved in fundamental cellular processes such as metabolism, the so-called house-keeping genes, are expressed ubiquitously across cell types at either high or low level, while other genes may have restricted expression in a few cell types, again, at either high or low levels.
In addition to the vast diversity in expression levels of a gene in different cell types, expression of a particular gene even within a particular cell type can vary considerably across cells within the same tissue (4,5) and across individuals (6,7). For instance, genes RAGE and LRAP, whose higher expression levels are associated with diabetes, exhibit large intraspecific expression variability (EV) (6), while transporters, channels and metabolizing enzymes showed relatively low EV in human cell lines (8).
Although cell-to-cell variability of a gene’s expression is considered to be stochastic variability or ‘noise’, previous work has shown that the stochastic expression noise in yeast, i.e. inter-cell EV of a gene, is strongly correlated with the EV across environmental conditions and under genetic perturbations, and to lesser degree even across yeast species (9). Based on gene expression in Lymphoblastoid cell line for two HapMap populations, within-population EV levels in the two populations were shown to be significantly correlated with each other, even in the genes with significantly different expression levels between the two populations (10). Moreover, the genes with high or low EV have been shown to exhibit distinct characteristics, in their evolutionary rate, interactions with other genes (11) and association with diseases (10). Taken together, the research thus far suggests that a gene’s tissue-specific EV, much like tissue-specific expression level, is an inherent property of the gene, and is therefore subject to evolutionary pressures and is intimately linked with evolvability of complex organisms (12).
Previous investigations of EV have either considered cell-to-cell variability in identical yeast cells (9,11), i.e. stochastic variability, or considered population variability in gene expression level for specific human cell type, mainly the lymphoblastoid cell line (6,7,10,13). However, the extent to which the intraspecific EV differs among different primary human tissues is not known. Moreover, while previous works have investigated correlation between EV and evolutionary, functional and network properties of a gene (14), a detailed investigation of genomic and epigenomic correlates of EV has not been reported.
In this study, we present a detailed survey of potential genetic and epigenetic determinants of EV across samples in 41 primary human tissues. First, we estimate tissue-specific EV for each gene based on publicly available genome-wide expression profiles for 41 primary human tissues and numerous samples for each tissue type via a rigorous statistical approach accounting for batch effect, multi-experiment comparisons and expression level of a gene. We then assess a comprehensive set of genic properties in relation to EV, separately for each tissue type. The genic properties considered here include (i) genomic properties such as gene size, gene structure, regulatory elements in the gene’s vicinity, etc., (ii) multiple epigenomic marks such as DNAse hypersensitivity (DHS) in various regions relative to the gene, (iii) interacting partners of the gene’s protein product, (iv) pathways and biological functions, (v) disease associations and (vi) regions of natural structural variations in human population. Based on a stringent statistical analysis, our results suggest the following: (i) EV of a gene is partly encoded by the genomic context of the gene and is further modulated in a tissue-specific fashion by the tissue-specific epigenome, (ii) genes transcribed by strong promoters (those that elicit high gene expression) tend to have less variable gene expression, (iii) genes with low tolerance for EV tend to avoid genomic regions of structural polymorphisms, (iv) genes that encode inherently disordered or highly interacting proteins exhibit lower variability, (v) genes with lower variability are typically involved in house-keeping functions, while those having high EV are typically involved in extracellular response and development and are associated with human diseases.
Overall, our analysis reveals a number of potential mediators as well as functional and evolutionary correlates of EV, and provides new insights into inherent variability in eukaryotic gene expression.
MATERIALS AND METHODS
Method overview
Our goal is to exhaustively characterize genetic and epigenetic determinants of gene EV in normal human tissues (Figure 1 illustrates the overall pipeline). We obtained and curated a large data set of gene expression experiments from multiple tissues, preprocessed with advanced statistical methods that control for batch effects and allow direct comparison of arrays across experiments, and measure correlation between a suitably defined tissue-specific measure of EV and various features ascribed to a gene locus. We used 688 microarray samples for 74 tissues, which were downloaded from the Gene Expression Omnibus (GEO) (15). These were preprocessed using single-chip normalization (16) and quality assessment methods (17) that are robust to batch effect and multi-experiment comparisons. We used a local likelihood method to estimate tissue-specific expected variance for each gene as a function of its tissue-specific average expression and defined a measure of EV for each gene and tissue as the ratio of observed variance to expected variance. We next created a large compendium of genomic/epigenomic features for each gene locus, along with additional gene features, e.g., association with disease and interaction characteristics in the protein–protein interaction (PPI) network. We used linear regression (LR) as well as Wilcoxon test to estimate association between EV and compiled gene features.
Figure 1.

Overall analysis pipeline. Our goal is to exhaustively characterize genetic and epigenetic determinants of gene EV in normal human tissues. We obtained and processed a curated data set of gene expression experiments from multiple tissues and estimated tissue-specific measure of expression variation (EV) for each gene. We then created a large compendium of genetic and epigenetic features for each genic region, along with additional gene features, e.g. association with disease and interaction characteristics in the PPI network. Finally we analyzed the relationships between EV and various genic features using LR, Wilcoxon test and Fisher test, as appropriate.
Affymetrix gene expression microarray data preprocessing
We downloaded CEL files for 7741 Affymetrix HGU133plus2 microarrays from 175 studies in the Gene Expression Omnibus (15). CEL files were preprocessed with the frma (16) single-chip procedure. Expression measurements were standardized using ‘Gene Expression Barcode z-scores’ (18). We removed arrays that were deposited multiple times into the repository (Euclidean distance between arrays <1). We used the GNUSE metric (17) to assess array quality and removed all arrays from studies with median GNUSE >1.25 (95th percentile) and removed individual arrays with GNUSE >1.2 (95th percentile). We did further hand curation to retain only normal, nondiseased, samples (n = 688) from 74 tissues of which we used 41 with at least five samples. ‘SupFile1:“Expression samples”’ contains the complete list of studies and samples used in the reported analyses.
Estimating the expression variance
We used a cutoff of 2.54 on the Gene Expression Barcode z-score scale to determine when a probeset for a given gene is expressed in each sample. We then calculated for each probeset the average and standard deviation of expression in each tissue containing at least five samples in our data set using only samples where the probeset is expressed. Our goal is to characterize genetic and epigenetic determinants of EV across individuals. This requires a measurement of variability that accounts for the known relationship between mean expression and variance and presents, on average, no relationship to overall expression. Given a measurement with this property we can ascribe variability beyond that expected given a gene’s overall expression. The coefficient of variation, i.e. standard deviation divided by the mean, which is used as the standard measurement of noise in the literature, does not satisfy this requirement (Supplementary Figure S1) since for this type of data it induces a very strong bias towards low expression genes. To satisfy this property, we used local polynomial likelihood estimation (19) to model variance as a function of mean expression for each probeset in each tissue (Figure 2). Our measurement posits that we can estimate expected variability for a probeset given its overall expression using a gamma regression model. We assumed variance was gamma distributed with canonical link function modeled as a locally weighted quadratic polynomial. We obtained expected variance as a function of average expression for each probeset using the tissue-specific local likelihood estimates. We used the ratio of observed variance to expected variance for each probeset in each tissue as the statistic measuring EV. We found that EV is insensitive to overall expression level (Supplementary Figure S1) as desired.
Figure 2.

Extreme expected variability is not correlated across tissue types. Across-sample variability as a function of average expression across samples in astrocytes samples (A). We model expected across-sample variability (y-axis) of a given probeset as a function of average expression across samples (x-axis) using a gamma local regression method (red line). We show a smoothed density estimate over 54 613 probesets, where darker color indicates more probesets fall into that region of the plot. We found that probesets tend to be hypo or hypervariable in few number of tissues (B and C, respectively), indicating that neither hyper nor hypovariability for a given probeset is consistent across tissues.
We obtained Ensembl gene ids from the HGU133plus2 probeset annotation in the hgu133plus2.db Bioconductor package (20) to obtain an EV value for each Ensembl id. Probesets mapping to multiple Ensembl ids were discarded, and multiple probesets mapped to single Ensembl id were aggregated as follows: to determine if a gene is expressed based on the Gene Expression Barcode, the majority across probesets mapping to that gene was used, and median EV across probesets mapping to each gene was used as the EV measure. Using this procedure we obtained EV for 13 059 Ensembl gene ids. To verify that gene EV is not biased by aggregation across probesets we measured correlation between across-probeset variability in mean expression and EV and observed no significant relationship (‘SupFile1: “ProbesetVar”’). For some tissues, the samples in our database were obtained from multiple GEO experiments. To rule out the possibility of EV being biased by probable batch effects related to multiple experiments, we compared the distribution of EV for tissues with samples obtained from single GEO experiments to EV for tissues with samples obtained from multiple GEO experiments, and found no significant differences (Supplementary Figure S2).
Transcription factor binding site identification and Motif clustering
For each enhancer sequence and each of the 981 positional weight matrix for vertebrate transcription factors (TF) in TRANSFAC database (21), we used our previously published tool (22) to identify binding sites based on a score threshold of 95th percentile. For each enhancer only presence/absence of a motif was noted. Motifs were clustered based on similarity due to structural similarities between the corresponding TFs. All pairwise motif similarity scores for the 981 vertebrate motifs were obtained from the author of STAMP (23). Using pairwise similarity, the motifs were hierarchically clustered using the ‘hierarchy' module in SciPy's ‘cluster’ package (www.scipy.org) for Python based on Euclidean distance and complete linkage. The resulting tree was trimmed using the module's ‘fcluster' function with a maximum co-phenetic distance criterion that produced 42 disjoint clusters.
The features
Genomic features
We used Ensembl gene and transcript annotation (www.ensembl.org). The 5′ most transcript start was used as the gene start location and the 2-kb region upstream considered as the proximal promoter. We identified TF binding sites in 2 kb proximal promoter for vertebrate TFs as described above. Additionally we calculated the following features:
(i) Gene size—genomic span of the longest transcript; (ii) Number of transcripts; (iii) Longest transcript size; (iv) Total number of disjoint exons for all transcripts of a gene; (v) CG fraction in proximal promoter; (vi) Conservation of proximal promoter—PhastCons score based on mammalian 17-way alignment was obtained from UCSC database (genome.ucsc.edu); (vii) Total number of distinct TF clusters with at least 1 binding site in proximal promoter; (viii) Total number of miRNAs targeting a gene; and (ix) Presence of binding sites for each of the 42 TF clusters.
Epigenomic features
We investigated DHS, and three histone marks—H3K4me3, H3K27me3, H3K36me3 for the tissues that we identified, based on name and description, as being common to our data sets. We downloaded broad peak BED files for DHS and other epigenomic marks from UCSC database (genome.ucsc.edu); details are provided in ‘SupFile1: “ENCODE-Epi”’. In cases where two biological replicates were present for each tissue, only the first replicate was used, as there is high correlation between replicates (>0.9). For each tissue, and for each genic region (2 kb upstream, 5 kb upstream, gene body and gene body ± 10 kb), we obtained the fraction (x) of the region overlapping a broad peak for a certain epigenomic mark, using our tool. The fraction x was transformed as ln(x/(1−x)) after values of 0 and 1 were substituted with the minimum non-0 and maximum non-1values in the same sample.
Quantifying inherent disorder in proteins
For each protein sequence, we used the MobiDB database (24) of multisource annotation of disordered regions to obtain a consensus annotation of disorder. We then calculated the fraction of protein covered by contiguous disordered regions of at least consecutive 30 amino acids. This fractional value x was then transformed as ln(x/(1−x)) as for epigenomic marks.
Protein–protein interactions
Detailed protein links data were obtained from the STRING database (25), which was then filtered for human interactions and experimental tracks. The data were mapped from Ensembl protein IDs to gene IDs. The resulting data were used to compute node degrees for each gene with the average node degree calculated for multiple proteins encoded by the same gene.
Regions of Copy Number Variation
Copy Number Variation data were obtained from the Database of Genomic Variants version 10 (http://projects.tcag.ca/variation). Only variation types marked as CopyNumber were included. Gene symbols were converted into Ensembl IDs, and the set of genes used in this study was noted as either being present or absent from the polymorphic regions.
Correlating expression variance with various features via LR
We measured dependence of expression variance (EV) on each feature tested using LR: for gene i in tissue j we define model vij = b0j + b1j * xij for feature xij. In this model parameter b1j measures the association between the feature and EV in tissue j. We performed two-sided t-tests for null hypothesis of no association (b1j = 0), report the t-statistic obtained from the least-squares estimate of b1j
 and note the prevalence of significant tests across tissues. Our interpretation of relationship between a feature and EV is based on prevalence of significant relationship across 41 tests corresponding to 41 tissues, instead of a priori filtering the results using multiple testing correction. We verified our inferences using a Wilcoxon rank-sum test by categorizing the 10 and 25% of genes with highest EV as hypervariable and the 10 and 25% with lowest EV as hypovariable in each tissue and tested for rank differences against a background set containing the remaining 50% of the genes. The LR and Wilcoxon test based results are provided in Supplementary File S1. In addition we also obtained a trend plot relating top X% of hyper-/hypovariable genes to the range of feature values for each feature, where X is varied from 5 to 50. These are shown in Supplementary File S2.
RESULTS
Note: All results are compiled in Supplementary File S1 in various sheets and will be referred to as ‘SupFile1:“sheet name”’. In addition, trends of relationships between EV and different covariates are shown in Supplementary File S2 referred to as ‘SupFile2: figure-index’. Besides the trend plots, two additional figures are included in Supplementary File S2. A default P-value threshold of 0.05 is used. The results are summarized in Table 1, which shows for each feature the number of tissues a significant trend was observed. In what follows we present our results along with immediately pertinent discussion and defer additional discussion until later in the discussion section.
Table 1.
Summary of detected associations between EV and various genic features
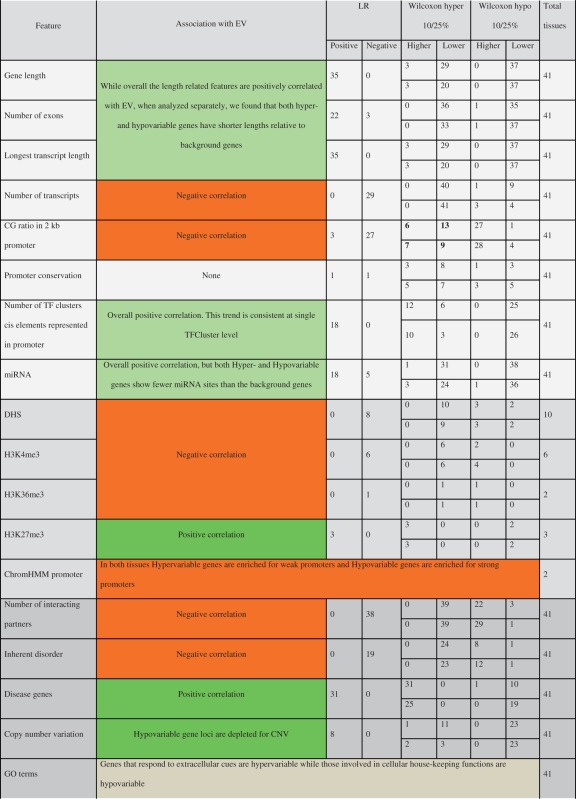 |
Colors represent direction of correlation (green: positive, red: negative). Lighter shade is used to denote exception. The numbers denote the number of tissue in which a specific test was significant. For Wilcoxon tests, both top 10 and 25% versus background comparison are shown separated by horizontal line. For instance, top 10% hypervariable genes had higher (lower) GC fraction in 6(13) tissues and top 25% hypervariable genes had higher (lower) GC fraction in 7(9) tissues.
Genomic correlates of EV
We first assessed whether a gene’s EV is related to genomic features, which pertain to the gene (Table 1). The features included those related to gene size and structure as well as composition, conservation and regulatory elements in a gene’s proximal promoter. All assessment was based on LR, Wilcoxon test and visual inspection of trends (see ‘Materials and Methods’ section) and was performed independently in each tissue type.
Gene length related features
As shown in ‘SupFile1: “Genomic Features LinReg”’ and ‘SupFile2: 18,20,22’, we found by using LR that the features related to gene’s overall length (gene’s genomic span, number of exons and longest transcript length) were positively related to gene’s EV. For instance, as summarized in Table 1, in 35 tissues a significant positive trend was found between gene length and EV. This may reflect inherent noise associated with transcribing and processing long transcripts, consistent with reports showing length bias in detection of differential expression (26). However, this is not likely due to potentially greater number of transcripts being associated with longer transcripts, while the measurement ambiguity associated with multiple transcripts ultimately manifests as expression noise at the gene level. Instead, we found that the number of transcripts for a gene is negatively correlated with the gene’s EV (‘SupFile1: “Genomic Features LinReg”’, ‘SupFile2: 19’).
To verify the robustness of our inference we assessed the correlation between EV and various genomic features using an alternative approach. In each tissue we identified the top 10 and 25% most variable (hypervariable), bottom 10 and 25% (hypovariable) and the background (middle 50%) genes, and we then compared each of the feature values directly using a Wilcoxen test between hypervariable versus background and hypovariable versus background genes. Using this method, we found that the relationship between length-related features exhibited a nonmonotonic relationship with EV, which is visible in the trend plots. We found that both hypervariable and hypovariable genes have shorter genes and transcripts and fewer exons relative to the background genes (‘SupFile1: “Genomic Features Wilcox”’, ‘SupFile2: 18,20,22’). For instance, as shown in Table 1, in 29 tissues hypervariable genes are significantly shorter and in 37 tissues hypovariable genes are significantly shorter than the background. This nonmonotonic relationship may indicate multiple mechanisms governing the relationship between gene length and EV. A depletion of long genes among the most hypervariable genes may reflect the fact that long genes have a greater number of domains and thereby a greater number of interaction partners, which is known to associate with low EV (11). However, a depletion of long genes among the most hypovariable genes may reflect the noise associated with transcribing long genes, as mentioned above.
Promoter
We investigated three properties of the proximal (2 kb) promoter—evolutionary conservation, GC fraction and number of nonredundant regulatory motifs. We found that EV was not significantly associated with evolutionary conservation, although there was a weak negative association in a small number of tissues where hypovariable genes tend to have slightly more conserved proximal promoter. This suggests that broadly speaking EV is either not an evolutionarily conserved property, or promoter attributes potentially mediating EV are not adequately captured by overall sequence conservation. Further elucidation will require a more detailed understanding of promoter architecture (27).
We found that genes with GC-rich promoters tend to be hypovariable in their expression (‘SupFile1: “Genomic Features LinReg”, “Genomic Features Wilcox”’). For instance, in 27 tissues a significant negative trend was found between GC content and EV (Table 1). This is consistent with the fact that GC-rich promoters correspond to genes with ubiquitous expression that are engaged in house-keeping functions (28), which have constrained expression due to greater number of interactions (29) and other homeostasis requirements (30). Interestingly, we observed an overall positive correlation between the number of distinct cis elements in a promoter to the gene’s EV. This observation is not due to compositional properties of regulatory motifs; the average GC fraction of motifs used in this study is 0.44, and there is small positive correlation (although significant) between a gene promoter’s CG composition and the number of distinct TF motifs it has. We assume that the number of distinct motifs approximately reflects the number of regulators. Although precise effect of regulators on the EV of its target genes may depend on specific network topology (31), our observation is consistent with previous reports, based on a highly controlled experiment, demonstrating a positive correlation between expression noise and number of regulators (32). When we repeated the analysis independently for each TF (‘SupFile1: “Genomic TFclusters LinReg”’) the trend was broadly consistent, with few exceptions. Our findings based on LR are consistent with analyses using the Wilcoxon test (‘SupFile1: “Genomic Features Wilcox”, SupFile2: 17,21,23’). Our attempt to repeat this analysis based on in vivo binding (ChIP-seq) data was hampered by insufficient data, and was inconclusive, but not inconsistent with motif-based results (SupFile1: “TF ChIP-seq LinReg”).
To assess whether positive correlation between number of motifs and EV is not simply due to variability in the amount of regulatory proteins, we tested whether TFs are enriched among hypervariable genes in each tissue using a Fisher test. We found that in most tissues TFs are significantly depleted among hypervariable genes (SupFile1:”TF EV”).
We also repeated the above analysis using the number of miRNAs putatively regulating a gene. As for TF motifs, we obtained for each gene the number of predicted miRNA regulators from MicroRNA.org database and repeated the LR and Wilcoxon tests. Similar to TF motifs, based on LR, the number of miRNA regulators was positively related to EV (‘SupFile1: “Genomic Features LinReg”’). However, the Wilcoxon test showed that both hypo- and hypervariable genes had fewer miRNA regulators than the background (‘SupFile1: “Genomic Features Wilcox”’).
The tissue-specific epigenome provides further context to tissue-specific EV
Next, we tested whether presence of certain tissue-specific epigenomic marks in various genic regions affect the gene’s EV. We selected DHS and three histone modifications (H3K4me3, H3K27me3 and H3K36me3) that have previously been shown to be associated with gene expression (33–35) and which were available for a subset of the tissues in our data set. Note that the epigenomic data are available mostly in cell lines and less so in primary tissues. We quantified each of the four features in four genic regions—2 kb upstream, 5 kb upstream, gene body and ± 10 kb flanking regions of gene body (see ‘Materials and Methods’ section). Independently in each tissue, for each epigenomic mark available for the tissue, and for each genic region, we assessed the correlation between EV and the mark based on LR and Wilcoxon test. As shown in ‘SupFile1: “Epi Linreg”, “Epi Wilcox” and SuplFile2: 1–16’, in all genic regions, EV is positively related to the repressive mark, H3K4me3, and is negatively related to DHS and the two activating histone marks. This observation is not biased by the absolute expression level, as we quantified expected EV as function of a gene’s average expression (see ‘Materials and Methods’ section). Overall, our results suggest that transcriptionally active loci generally have a lower EV, while less active or heterochromatic loci exhibit variable expression consistent with previous experimental data in yeast (5).
Genes with strong promoters have less variable expression
We characterized how chromatin state affects EV. ChromHMM integrates multiple chromatin marks into a genome-wide annotation of chromatin state (36). Specifically, we obtained the promoters characterized as ‘strong’ or ‘weak’ for two tissues found in our data set: breast epithelial cells and skin fibroblasts. We performed this analysis on the subset of genes in the array (see ‘Materials and Methods’ section) whose promoters were annotated as either strong or weak according to ChromHMM. We then compared the fraction of hypervariable (or hypovariable) genes that were annotated strong or weak relative to the background genes using a Fisher Exact Test. As shown in ‘SupFile1: ChromHMM Fisher’, in both tissues, we observed that the hypervariable genes are significantly depleted for strong promoters (Odds ratios ranging from 0.32 to 0.61) and consistently, hypovariable genes are significantly enriched for strong promoters (Odds ratios ranging from 1.09 to 1.43). Since we estimate expected variance as a function of average expression, this result is not due to variability due to lower expression for weak promoters. In fact our conclusions do not change even after we randomly sample from weak and strong promoters while controlling for mean cross-sample expression values. This suggests that genes that exhibit increased EV are under relatively weak regulatory control, consistent with the results above showing hypervariability of genes in heterochromatin regions.
Genes encoding inherently disordered proteins have low EV
Inherently disordered proteins (IDP) lack a stable structure in isolation and adopt a confirmation when bound to their partners (37). By virtue of their flexibility and ability to bind multiple partners they tend to occupy central roles in biological networks (38), and are enriched in proteins involved in transcription, cell signaling and chromatin modification activities (39). Previous works have suggested that dosage sensitivity may be a driver for reduced noise in gene expression (12,40), and consistently, in yeast, dosage sensitive genes have low EV (9). Moreover, IDPs have been found to be dosage sensitive (41), which would suggest that genes encoding IDPs have low EV. Consistent with this theoretical expectation we found that in 19 tissues, inherent disorder score (see ‘Materials and Methods’ section) was significantly negatively correlated with EV based on LR (‘SupFile1: Genomic Features LinReg’), and based on Wilcoxon test (‘SupFile1: Genomic Features Wilcox’). Also see ‘SupFile2: 25’. Our results strongly suggest that genes encoding IDPs have low EV.
Genes that encode highly interacting proteins exhibit lower variability
Genes whose protein product is engaged in a large number of PPIs exhibit lower EV in yeast (11) as well as in human olfactory neurosphere-derived cell and nose fibroblasts (42). To characterize the prevalence of this observation across a large number of primary human tissues, we obtained PPI data from STRING database (25). We then tested for association between the number of interactions for each gene (measured as the number of edges in the PPI network for encoded proteins) and EV. We found that EV is negatively correlated with the number of protein interactions in all but three tissues (‘SupFile1: Genomic Features LinReg, Genomic Features Wilcox’, ‘SupFile2: 27’). Our result coincides with previous observations and further generalizes them to a large number of tissues. Given that the PPI data are not tissue-specific, the tests in various tissues may seem redundant. However we note that the genes’ EV is highly tissue-specific; most genes are hyper- or hypovariable in a small set of tissues (Figure 2) supporting the independence of analyses in different tissues. Overall our results suggest that low EV is a general characteristic of highly interacting proteins.
Disease genes have more variable gene expression
Gene EV has been linked to neurological disease (42); expression variance of genes in a few core networks were found to be less variable in Schizophrenic patients compared with normal subjects, while in Parkinson’s disease patients the opposite trend was observed. Hypervariable gene expression has also been linked with cancer (43), HIV susceptibility and several human diseases (10). Here we extended previous analyses performed on specific cell lines to multiple primary tissues from normal subjects. We obtained a list of 9692 genes that have been linked to various human diseases from OMIM database (www.ncbi.nlm.nih.gov/omim) and tested the correlation between EV and gene–disease association, independently for each tissue. Consistent with previous reports, we found that EV was positively correlated with disease in 32 out of 41 tissues based on LR (‘SupFile1: Genomic Features LinReg’, ‘SupFile2: 26’) and was consistent using Fisher test (‘SupFile1: Genomic Features Wilcox’). Phenotypic plasticity is an essential component in the molecular basis of many diseases (44,45). Our result suggests gene expression plasticity, as measured by EV, plays an important role in disease.
Hypovariable gene loci evolve under purifying selection against structural polymorphisms
Much like single-nucleotide polymorphisms, numerous Copy Number Variations (CNV) have been recorded in normal human populations (projects.tcag.ca/variation). CNV-induced dosage changes are expected to have a deleterious effect on the genes with low EV and therefore we expect naturally occurring CNVs to be depleted for genes with low EV. Consistent with this expectation, the tissue-wise LR showed overlap with CNV regions to be significantly positively correlated with EV in 8 of the 41 tissues (‘SupFile1: Genomic Features LinReg’). Also, hypovariable genes are significantly depleted in CNV regions in 23 of the 41 tissues compared with background using the Fisher test (‘SupFile1: Genomic Features Wilcox’, ‘SupFile2: 24’). Importantly, we did not see a significant enrichment for CNVs among hypervariable genes ruling out the possibility that CNVs underlie the observed variability. Taken together, our results suggest that there is a negative selection against CNV in the regions harboring hypovariable genes. This result along with our observed weak negative correlation between hypovariability of greater evolutionary conservation in the promoter region may suggest that hypovariable expression is a functionally critical property of a gene, which is evolutionary maintained through selection.
Genes with hyper- and hypovariable expression are involved in distinct cellular functions
We performed functional term enrichment analysis to characterize the function of genes that show extreme (high or low) EV in a specific tissue. In each tissue we used the top 25% most variable and bottom 25% least variable genes and determined enrichment of Gene Ontology categories based on these sets independently for each tissue. We found that in general, categories involving signaling and response (i.e. extracellular processes) are enriched in the set of hypervariable genes, whereas categories involving metabolic and other cellular processes are enriched in the set of hypovariable genes. The details are provided in (‘SupFile1: GO Hyper and GO Hypo’). This suggests that EV is an essential aspect of gene function, consistent with previous reports (10,42) and findings reported above.
DISCUSSION
EV has been investigated at different scales—cell-to-cell variability in a homogeneous cell population (stochasticity) (46), spatiotemporal variability in an organism (expression complexity) (1), interindividual variability, both within and across populations (10). Although these contexts are distinct from each other, previous studies suggest that EV is correlated across these contexts. For instance, cell-to-cell variability, or stochasticity, was shown to significantly correlate with EV across different conditions in yeast (9). EV within a population was shown to be correlated with EV between populations (10). Also, as we have shown above, genes with low EV tend to be ubiquitously expressed house-keeping genes, i.e. with low spatiotemporal variability.
It is possible in principle that part of cross-individual EV may be due to differences in regulation across individuals rather than stochastic variability. However, the role of regulation may be limited in this case for the following reasons. First, Expression Quantitative Trait Loci (eQTL) studies show that amount of expression variance explained by genetic variability is extremely small (<5%), (47), while various measures of variability predict noise with an R of 0.52 (9). Second, in previous studies of EV within and across populations show that even in cases where a gene is differentially expressed in different populations, its within-population EV remains similar (10). Third, for a typical gene, hypervariability is rare, even when considering only the tissues in which a gene is expressed (Figure 2), which rules out genetic regulation as a reason for EV. Fourth, we show that the genes encoding TF regulators are no more likely to be hypervariable than other genes, which suggest that gene regulation is not a significant causal agent of EV in general. We cannot rule out the role of epigenomic differences, but that can also vary stochastically, and is poorly explained by genetics. Overall, the relatedness of EV across various contexts, the aforementioned arguments, as well as heritability of EV (48) strongly suggests that EV is an inherent property of a gene encoded either in the genome or heritable epigenome, thus motivating the present study.
Here we report a first comprehensive survey of potential determinants of EV by leveraging the vast compendium of genome-wide expression profiles in dozens of primary human tissues processed using rigorous statistical methods to control for batch effects. Because we measure expected EV relative to average gene expression (see ‘Materials and Methods’ section), the results presented here are not explained by underlying changes in variability concomitant to changes in expression level (Figures 1 and 2). Based on multiple quantitative (LR and Wilcoxon test) and qualitative (trend plots) assessment of associations between tissue-specific EV and various genic features, our investigation shows that a gene’s EV is significantly correlated with a number of features pertaining to the genomic, epigenomic, regulatory, polymorphic, functional, structural and network characteristics of the gene. Our findings are summarized in Table 1.
Our results show that, overall, EV is regulated by multiple mechanisms operating in distinct ways. In few cases, EV shows a significant monotonic relationship with genetic or epigenetic features (e.g. breast stroma in ‘SupFile 2: 26’) indicating that a determinant is involved directly in the regulation of both hyper- and hypovariability in gene expression. By far, the most predominant trend we observed shows that features are related exclusively to ‘one’ of hyper- or hypovariability (e.g. all significant results, except CD4+ T-cells in ‘SupFile 2: 1’). This suggests that mechanisms regulating hyper- and hypovariability are distinct, and when involved in the regulation of EV, the large fraction of determinants tested in this study is involved exclusively in one of these mechanisms. Finally, we also observed instances where features were significantly related to both hyper- and hypovariability in gene expression (for example, gene size and other length-related genomic features ‘SupFile 2: 18’). In this case, we suggest that these features participate, along with other determinants, in the regulation of EV. Specifically, these determinants may provide a ‘protective’ function, whereby extreme feature values (e.g. long gene length) permit other mechanisms specific to the regulation of either hyper- or hypovariability to act. Our results are generally consistent with biological intuition as well as with previous findings in few cases where they overlap, while also revealing a few less obvious possibilities, discussed next.
The overall increase in EV with the length and number of exons in a gene may suggest accumulated variability in processing long and multi-exonic transcripts, consistent with previously reported length bias in detection of differentially expressed genes (26). This could also be due to ambiguity in expression measurements when we consider that longer transcripts are more likely to have greater number of (known and unknown) transcripts. But surprisingly, we see a negative relationship between EV and number of known transcripts, which may possibly be due to functional redundancy and mutual exclusion among transcripts, consistent with recently observed cell-to-cell variability in transcript usage (46). Although hypervariable genes are longer than hypovariable genes, interestingly, they are shorter than the genes with moderate variability suggesting an alternative mechanism relating gene length and EV. We can speculate that a depletion of long genes among the most hypervariable genes may reflect the fact that long genes have a greater number of domains and thereby a greater number of interaction partners, which is associated with low EV (11).
In the promoter regions, although not significantly based on our criteria, the promoters of hypovariable genes tend to be more conserved, which may suggest the functional importance and need to conserve hypovariability leading to conservation on promoters to the extent it mediates EV in mammals. It is possible that with an improved understanding of promoter elements mediating EV, we may see a clear relationship between promoter conservation and EV (27). EV is also lower for genes with GC-rich proximal promoters, likely to be performing house-keeping functions (28). This may be either because of functional constraints on house-keeping genes due to a greater number of interactions (29) or homeostasis requirements (30), or an alternative mechanism, the same one underlying low EV for genes in active chromatin configuration as well as with strong promoters, and high EV for genes with weak promoters and in heterochromatic regions, observed previously (5). We also noted, independent of CG, an overall positive correlation between number of distinct cis elements in the promoter, as well as number of targeting miRNAs in the 3′ Untranslated Region (UTR) of a gene and the gene’s EV, consistent with previous reports showing positive correlation between expression noise and number of regulators (32). However, for the number of miRNAs targeting a gene, Wilcoxon test showed a more nuanced relationship; while initially EV increases with number of miRNA regulators, at higher values of the number of miRNA regulators, EV decreases, pointing to an alternative mechanisms relating number of miRNAs regulating a gene to the gene’s EV. We speculate that this specific effect in case of miRNA, but not for TFs, may be related to suppressive effect of miRNA on mRNA levels.
Besides relationships between EV and genomic/epigenomic features, we also found that genes encoding intrinsically disordered or highly interacting proteins exhibit constrained EV. While it has been observed that these proteins tend to have high abundance, our result is not a by-product of increased abundance because our EV measurement controls for mean average expression. This is likely due to a greater dosage sensitivity of highly interacting proteins (which IDPs tend to be) and relationship between dosage sensitivity and low EV (9,12,40,41). We also found that, consistent with dosage sensitivity, hypovariable genes are depleted in CNV regions in normal human population. Our finding that genes involved in human diseases tend to be hypervariable suggesting that the EV of a gene perhaps makes certain genes more likely agents of disease processes. Our finding is consistent with previous reports (10,43), as well as mechanisms that relate phenotypic plasticity (EV in our case) to diseases (44,45). Finally, consistent with previous reports (10,42), we found that genes involved in common and fundamental cellular processes tend to have low EV while genes responding to environment tend to be more variable in their expression.
The features investigated here are not necessarily independent of each other. For instance intrinsic disorder and tendency for a greater number of interactions are highly correlated. Various features related to gene length are correlated. Promoter composition, function and interactions are also mutually correlated. A similar situation arises in investigating potential correlates of protein evolutionary rates, where numerous correlates have been reported but a clearer view of independent mechanistically based determinants of protein evolutionary rates are only starting to emerge (49). Disambiguating independent mechanisms driving EV will require further study involving larger, controlled data sets and targeted experiments. Notwithstanding, here we provide a first comprehensive survey of potential determinants of EV and have discussed potential driving mechanisms and relationships among them providing a point of departure for future studies.
SUPPLEMENTARY DATA
Supplementary Data are available at NAR Online.
FUNDING
This work was supported by grants from National Institutes of Health [R01GM100335 to S.H. and R01HG005220 to H.C.B.]. Funding for open access charge: National Institutes of Health [R01GM100335 to S.H. and R01HG005220 to H.C.B.].
Conflict of interest statement. None declared.
Supplementary Material
ACKNOWLEDGEMENTS
The authors would like to thank Justin Malin, Leonid Sukharnikov, Shrutii Sarda and especially the anonymous reviewers for their thoughtful constructive comments on the initial draft. S.H. conceived the project. S.H and H.C.B. designed the project. E.A. performed the analyses with initial help from J.C., S.H. and H.C.B. wrote the manuscript.
REFERENCES
- 1.Su AI, Wiltshire T, Batalov S, Lapp H, Ching KA, Block D, Zhang J, Soden R, Hayakawa M, Kreiman G, et al. A gene atlas of the mouse and human protein-encoding transcriptomes. Proc. Natl Acad. Sci. USA. 2004;101:6062–6067. doi: 10.1073/pnas.0400782101. [DOI] [PMC free article] [PubMed] [Google Scholar]
- 2.Sul JY, Kim TK, Lee JH, Eberwine J. Perspectives on cell reprogramming with RNA. Trends Biotechnol. 2012;30:243–249. doi: 10.1016/j.tibtech.2012.02.004. [DOI] [PMC free article] [PubMed] [Google Scholar]
- 3.Kim TK, Sul JY, Peternko NB, Lee JH, Lee M, Patel VV, Kim J, Eberwine JH. Transcriptome transfer provides a model for understanding the phenotype of cardiomyocytes. Proc. Natl Acad. Sci. USA. 2011;108:11918–11923. doi: 10.1073/pnas.1101223108. [DOI] [PMC free article] [PubMed] [Google Scholar]
- 4.Raj A, van Oudenaarden A. Nature, nurture, or chance: stochastic gene expression and its consequences. Cell. 2008;135:216–226. doi: 10.1016/j.cell.2008.09.050. [DOI] [PMC free article] [PubMed] [Google Scholar]
- 5.Kaern M, Elston TC, Blake WJ, Collins JJ. Stochasticity in gene expression: from theories to phenotypes. Nat. Rev. Genet. 2005;6:451–464. doi: 10.1038/nrg1615. [DOI] [PubMed] [Google Scholar]
- 6.Storey JD, Madeoy J, Strout JL, Wurfel M, Ronald J, Akey JM. Gene-expression variation within and among human populations. Am. J. Hum. Genet. 2007;80:502–509. doi: 10.1086/512017. [DOI] [PMC free article] [PubMed] [Google Scholar]
- 7.Stranger BE, Montgomery SB, Dimas AS, Parts L, Stegle O, Ingle CE, Sekowska M, Smith GD, Evans D, Gutierrez-Arcelus M, et al. Patterns of cis regulatory variation in diverse human populations. PLoS Genet. 2012;8:e1002639. doi: 10.1371/journal.pgen.1002639. [DOI] [PMC free article] [PubMed] [Google Scholar]
- 8.Sun D, Lennernas H, Welage LS, Barnett JL, Landowski CP, Foster D, Fleisher D, Lee KD, Amidon GL. Comparison of human duodenum and Caco-2 gene expression profiles for 12,000 gene sequences tags and correlation with permeability of 26 drugs. Pharm. Res. 2002;19:1400–1416. doi: 10.1023/a:1020483911355. [DOI] [PubMed] [Google Scholar]
- 9.Dong D, Shao X, Deng N, Zhang Z. Gene expression variations are predictive for stochastic noise. Nucleic Acids Res. 2011;39:403–413. doi: 10.1093/nar/gkq844. [DOI] [PMC free article] [PubMed] [Google Scholar]
- 10.Li J, Liu Y, Kim T, Min R, Zhang Z. Gene expression variability within and between human populations and implications toward disease susceptibility. PLoS Comput. Biol. 2010;6:e1000910. doi: 10.1371/journal.pcbi.1000910. [DOI] [PMC free article] [PubMed] [Google Scholar]
- 11.Li J, Min R, Vizeacoumar FJ, Jin K, Xin X, Zhang Z. Exploiting the determinants of stochastic gene expression in Saccharomyces cerevisiae for genome-wide prediction of expression noise. Proc. Natl Acad. Sci. USA. 2010;107:10472–10477. doi: 10.1073/pnas.0914302107. [DOI] [PMC free article] [PubMed] [Google Scholar]
- 12.Lehner B. Selection to minimise noise in living systems and its implications for the evolution of gene expression. Mol. Syst. Biol. 2008;4:170. doi: 10.1038/msb.2008.11. [DOI] [PMC free article] [PubMed] [Google Scholar]
- 13.Cheung VG, Spielman RS, Ewens KG, Weber TM, Morley M, Burdick JT. Mapping determinants of human gene expression by regional and genome-wide association. Nature. 2005;437:1365–1369. doi: 10.1038/nature04244. [DOI] [PMC free article] [PubMed] [Google Scholar]
- 14.Chalancon G, Ravarani CN, Balaji S, Martinez-Arias A, Aravind L, Jothi R, Babu MM. Interplay between gene expression noise and regulatory network architecture. Trends Genet. 2012;28:221–232. doi: 10.1016/j.tig.2012.01.006. [DOI] [PMC free article] [PubMed] [Google Scholar]
- 15.Barrett T, Troup DB, Wilhite SE, Ledoux P, Evangelista C, Kim IF, Tomashevsky M, Marshall KA, Phillippy KH, Sherman PM, et al. NCBI GEO: archive for functional genomics data sets–10 years on. Nucleic Acids Res. 2011;39:D1005–D1010. doi: 10.1093/nar/gkq1184. [DOI] [PMC free article] [PubMed] [Google Scholar]
- 16.McCall MN, Bolstad BM, Irizarry RA. Frozen robust multiarray analysis (fRMA) Biostatistics. 2010;11:242–253. doi: 10.1093/biostatistics/kxp059. [DOI] [PMC free article] [PubMed] [Google Scholar]
- 17.McCall MN, Murakami PN, Lukk M, Huber W, Irizarry RA. Assessing affymetrix GeneChip microarray quality. BMC Bioinformatics. 2011;12:137. doi: 10.1186/1471-2105-12-137. [DOI] [PMC free article] [PubMed] [Google Scholar]
- 18.McCall MN, Uppal K, Jaffee HA, Zilliox MJ, Irizarry RA. The Gene expression barcode: leveraging public data repositories to begin cataloging the human and murine transcriptomes. Nucleic Acids Res. 2011;39:D1011–D1015. doi: 10.1093/nar/gkq1259. [DOI] [PMC free article] [PubMed] [Google Scholar]
- 19.Loader C. Local Regression and Likelihood. New York: Springer; 1999. [Google Scholar]
- 20.Gentleman RC, Carey VJ, Bates DM, Bolstad B, Dettling M, Dudoit S, Ellis B, Gautier L, Ge Y, Gentry J, et al. Bioconductor: open software development for computational biology and bioinformatics. Genome Biol. 2004;5:R80. doi: 10.1186/gb-2004-5-10-r80. [DOI] [PMC free article] [PubMed] [Google Scholar]
- 21.Matys V, Kel-Margoulis OV, Fricke E, Liebich I, Land S, Barre-Dirrie A, Reuter I, Chekmenev D, Krull M, Hornischer K, et al. TRANSFAC and its module TRANSCompel: transcriptional gene regulation in eukaryotes. Nucleic Acids Res. 2006;34:D108–D110. doi: 10.1093/nar/gkj143. [DOI] [PMC free article] [PubMed] [Google Scholar]
- 22.Levy S, Hannenhalli S. Identification of transcription factor binding sites in the human genome sequence. Mamm. Genome. 2002;13:510–514. doi: 10.1007/s00335-002-2175-6. [DOI] [PubMed] [Google Scholar]
- 23.Mahony S, Auron PE, Benos PV. DNA familial binding profiles made easy: comparison of various motif alignment and clustering strategies. PLoS Comput. Biol. 2007;3:e61. doi: 10.1371/journal.pcbi.0030061. [DOI] [PMC free article] [PubMed] [Google Scholar]
- 24.Di Domenico T, Walsh I, Martin AJ, Tosatto SC. MobiDB: a comprehensive database of intrinsic protein disorder annotations. Bioinformatics. 2012;28:2080–2081. doi: 10.1093/bioinformatics/bts327. [DOI] [PubMed] [Google Scholar]
- 25.Franceschini A, Szklarczyk D, Frankild S, Kuhn M, Simonovic M, Roth A, Lin J, Minguez P, Bork P, von Mering C, et al. STRING v9.1: protein-protein interaction networks, with increased coverage and integration. Nucleic Acids Res. 2013;41:D808–D815. doi: 10.1093/nar/gks1094. [DOI] [PMC free article] [PubMed] [Google Scholar]
- 26.Oshlack A, Wakefield MJ. Transcript length bias in RNA-seq data confounds systems biology. Biol. Direct. 2009;4:14. doi: 10.1186/1745-6150-4-14. [DOI] [PMC free article] [PubMed] [Google Scholar]
- 27.Carey LB, van Dijk D, Sloot PM, Kaandorp JA, Segal E. Promoter sequence determines the relationship between expression level and noise. PLoS Biol. 2013;11:e1001528. doi: 10.1371/journal.pbio.1001528. [DOI] [PMC free article] [PubMed] [Google Scholar]
- 28.Deaton AM, Bird A. CpG islands and the regulation of transcription. Genes Dev. 2011;25:1010–1022. doi: 10.1101/gad.2037511. [DOI] [PMC free article] [PubMed] [Google Scholar]
- 29.Lin WH, Liu WC, Hwang MJ. Topological and organizational properties of the products of house-keeping and tissue-specific genes in protein-protein interaction networks. BMC Syst. Biol. 2009;3:32. doi: 10.1186/1752-0509-3-32. [DOI] [PMC free article] [PubMed] [Google Scholar]
- 30.Lam KC, Muhlpfordt F, Vaquerizas JM, Raja SJ, Holz H, Luscombe NM, Manke T, Akhtar A. The NSL complex regulates housekeeping genes in Drosophila. PLoS Genet. 2012;8:e1002736. doi: 10.1371/journal.pgen.1002736. [DOI] [PMC free article] [PubMed] [Google Scholar]
- 31.Kittisopikul M, Suel GM. Biological role of noise encoded in a genetic network motif. Proc. Natl Acad. Sci. USA. 2010;107:13300–13305. doi: 10.1073/pnas.1003975107. [DOI] [PMC free article] [PubMed] [Google Scholar]
- 32.To TL, Maheshri N. Noise can induce bimodality in positive transcriptional feedback loops without bistability. Science. 2010;327:1142–1145. doi: 10.1126/science.1178962. [DOI] [PubMed] [Google Scholar]
- 33.Benevolenskaya EV. Histone H3K4 demethylases are essential in development and differentiation. Biochem. Cell Biol. 2007;85:435–443. doi: 10.1139/O07-057. [DOI] [PubMed] [Google Scholar]
- 34.Barski A, Cuddapah S, Cui K, Roh TY, Schones DE, Wang Z, Wei G, Chepelev I, Zhao K. High-resolution profiling of histone methylations in the human genome. Cell. 2007;129:823–837. doi: 10.1016/j.cell.2007.05.009. [DOI] [PubMed] [Google Scholar]
- 35.Edmunds JW, Mahadevan LC, Clayton AL. Dynamic histone H3 methylation during gene induction: HYPB/Setd2 mediates all H3K36 trimethylation. EMBO J. 2008;27:406–420. doi: 10.1038/sj.emboj.7601967. [DOI] [PMC free article] [PubMed] [Google Scholar]
- 36.Ernst J, Kellis M. ChromHMM: automating chromatin-state discovery and characterization. Nat. Methods. 2012;9:215–216. doi: 10.1038/nmeth.1906. [DOI] [PMC free article] [PubMed] [Google Scholar]
- 37.Uversky VN, Oldfield CJ, Midic U, Xie H, Xue B, Vucetic S, Iakoucheva LM, Obradovic Z, Dunker AK. Unfoldomics of human diseases: linking protein intrinsic disorder with diseases. BMC Genomics. 2009;10(Suppl. 1):S7. doi: 10.1186/1471-2164-10-S1-S7. [DOI] [PMC free article] [PubMed] [Google Scholar]
- 38.Dunker AK, Cortese MS, Romero P, Iakoucheva LM, Uversky VN. Flexible nets. The roles of intrinsic disorder in protein interaction networks. FEBS J. 2005;272:5129–5148. doi: 10.1111/j.1742-4658.2005.04948.x. [DOI] [PubMed] [Google Scholar]
- 39.Dunker AK, Silman I, Uversky VN, Sussman JL. Function and structure of inherently disordered proteins. Curr. Opin. Struct. Biol. 2008;18:756–764. doi: 10.1016/j.sbi.2008.10.002. [DOI] [PubMed] [Google Scholar]
- 40.Batada NN, Hurst LD. Evolution of chromosome organization driven by selection for reduced gene expression noise. Nat. Genet. 2007;39:945–949. doi: 10.1038/ng2071. [DOI] [PubMed] [Google Scholar]
- 41.Vavouri T, Semple JI, Garcia-Verdugo R, Lehner B. Intrinsic protein disorder and interaction promiscuity are widely associated with dosage sensitivity. Cell. 2009;138:198–208. doi: 10.1016/j.cell.2009.04.029. [DOI] [PubMed] [Google Scholar]
- 42.Mar JC, Matigian NA, Mackay-Sim A, Mellick GD, Sue CM, Silburn PA, McGrath JJ, Quackenbush J, Wells CA. Variance of gene expression identifies altered network constraints in neurological disease. PLoS Genet. 2011;7:e1002207. doi: 10.1371/journal.pgen.1002207. [DOI] [PMC free article] [PubMed] [Google Scholar]
- 43.Bravo HC, Pihur V, McCall M, Irizarry RA, Leek JT. Gene expression anti-profiles as a basis for accurate universal cancer signatures. BMC Bioinformatics. 2012;13:272. doi: 10.1186/1471-2105-13-272. [DOI] [PMC free article] [PubMed] [Google Scholar]
- 44.Pujadas E, Feinberg AP. Regulated noise in the epigenetic landscape of development and disease. Cell. 2012;148:1123–1131. doi: 10.1016/j.cell.2012.02.045. [DOI] [PMC free article] [PubMed] [Google Scholar]
- 45.Feinberg AP. Phenotypic plasticity and the epigenetics of human disease. Nature. 2007;447:433–440. doi: 10.1038/nature05919. [DOI] [PubMed] [Google Scholar]
- 46.Shalek AK, Satija R, Adiconis X, Gertner RS, Gaublomme JT, Raychowdhury R, Schwartz S, Yosef N, Malboeuf C, Lu D, et al. Single-cell transcriptomics reveals bimodality in expression and splicing in immune cells. Nature. 2013;498:236–240. doi: 10.1038/nature12172. [DOI] [PMC free article] [PubMed] [Google Scholar]
- 47.Battle A, Mostafavi S, Zhu X, Potash JB, Weissman MM, McCormick C, Haudenschild CD, Beckman KB, Shi J, Mei R, et al. Characterizing the genetic basis of transcriptome diversity through RNA-sequencing of 922 individuals. Genome Res. 2013 doi: 10.1101/gr.155192.113. Nov 27 (doi:10.1101/gr.155192.113; epub ahead of print) [DOI] [PMC free article] [PubMed] [Google Scholar]
- 48.Ansel J, Bottin H, Rodriguez-Beltran C, Damon C, Nagarajan M, Fehrmann S, Francois J, Yvert G. Cell-to-cell stochastic variation in gene expression is a complex genetic trait. PLoS Genet. 2008;4:e1000049. doi: 10.1371/journal.pgen.1000049. [DOI] [PMC free article] [PubMed] [Google Scholar]
- 49.Choi SS, Hannenhalli S. Three independent determinants of protein evolutionary rate. J. Mol. Evol. 2013;76:98–111. doi: 10.1007/s00239-013-9543-6. [DOI] [PubMed] [Google Scholar]
Associated Data
This section collects any data citations, data availability statements, or supplementary materials included in this article.