Abstract
In parallel to the genetic code for protein synthesis, a second layer of information is embedded in all RNA transcripts in the form of RNA structure. RNA structure influences practically every step in the gene expression program1. Yet the nature of most RNA structures or effects of sequence variation on structure are not known. Here we report the initial landscape and variation of RNA secondary structures (RSS) in a human family Trio, providing a comprehensive RSS map of human coding and noncoding RNAs. We identify unique RSS signatures that demarcate open reading frames, splicing junctions, and define authentic microRNA binding sites. Comparison of native deproteinized RNA isolated from cells versus refolded purified RNA suggests that the majority of the RSS information is encoded within RNA sequence. Over 1900 transcribed single nucleotide variants (~15% of all transcribed SNVs) alter local RNA structure. We discover simple sequence and spacing rules that determine the ability of point mutations to impact RSS. Selective depletion of RiboSNitches versus structurally synonymous variants at precise locations suggests selection for specific RNA shapes at thousands of sites, including 3’UTRs, binding sites of miRNAs and RNA binding proteins genome-wide. These results highlight the potentially broad contribution of RNA structure and its variation to gene regulation.
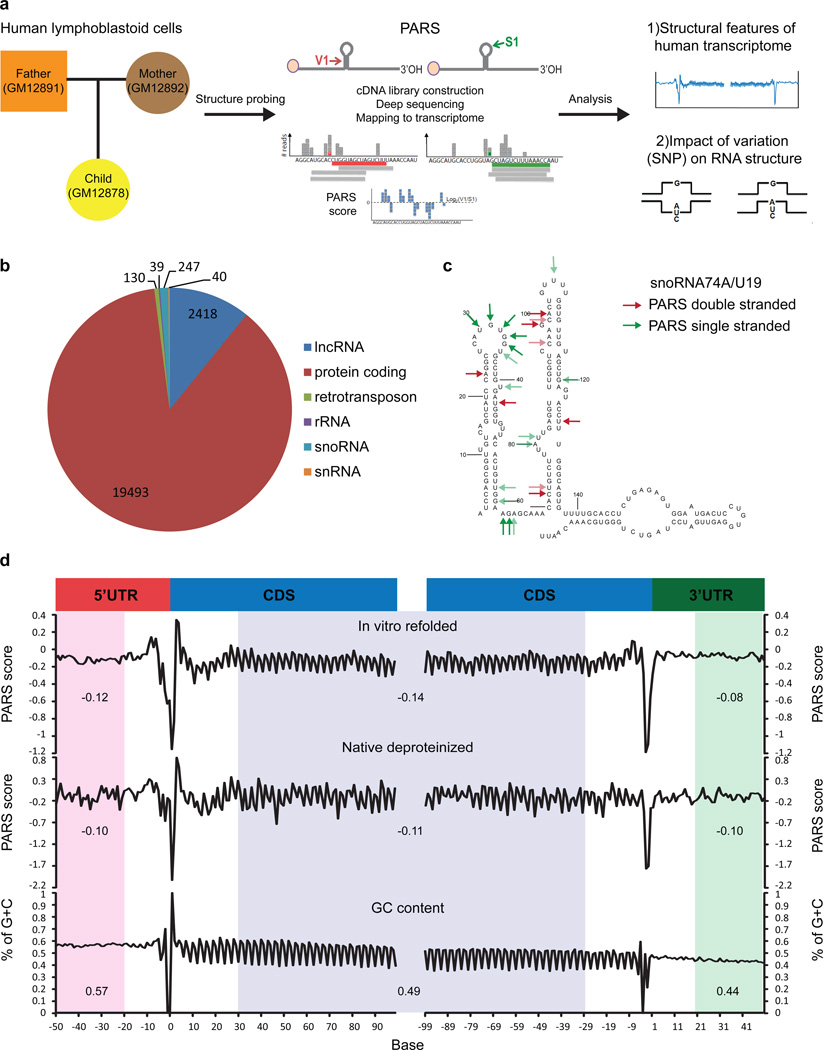
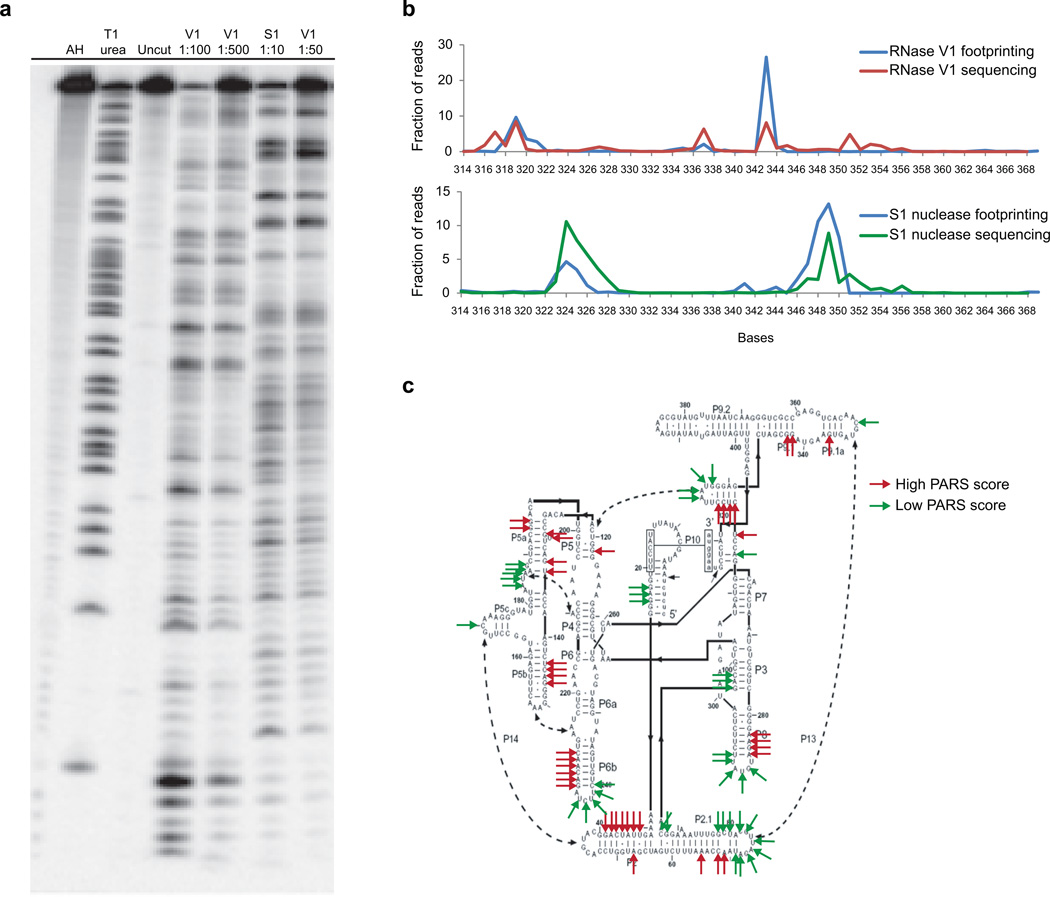
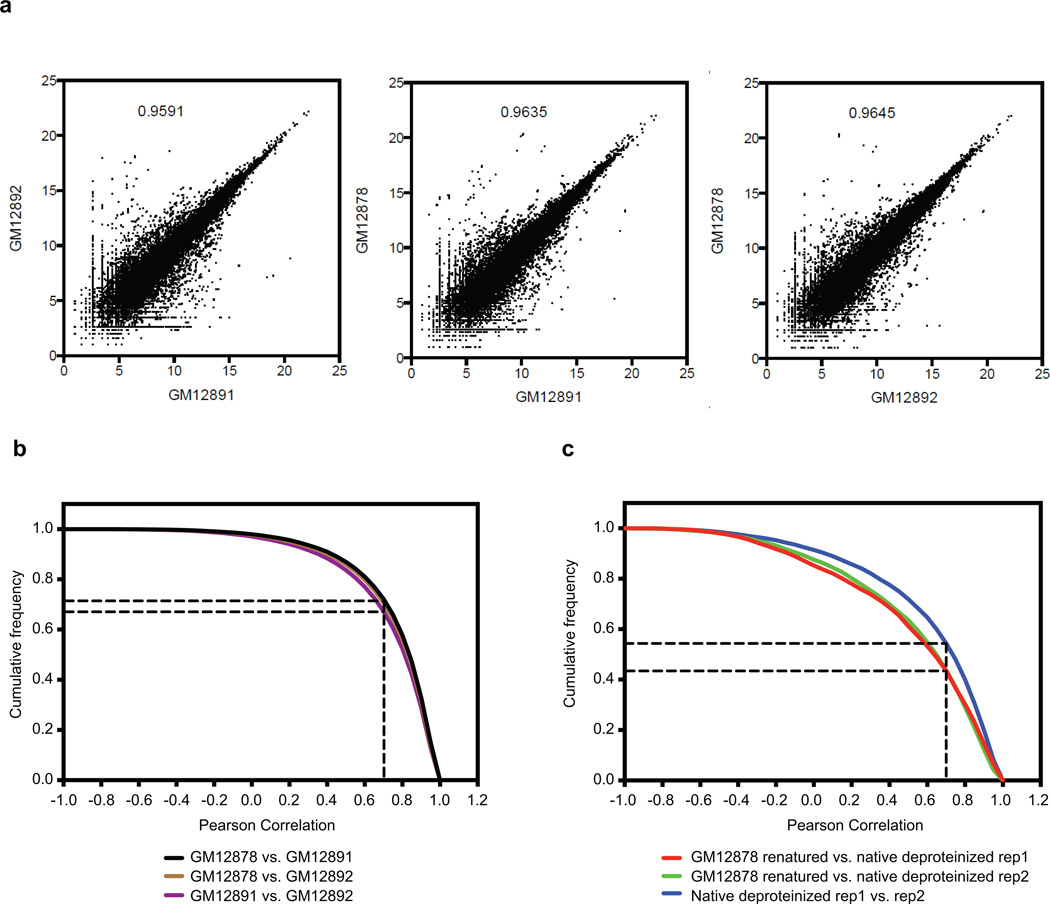
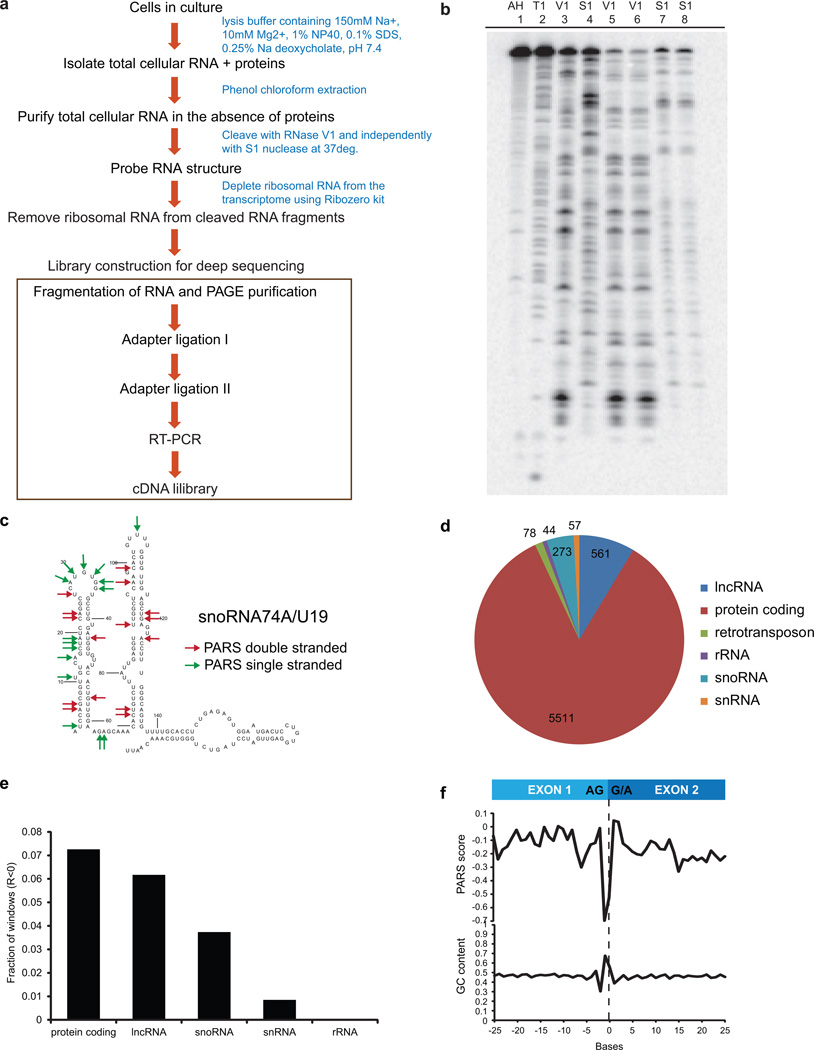
We performed Parallel Analysis of RNA Structure2 (PARS) on RNA isolated from lymphoblastoid cells of a family Trio (Figure 1a). Deep sequencing of RNA fragments generated by RNase V1 or S1 nuclease (Extended Data Fig. 1a) determined the double or single-stranded regions, respectively, across the human transcriptome. We obtained over 160 million mapped reads for each individual. Transcript abundance and structure profiles are highly correlated among the individuals (Extended Data Fig. 2a, b). Summation of PARS data from the Trio yielded structural information for >20,000 transcripts with at least one read per base (load>=1, Figure 1b), and accurately identified known RSS in RNAs (Figure 1c, Extended Data Fig. 1b,c). We also developed methods for RNA extraction, deproteinization, and PARS under native conditions (native deproteinized samples) that accurately captured structures with known RSS, and revealed RSS for 6,524 transcripts (Extended Data Fig. 3a–d).
Figure 1. PARS reveals the landscape of human RNA structure.
a, Experimental overview. b, Pie chart showing the distribution of structure-probed RNAs with a coverage of at least one read per base. c, High (red arrows) and low (green arrows) PARS scores were mapped onto the secondary structure of snoRNA74A. d, PARS score (Top: renatured transcripts; Middle: native deproteinized transcripts) and GC content (Bottom) across the 5’UTR, the coding region, and the 3’UTR, averaged across all transcripts, aligned by translational start and stop sites. (averaged regions are shaded in pink, blue and green for 5’UTR, CDS and 3’UTR respectively).
Extended Data Figure 1. PARS data accurately maps to known structures.
a, RNase V1 and S1 nucleases were titrated to single hit kinetics in structure probing. Gel analysis of structure probing of yeast RNA in the presence of 1μg of total human RNA using different dilutions of RNase V1 (lanes 4, 5), and S1 nuclease (lanes 6,7), cleaved at 37°C for 15min. Additionally, RNase T1 ladder (lane 2), alkaline hydrolysis (lane 1), and no nuclease treatment (lane3) are shown. Dilution of V1 nuclease by 1:500 and S1 nuclease by 1:50 results in mostly intact RNA. b, PARS signal obtained for the P9-9.2 domain of Tetrahymena ribozyme using the double strand enzyme RNase V1 (red line) or the single strand enzyme S1 nuclease (green line) accurately matches the signals obtained by tranditional footprinting (blue lines). c, Top 10 percentile of PARS score (double stranded, red arrows) and bottom 10 percentile of PARS score (single stranded, green arrows) were mapped to the secondary structure of the Tetrahymena ribozyme.
Extended Data Figure 2. PARS data is reproducible between biological replicates.
a, Scatter plot of mRNA abundance between the cell lines GM12878, GM12891 and GM12892 indicates that gene expression between the cells are highly correlated (R>0.9). b, Cumulative frequency distribution of the Pearson correlation of PARS scores in 20 nucleotide windows, with a coverage of at least 10 reads/base, in transcripts between the cells GM12878 vs GM12891, GM12878 vs GM12892 and GM12891 vs GM12892. The black dotted lines indicate the fraction of windows that are positively correlated. c, Cumulative frequency distribution of the Pearson correlation of PARS scores in 20 nucleotide windows, with a coverage of at least 10 reads/base, between GM12878 refolded transcripts vs GM12878 native deproteinized replicate1 transcripts, GM12878 refolded transcripts vs GM12878 native deproteinized replicate2 transcripts, as well as native deproteinized replicate1 transcripts vs native deproteinized replicate2 transcripts.
Extended Data Figure 3. PARS can be applied to native deproteinized RNAs.
a, Schematic of PARS on native deproteinized transcripts. b, Gel analysis of structure probing of yeast RNA using RNase V1 in RNA structure buffer (lane 3), RNase V1 in lysis buffer containing 1% NP40, 0.1% SDS and 0.25% Na deoxycholate (lanes 5 and 6), S1 nuclease in RNA structure buffer (lane 4) and S1 nuclease in lysis buffer (Lanes 7 and 8). Additionally, RNase T1 ladder (lane 2) and alkaline hydrolysis (lane 1) are shown. The enzymes appear to cleave similarly in lysis buffer and in structure buffer. c, Structure probing of native deproteinized snoRNA74A. Top 10 percentile of PARS scores (high, red arrows) and bottom 10 percentile of PARS score (low, green arrows) were mapped onto the secondary structure model of snoRNA74A. d, Deep sequencing and mapping of PARS reads on native deproteinized transcripts provided structural information for thousands of transcripts, including coding and non-coding RNAs. e, We compared Pearson correlations of 20 nucleotide windows with a coverage of at least 100 reads (coverage >=5) between transcripts that were refolded and native deproteinized. The y-axis indicates the fraction of negatively correlated windows (R<0) over the total number of windows for each RNA class. f, PARS score across exon exon junctions, averaged across all native deproteinized transcripts (load>=1). Percentage of nucleotide C plus G was averaged across the transcripts.
PARS data for thousands of transcripts afforded the first genome-wide view of the structural landscape of human messenger RNAs (mRNAs). Metagene analysis show that, on average, the coding region (CDS) is demarcated by focally accessible regions near the translational start site and stop codon. Contrary to yeast, human CDS is slightly more single stranded than the UTRs (Figure 1d), similar to previous trends in other metazoans3. A three nucleotide structure periodicity is present in the CDS and absent in UTRs, consistent with prior computational prediction4. Both renatured and native mRNAs showed similar RSS features, suggesting that RNA sequence is a strong determinant of RSS. However, RNA structures also deviate from sequence content. In particular, human 3’UTR has low GC content but is highly structured (Figure 1d). We also identified 583 (5.7%) consistently different regions between native deproteinized and renatured structure profiles, providing candidate sites for regulation of RNA structure in vivo (Supp. Table 1). Highly structured RNAs have fewer structure differences as compared to mRNAs (Extended Data Fig. 3e), suggesting stronger evolutionary selection for functional conformations. 3.7% of bases, residing in 9.7% of transcripts, have both strong V1 and S1 reads, indicating the existence of multiple mRNA conformations.
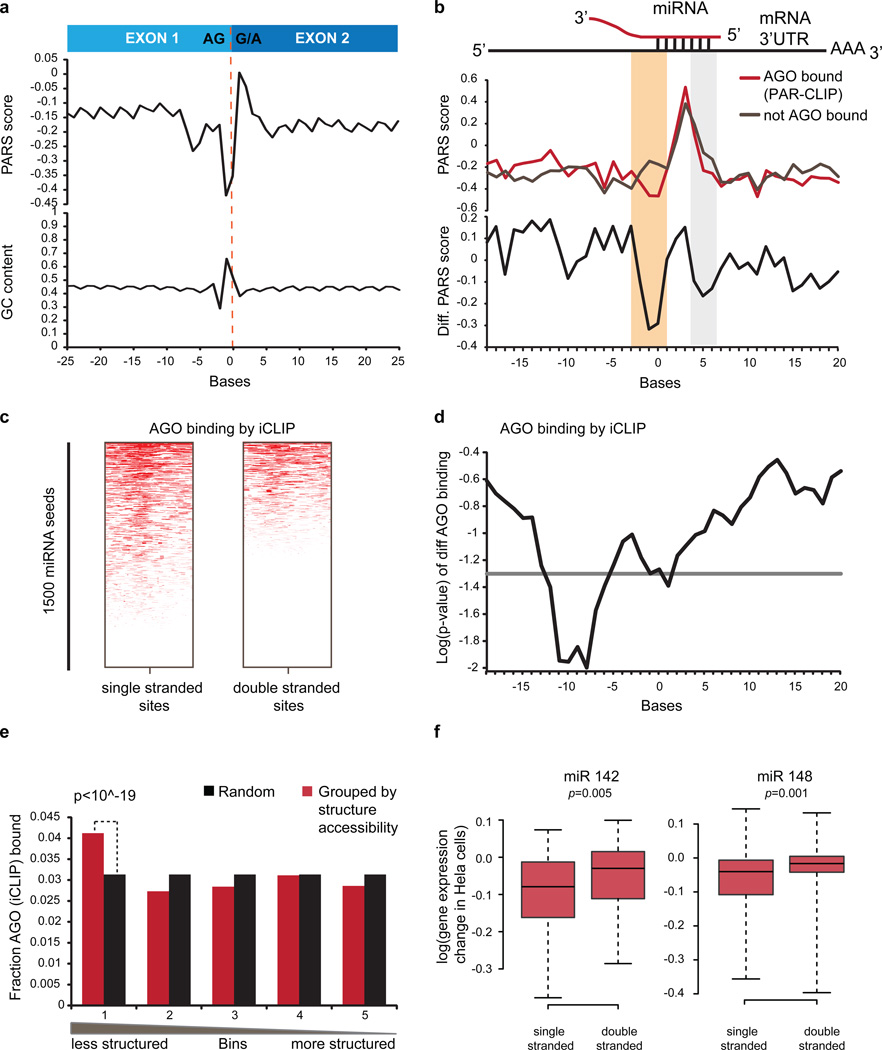
We detected unique signatures of RSS at sites of post-transcriptional regulation. RNA structure is believed to be important in regulating distinct splicing signals on exons and introns of pre-messenger RNAs5. We observed a unique asymmetric RSS signature at the exon-exon junction in both renatured and native deproteinized transcripts that is not simply explained by GC content. The terminal AG dinucleotide at the end of the 5’ exon tends to be more accessible, whereas the first nucleotides of the 3’ exon are more structured (Figure 2a, Extended Data Fig. 3f). Hence, a specific RSS signature may contribute to RNA splicing.
Figure 2. RSS signatures of post-transcriptional regulation.
a, Average PARS score and GC content across transcript exon-exon junctions. b, Average PARS score (Top) and PARS score difference (Bottom) across miRNA sites for AGO-bound (red) vs. non-AGO-bound sites (grey). Structurally different regions are in beige and light grey. c, AGO-iCLIP binding for single vs. double-stranded miRNA target sites. d, P-value for differential AGO-iCLIP binding (t-test, p=0.05 in grey). e, Observed vs. expected AGO binding (p-value, chi-square test). f, Expression changes of mRNAs with accessible and inaccessible miR142 (left) or miR148 (right) sites, upon miRNA over-expression (Wilcoxon Rank sum test).
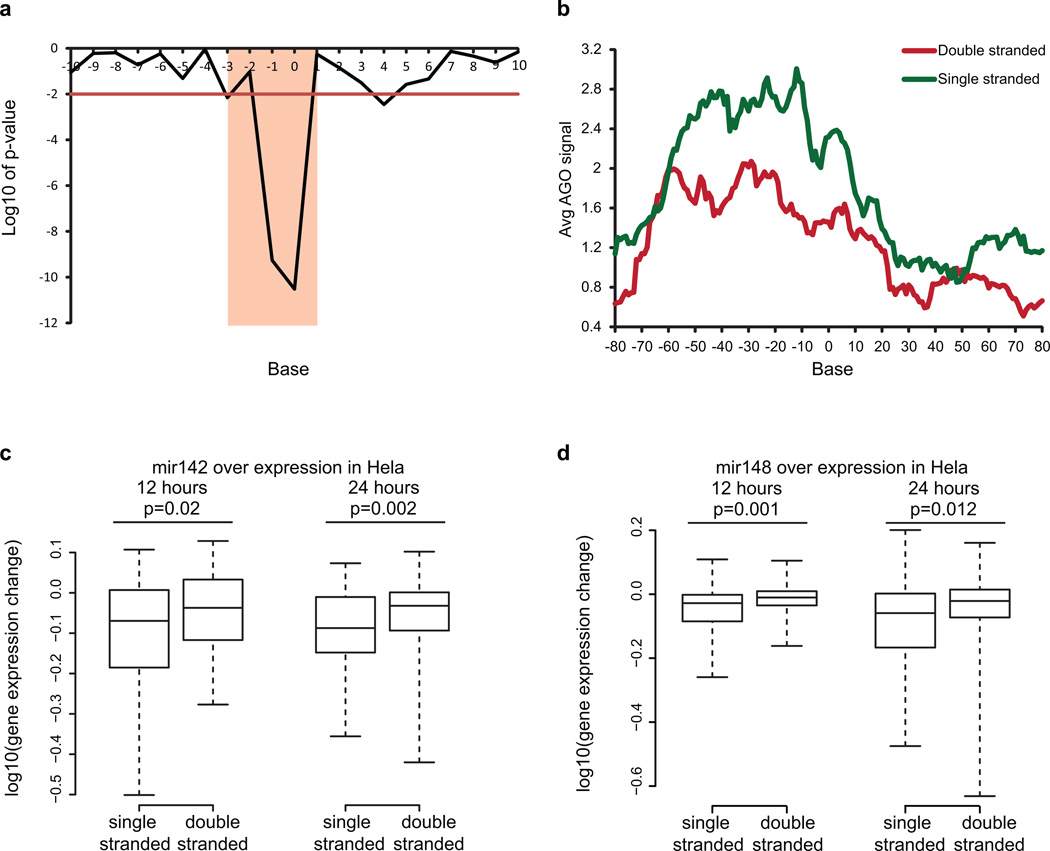
Regulation of mRNAs by miRNAs is an important post-transcriptional process that causes translation repression and/or mRNA degradation6. However the extent to which structural accessibility drives productive miRNA targeting is still unclear. Analysis of RSS from renatured RNA around predicted miRNA targets revealed that true Argonaute (AGO)-bound target sites7 show strong structural accessibility from −1 to 3nt upstream of the miRNA-target site compared to predicted targets not bound by AGO (p<10−10, Wilcoxon Ranked Sum Test, Figure 2b beige window, Extended Data Fig. 4a). Ago-bound sites are also more accessible at bases 4–6 of the miRNA-target site (p=0.004, Wilcoxon Rank Sum Test), agreeing with prior computational predictions8. To test if our identified 5’ accessibility neighborhood (−1 to 3nt) is truly important for AGO binding, we performed AGO individual nucleotide-resolution Crosslinking and Immuno-Precipitation (iCLIP) on each member of the Trio. Separating the predicted target sites according to average 5’ structural accessibility showed that single stranded targets are more likely to be Ago-bound than double stranded targets (Figure 2c, Extended Data Fig. 4b). The most significant difference in AGO binding occurs close to our identified accessible region (p=0.01, Figure 2d). Separating predicted targets into five accessibility quantiles also demonstrated that the most accessible 20% of predicted targets are most AGO bound (p<10−19, Figure 2e). Furthermore, ectopic expression of miR142 or miR148 in HeLa cells9 resulted in greater repression of mRNAs with 100 most accessible sites as compared to mRNAs with 100 least accessible sites (p<0.005, Wilcoxon Rank Sum Test, Figure 2f, Extended Data Fig. 4c,d). This indicates that mRNAs with accessible miRNA sites are more likely true targets, and upstream accessibility is important for miRNA targeting.
Extended Data Figure 4. Increased accessibility 5’ of miRNA target site influences AGO binding.
a, Bases that show significantly different PARS score between AGO bound and non-bound sites in PAR-CLIP. Base 0 is the most 5’ position of the mRNA that is directly base-pairing with miRNA seed region. Y axis indicates log10 of p-value, calculated by Wilcoxon Rank Sum Test. b, Metagene analysis of the average AGO bound reads using iCLIP in predicted miRNA target sites that are single stranded (green) or double stranded (red) from bases −3 to 1. c,d, Average PARS score is calculated for bases −3 to 1 for each targetscan predicted site. Change in gene expression is plotted for genes with most accessible (100) and least accessible (100) sites, upon over expression of miRNA 142 (c) and miRNA 148 (d). P-value is calculatedusing Wilcoxon Rank Sum Test.
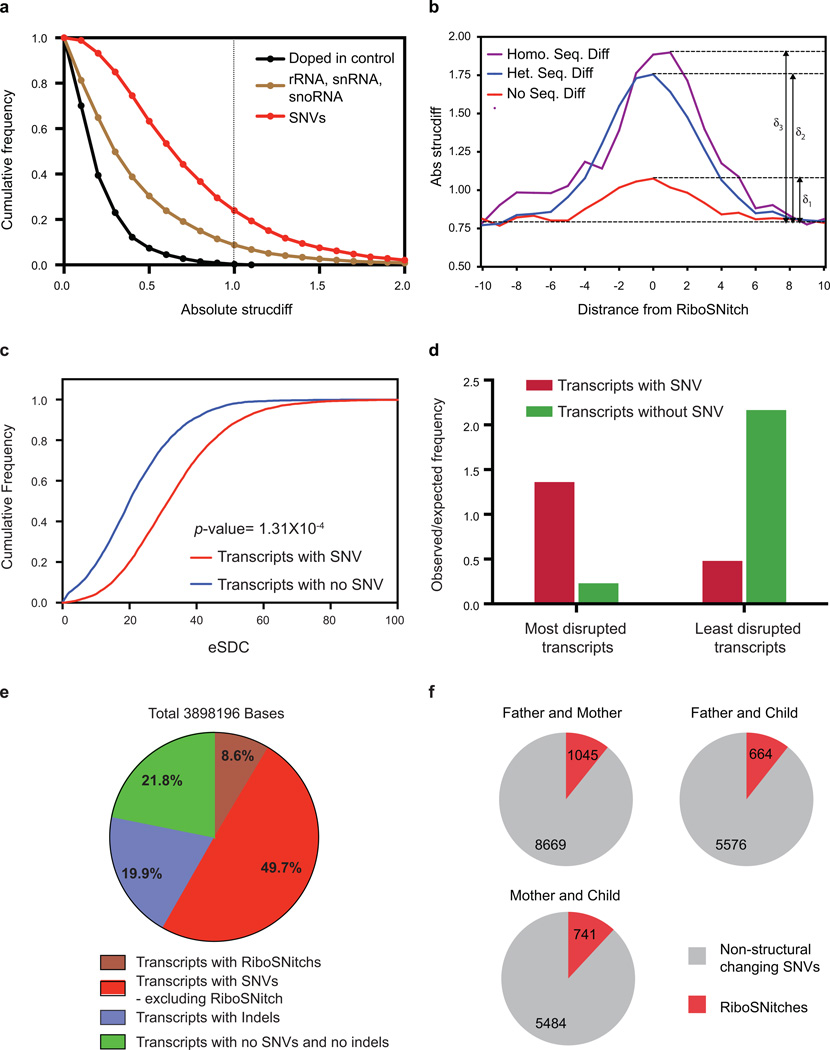
Comparison of RNA structural landscapes between individuals revealed the impact of diverse sequence variants on RNA structure. As a class, local PARS score differences at SNVs were significantly greater than biological replicates of an invariant doped in RNA (p<0.001 Kolmogorov-Smirnov Test, Extended Data Fig. 5a). RiboSNitches also exhibit three fold greater local structure change than replicates of the same sequence in different individuals (Extended Data Fig. 5b). At a gene level, transcripts with SNVs are significantly more disrupted, calculated using the experimental Structure Disruption Coefficient (eSDC)10, than transcripts without SNVs (p=1.3×10⁻⁴, Kolmogorov-Smirnov Test, Extended Data Fig. 5c,d). Furthermore, 78.2% of all structure changing bases lie in transcripts that contain either SNVs or indels, suggesting that sequence variation is important in shaping RSS variation in the human transcriptome (Extended Data Fig. 5e). The list of top 2,000 disrupted transcripts is shown in Supplementary Table 2.
Extended Data Figure 5. PARS identified RiboSNitches in the human transcriptome.
a, Cumulative frequency plot of PARS score differences between SNVs (GM12891 vs. GM12892), doped in controls and structured RNAs including rRNAs, snRNAs and snoRNAs. Dotted black line indicated the threshold beyond which we call a SNV a RiboSNitch. X-axis indicates the absolute change in PARS score between GM12891 and GM12892. b, Absolute change in PARS score around heterozygous, homozygous RiboSNitches and biological noise. The red line indicates the change in PARS score between sequences that are the same (noise) across individuals. The blue line indicates the change in PARS score between 2 sequences that have a RiboSNitch. The purple line indicates the change in PARS score between homozygous RiboSNitches. c, Cumulative frequency plot of the experimental Structure Disruption Coefficient (eSDC) for transcripts that contain or do not contain SNVs eSDC = (1-Pearson correlation)* sqrt(transcript length). d, Transcripts are ranked according to eSDC score and classified into the top 2000 most and least structurally disrupted transcripts. The most structurally disrupted transcripts are more likely to contain SNVs while the least structurally disrupted transcripts are less likely to contain SNVs. e, Pie chart showing the distribution of structurally changing bases (p=0.05, FDR=0.1) in transcripts with SNVs, RiboSNitches, indels and no SNVs and no indels. 78.2% of these bases reside in transcripts with either SNVs or indels, indicating that nucleotide sequence is important for RNA structure. f, No. of RiboSNitches identified by PARS between each pair of individuals in the Trio. Grey indicates non-structurally changing SNVs, red indicates RiboSNitches.
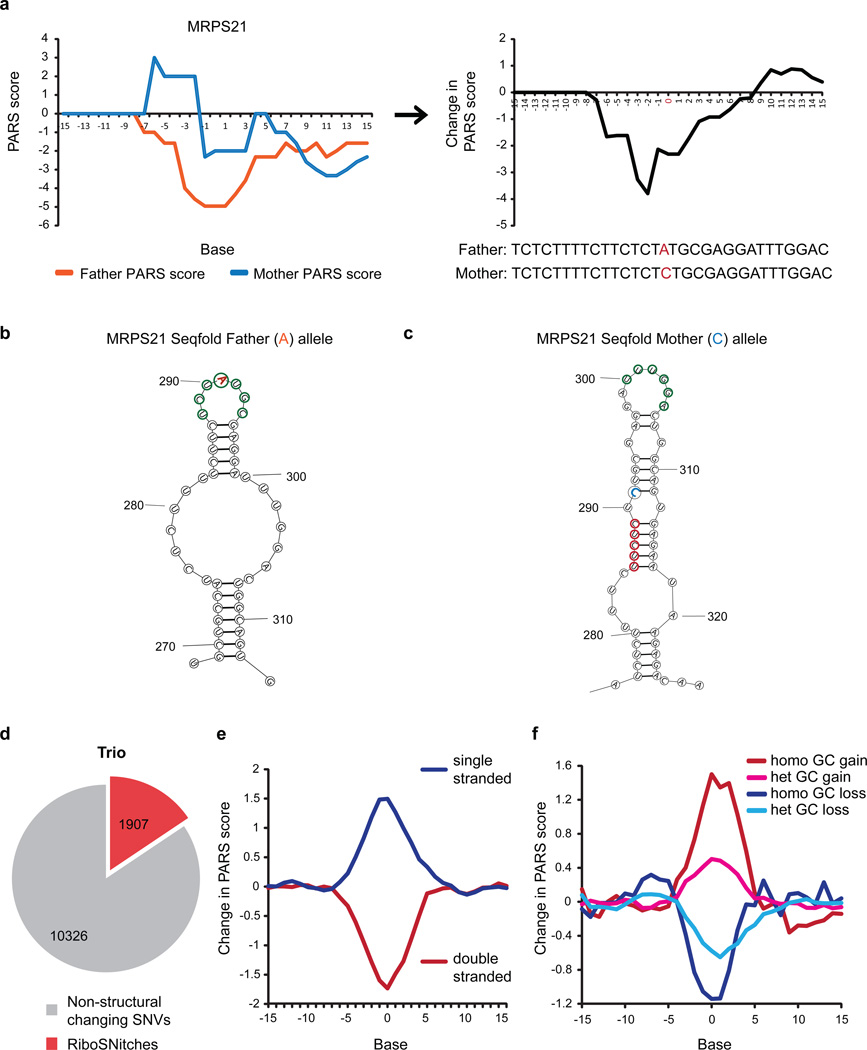
To pinpoint SNVs that alter RNA structure, termed “RiboSNitches”11, we calculated structure changes between each pair of individuals (Figure 3a) and selected SNVs that had (i) large PARS score differences; (ii) low FDR; (iii) significant p-value; and (iv) high local read coverage (Methods). Permutation analysis across genotypes and along transcripts confirmed that RiboSNitches are significantly detected over random noise (Methods). We experimentally validated 9 RiboSNitches using independent structure probing methods such as nucleases, SHAPE or DMS, and confirmed the ability of PARS to discover RiboSNitches (Extended Data Fig. 6–9). The Seqfold program is used to visualize structure changes caused by RiboSNitches12 (Figure 3b,c, Extended Data Fig. 7g,h).
Figure 3. PARS identifies RiboSNitches genome-wide.
a, PARS score (Left) and PARS score difference (Right) of MRPS21 father and mother alleles. b,c, Seqfold models of MRPS21 A and C alleles (Single and double stranded bases circled in green and red respectively). d, Number of SNVs identified as RiboSNitches in the Trio. e,f, Average PARS score changes of RiboSNitches that (e) originally reside in double stranded (red) or single stranded regions (blue); or (f) undergo nucleotide changes from A/T to G/C (red, pink) or from G/C to A/T (dark and light blue). 0 indicates the position of SNV on the X-axis.
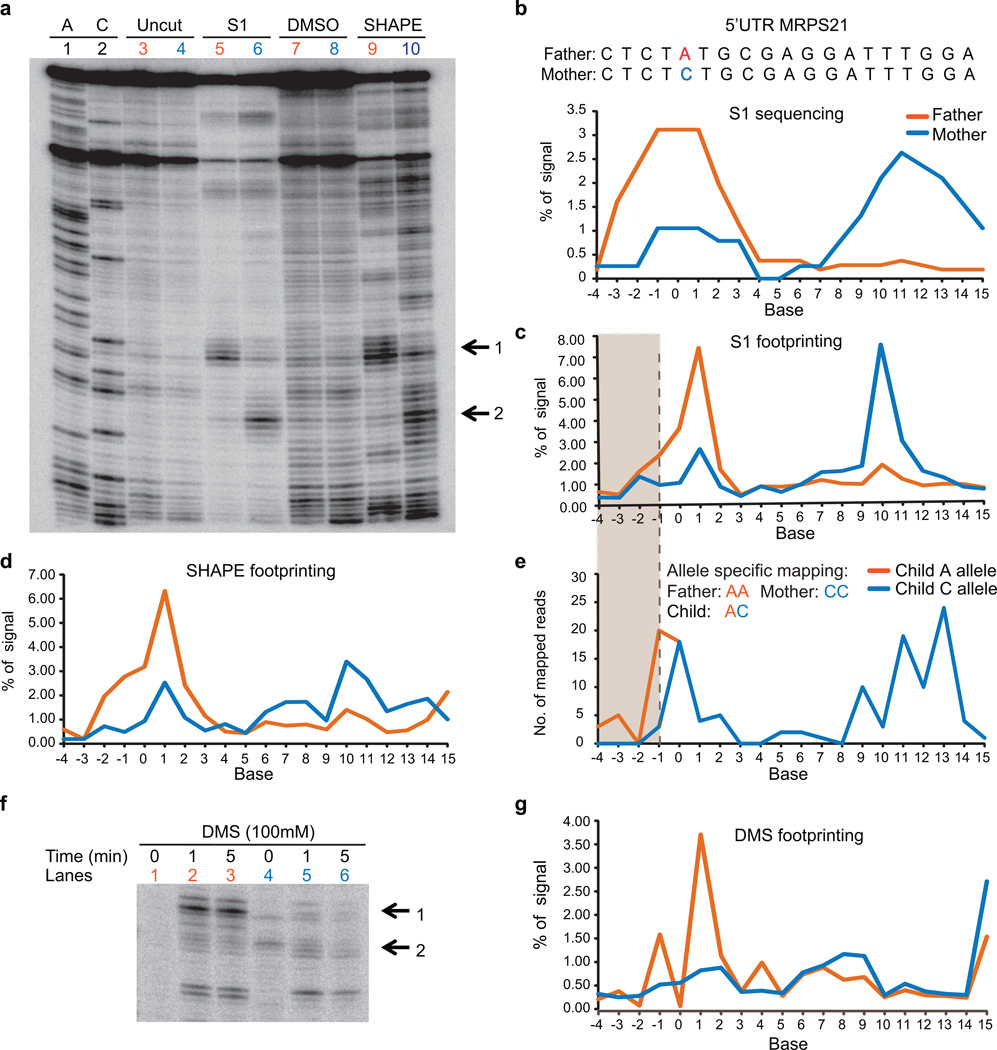
Extended Data Figure 6. Footprinting validation of a RiboSNitch in 5’UTR of MRPS21 identified by PARS.
a, Gel analysis of 150mer fragments of MRPS21 RNA using S1 nuclease (lanes 5 (Father), 6 (Mother)), and SHAPE probing ((lanes 9 (Father), 10 (Mother)). Additionally, sequencing lanes (lanes 1,2), uncut (lane 3 (Father), lane 4 (Mother), and DMSO treated lanes (lane 7 (Father), lane 8, (Mother)) are also shown. Black arrows indicate the change in structure between the Father and Mother alleles. b, Top: The sequence of a portion of the transcript containing the RiboSNitch was shown. The RiboSNitch is in red. Bottom: Single strand profile by S1 sequencing of the father and mother allele. Y axis indicates the percentage of signal at each base over the total signal in the region. c,d, SAFA quantification of manual structure probing of both MRPS21 alleles using S1 nuclease (c) and SHAPE (d). e, S1 sequencing reads are mapped uniquely to either the A or C allele in the child. The grey box indicates the bases that show structural differences by allele speficic mapping in the child. f, Gel analysis of 150mer fragments of MRPS21 RNA using DMS footprinting (lanes 1,2 and 3 (Father), 4, 5 and 6 (Mother)). Black arrows indicate the change in structure between Father and Mother alleles. g, Quantification of DMS footprinting of both MRPS21 alleles using SAFA.
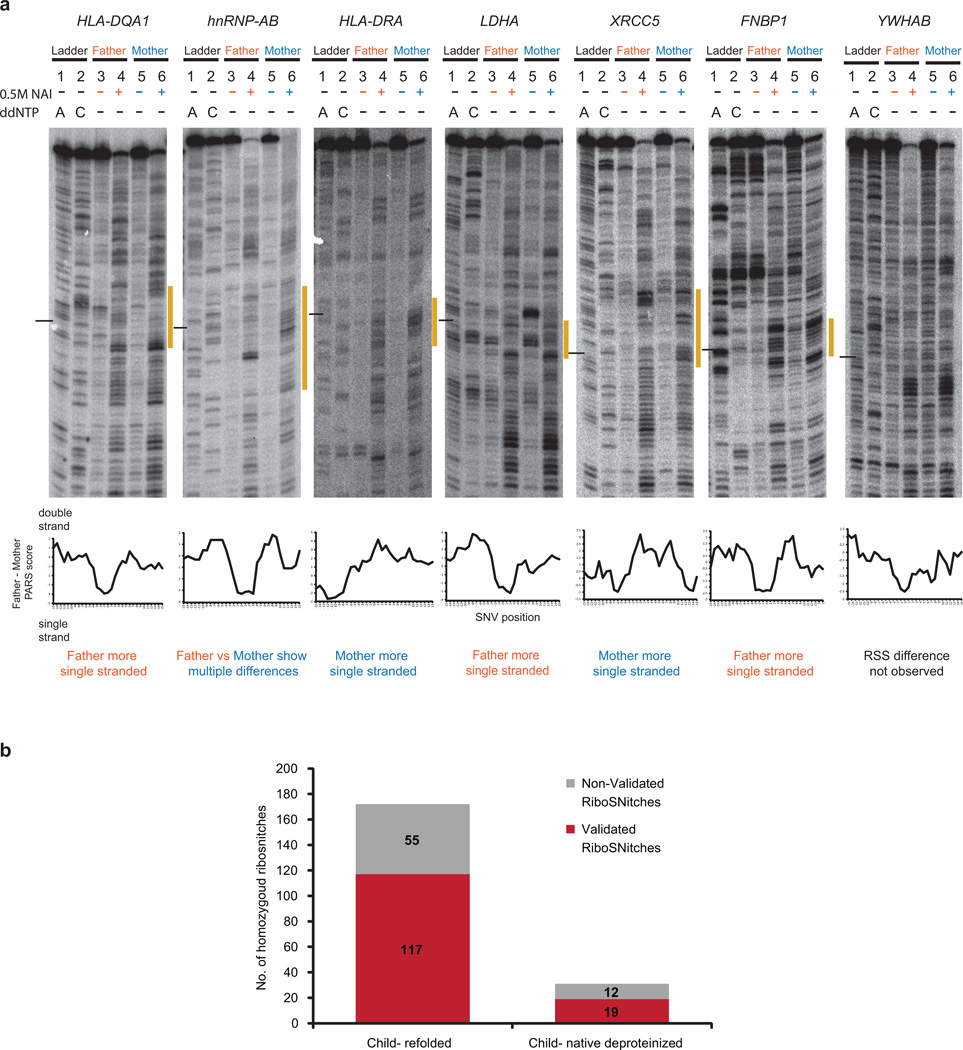
Extended Data Figure 9. Additional footprinting validation of RiboSNitches.
a, Top: Gel analysis of fragments of Father and Mother alleles of HLA-DQA1, hnRNP-AB, HLA-DRA, LDHA, XRCC5, FNBP1, and YWHAB using SHAPE (lanes 4 (Father), 6 (Mother)). Additionally, DMSO controls (lanes 3 (Father),5 (Mother)) and ladder lanes (lanes 1 (T ladder), 2 (G ladder)) are also shown. The black line indicates the position of the SNV. The yellow bar along the side of the gel indicates the region that is changing between the father and mother alleles. Bottom: Difference in PARS signal between Father (GM12891) and Mother (GM12892), centred at the RiboSNitch. Positive PARS score indicates double stranded RNA, and should correspond to lower SHAPE signal. Negaitive PARS score indicates unpaired RNA with correspondingly higher SHAPE signal. 6 out of 7 cloned RNAs are validated by SHAPE in vitro. hnRNP-AB showed mulitple differences surrounding the SNV; SHAPE data confirmed the RiboSNitch and showed the structural rearrangement is more complex than indicated by PARS. SHAPE data of YWHAB did not show the predicted RSS difference. b, Bar graphs showing the number of homozygous SNVs in parents that are validated (in red) and not validated (grey) in the child by allele specific mapping. Homozygous RibiSNitches between the father and mother are mapped to both the renatured child RNA (in vitro-child) and the native deproteinized child RNA (native deproteinized-child). As the depth of coverage is lower in native deproteinized samples, we detect fewer (31) SNVs that were homozygously different in the parents.
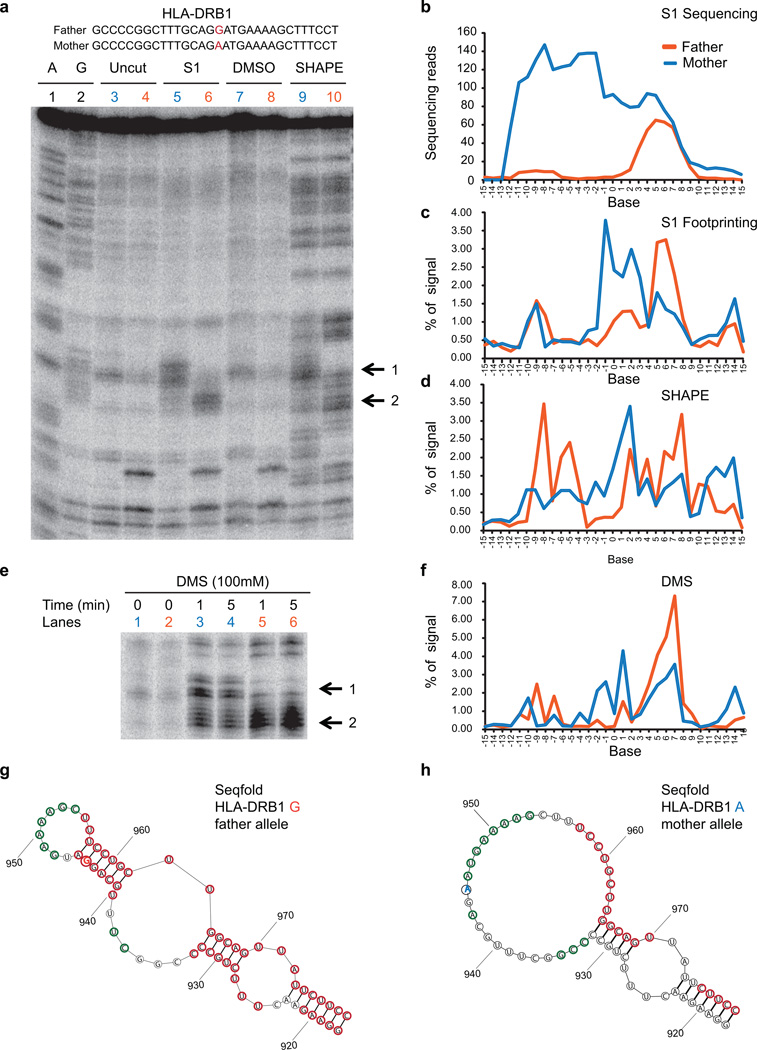
Extended Data Figure 7. Footprinting validation of a RiboSNitch in HLA-DRB1 transcript identified by PARS.
a, The sequence of a portion of the transcript containing the RiboSNitch was shown. The RiboSNitch is in red. Gel analysis of 2 fragments of HLA-DRB1 RNA A and G alleles using S1 nuclease (lanes 5 (Mother), 6 (Father)), and SHAPE probing ((lanes 9 (Mother), 10 (Father)). Additionally, sequencing lanes (lanes 1,2), uncut lanes (lane 3 (Mother), lane 4 (Father)), and DMSO treated lanes (lane 7 (Mother), lane 8, (Father)) are also shown. Black arrows indicate the change in structure between the Father and Mother alleles. b, S1 sequencing reads across the RiboSNitch for both Father and Mother. c,d, SAFA quantification of the RNA footprinting of both alleles using S1 nuclease (c) and SHAPE (d). e, Gel analysis of 2 fragments of HLA-DRB1 RNA A and G alleles using DMS (lanes 1,3 and 4 (Mother), 2, 5 and 6 (Father)). Black arrows indicate the change in structure between Father and Mother alleles. f, Quantification of DMS footprinting of both HLA-DRB1 alleles using SAFA. g,h, Secondary structure models of the G alelle (g) and A allele (h) of HLA-DRB1, using Seqfold guided by PARS data. The 2 alleles of the ribosnitch is shown in orange and blue respectively. The red and green circles indicate bases with PARS scores >=1 and <= −1 respectively.
We found 1,907 out of 12,233 (15%) SNVs that switched RNA structure in the Trio (Figure 3d, Extended Data Fig. 5e, Supp. Table 3). As RiboSNitches are expected to cause RSS changes in a heritable and allele-specific fashion, we performed allele-specific PARS in the child line by mapping uniquely across each of the 2 alleles for SNVs that are homozygous different in the parents (Methods, Extended Data Fig. 6e). 117 of 172 (68%) parental homozygous RiboSNitches were validated by allele-specific mapping in the child. As only reads upstream of the RiboSNitch can be uniquely mapped and detected, this is likely to be an under-estimate. We also observed a validation rate of 61% in native deproteinized samples of the child, indicating that the structural changes are biologically relevant in vivo (Extended Data Fig. 9b).
The large numbers of RiboSNitches identified raised the possibility that RiboSNitches may have greater influence on gene regulation and human diseases than previously appreciated. Intersection with expression quantitative trait loci (eQTL) identified 211 RiboSNitches that are associated with changes in gene expression (Supp. Table 4). Overlapping RiboSNitches with the NHGRI Genome-Wide Association Study catalog identified 22 unique RiboSNitches that are associated with diverse human diseases and phenotypes, including multiple sclerosis, asthma and Parkinson’s disease (Supp. Table 5). Hence, many non-coding changes in the transcriptome may alter gene function by altering RNA structure.
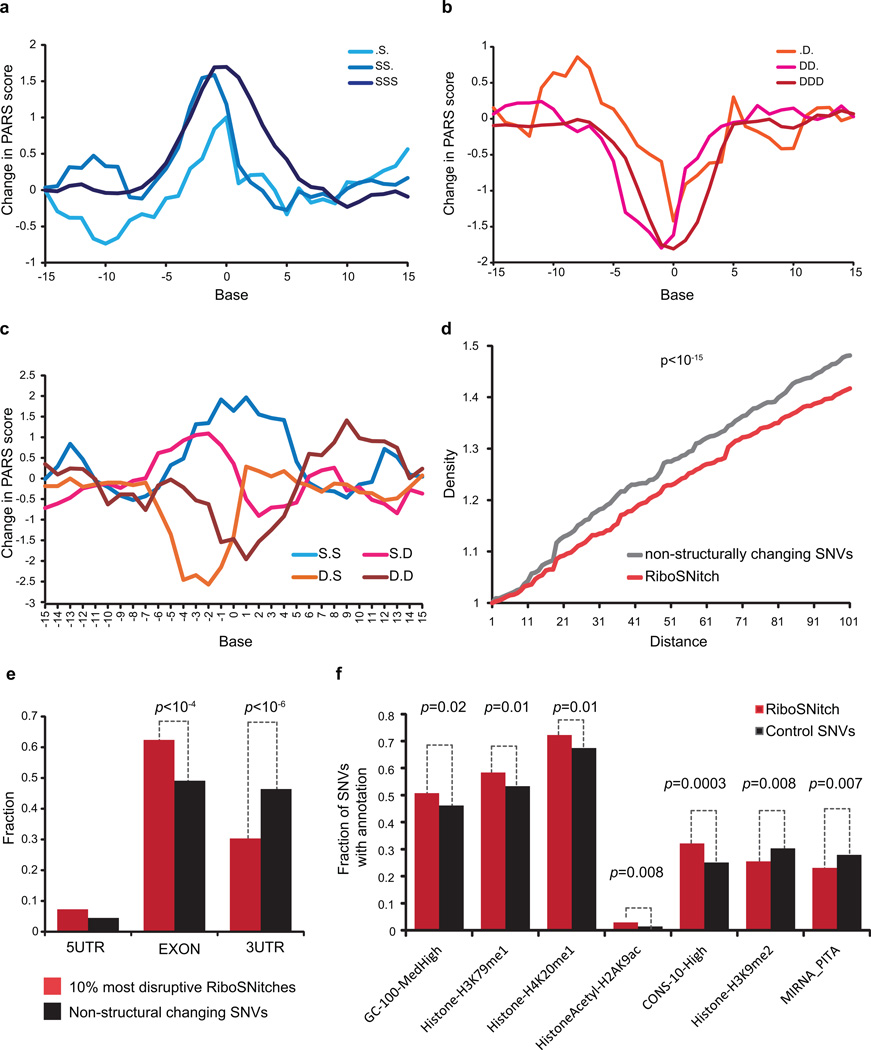
We also observed sequence and context rules in RiboSNitches. First, RiboSNitches that lie in double or single-stranded regions tend to become more single or double-stranded respectively upon nucleotide change (Figure 3e). Second, the nucleotide content of the RiboSNitch is instructive of the direction of RSS change. Bases that undergo G/C to A/T changes tend to become more single-stranded while bases that change from A/T to G/C tend to become more paired (Figure 3f). This effect is stronger for homozygous RiboSNitches than heterozygous RiboSNitches, and typically disrupts 10 bases centered on the mutation. Third, the structural context flanking SNVs influence their transition to become more single or double stranded (Extended Data Fig. 10a–c). Fourth, RiboSNitches have fewer SNVs around them as compared to non-structure changing SNVs, suggesting that co-variation of some SNVs may help to maintain functional RNA structures (Extended Data Fig. 10d).
Extended Data Figure 10. Properties of Ribosnitches.
a,b, Average PARS score difference around SNVs that originally reside in increasingly single stranded (a) or increasingly double stranded (b) region. c, Average PARS score difference around SNVs that were flanked by both double stranded bases, both single stranded bases, or one single and one double stranded base on each side. d, Density of other SNVs centered around RiboSNitches versus a control group of 2450 non-structure changing SNVs. P-value calculated by Kolmogorov-Smirnov Test. e, Distribution of top 10% most structurally disruptive RiboSNitches, calculated by biggest structural difference between the 2 alleles, versus a control group of 1855 SNVs that do not change structure in 5’UTRs, CDS and 3’UTRs. f, Different genomic features or annotations of 993 unique RiboSNitches are compared to 1009 control SNVs. For each genomic annotation, the fraction of RiboSNitches that reside in the genomic region covered by the annotation (e.g., histone mark) was compared to the fraction of control SNVs by Student’s t-test. A cutoff value of p=0.05 (T-test) was used.
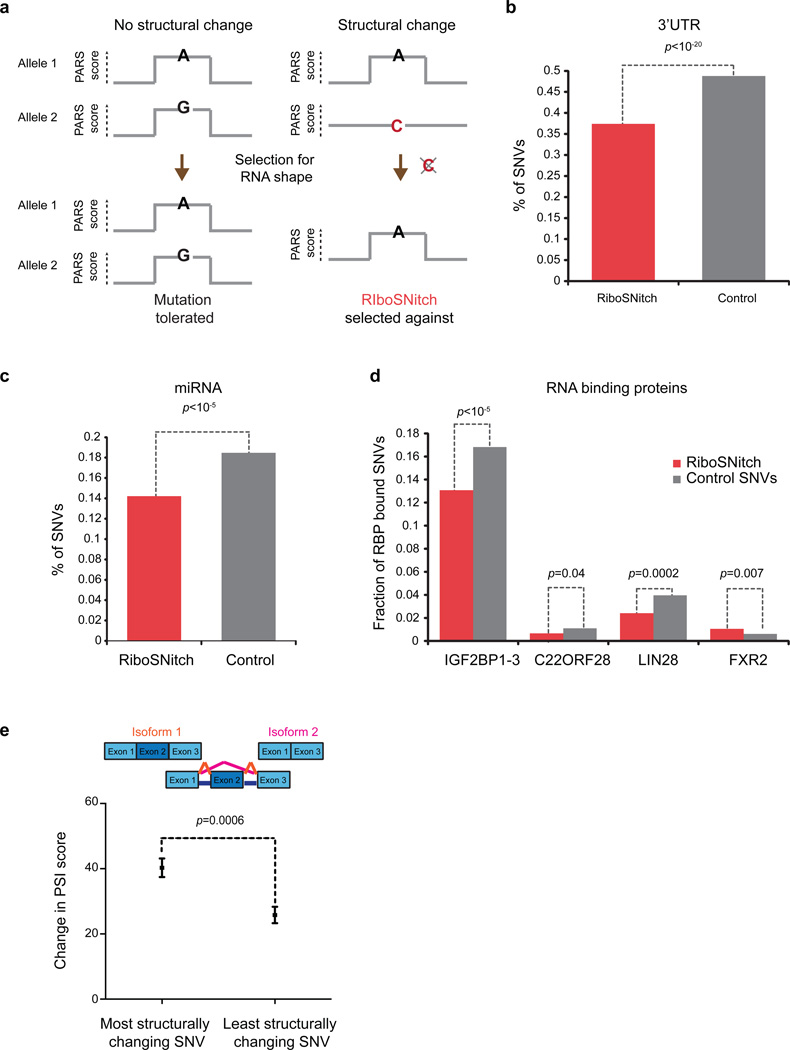
The distribution of extant RiboSNitches provides insights into regions of the transcriptome that require specific RNA shape. If a RSS is functionally important, a RiboSNitch that disrupts the structure will be evolutionarily selected against, while a non-structure changing SNV will not (Figure 4a)13. We tested whether such selection occurs in the human transcriptome, and found that RiboSNitches are significantly depleted at 3’UTRs as compared to control SNVs (p<10−20, chi-square test, Figure 4b). This depletion is even stronger for larger disruptions which would be expected to be less tolerated (Extended Data Fig. 10e). Additional genomic features associated with RiboSNitches are also found (Extended Data Fig. 10f, Supp. Table 6). RiboSNitches are also significantly depleted around predicted miRNA target sites (p<10−5, chi-square test, Figure 4c) and RBP binding sites (p=0.004, chi-square test). However, depletion of RiboSNitches varies for each individual RBP (Figure 4d), suggesting that different RBPs may have different RSS requirements for binding. RiboSNitches may also influence gene regulation through splicing. Indeed, RiboSnitches near splice junctions are associated with greater alternative splicing changes (defined as Percentage of Spliced In (PSI)14, 15, Figure 4e), suggesting that RNA structures could regulate splicing.
Figure 4. Genetic evidence for functional RSS elements in the transcriptome.
a, Schematic of RSS selection test: Mutations that do not change the shape of an important RNA structure may be tolerated and accumulates (left), but a RiboSNitch that changes RNA shape will be evolutionarily selected against and removed. b–d, Selective depletion of RiboSNiches vs. structurally synonymous SNVs at b, 3’UTRs; c, predicted miRNA target sites; d, specific RBP binding sites. P-value is calculated using chi-square test. e, RiboSNitches impact splicing. PSI score is calculated to be the ratio of alternatively spliced isoform vs. total isoforms (Methods, p=0.0006, Student’s t-test).
In summary, the landscape and variation of RSS across human transcriptomes suggest important roles of RNA structure in many aspects of gene regulation. We provide the experimental and analytical frameworks to evaluate SNVs that change RSS, and demonstrate potentially much broader roles for RiboSNitches in multiple steps of post-transcriptional regulation. In the future, use of high resolution, in vivo probes of RSS16 and studies of many individuals of diverse genetic backgrounds may allow systematic determination of functional RSS across the transcriptome.
Full Methods
Sample preparation for renatured RNA structure probing
Human lymphoblastoid cell lines GM12878, GM12891 and GM12892 were obtained from Coriell. Total RNA was isolated from lymphoblastoid cells using Trizol reagent (Invitrogen). Poly(A)+ RNA was obtained by purifying twice using the MicroPoly(A)Purist kit (Life Technologies). The Tetrahymena ribozyme RNA was in vitro transcribed using T7 RiboMax Large scale RNA production system (Promega) and doped into 2µg of polyA+ RNA (1% by mole) for structure probing and library construction.
Structure probing of renatured poly(A)+ RNA
2µg of Poly(A)+ RNA in 160µl of nuclease free water is heated at 90°C for 2 min and snap cooled on ice for 2 min. 20µl of 10× RNA structure buffer (150mM NaCl, 10mM MgCl2, Tris pH 7.4) was added to the RNA and the RNA was slowly warmed up to 37°C over 20 min. The RNA was then incubated at 37°C for 15 min and structure probed independently using RNase V1 (Life Technologies, final concentration of 10−5U/µl) or S1 nuclease (Fermentas, final concentration of 0.4U/µl) at 37°C for 15 min. The cleavage reactions were inactivated using phenol chloroform extraction.
Structure probing and ribosomal RNA depletion for native deproteinized RNA structure probing
GM12878 cells were lysed in lysis buffer (150mM NaCl, 10mM MgCl2, 1% NP40, 0.1% SDS, 0.25% Na deoxycholate, Tris pH 7.4) on ice for 30min. The chromatin pellet was removed by centrifugation at 13000 rpm for 10min at 4°C. The lysate was deproteinized by passing through two phenol followed by one chloroform extractions. The concentration of RNA in the deproteinized lysate was measured using the Qubit fluorometer (Invitrogen). We diluted the RNA to a concentration of 1µg/90µl using 1× RNA structure buffer (150mM NaCl, 10mM MgCl2, Tris pH 7.4) and incubated the RNA at 37°C for 15min. The native deproteinized RNA was structure probed independently using RNase V1 (final concentration of 2×10⁻⁵U/µl) and S1 nuclease (final concentration of 0.2U/µl) at 37°C for 15min.
To compare structural differences between renatured and native deproteinized RNAs, we independently prepared an RNA sample that was similarly lysed and deproteinized. After removal of proteins, we ethanol precipitated the RNA and dissolved it in nuclease free water. We diluted the RNA to a concentration of 1µg/80µl in water and heated the RNA at 90°C for 2 min before snap cooling the RNA on ice. We added 10× RNA structure buffer and renatured the RNA by incubating it at 37°C for 15 min and performed structure probing similarly as in native deproteinized RNAs.
The cleavage reactions were inactivated using phenol chloroform extraction and DNase treated before undergoing ribosomal RNA depletion using Ribo-Zero Ribosomal RNA removal kit (Epicenter).
Validation of RiboSNitches by manual footprinting
We cloned ~200 nucleotide fragments of both alleles of MRPS21, WSB1, HLA-DRB1, HLA-DQA1, hnRNP-AB, HLA-DRA, LDHA, XRCC5 and FNBP1 from GM12878, GM12891 and GM12892 using a forward T7- gene specific primer and a reverse gene specific primer. All constructs are confirmed by sequencing using capillary electrophoresis. DNA from each of the different clones is then in vitro transcribed into RNA using MegaScript Kit from Ambion, following manufacturer’s instructions.
2pmole of each RNA is heated at 90°C for 2 min and chilled on ice for 2 min. 3.33× RNA folding mix (333 mM HEPES, pH 8.0, 20 mM MgCl2, 333mM NaCl) was then added to the RNA and the RNA was allowed to fold slowly to 37°C over 20 min. The RNA was then structure probed with either DMS (final concentration of 100mM) or NAI (final concentration of 100mM)16 at 37°C for 20 min or structure probed with S1 nuclease (final concentration of 0.4U/µl) or RNase V1 (final concentration of 0.0001U/µl) at 37°C for 15 min. The DMS structure probed samples were quenched using 2-mercaptoethanol before phenol chloroform extraction. The NAI and nuclease treated samples were phenol chloroform extracted directly after structure probing. The structure probed RNA was then recovered through ethanol precipitation. The RNA structure modification/cleavage sites were then read out using a radiolabelled RT primer by running onto denaturing PAGE gel as described in Wilkinson et al.
Library construction
The structure probed RNA was fragmented at 95°C using alkaline hydrolysis buffer (50mM Sodium Carbonate, pH 9.2, 1mM EDTA) for 3.5 min. The fragmented RNA was then ligated to 5’ and 3’ adapters in the Ambion RNA-Seq Library Construction Kit (Life Technologies). The RNA was then treated with Antarctic phosphatase (NEB) to remove 3’ phosphates before re-ligating using adapters in the Ambion RNA-Seq Library Construction Kit (Life Technologies). The RNA was reverse transcribed using 4µl of the RT primer provided in the Ambion RNA-Seq Library Construction Kit and PCR amplified following manufacturer’s instructions. We performed 18 cycles of PCR to generate the cDNA library.
Illumina sequencing and mapping
We performed paired end sequencing on Illumina’s Hi-Seq sequencer and obtained ~400 million reads for each paired end lane in an RNase V1 or S1 nuclease library. Obtained raw reads were truncated to 50 bases, (51 bases from the 3’ end were trimmed). Trimmed reads were mapped to the human transcriptome, which consists of non-redundant transcripts from UCSC RefSeq and the Gencode v12 databases (hg19 assembly), using the software Bowtie217, 17. We allowed up to 1 mismatch-per-seed during alignment, and only included reads with perfect mapping or with Bowtie2 reported mismatches on positions annotated as SNVs in GM cells. We obtained 166 to 212 million mapped reads for an RNase V1 or S1 nuclease sample.
PARS score calculation
After the raw reads were mapped to the transcriptome, we calculated the number of double stranded reads and single stranded reads that initiated on each base on an RNA. The number of double (V1) and single stranded reads (S1) for each sequencing sample were then normalized by sequencing depth. For a transcript with N bases in total, the PARS score of its i-th base was defined by the following formula where V1 and S1 are normalized V1 and S1 scores respectively. A small number 5 was added to reduce the potential over-estimating of structral signals of bases with low coverage:
To identify structural changes caused by SNVs, we applied a 5 base average on the normalized V1 and S1 scores to smoothing the nearby bases’ structural signals, therefore, PARS score is defined as:
Bases with both high V1 and S1 scores and transcripts with multiple conformations
Bases with both strong single and double strand signals are potentially present in multiple conformations. We first normalized all bases with detectable S1 or V1 counts by their sequencing depth. We then calculated a S1_ratio and a V1_ratio by normalizing S1 (and V1) counts to the transcript abundance. S1 and V1_ratios indicate the relative strength of single and double signals respectively. We then ranked all the bases by their S1_ratio and V1_ratio independently, and used the top 1 million S1_ratio bases and the top 1 million V1_ratio bases as high S1_ratio bases and high V1_ratio bases respectively. We defined a base as being in multiple conformations if the base has both high S1 and high V1_ratios. If a transcript contains more than 5 multi-confirmation bases, this transcript is defined as a multi-confirmation transcript.
V1 replicates correlation analysis
Pearson correlation of RNase V1 replicates on GM12878 was performed using a parsV1 score defined below:
MicroRNA Analysis
Structure differences between AGO PAR-CLIP bound and not bound transcripts
Predicted conserved and non-conserved miRNA target sites of conserved miRNA families were obtained from TargetScan18. AGO PAR-CLIP dataset in EBV transformed lymphoblastoid cells was obtained from Skalsky et al7. For 11 of the most abundant miRNAs that were expressed in the 4 lines of EBV transformed lymphoblastoid cells, we asked if the predicted target site fell within the AGO clip clusters. Predicted target sites that resided within the PAR-CLIP clusters were considered as AGO-bound, while the rest were considered as non-AGO bound. The non-AGO bound transcripts are further controlled to fall within 25–75% of 3’UTR length, mRNA abundance and CpG dinucleotide content of the AGO bound transcripts. The PARS scores for AGO bound and not bound transcripts were aligned to the start (either −7 or −8 position of the miRNA) of the miRNA:target binding site and averaged. P-value of structural changes were calculated using Wilcoxon Rank Sum Test.
AGO iCLIP library generation
AGO iCLIP was performed as previously described19 with the following modifications: 2×10⁷ GM cells (per biological replicate) were collected under log phase growth and washed once in ice-cold 1×PBS. The pellet is resuspended in 10× pellet volumes of ice-cold 1×PBS and plated out on 10cm tissue culture dishes. Cells were UV crosslinked at 254nm for 0.3J/cm2, collected in ice-cold PBS and cell pellets were frozen on dry ice. Lysate preparation, RNaseA, and immunoprecipitation of AGO were performed as described by Chi et al. using the anti-AGO antibody (clone 2A8, Millipore). To produce iCLIP libraries, on-bead enzymatic steps and off-bead final library preparation was performed as described by Konig et al20. AGO iCLIP libraries were produced in biological duplicates for each individual (GM12891, GM12892, and GM12878), barcoded, and pooled for sequencing. Samples were single-end sequenced for 75 bases on an Illumina HiSeq2500 machine.
AGO iCLIP data processing
Raw sequencing reads were preprocessed using FASTX-Tookit before alignment was performed. Sequencing adaptor was trimmed off using fastx_clipper and low quality reads were filtered using fastq_quality_filter. PCR-duplicates were further removed using the program fastq_collapser. Preprocessed reads were aligned to hg19 genome assembly using Bowtie21, and AGO-RNA cross-linking positions were obtained via self-generated script passing through the SAM file. AGO-RNA binding signal was smoothed by extending +/−10 bases around the cross-linking position, and signals from both replicates were normalized by sequencing depth. AGO-RNA per-base enrichment was defined as the minimum signal of the replicates divided by the corresponding RNA abundance.
To identify miRNA predicted sites for miRNAs that are expressed in GM12878 cells, we downloaded the small RNA sequencing data from ENCODE consortium (GEO accession number GSM605625), and aligned the raw reads to the human miRNA database using blastn. We estimated the amount of miRNA expression by counting the blastn perfect matches for each miRNA. Predicted miRNA target sites from the top 100 highest expressed miRNA were then aligned to the miRNA:target binding sites and were separated into two groups: predicted sites with an average PARS score of less than −1 (from −3 to 1 of the miRNA:target pair) were classified as single stranded sites while those with an average PARS score of greater than 1 (from −3 to 1 of the miRNA:target pair) were classified as double stranded sites. We then calculated the average AGO-iCLIP enrichment score for the two groups of miRNA binding sites (from −25 to 25 bases), and estimated the significance of their difference using the Student T-test.
miRNA target downregulation in Hela cells
Average gene expression changes upon expression of miR142 or miR148 in Hela cells were obtained from Grimson et al. by averaging the gene expression changes induced by the miRNA at 12hrs and 24hrs of over-expression9. For the miR142 or miR148 Targetscan predicted miRNA sites, we calculated the average PARS score across −3 to +1 (from the start of the miRNA:target pair) and sorted the predicted sites according to their structural accessibility. The p-value for difference in down-regulation of transcripts that contain the top 100 accessible sites versus transcripts that contain the bottom 100 accessible sites was calculated using Wilcoxon Rank Sum Test.
RiboSNitch Analysis
RNAs with known secondary structures were doped into the initial RNA pool as positive controls to estimate the baseline changes in RNA structure in PARS. We calculated the PARS scores for all the bases in the transcripts and performed data normalization in order to directly compare secondary structures between different individuals. To normalize the data, we calculated the standard deviation (SD) for each transcript and divided the PARS score per base by the SD of that transcript. This resulted in a normal distribution of PARS scores for each transcript in each individual and enabled us to calculate the change in PARS scores due to SNVs by subtraction of PARS scores between the individuals. Since a true structure change is likely to extend beyond a single base, we define a structure difference of the i-th base of transcript j between conditions m and n in this formula, where PARS represents the normalized PARS score:
We calculated the StrucDiff for all the bases in all the transcripts between each pair of individuals: GM12891 and GM12892, GM12891 and GM12878, GM12892 and GM12878. To identify RiboSNitches, we downloaded SNV annotations from HapMap project22, and then converted SNV annotations from hg18 assembly to hg19 assembly using UCSC executable LiftOver. We then overlaid the hg19 SNV coordinates with our transcriptome annotation, a non-redundant combination of RefSeq and Gencode v12 transcriptome assembly, to identify the positions in the transcriptome that have SNVs. For highly confident detection of structural changes, we require that the sequencing coverage around SNV is dense, such that (1) the SNV is located on a transcript whose average coverage is greater than 1 (on average one read per base); and (2) the average coverage in a 5-base window centered around the SNV is greater than 10 (average S1+V1≥5). We exclude bases that fall within 100 nucleotides from the 3’end of all the transcripts due to the blind tail of 100 nucleotides.
To identify SNVs with statistically significant changes in structure, we estimated a global baseline of structural change by calculating the fold differences between the doping control and SNV cumulative frequencies. We calculated a z-score for each detected SNV: z= (StrucDiffs-mean)/(SD of doped in controls). We used the Tetrahymena ribozyme as the doped in control. We noticed that a StrucDiff ≥1 is equivalent to a z-score≥4.5 and a 100 fold difference between the SNV and doping control cumulative frequencies. To calculate the p-value for the structural change at each detected SNV, we performed 1000 permutations on the absolute values of the non-zero delta PARS scores within each transcript that contains SNV. This p-value is an estimate of the likelihood that a 5-base average of the permutated PARS structural change is greater than the 5-base average of the SNV base’s structural change. The false discovery rate (FDR) of the significance of the structural change at the SNV site is estimated by a multi-hypothesis testing performed using the p.adjust function in R. A SNV is defined as a RiboSNitch if (1) its StrucDiff is greater than 1 (equivalent to z-score ≥ 4.5 and 100 fold cumulative frequency difference); (2) its p-value less than 0.05 and FDR less than 0.1; and (3) local read coverage greater than 10 and at least 3 out of 11 bases contain S1 or V1 signals in a 11-base sliding window centered by the SNV site. We also permutated the structural changes between the Trio by shuffling the StrucDiffs within every transcript. After structural PARS scores were permutated, we identified only 16 RiboSNitches based on the exact same aforementioned methods and thresholds. This number is less than 1% of the original number of RiboSNitches found, indicating that most of the discovered RiboSNitches are not random noise.
RiboSNitch noise and signal estimation
We estimated the amount of structural change between 2 replicates with the same sequence and compared it to the change in 2 replicates with differing sequences. For example, the Father may have heterozygous alleles A/C at particular locus, while the Mother has the alleles C/C and the Child has alleles A/C at the same locus. As the local genotype of the father is the same as that of the child, we can calculate the amount of structure change between that of the father and child (delta1, noise). If this SNP was predicted to be a RiboSNitch, then the local structural change between the father and mother (delta2, signal) should be significantly greater than the noise. We took all the heterozygous RiboSNitches we predicted that satisfy the above-mentioned pattern (861, 558, 519 SNVs respectively between three pairs of individuals in the trio), and calculated the absolute structure change in a 21nt window centered on the RiboSNitch. Plotting signal (delta2) and noise (delta1) windows across these RiboSNitches demonstrated that on average, the signal plot has 3 fold greater structure changes than that of the noise plot (P-value = 7.94E-177, Student T-test), indicating that the RiboSNitches that we identified clearly distinguishes from the biological noise.
As a further control, we generated 2 additional biological replicates of PARS with RNase V1 from refolded RNA of the child, and obtained 70–110 million mapped reads for each sample. As expected, biological replicates of the same individual are better correlated than between individuals. No difference in variance was detected at RiboSNitch neighbhorhoods vs other sites, nor in comparing 5’ UTR, CDS, vs. 3’ UTRs. These results indicate that RiboSNitches are not simply passenger mutations residing in structurally flexible or poorly measured regions.
Estimation of structural disruption at the gene level
The extent of structural disruption of a transcript is estimated by an eSDC score (experimental structural disruption coeffiency) that is defined as:
where cc is a Pearson correlation of the transcript between two samples, and l is the length of that transcript10. The greater the eSDC is, the more disrupted the transcript is.
RiboSNitch allele specific cross validation
We first generated an allele specific sequence reference for the lymphoblastoid cells by compiling 150-baes sequence fragments (50 bases upstream and 100 bases downstream of the SNV) of both wildtype and mutant alleles. We then built Bowtie indexes using this reference, and mapped trimmed raw reads from GM12878 (Child) to the indexes. We only accepted reads with perfect match to the wild type or mutant sequences and calculated S1, V1 and PARS score as described above. We examined RiboSNitches that were (1) homozygous in both GM12891 (Father) and GM12892 (Mother) and (2) has both alleles detected as expressed in GM12878 (Child). A RiboSNitch is considered as cross-validated if the structural change between the two detected alleles in the Child follows the same direction as the structural changes between the two alleles in the parents. Out of 184 homozygous RiboSNitches in the parents, 117 of these RiboSNitches can be cross-validated in the Child (63.6%). Allele-specific cross validation using the Child’s native deproteinized data was also performed as above.
RiboSNitch and microRNA, RBP and splicing
Predicted miRNA target sites (both conserved and nonconserved targets of conserved miRNA families) were downloaded from Targetscan. RBP clipdata sets were downloaded from the doRiNA database23. Additionally CLIP sequencing datasets for Lin28 was from Wilbert ML et al24, DGCR8 was from Macias S et al25.
RiboSNitch and Splicing Analysis
We defined a percent inclusion or “percent spliced-in” (PSI) value similarly to Barbosa-Morais et al15. We considered every internal exon in each annotated transcript as a potential “cassette” exon. Each “cassette” AS event is defined by three exons: C1, A and C2, where A is the alternative exon, C1 is the 5’ constitutive exon and C2 is the 3’ constitutive exon; two constitutive junctions: C1A (connecting exons C1 and A) and AC2 (connecting exons A and C2); as well as one alternative (or “skipped”) junction: C1C2 (connecting exons C1 and C2). First, we constructed a reference library containing unique, non-redundant constitutive and alternative junction sequences that are based on exon annotations and their RNA sequences. These junction sequences were constructed such that there is a minimum of 5 nucleotides overlap between the mapped reads and each of the two exons involved. Each junction sequence was annotated with a gene name and exon indexes for downstream analysis. As we trimmed the sequencing raw reads to 50 bases, we created a junction sequence library, indexed using bowtie-build21, using junction sequences of 90 bases. We downloaded independent RNA sequencing data from ENCODE consortium (GM12878, GM12891 and GM12892) to estimate the PSI differences between samples. Raw reads were trimmed to 50 bases and then aligned to the non-redundant junction sequences using Bowtie21, with unique mapping (-m 1 option) and allowing a maximum of two mismatches. The number of reads that were uniquely mapped to a junction sequence, corresponding to the junction’s effective number of mappable reads, was calculated by an in-house generated script. We then counted the number of reads that were uniquely mapped to each junction C1A, AC2 and C1C2, respectively. The PSI value for each internal exon was defined as:
where #C1A, #AC2 and #C1C2 are the normalized read counts for the associated junctions.
We calculated PSIs for all the internal exons in the samples GM12891, GM12892, and GM12878 and calculated the change in PSI between each pair of samples. Out of 12233 transcribed SNVs, 498 SNVs were found in internal exons with PSI differences in the Trio, and 169 SNVs were located within 20nt of the splicing sites. We ranked these 169 SNVs by their the degree of their structural changes (StrucDiff score), and found that the exons containing SNVs with higher StrucDiff scores (StrucDiff>1) show greater PSI differences than those exons containing SNVs with lower StrucDiff scores (StrucDiff<1).
RiboSNitch and local structure environment
We defined bases of PARS score greater than 1 as double stranded (D), PARS score less than −1 as single stranded (S), and PARS score between −1 and 1 as poised region (․). Using these cutoffs, we classified local structures around a SNV site into different categories (e.g., S.D, DDD), and the average PARS score changes for ribositches under different local structure categories were analyzed.
RiboSNitch and SNV density in flanking regions
We calculated the average number of SNVs within a certain distance to a ribosnitch using SNV annotation from the 1000 genome project. We also made the same calculation on 2450 non-structural changing SNV sites as negative control. We used the Kolmogorov–Smirnov test to determine whether the two distributions are significantly different.
RiboSNitches predicted by SeqFold using PARS scores
For each SNV we used SeqFold to predict RNA secondary structure for a transcript fragment of 151 nucleotides (50 nucleotides upstream to 100 nucleotides downstream of the SNV sites). We used the PARS scores from allele specific mapping as input to SeqFold. We then compared the SeqFold predicted structures for the different alleles at the SNV site. Green and red circles indicate bases with PARS scores <=−1 and >=1, respectively.
Enrichment of SNVs in genomic features
We compared different genomic features or annotations of 993 unique RiboSNitches to 1009 control SNVs. For each genomic annotation, the fraction of RiboSNitches that are inside the genomic region covered by the annotation (e.g., histone mark) was compared to the fraction of control SNVs by Student’s T-Test. The different genomic annotations were downloaded and compiled from various online resources (Supp. Table 5). A cutoff value of p=0.05 was used.
Supplementary Material
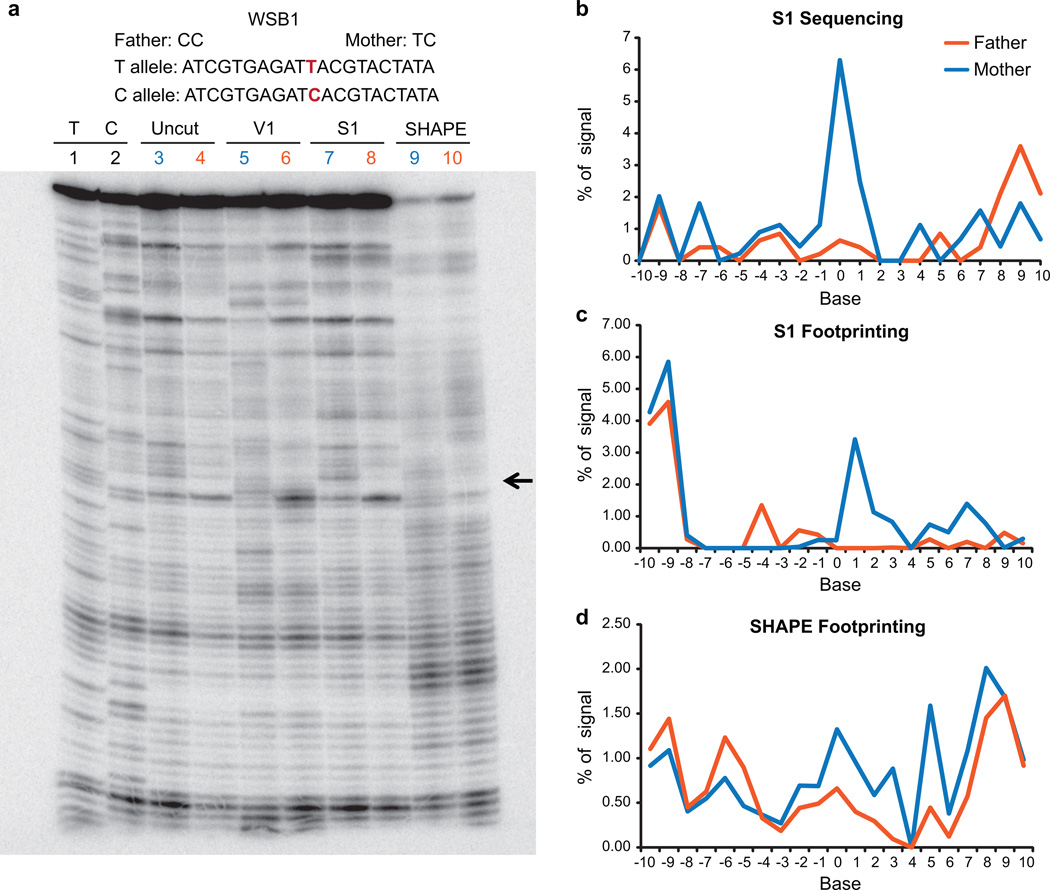
Extended Data Figure 8. Footprinting validation of a RiboSNitch in WSB1 transcript identified by PARS.
a, The sequence of a portion of the WSB1 transcript containing the RiboSNitch was shown. The RiboSNitch is in red. Gel analysis of 2 fragments of WSB1 RNA T and C alleles using RNase V1 (lanes 5 (Mother), 6 (Father)), S1 nuclease (lanes 7 (Mother), 8 (Father)), and SHAPE probing ((lanes 9 (Mother), 10 (Father)). Additionally, sequencing lanes (lanes 1,2), DMSO uncut lanes (lane 3 (Mother), lane 4 (Father)) are also shown. Black arrow indicates the change in structure between the Father and Mother alleles. b, Fraction of S1 sequencing reads over total S1 sequencing reads in the region, across the RiboSNitch for both Father and Mother. c,d, SAFA quantification of the RNA footprinting of both alleles using S1 nuclease (c) and SHAPE (d).
Acknowledgement
We thank members of Chang lab, S. Rouskin, and J. Weissman, A. Mele and R. Darnell for discussion. This work is supported by NIH R01-HG004361 (H.Y.C. and E.S.). H.Y.C. is an Early Career Scientist of the Howard Hughes Medical Institute.
Footnotes
Author Contributions
H.Y.C. conceived the project; Y.W. and H.Y.C. developed the protocol and designed the experiments; Y.W. and R.A.F. performed experiments; Y.W, K.Q., Q.C.Z., O.M., Z.O., J.Z., R.C.S, M.P.S., E.S., and H.Y.C. planned and conducted the data analysis; Y.W., K.Q. and H.Y.C. wrote the paper with contributions from all authors.
Accession Numbers
The GEO accession number is GSE50676.
References
- 1.Wan Y, Kertesz M, Spitale RC, Segal E, Chang HY. Understanding the transcriptome through RNA structure. Nat. Rev. Genet. 2011;12:641–655. doi: 10.1038/nrg3049. [DOI] [PMC free article] [PubMed] [Google Scholar]
- 2.Kertesz M, et al. Genome-wide measurement of RNA secondary structure in yeast. Nature. 2010;467:103–107. doi: 10.1038/nature09322. [DOI] [PMC free article] [PubMed] [Google Scholar]
- 3.Li F, et al. Global analysis of RNA secondary structure in two metazoans. Cell. Rep. 2012;1:69–82. doi: 10.1016/j.celrep.2011.10.002. [DOI] [PubMed] [Google Scholar]
- 4.Shabalina SA, Ogurtsov AY, Spiridonov NA. A periodic pattern of mRNA secondary structure created by the genetic code. Nucleic Acids Res. 2006;34:2428–2437. doi: 10.1093/nar/gkl287. [DOI] [PMC free article] [PubMed] [Google Scholar]
- 5.Barash Y, et al. Deciphering the splicing code. Nature. 2010;465:53–59. doi: 10.1038/nature09000. [DOI] [PubMed] [Google Scholar]
- 6.Bartel DP. MicroRNAs: target recognition and regulatory functions. Cell. 2009;136:215–233. doi: 10.1016/j.cell.2009.01.002. [DOI] [PMC free article] [PubMed] [Google Scholar]
- 7.Skalsky RL, et al. The viral and cellular microRNA targetome in lymphoblastoid cell lines. PLoS Pathog. 2012;8:e1002484. doi: 10.1371/journal.ppat.1002484. [DOI] [PMC free article] [PubMed] [Google Scholar]
- 8.Marin RM, Voellmy F, von Erlach T, Vanicek J. Analysis of the accessibility of CLIP bound sites reveals that nucleation of the miRNA:mRNA pairing occurs preferentially at the 3'-end of the seed match. RNA. 2012;18:1760–1770. doi: 10.1261/rna.033282.112. [DOI] [PMC free article] [PubMed] [Google Scholar]
- 9.Grimson A, et al. MicroRNA targeting specificity in mammals: determinants beyond seed pairing. Mol. Cell. 2007;27:91–105. doi: 10.1016/j.molcel.2007.06.017. [DOI] [PMC free article] [PubMed] [Google Scholar]
- 10.Ritz J, Martin JS, Laederach A. Evaluating our ability to predict the structural disruption of RNA by SNPs. BMC Genomics. 2012;13(Suppl 4) doi: 10.1186/1471-2164-13-S4-S6. S6-S2164-13-S4-S6. [DOI] [PMC free article] [PubMed] [Google Scholar]
- 11.Halvorsen M, Martin JS, Broadaway S, Laederach A. Disease-associated mutations that alter the RNA structural ensemble. PLoS Genet. 2010;6:e1001074. doi: 10.1371/journal.pgen.1001074. [DOI] [PMC free article] [PubMed] [Google Scholar]
- 12.Ouyang Z, Snyder MP, Chang HY. SeqFold: Genome-scale reconstruction of RNA secondary structure integrating high-throughput sequencing data. Genome Res. 2012 doi: 10.1101/gr.138545.112. [DOI] [PMC free article] [PubMed] [Google Scholar]
- 13.Salari R, Kimchi-Sarfaty C, Gottesman MM, Przytycka TM. Sensitive measurement of single-nucleotide polymorphism-induced changes of RNA conformation: application to disease studies. Nucleic Acids Res. 2013;41:44–53. doi: 10.1093/nar/gks1009. [DOI] [PMC free article] [PubMed] [Google Scholar]
- 14.Katz Y, Wang ET, Airoldi EM, Burge CB. Analysis and design of RNA sequencing experiments for identifying isoform regulation. Nat. Methods. 2010;7:1009–1015. doi: 10.1038/nmeth.1528. [DOI] [PMC free article] [PubMed] [Google Scholar]
- 15.Barbosa-Morais NL, et al. The evolutionary landscape of alternative splicing in vertebrate species. Science. 2012;338:1587–1593. doi: 10.1126/science.1230612. [DOI] [PubMed] [Google Scholar]
- 16.Spitale RC, et al. RNA SHAPE analysis in living cells. Nat. Chem. Biol. 2013;9:18–20. doi: 10.1038/nchembio.1131. [DOI] [PMC free article] [PubMed] [Google Scholar]
- 17.Langmead B, Salzberg SL. Fast gapped-read alignment with Bowtie 2. Nat. Methods. 2012;9:357–359. doi: 10.1038/nmeth.1923. [DOI] [PMC free article] [PubMed] [Google Scholar]
References for full methods
- 18.Lewis BP, Burge CB, Bartel DP. Conserved seed pairing, often flanked by adenosines, indicates that thousands of human genes are microRNA targets. Cell. 2005;120:15–20. doi: 10.1016/j.cell.2004.12.035. [DOI] [PubMed] [Google Scholar]
- 19.Chi SW, Zang JB, Mele A, Darnell RB. Argonaute HITS-CLIP decodes microRNA-mRNA interaction maps. Nature. 2009;460:479–486. doi: 10.1038/nature08170. [DOI] [PMC free article] [PubMed] [Google Scholar]
- 20.Konig J, et al. iCLIP reveals the function of hnRNP particles in splicing at individual nucleotide resolution. Nat. Struct. Mol. Biol. 2010;17:909–915. doi: 10.1038/nsmb.1838. [DOI] [PMC free article] [PubMed] [Google Scholar]
- 21.Langmead B, Trapnell C, Pop M, Salzberg SL. Ultrafast and memory-efficient alignment of short DNA sequences to the human genome. Genome Biol. 2009;10:R25. doi: 10.1186/gb-2009-10-3-r25. [DOI] [PMC free article] [PubMed] [Google Scholar]
- 22.International HapMap Consortium. The International HapMap Project. Nature. 2003;426:789–796. doi: 10.1038/nature02168. [DOI] [PubMed] [Google Scholar]
- 23.Anders G, et al. doRiNA: a database of RNA interactions in post-transcriptional regulation. Nucleic Acids Res. 2012;40:D180–D186. doi: 10.1093/nar/gkr1007. [DOI] [PMC free article] [PubMed] [Google Scholar]
- 24.Wilbert ML, et al. LIN28 binds messenger RNAs at GGAGA motifs and regulates splicing factor abundance. Mol. Cell. 2012;48:195–206. doi: 10.1016/j.molcel.2012.08.004. [DOI] [PMC free article] [PubMed] [Google Scholar]
- 25.Macias S, et al. DGCR8 HITS-CLIP reveals novel functions for the Microprocessor. Nat. Struct. Mol. Biol. 2012;19:760–766. doi: 10.1038/nsmb.2344. [DOI] [PMC free article] [PubMed] [Google Scholar]
Associated Data
This section collects any data citations, data availability statements, or supplementary materials included in this article.


