

Abstract
Responses to both potentially traumatic events and other significant life stressors have been shown to conform to discrete patterns of response such as resilience, anticipatory stress, initial distress with gradual recovery, and chronic distress. The etiology of these trajectories is still unclear. Individual differences in levels of negative and positive emotion are believed to play a role in determining risk and resilience following traumatic exposure. In the current investigation, we followed police officers prospectively from academy training through 48 months of active duty, assessing levels of distress every 12 months. Using latent class growth analysis, we identified 4 trajectories closely conforming to prototypical patterns. Furthermore, we found that lower levels of self-reported negative emotion during academy training prospectively predicted membership in the resilient trajectory compared with the more symptomatic trajectories following the initiation of active duty, whereas higher levels of positive emotion during academy training differentiated resilience from a trajectory that was equivalently low on distress during academy training but consistently grew in distress through 4 years of active duty. These findings emerging from a prospective longitudinal design provide evidence that resilience is predicted by both lower levels of negative emotion and higher levels of positive emotion prior to active duty stressor exposure.
Keywords: resilience, police, distress, positive emotion, negative emotion
Police work is characterized by frequent exposure to potentially traumatic events (PTEs) against a background of high levels of routine work stress. Officers are regularly exposed to a variety of PTEs, including threat of injury or death to themselves, their colleagues, and people in the communities they serve (Marmar et al., 2006; Weiss et al., 2010), as well as to routine work environment stressors such as long shifts with irregular hours, discrimination, and inadequate resources (Liberman et al., 2002). Both PTEs and routine work stressors have been shown to place officers at increased risk for stress-related psychopathology including post-traumatic stress disorder (PTSD; Maguen et al., 2009; Marmar et al., 2006), depression (Wang et al., 2010), sleep disturbances (Neylan et al., 2002), anxiety, somatization, alcohol abuse, aggressive behavior (Gershon, Lin, & Li, 2002), and increased rates of cardiovascular and gastrointestinal disorders, divorce, and suicide (Axelbend & Vaile, 1979; Violanti, 1995).
Despite these increased risks, the majority of officers appear to adapt well to repeated stressor exposure, a minority develop significant PTSD symptoms but are able to recover over time, and a smaller group demonstrates stable or even increasing symptoms over time (Galatzer-Levy, Madan, Neylan, Henn-Haase, & Marmar, 2011). These findings are highly consistent with a growing body of research on prospective patterns of response to both PTEs and other stressful life events. This literature suggests that people cluster into discrete prototypical patterns, with the largest group being asymptomatic or having very low symptoms over time, a pattern designated as resilience (Bonanno, 2004). Other commonly observed patterns include recovery (a variable period of symptomatic distress followed by remission) and chronic distress (high levels of symptoms that do not abate over time). When the stressor is anticipated, a pattern characterized by high pre-event stress that declines following the event is also observed (Bonanno, 2004). These patterns have been observed in response to events as varied as terrorist attacks (Bonanno, Rennicke, & Dekel, 2005), disease epidemics (Bonanno et al., 2008), traumatic physical injuries (deRoon-Cassini, Mancini, Rusch, & Bonanno, 2010), parental response to serious injury of a child (Le Brocque, Hendrikz, & Kenardy, 2010), deployment to war zones (Dickstein, Suvak, Litz, & Adler, 2010), and traumatic loss (Bonanno, Wortman, & Nesse, 2004), and have been observed in response to significant life stressors including breast cancer diagnosis (Lam et al., 2010), job loss (Galatzer-Levy, Bonanno, & Mancini, 2010), childbirth (Galatzer-Levy, Mazursky, Mancini, & Bonanno, 2011), and bereavement (Bonanno, Wortman, & Nesse, 2004; Galatzer-Levy & Bonanno, 2012). The above findings are compelling; however, the factors accounting for symptom severity trajectories are only beginning to be understood. The role of emotion has emerged as a key theoretical candidate in understanding healthy versus mal-adaptive patterns of adaptation because emotions are widely assumed to have evolved to promote survival in the face of environmental adversities (Darwin, 1872; Ekman, 1993; Keltner & Haidt, 1999).
Emotion appears to play an important role in adaptation following exposure to a stressor. Negative emotions such as fear, anxiety, and anger often lead to autonomic nervous system arousal leading to increased heart rate, vasoconstriction, and increased blood pressure (Fredrickson, Maynard, et al., 2000; Gross, Fredrickson, & Levenson, 1994; Levenson, Ekman, & Friesen, 1990; Öhman, 2005), as well as narrowing of attention and behavior in proscribed ways such as fight or flight (Fredrickson, 1998, 2001). Positive emotion can serve to mitigate these effects by moderating cardiovascular responses to negative emotional arousal (Fredrickson, Mancuso, Branigan, & Tugade, 2000). Positive emotion following an event not only serves an “undoing” effect on negative emotion, but further leads to a cascade whereby autonomic activity is modulated, broadening the individual’s cognitive and behavioral repertoire to include play, curiosity, and explorative positive emotions, leading to healthy adaptation. This effect has been experimentally observed. Following the induction of positive emotions, individuals have been shown to generate cognitions characterized as flexible, integrative, open to information, and efficient (Fredrickson, Tugade, Waugh, & Larkin, 2003). In addition, the habitual experience of positive emotion is associated with a broad coping style that leads to general healthy adaptation in response to both significant and routine stressors (Fredrickson et al., 2003).
A number of studies have demonstrated that positive emotion is associated with healthy outcomes in response to stressor exposure. Positive emotions have been shown to moderate stress reactivity and aid in stress recovery in association with daily stressors (Ong, Bergeman, Bisconti, & Wallace, 2006). Experiencing positive emotions has been shown to aid in emotion regulation, accelerate recovery from cardiovascular activation caused by negative emotional arousal, and lead to positive meaning-making in negative circumstances (Tugade & Fredrickson, 2004). These studies suggest that positive emotion supports and negative emotion hinders adaptation following a stressor, but it remains unclear whether the ability to experience higher levels of positive emotion and dampen negative emotion prospectively predicts healthy adaptation compared with maladaptive patterns of response, as many of these findings hinge on the association between positive emotion and “trait resilience” (Fredrickson et al., 2003; Ong et al., 2006; Tugade & Fredrickson, 2004; Tugade, Fredrickson, & Feldman Barrett, 2004), which is one of many risk and resilience factors that predict a resilient outcome following a PTE (Bonanno, Brewin, Kaniasty, & Greca, 2010).
Whereas the majority of these studies typically study the relationship between trait resilience and positive emotion in a cross-sectional design, an exception to cross-sectional research on emotion and resilience is a study that examined emotion, as indexed by facial expressions in response to an experimental task, in a cohort of college students who were attending a New York City university during the September 11th attacks. Following this cohort longitudinally, researchers found that the expression of positive emotion predicted longitudinal patterns of adaptation (Papa & Bonanno, 2008). This longitudinal study found that successful adaptation to the PTE was predicted by positive emotion, but the experimental task was conducted following September 11th. Furthermore, these findings demonstrated an effect for the group as a whole rather than for discrete patterns of adaptation such as resilience and chronic distress. Generally, analyses that examine mean-level outcomes are limited in their explanatory power when heterogeneity is present because mean-level analyses treat everyone as if they are part of a single population, an assumption that is typically inaccurate in the case of stress responses (Galatzer-Levy & Bonanno, 2012). As such, it remains unclear whether levels of positive and negative emotions present prior to exposure predict longitudinal patterns of response following exposure.
In the current investigation, we examined whether patterns of adaptation among police officers can be prospectively predicted by levels of positive and negative emotion assessed during academy training prior to PTE. We hypothesized that higher levels of negative emotion and lower levels of positive emotion during training would predict greater levels of distress during the first 4 years of police service, and higher levels of positive emotion and lower levels of negative emotion would predict resilience. Furthermore, although we expected that levels of positive and negative emotion would be negatively correlated, we predicted that each would independently account for patterns of response following exposure to potentially traumatic and routine work stressors.
Method
Participants and Procedure
Officers from four urban police departments (New York City, San Francisco, Oakland, and San Jose) were recruited during academy training. Trainees who had previously served in the military, law enforcement, or other first-responder professions were excluded. Procedures were approved by the University of California, San Francisco, and New York University Institutional Review Boards. Participants were assessed at baseline during academy training, and at 12, 24, 36, and 48 months into active duty. Prior to the initial assessment, study procedures were described in detail and written informed consent was obtained. For a full description of recruitment procedures, see McCaslin et al. (2008).
This study used a subsample of officers who had data on symptomatic distress available on at least three of five time points (n = 234) drawn from a larger cohort of police officers followed longitudinally from academy training (N = 400). Over the five time points, 81 participants were missing data at no time points, 99 were missing data at one time point, and 54 were missing data at two time points. Participants were removed from the analysis if they were missing more than two time points because this could potentially affect the estimation of longitudinal classes. This sample was primarily male (86.8%), with a relatively high level of education, with 9.4% completing only high school or receiving a GED, 30.3% completing some college, 53.4% completing a bachelor’s degree, and 6.0% completing a master’s degree. The sample was relatively young when they started police service (minimum age = 21 years, maximum age = 43 years, M = 27.42 years, SD = 4.78).
Measures
Critical Incident History Questionnaire (CIHQ)
The CIHQ is a 39-item self-report measure designed to assess exposure to PTSD Criterion A events typically encountered by police officers in the line of duty (Weiss et al., 2010). Of the 39 items, 14 assessed exposure to personally life-threatening events in the line of duty such as being shot at, attacked, or being seriously injured in the line of duty. Total scores for both the 39 item responses and 14 item responses were computed for each time point and across time points. For the present study, we used CIHQ scores covering the first 12, 24, 36, and 48 months of police service.
Work Environment Inventory (WEI)
The WEI is a 68-item measure of exposure to routine occupational stressors that excludes duty-related PTEs (Liberman et al., 2002; Maguen et al., 2009). Police-specific stressors (e.g., some safety issues, relations with the court system) were worded in police-specific terms. Each item is posed as a statement (e.g., “I am under a lot of pressure to produce results”) that participants respond to on a disagree-to-agree Likert-type scale from −2 to +2. Items are balanced so that agreement implies higher stress on 39 items and disagreement implies higher stress on 29 items. This measure has been shown to be highly internally reliable (α = .92).
Hopkins Symptom Checklist 90 —Revised (SCL-90-R)
The SCL-90-R is a 90-item self-report symptom inventory that measures psychological symptoms and psychological distress in terms of nine dimensions or indices (Derogatis & Melisaratos, 1983). The items from the indices were summed and averaged to form a Global Severity Index (GSI), the Depression Index, and the Anxiety Index, which were the three indices used in this analysis. Items are rated on a 5-point Likert scale ranging from 0 (not at all) to 4 (extremely). The GSI, which measures general distress, consists of 29 items from multiple scales of the SCL-90-R. The GSI has shown adequate internal consistency (α = .86) and good 1-week test–retest reliability of .90 (Derogatis & Melisaratos, 1983). The Depression Index consists of six items and reflects symptoms of clinical depressive syndromes such as dysphoric affect and mood, withdrawal from interests and activities, loss of energy, and feelings of hopelessness and futility. This scale demonstrated adequate internal consistency (α = .85) and adequate test–retest reliability (.84). The Anxiety Index includes a set of symptoms typically associated with clinical features of anxiety including restlessness, nervousness, and tension. This index also has demonstrated adequate internal consistency (α = .81) and adequate test–retest reliability (.79).
PTSD Checklist—Military Version (PCL–M)
Symptoms of PTSD were measured using the PCL–M, which was modified to assess PTSD symptoms related to police service rather than military service. The PCL–M is a 17-item self-report measure that maps onto the 17 symptoms of PTSD according to the Diagnostic and Statistical Manual of Mental Disorders (4th ed., text revision; DSM–IV–TR; American Psychiatric Association, 2000). Each item is measured on a 5-point Likert-type scale (1 = not at all true to 5 = extremely true), with a score of 17 being the basal and 44 being the clinical cutoff indicating diagnostic levels of PTSD symptom severity (Weathers, Litz, Herman, Huska, & Keane, 1993). Scores are summed across the 17 items. Responses were for the past month. This measure demonstrated interitem reliability at 12 months in this sample (α = .89).
Positive and Negative Affect Schedule (PANAS)
Positive and negative emotions were assessed during academy training using the PANAS (Watson, Clark, & Tellegen, 1988). Participants rated the extent to which they experienced 20 emotion items on a 5-point Likert-type scale ranging from 1 (very slightly or not at all) to 5 (extremely) over the past year. The means of 10 items comprising the Positive Affect (PA) subscale (active, alert, attentive, determined, enthusiastic, excited, inspired, interested, proud, strong) and 10 items comprising the Negative Affect (NA) sub-scale (afraid, ashamed, distressed, guilty, hostile, irritable, jittery, nervous, scared, upset) were calculated to indicate overall positive and negative emotion levels, respectively. The two subscales have demonstrated quasi-independence (low correlations ranging from −.12 to −.23), high internal consistency (PA ranging from α = .86 to .90; NA ranging from α = .84 to .87), and stability of 2 months (Watson et al., 1988). In the current sample, these measures are correlated at .15, p < .01. This indicates that although weakly related, the Positive and Negative Affect subscales are largely independent emotion measures in the current sample.
Data Analysis
Using Mplus 6.12, we employed latent class growth analysis (LCGA) to construct trajectories of general distress over five time points, starting during academy training and then every 12 months through the first 48 months of active duty police work using maximum-likelihood estimation to estimate class parameters (Muthén & Muthén, 2006). In this model, we compared both linear and quadratic parameters for the classes. We assessed the best fitting model in terms of the number of latent classes and the best fitting parameters (linear vs. linear and quadratic). This was done by assessing relative fit using the information criteria and fit indices, including the Bayesian information criterion (BIC), sample-size-adjusted BIC (SSBIC), Aikaike information criterion (AIC; Akaike, 1987), Lo–Mendell–Rubin likelihood test (LRT; Lo, Mendell, & Rubin, 2001), and the bootstrap likelihood ratio test (BLRT), as well as parsimony and interpretability consistent with recommendations from the literature (Nylund, Asparouhov, & Muthén, 2007). We also attended to entropy values, which range from 0 to 1 and indicate the degree of separation among the classes, where scores closer to 1 indicate better fit of the data into the prescribed class structure (Duncan, Duncan, & Strycker, 2006). Based on recommendations from the literature, we placed the heaviest weight on the BLRT and the BIC methods for assessing relative model fit along with parsimony and interpretability (Nylund et al., 2007). After finding the best fitting model free from covariates (unconditional model), we integrated covariates into the model (conditional model). Because of the complexity involved in estimating this type of model in relation to the relatively small sample size, we examined the effects of key covariates prior to the examination of our primary variables of interest, PA and NA scores. Variables that were found to be nonsignificant were not included in the final analysis. Using this approach, we examined overall exposure to life-threatening events over the 4 years of the study, work environment stress over the 4 years of the study, gender, age, and level of education. All variables were assessed in a multinomial logistic regression nested in the LCGA (conditional model). Finally, as negative emotion is often associated with symptoms of psychopathology, to better understand how the trajectories of general distress relate to specific psychopathology, we examined mean-level differences between individuals in the identified trajectories on levels of depression and anxiety at each time point and posttraumatic stress at all time points (except for at academy training, as posttraumatic stress levels were not assessed at that time point).
Results
Of the 234 participants, 67.5% reported being exposed to at least one personally life-threatening event by 12 months, 83.8% by 24 months, 88.9% by 36 months, and 91.0% by 48 months. Using the CIHQ total, which includes DSM–IV–TR Criterion A events that are life-threatening such as reporting being shot at and events that are non–life-threatening such as exposure to dead or dismembered bodies, we found that 88.9% reported a DSM–IV–TR Criterion A event by 12 months, 94.4% by 24 months, 95.7% by 36 months, and 97.0% by 48 months. Mean exposure to life-threatening events through 48 months was 11.58 incidents (SD = 13.98).
Unconditional Model
First, we identified a univariate single-class growth model without covariates to facilitate model specification for the LCGA with fixed effects on the slope and quadratic parameters. The slope was fixed to zero because of problems with model convergence when the slope was freely estimated. Second, we compared progressive unconditional LCGA models (no covariates), assessing relative fit with the BIC, SSBIC, AIC, LRT, and BLRT. The AIC, BIC, and SSBIC continued to demonstrate improved model fit through five classes, and the LRT consistently demonstrated nonsignificance between class solutions. However, for both the linear only and linear + quadratic solution, the BLRT favored a four-class solution. Furthermore, the four-class solution fit well with substantive theory concerning the course of stress responses, and the addition of a fifth class served to split the resilient class into two parallel classes that were substantively nondistinct. Therefore, based on the performance of the BLRT, parsimony, and interpretability, we retained the four-class solution (see Table 1).
Table 1.
Fit Indices for One- to Four-Class Unconditional Growth Mixture Models of General Distress (n = 234)
| Fit index | AIC | BIC | SSBIC | LRT | BLRT |
|---|---|---|---|---|---|
| Linear weights | |||||
| 1 class | −651.67 | −624.03 | −649.39 | ||
| 2 class | −746.02 | −708.01 | −742.88 | p = .26 | p < .001 |
| 3 class | −799.91 | −751.53 | −795.90 | p = .41 | p < .001 |
| 4 class | −859.08 | −800.34 | −854.22 | p = .24 | p < .001 |
| 5 class | −882.28 | −813.18 | −876.57 | p = .83 | p = .95 |
| Linear + quadratic weights | |||||
| 1 class | −661.05 | −636.87 | −659.05 | ||
| 2 class | −813.08 | −775.07 | −809.93 | p < .05 | p < .001 |
| 3 class | −884.71 | −832.89 | −880.42 | p = .18 | p < .001 |
| 4 class | −918.21 | −845.65 | −912.21 | p = .73 | p ≦ .05 |
| 5 class | −961.55 | −875.17 | −954.40 | p = .34 | p = .36 |
Note. AIC = Akaike information criterion; BIC = Bayesian information criterion; SSBIC = sample-size-adjusted Bayesian information criterion; LRT = Lo–Mendell–Rubin test; BLRT = bootstrap likelihood ratio test. One- to five-class solutions were tested with linear and quadratic parameters.
This model demonstrated high posterior probability of correct class specification (entropy = .95). The largest class, resilient (76.7%), was characterized by low distress scores and a flat slope and quadratic term over all measurement points (EST/SEintercept = 1.82, p = .07; EST/SEslope = 0.94, p = .35; EST/SEquadratic = −0.97, p = .33; see Figure 1). The second largest class, reactive–worsening (15.8%), demonstrated consistent growth in distress that slowed slightly over time characterized by a significant slope and quadratic function (EST/SEintercept = −0.64, p = .53; EST/SEslope = 6.36, p < .001; EST/SEquadratic = −4.44, p < .001). The third largest class, chronic distress–recovering (4.6%), was characterized by a sharp increase to a peak at 24 months followed by a decrease in distress (EST/SEintercept = −7.49, p < .001; EST/SEslope = 19.15, p < .001; EST/SEquadratic = −18.19, p < .001). The smallest class, anticipatory distress–recovered (2.9%), demonstrated high initial distress during academy training that showed slow but consistent abatement over the 4 years (EST/SEintercept = 10.34, p < .001; EST/SEslope = −4.75, p < .001; EST/SEquadratic = −2.65, p < .01). Because 3% of the sample did not report exposure, we tested the model to assess whether we could identify the same trajectories with those individuals removed from the analysis. The solution was reproduced with comparable percentages of membership in each class and equivalent parameter estimates. As such, we continued to the conditional model with the full sample.
Figure 1.
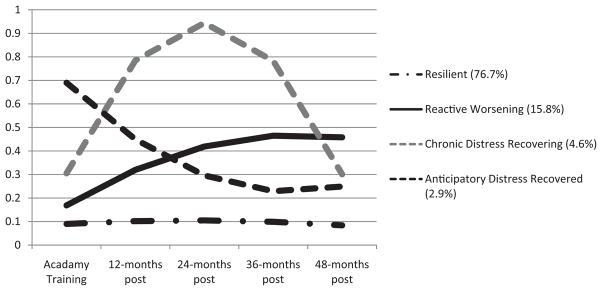
Four-class unconditional model of general distress (n = 234). Scores on the y-axis indicate estimated marginal means on the Symptom Checklist–90 General Symptom Index.
Conditional Model
First, we assessed whether demographics (age, gender, level of education) predicted trajectory membership. We regressed class membership on age and level of education as continuous variables and gender as a dummy-coded variable in a multinomial logistic regression nested in the LCGA model. None of these variables approached significance in the analysis. As such, they were removed from the analysis. Next, class membership was regressed on continuous levels of exposure to personally life threatening events at 12, 24, 36, and 48 months into active duty. This analysis precluded causal inferences as the covariates did not predate the trajectories. However, this approach provides useful information about differences between classes on levels of self-reported personal life-threat exposure. No differences among the four classes on total level of exposure to personal life threat across the four time points approached significance. Exposure variables were thus removed from the model. Following the same procedure, we assessed routine occupational stress in relation to the derived trajectories by regressing class membership on the WEI at 12, 24, 36, and 48 months into active duty. Once again, this analysis precluded causal inferences and, once again, we did not find a relationship between the classes and the WEI at each time point that approached significance.
Prior to testing our covariates in the model, we explored their level of correlation with baseline GSI assessed during academy training to determine their level of overlap. Positive emotion scores were not shown to significantly correlate with baseline GSI (r = .05, p = .45), whereas negative emotion scores were significantly correlated with baseline GSI (r = .56, p = .001). This high level of correlation between baseline GSI levels with negative emotion was a concern, as this may indicate that the measure of negative emotion is measuring the same underlying latent construct as the GSI. This lack of independence would preclude predictive modeling. However, as we have demonstrated that the GSI in this sample clusters into discrete distributions rather than a single normal distribution, this correlation may be uninformative as it is a measure of a linear association. As such, we proceeded with an additional step in which we examined the correlation between negative emotion and GSI at baseline within each class. GSI did not approach significance in correlation with PANAS negative emotion when examined within class, with the exception of the resilient class (r = .40, p < .001). This indicates that negative emotion is not simply a proxy for GSI but that negative emotion is associated with GSI only among individuals in a normal range of functioning. Next, to assess whether class was predicted by reported levels of positive and negative emotion during academy training, we regressed class membership on PANAS scores in a multinomial logistic regression. One case was removed because of missing data on the covariates. The addition of positive and negative emotion scores during training as covariates did not significantly alter the trajectory model but slightly altered the percentages of class membership (resilient = 72.0%; anticipatory distress–recovered = 3.5%; chronic distress–recovering = 4.8%; reactive-worsening = 19.7%). Compared with the resilient class, each of the other three classes demonstrated significantly or marginally significantly higher levels of self-reported negative emotion during academy training (anticipatory distress–recovered: EST/SE = 1.81, p < .07; chronic distress–recovering: EST/SE = 3.54, p < .001; reactive–worsening: EST/SE = 3.51, p < .001), but did not display significantly different levels of self-reported negative emotion when compared with each other. In terms of positive emotion, the reactive–worsening class demonstrated significantly lower levels of self-reported positive emotion during academy training compared with the resilient class (EST/SE = −2.44, p < .05), whereas all other classes demonstrated nonsignificant differences on self-reported positive emotion compared with the resilient class as well as to the other classes (see Table 2 for all class comparisons on covariates).
Table 2.
Multinomial Logistic Regression for Predictors of Class Membership (n = 233)
| Emotion | Class
|
|||||
|---|---|---|---|---|---|---|
| Reactive–worsening | Resilient vs. chronic distress–recovering | Anticipatory distress–recovered | Reactive–worsening vs. chronic distress–recovering | Anticipatory distress–recovered | Chronic distress–recovering vs. anticipatory distress–recovered | |
| Positive | −2.44* | −0.72 | −0.46 | 0.42 | 0.34 | 0.04 |
| Negative | 3.51** | 3.54** | 1.81+ | −1.33 | 0.65 | −0.05 |
Note. Positive = mean reported positive emotion levels on the Positive and Negative Affect Schedule; Negative = Mean reported negative emotion on the Positive and Negative Affect Schedule. Estimates/standard errors of the estimate are reported.
p = .07.
p < .05.
p < .01.
Next, as negative emotion and affect are associated with psychopathology (Watson et al., 1988), we assessed whether the negative emotion findings were driven by baseline levels of psychopathology in the modeled classes. To do this, we examined mean levels of both depression and anxiety as measured with the corresponding SCL-90-R index. With the exception of the anticipatory distress–recovered class, none of the modeled classes were within range of the clinical cutoff of 1 (Derogatis & Melisaratos, 1983) on either index (see Table 3). We further assessed PTSD symptom severity by class to better understand how these classes relate to emergent posttraumatic stress pathology. By conducting a one-way analysis of variance (ANOVA), we found that the classes differed significantly on levels of PTSD symptomatology at 12 months, F(3, 215) = 39.35, p < .001, at 24 months, F(3, 216) = 62.02, p < .001, at 36 months, F(3, 200) = 15.82, p < .001, and at 48 months, F(3, 137) = 9.16, p < .001. Post hoc tests using least squared difference demonstrated a large number of significant differences indicating that groups varied significantly from each other with regard to PTSD symptom severity (see Table 4). Of note, the resilient class consistently demonstrated near basal levels of PTSD symptom severity and consistently demonstrated significantly lower PTSD symptom severity compared with all other classes at 12 and 24 months, but demonstrated nonsignificant differences at 36 months compared with the anticipatory distress–recovered class and demonstrated nonsignificant differences at 48 months compared with the anticipatory distress–recovered and the chronic distress–recovering classes.
Table 3.
Means and Standard Deviations by Class on Anxiety and Depression Levels During Academy Training (n = 234)
| Variable | Resilient
|
Reactive– worsening
|
Chronic distress– recovering
|
Anticipatory distress– recovered
|
||||
|---|---|---|---|---|---|---|---|---|
| Mean | SD | Mean | SD | Mean | SD | Mean | SD | |
| Anxiety | 0.06 | 0.11 | 0.10 | 0.15 | 0.36 | 0.32 | 0.69 | 0.33 |
| Depression | 0.11 | 0.15 | 0.15 | 0.14 | 0.46 | 0.28 | 0.64 | 0.41 |
Note. Anxiety = Anxiety Index of the Symptom Checklist–90 —Revised; Depression = Depression Index of the Symptom Checklist–90 —Revised.
Table 4.
Comparison Between Classes on Posttraumatic Stress Disorder (PTSD) Symptom Severity
| Time point | Class
|
Post hoc | |||||||
|---|---|---|---|---|---|---|---|---|---|
| Resilient
|
Reactive– worsening
|
Chronic distress–recovering
|
Anticipatory distress–recovered
|
||||||
| Mean | SD | Mean | SD | Mean | SD | Mean | SD | ||
| 12 months | 18.48 | 2.91 | 21.63 | 5.00 | 32.70 | 13.29 | 25.29 | 7.11 | 1 < 2,3,4; 2 < 3,4; 3 > 4 |
| 24 months | 18.19 | 2.29 | 21.53 | 4.42 | 32.12 | 10.44 | 27.15 | 6.87 | 1 < 2,3,4; 2 < 3,4; 3 > 4 |
| 36 months | 18.90 | 2.29 | 25.65 | 11.83 | 28.50 | 7.72 | 19.25 | 2.87 | 1 < 2,3 |
| 48 months | 19.09 | 4.42 | 26.87 | 13.31 | 24.75 | 6.34 | 19.25 | 2.87 | 1 < 2; 2 > 4 |
Note. PTSD scores reflect mean-level scores by class on the PTSD Checklist—Military Version.
Discussion
In the current investigation, we explored the hypothesis that police officers, a group experiencing frequent personally life-threatening events and high levels of routine work stress, would conform to prototypical patterns of stress response (Bonanno, 2004) across the first 4 years of active duty. We found that by modeling trajectories from academy training (prior to active duty) through 4 years of active duty, officers closely conformed to these patterns, with the modal response being resilience characterized by a trajectory of consistently low stress from academy training through 48 months. We also found a chronic distress–recovering class, characterized by distress in the first 2 years of police service followed by full recovery to pre-exposure levels by 48 months. A class characterized by higher levels of anticipatory stress observed during academy training prior to active duty that decreased significantly following initiation of active duty was also replicated. Interestingly, similar trajectories have been observed in response to discrete stressors, whereas the current study followed a cohort exposed to repeated PTEs and routine work stressors. This may indicate that these patterns characterize adaptation to significant stressors regardless of whether they are discrete or chronic. Finally, we observed a class of officers who displayed increasing chronic stress. Whereas in civilians this class typically is characterized by an increase following a discrete stressor that then levels off, in a repeatedly exposed sample of police officers, we observed a pattern characterized by consistently increasing distress to 36 months before returning to baseline levels by 48 months. The observed trajectory patterns are consistent with those of PTSD symptom severity that we uncovered in officers following their first exposure to a PTE (Galatzer-Levy, Madan, et al., 2011); however, the proportions of individuals in the high-stress trajectories are greater in this instance. The one distinction is that we did not observe an anticipatory stress pattern because we did not measure PTSD symptom severity prior to exposure. This may indicate that PTSD symptom severity captures a similar phenomenon.
Next, we explored whether age, gender, level of education, exposure to PTEs, and work stressors predicted the trajectories. We further explored our primary hypothesis that higher levels of positive emotion and lower levels of negative emotion during academy training prior to exposure to PTEs and routine work environment stressors would lead to a resilient trajectory as demonstrated by differentiating the resilient class from other classes. First, we found that the demographics did not predict the trajectories. Although demographics have been shown to predict outcomes such as posttraumatic stress following a PTE (Brewin, Andrews, & Valentine, 2000), this sample did not have much variability in the demographics, especially in gender and level of education. Furthermore, although age demonstrated a normal distribution, the range was quite limited. This may help explain why these characteristics were not predictive in this instance.
Next, we found that the number of exposures to PTEs and reported levels of work stress did not differentiate classes. This finding is intriguing considering relatively consistent evidence for a “dose–response” relationship between levels of repeated exposure and aversive outcomes such as PTSD (Johnson & Thompson, 2008). However, many of these studies were conducted in the context of repeated exposure among refugees and soldiers who may not have access to the same daily resources and support to which police officers have access. Furthermore, dose–response findings typically examine a linear relationship between exposure and outcomes. However, as this study and many others show, outcomes following exposure do not follow a linear pattern; rather, outcomes are heterogeneous. As such, dose–response findings may be inaccurate as they test for a linear relationship under faulty assumptions about the nature of the outcome variable. A recent prospective study of heterogeneous trajectories among American soldiers deployed to Iraq and Afghanistan (single deployers, n = 3,393; multiple deployers, n = 4,394) found higher rates of resilience among the multiple deployers and higher rates of worsening chronic posttraumatic stress among single deployers (Bonanno et al., 2012). These findings and those presented in this study suggest that a more nuanced causal relationship may exist between exposure and distress outcomes.
Our hypothesis was only partially confirmed. We found that the resilient class demonstrated lower levels of negative emotion during training compared with the other classes. However, positive emotion predicted differences only between the resilient class and the reactive–worsening class, where the latter class demonstrated significantly less positive emotion during academy training. The two other classes demonstrated statistically equivalent levels of positive emotion when compared with the resilient class. This would indicate that whereas higher levels of negative emotion prospectively predicted multiple classes of higher distress outcomes compared with resilience, positive emotion distinguished only between the resilient class and those whose symptoms progressively worsened over time (reactive–worsening). The relative deficit in positive emotion in the reactive–worsening class provides some evidence that positive emotion may in fact serve an “undoing” or counterregulatory function, buffering against the emergence of stressor-related negative emotion, consistent with Fredrickson’s (1998, 2001) theory that positive emotion leads to healthy coping (Fredrickson et al., 2003). In contrast, experiencing lower levels of negative emotion prior to exposure distinguished a resilient outcome compared with all three symptomatic classes.
Several limitations must be acknowledged. A significant limitation is the use of self-reported emotion. The current investigation relied on the PANAS, in which individuals report their emotional experiences over a relatively long period of time. Significant discrepancies have been observed between self-reports of emotions individuals are currently experiencing and those they are not currently experiencing. This discrepancy is thought to be due to the distinction between emotions, which are episodic, experiential, and contextual, and beliefs about emotions, which are conceptual, semantic, and decontextualized (Robinson & Clore, 2002). As such, the current findings may better reflect participants’ beliefs about their emotional experience over the past year rather than accurate emotional experiences. Future studies should use data based on more empirical measures of emotion such as recorded facial expressions in response to an experimental paradigm. Furthermore, we did not examine specific emotions but rather broad categories of positive and negative emotion. In addition, the sample is specialized and may not generalize to all chronically stressed populations. Finally, patterns of general distress may not equate directly to specific stress-related psychopathology such as depression or PTSD.
Despite these limitations, the findings build on previous research and theory by providing evidence that positive and negative emotionality present prior to PTE exposure provide the groundwork for both healthy and maladaptive patterns of response to stress. Previous studies either have relied on relating emotionality to resilience as a trait (Fredrickson et al., 2003; Ong et al., 2006) or have related emotionality following the event to adaptation (Papa & Bonanno, 2008). Here, we provide evidence that variability in positive and negative emotion prior to exposure to significant stressors prospectively predicts patterns of adaptation following exposure. Most notably, higher levels of reported positive emotion prospectively predicted resilience, whereas lower levels predicted the development of chronic, worsening, and unabating distress. These two classes, resilient and reactive–worsening, were nondistinct in their levels of distress during academy training and were not differentiated by their level of exposure or work stress. The finding that higher levels of self-reported positive emotion prospectively predict distinct patterns of response prior to exposure provides some confirmation that positive emotion serves to promote resilience. Furthermore, the identification of prospective predictors, both positive and negative self-reported emotion, may provide information about individuals at the greatest risk for maladaptive stress responses, which can inform policy decisions concerning fitness for active duty, or may lead to better early identification of individuals in need of mental health services.
Contributor Information
Isaac R. Galatzer-Levy, Department of Psychiatry, New York University School of Medicine
Adam D. Brown, Department of Psychiatry, New York University School of Medicine
Clare Henn-Haase, Department of Psychiatry, New York University School of Medicine.
Thomas J. Metzler, Department of Psychiatry, San Francisco Veterans Affairs, San Francisco and University of California San Francisco
Thomas C. Neylan, Department of Psychiatry, San Francisco Veterans Affairs, San Francisco and University of California San Francisco
Charles R. Marmar, Department of Psychiatry, New York University School of Medicine
References
- Akaike H. Factor analysis and the AIC. Psychometrika. 1987;52:317–332. doi: 10.1007/BF02294359. [DOI] [Google Scholar]
- American Psychiatric Association. Diagnostic and statistical manual of mental disorders. 4. Washington, DC: Author; 2000. text rev. [Google Scholar]
- Axelbend M, Vaile J. South Florida’s approach to police stress management. Police Stress. 1979;1:13–14. [Google Scholar]
- Bonanno GA. Loss, trauma, and human resilience: Have we underestimated the human capacity to thrive after extremely aversive events? American Psychologist. 2004;59:20–28. doi: 10.1037/0003-066X.59.1.20. [DOI] [PubMed] [Google Scholar]
- Bonanno GA, Brewin CR, Kaniasty K, Greca AML. Weighing the costs of disaster. Psychological Science in the Public Interest. 2010;11:1–49. doi: 10.1177/1529100610387086. [DOI] [PubMed] [Google Scholar]
- Bonanno GA, Ho SM, Chan JC, Kwong RS, Cheung CK, Wong CP, Wong VC. Psychological resilience and dysfunction among hospitalized survivors of the SARS epidemic in Hong Kong: A latent class approach. Health Psychology. 2008;27:659–667. doi: 10.1037/0278-6133.27.5.659. [DOI] [PubMed] [Google Scholar]
- Bonanno GA, Mancini AD, Horton JL, Powell TM, Leardmann CA, Boyko EJ Millennium Cohort Study Team. Trajectories of trauma symptoms and resilience in deployed U.S. military service members: Prospective cohort study. British Journal of Psychiatry. 2012;200:317–323. doi: 10.1192/bjp.bp.111.096552. [DOI] [PubMed] [Google Scholar]
- Bonanno GA, Rennicke C, Dekel S. Self-enhancement among high-exposure survivors of the September 11th terrorist attack: Resilience or social maladjustment? Journal of Personality and Social Psychology. 2005;88:984–998. doi: 10.1037/0022-3514.88.6.984. [DOI] [PubMed] [Google Scholar]
- Bonanno GA, Wortman CB, Nesse RM. Prospective patterns of resilience and maladjustment during widowhood. Psychology and Aging. 2004;19:260–271. doi: 10.1037/0882-7974.19.2.260. [DOI] [PubMed] [Google Scholar]
- Brewin CR, Andrews B, Valentine JD. Meta-analysis of risk factors for posttraumatic stress disorder in trauma-exposed adults. Journal of Consulting and Clinical Psychology. 2000;68:748–766. doi: 10.1037/0022-006X.68.5.748. [DOI] [PubMed] [Google Scholar]
- Darwin C. The expression of emotion in man and animals. London, UK: John Murray; 1872. [DOI] [Google Scholar]
- Derogatis LR, Melisaratos N. The Brief Symptom Inventory: An introductory report. Psychological Medicine. 1983;13:595–605. doi: 10.1017/S0033291700048017. [DOI] [PubMed] [Google Scholar]
- de Roon-Cassini TA, Mancini AD, Rusch MD, Bonanno GA. Psychopathology and resilience following traumatic injury: A latent growth mixture model analysis. Rehabilitation Psychology. 2010;55:1–11. doi: 10.1037/a0018601. [DOI] [PubMed] [Google Scholar]
- Dickstein BD, Suvak M, Litz BT, Adler AB. Heterogeneity in the course of posttraumatic stress disorder: Trajectories of symptomatology. Journal of Traumatic Stress. 2010;23:331–339. doi: 10.1002/jts.20523. [DOI] [PubMed] [Google Scholar]
- Duncan TE, Duncan SC, Strycker LA. An introduction to latent variable growth curve modeling: Concepts, issues, and applications. 2. Mahwah, NJ: Erlbaum; 2006. [Google Scholar]
- Ekman P. Facial expression and emotion. American Psychologist. 1993;48:384–392. doi: 10.1037/0003-066X.48.4.384. [DOI] [PubMed] [Google Scholar]
- Fredrickson BL. What good are positive emotions? Review of General Psychology. 1998;2:300–319. doi: 10.1037/1089-2680.2.3.300. [DOI] [PMC free article] [PubMed] [Google Scholar]
- Fredrickson BL. The role of positive emotions in positive psychology: The broaden-and-build theory of positive emotions. American Psychologist. 2001;56:218–226. doi: 10.1037/0003-066X.56.3.218. [DOI] [PMC free article] [PubMed] [Google Scholar]
- Fredrickson BL, Mancuso RA, Branigan C, Tugade MM. The undoing effect of positive emotions. Motivation and Emotion. 2000;24:237–258. doi: 10.1023/A:1010796329158. [DOI] [PMC free article] [PubMed] [Google Scholar]
- Fredrickson BL, Maynard KE, Helms MJ, Haney TL, Siegler IC, Barefoot JC. Hostility predicts magnitude and duration of blood pressure response to anger. Journal of Behavioral Medicine. 2000;23:229–243. doi: 10.1023/A:1005596208324. [DOI] [PubMed] [Google Scholar]
- Fredrickson BL, Tugade MM, Waugh CE, Larkin GR. What good are positive emotions in crises? A prospective study of resilience and emotions following the terrorist attacks on the United States on September 11th, 2001. Journal of Personality and Social Psychology. 2003;84:365–376. doi: 10.1037/0022-3514.84.2.365. [DOI] [PMC free article] [PubMed] [Google Scholar]
- Galatzer-Levy IR, Bonanno GA. Beyond normality in the study of bereavement: Heterogeneity in depression outcomes following loss in older adults. Social Science & Medicine. 2012;74:1987–1994. doi: 10.1016/j.socscimed.2012.02.022. [DOI] [PMC free article] [PubMed] [Google Scholar]
- Galatzer-Levy IR, Bonanno GA, Mancini AD. From marianthal to latent growth mixture modeling: A return to the exploration of individual differences in response to unemployment. Journal of Neuroscience, Psychology, and Economics. 2010;3:116–125. doi: 10.1037/a0020077. [DOI] [Google Scholar]
- Galatzer-Levy IR, Madan A, Neylan TC, Henn-Haase C, Marmar CR. Peritraumatic and trait dissociation differentiate police officers with resilient versus symptomatic trajectories of posttraumatic stress symptoms. Journal of Traumatic Stress. 2011;24:557–565. doi: 10.1002/jts.20684. [DOI] [PMC free article] [PubMed] [Google Scholar]
- Galatzer-Levy IR, Mazursky H, Mancini AD, Bonanno GA. What we don’t expect when expecting: Evidence for heterogeneity in subjective well-being in response to parenthood. Journal of Family Psychology. 2011;25:384–392. doi: 10.1037/a0023759. [DOI] [PubMed] [Google Scholar]
- Gershon RRM, Lin S, Li X. Work stress in aging police officers. Journal of Occupational and Environmental Medicine. 2002;44:160–167. doi: 10.1097/00043764-200202000-00011. [DOI] [PubMed] [Google Scholar]
- Gross JJ, Fredrickson BL, Levenson RW. The psychophysiology of crying. Psychophysiology. 1994;31:460–468. doi: 10.1111/j.1469-8986.1994.tb01049.x. [DOI] [PubMed] [Google Scholar]
- Johnson H, Thompson A. The development and maintenance of post-traumatic stress disorder (PTSD) in civilian adult survivors of war trauma and torture: A review. Clinical Psychology Review. 2008;28:36–47. doi: 10.1016/j.cpr.2007.01.017. [DOI] [PubMed] [Google Scholar]
- Keltner D, Haidt J. Social functions of emotions at four levels of analysis. Cognition & Emotion. 1999;13:505–521. doi: 10.1080/026999399379168. [DOI] [Google Scholar]
- Lam WW, Bonanno GA, Mancini AD, Ho S, Chan M, Hung WK, Fielding R. Trajectories of psychological distress among Chinese women diagnosed with breast cancer. Psycho-Oncology. 2010;19:1044–1051. doi: 10.1002/pon.1658. [DOI] [PubMed] [Google Scholar]
- Le Brocque RM, Hendrikz J, Kenardy JA. The course of posttraumatic stress in children: Examination of recovery trajectories following traumatic injury. Journal of Pediatric Psychology. 2010;35:637–645. doi: 10.1093/jpepsy/jsp050. [DOI] [PubMed] [Google Scholar]
- Levenson RW, Ekman P, Friesen WV. Voluntary facial action generates emotion-specific autonomic nervous system activity. Psychophysiology. 1990;27:363–384. doi: 10.1111/j.1469-8986.1990.tb02330.x. [DOI] [PubMed] [Google Scholar]
- Liberman A, Best S, Metzler T, Fagan J, Weiss D, Marmar C. Routine occupational stress and psychological distress in police. Policing: An International Journal of Police Strategies and Management. 2002;25:421–441. doi: 10.1108/13639510210429446. [DOI] [Google Scholar]
- Lo Y, Mendell N, Rubin D. Testing the number of components in a normal mixture. Biometrika. 2001;88:767–778. doi: 10.1093/biomet/88.3.767. [DOI] [Google Scholar]
- Maguen S, Metzler TJ, McCaslin SE, Inslicht SS, Henn-Haase C, Neylan TC, Marmar CR. Routine work environment stress and PTSD symptoms in police officers. Journal of Nervous and Mental Disease. 2009;197:754–760. doi: 10.1097/NMD.0b013e3181b975f8. [DOI] [PMC free article] [PubMed] [Google Scholar]
- Marmar C, McCaslin SE, Metzler T, Best S, Weiss DS, Fagan J, Neylan T. Predictors of posttraumatic stress in police and other first responders. Annals of the New York Academy of Sciences. 2006;1071:1–18. doi: 10.1196/annals.1364.001. [DOI] [PubMed] [Google Scholar]
- McCaslin SE, Inslicht SS, Metzler TJ, Henn-Haase C, Maguen S, Neylan TC, Marmar CR. Trait dissociation predicts posttraumatic stress disorder symptoms in a prospective study of urban police officers. Journal of Nervous and Mental Disease. 2008;196:912–918. doi: 10.1097/NMD.0b013e31818ec95d. [DOI] [PMC free article] [PubMed] [Google Scholar]
- Muthén LK, Muthén B. Mplus user’s guide. 4. Los Angeles, CA: Author; 2006. [Google Scholar]
- Neylan TC, Metzler TJ, Best SR, Weiss DS, Fagan JA, Liberman A, Marmar CR. Critical incident exposure and sleep quality in police officers. Psychosomatic Medicine. 2002;64:345–352. doi: 10.1097/00006842-200203000-00019. [DOI] [PubMed] [Google Scholar]
- Nylund KL, Asparouhov T, Muthén BO. Deciding on the number of classes in latent class analysis and growth mixture modeling: A Monte Carlo simulation study. Structural Equation Modeling. 2007;14:535–569. doi: 10.1080/10705510701575396. [DOI] [Google Scholar]
- Öhman A. The role of the amygdala in human fear: Automatic detection of threat. Psychoneuroendocrinology. 2005;30:953–958. doi: 10.1016/j.psyneuen.2005.03.019. [DOI] [PubMed] [Google Scholar]
- Ong AD, Bergeman CS, Bisconti TL, Wallace KA. Psychological resilience, positive emotions, and successful adaptation to stress in later life. Journal of Personality and Social Psychology. 2006;91:730–749. doi: 10.1037/0022-3514.91.4.730. [DOI] [PubMed] [Google Scholar]
- Papa A, Bonanno GA. Smiling in the face of adversity: The interpersonal and intrapersonal functions of smiling. Emotion. 2008;8:1–12. doi: 10.1037/1528-3542.8.1.1. [DOI] [PubMed] [Google Scholar]
- Robinson MD, Clore GL. Belief and feeling: Evidence for an accessibility model of emotional self-report. Psychological Bulletin. 2002;128:934–960. doi: 10.1037/0033-2909.128.6.934. [DOI] [PubMed] [Google Scholar]
- Tugade MM, Fredrickson BL. Resilient individuals use positive emotions to bounce back from negative emotional experiences. Journal of Personality and Social Psychology. 2004;86:320–333. doi: 10.1037/0022-3514.86.2.320. [DOI] [PMC free article] [PubMed] [Google Scholar]
- Tugade MM, Fredrickson BL, Feldman Barrett L. Psychological resilience and positive emotional granularity: Examining the benefits of positive emotions on coping and health. Journal of Personality. 2004;72:1161–1190. doi: 10.1111/j.1467-6494.2004.00294.x. [DOI] [PMC free article] [PubMed] [Google Scholar]
- Violanti JM. Trends in police suicide. Psychological Reports. 1995;77:688–690. doi: 10.2466/pr0.1995.77.2.688. [DOI] [PubMed] [Google Scholar]
- Wang Z, Inslicht SS, Metzler TJ, Henn-Haase C, McCaslin SE, Tong H, Marmar CR. A prospective study of predictors of depression symptoms in police. Psychiatry Research. 2010;175:211–216. doi: 10.1016/j.psychres.2008.11.010. [DOI] [PMC free article] [PubMed] [Google Scholar]
- Watson D, Clark LA, Tellegen A. Development and validation of brief measures of positive and negative affect: The PANAS scales. Journal of Personality and Social Psychology. 1988;54:1063–1070. doi: 10.1037/0022-3514.54.6.1063. [DOI] [PubMed] [Google Scholar]
- Weathers FW, Litz BT, Herman JA, Huska JA, Keane TM. The PTSD Checklist (PCL): Reliability, validity and diagnostic utility. Paper presented at the ninth Annual Conference of the International Society for Traumatic Stress Studies; San Antonio, TX. 1993. Dec, [Google Scholar]
- Weiss DS, Brunet A, Best SR, Metzler TJ, Liberman A, Pole N, Marmar CR. Frequency and severity approaches to indexing exposure to trauma: The Critical Incident History Questionnaire for police officers. Journal of Traumatic Stress. 2010;23:734–743. doi: 10.1002/jts.20576. [DOI] [PMC free article] [PubMed] [Google Scholar]