

Abstract
APOBEC3G belongs to a family of DNA cytosine deaminases that are involved in the restriction of a broad number of retroviruses including HIV-1. Prior studies have identified two distinct mechanistic steps in Vif-deficient HIV-1 restriction: packaging into virions and deaminating viral cDNA. APOBEC3A, for example, although highly active, is not packaged and is therefore not restrictive. APOBEC3G, on the other hand, although having weaker enzymatic activity, is packaged into virions and is strongly restrictive. Although a number of studies have described the propensity for APOBEC3 oligomerization, its relevance to HIV-1 restriction remains unclear. Here, we address this problem by examining APOBEC3 oligomerization in living cells using molecular brightness analysis. We find that APOBEC3G forms high-order multimers as a function of protein concentration. In contrast, APOBEC3A, APOBEC3C and APOBEC2 are monomers at all tested concentrations. Among other members of the APOBEC3 family, we show that the multimerization propensities of APOBEC3B, APOBEC3D, APOBEC3F, and APOBEC3H (haplotype II) bear more resemblance to APOBEC3G than to APOBEC3A/3C/2. Prior studies have shown that all of these multimerizing APOBEC3 proteins, but not the monomeric family members, have the capacity to package into HIV-1 particles and restrict viral infectivity. This correlation between oligomerization and restriction is further evidenced by two different APOBEC3G mutants, which are each compromised for multimerization, packaging, and HIV-1 restriction. Overall, our results imply that multimerization of APOBEC3 proteins may be related to the packaging mechanism and ultimately to virus restriction.
Keywords: APOBEC3G, brightness, fluorescence fluctuation spectroscopy, molecular mass complex, mobility
Introduction
APOBEC3G (A3G) is one of seven APOBEC3 (A3) proteins and one of a total of eleven family members capable of being expressed by human cells1. A3G has been studied intensively because it was the first family member shown to block Vif-deficient HIV-1 replication2. Current working models suggest a two-stage mechanism (reviewed recently3–5). First, A3G is thought to package into viral particles through an RNase sensitive interaction with the viral structural protein Gag. Second, A3G compromises the integrity of the virus by deaminating cDNA cytosines to uracils and by interfering with the progression of reverse transcription. Negative-strand uracils template the insertion of plus-strand adenines and account for the well-documented phenomenon of G-to-A hypermutation. APOBEC3D (A3D), APOBEC3F (A3F), and stable APOBEC3H (A3H) haplotypes are thought to restrict HIV-1 through a similar two-step mechanism. APOBEC3B (A3B) is able restrict HIV-1 replication in some cell types (293, HeLa), but not in T cell lines such as CEM-SS and SupT1. In contrast, APOBEC3A (A3A) and APOBEC3C (A3C) as well as more distantly related family members AID, APOBEC1, APOBEC2 (A2), and APOBEC4 are unable to interfere with HIV-1 replication. Inactivity is presumed to be mostly due to a failure to package because these proteins are less efficiently detected in viral particles by immunoblotting, even in the context of over-expression. Moreover, a normally non-restrictive DNA deaminase such as A3A can be targeted to viral particles through fusion to Vpr or the N-terminal half of A3G (the RNA-interacting packaging domain), with the result being potent restriction and hypermutation6,7.
An unresolved problem in APOBEC3 biology is the role of oligomerization. Many studies have reported A3G-A3G interaction through co-immunoprecipitation8–11. Self-association has also been reported using yeast two-hybrid experiments and bimolecular fluorescence complementation studies8,12. Density gradient separation of cytoplasmic components has also indicated that A3G can exist in a variety of states from low mass (<100 kDa) to extremely high mass complexes (~1 MDa)13–18. Structural, biochemical, and single molecule biophysical approaches have shown a range of entities from monomers up to very large oligomers14,19–23. Finally, microscopy studies of living and fixed cells have documented A3G in bright cytoplasmic bodies, which presumably constitute aggregations of large numbers of monomeric units16,24–30.
Fluorescence fluctuation spectroscopy (FFS) is a biophysical method for quantifying protein association directly inside the living cell31. The technique relies on a small optical observation volume created within the cell. Fluorescently labeled proteins randomly passing through the observation volume give rise to fluctuations in the recorded fluorescence signal32. These fluctuations carry information about the concentration, mobility, and stoichiometry of the labeled protein, which are extracted with statistical analysis methods33. The most widely used approach is based on autocorrelation analysis of the fluorescence, which is also known as fluorescence correlation spectroscopy (FCS), and determines dynamic processes, such as diffusion, from the fluctuations34,35. However, diffusional mobility of proteins only provides a qualitative measure of their interactions in cells. Thus, this study will rely mainly on brightness, an FFS parameter with the ability to quantify protein complex formation36.
In this study, we perform FFS experiments on EGFP-labeled A3 proteins to characterize their multimerization behavior directly inside the cell. Our results indicate that A3 proteins can be broadly classified into two categories: A3 proteins that show pronounced multimerization and A3 proteins that lack multimerization. We extended A3G characterizations to include two different mutants, which have been reported to lack multimerization capabilties as well as activities associated with oligomerization10,30,37. Taken together, our studies reveal an interesting correlation between multimerization and viral packaging of A3 proteins. Only A3 proteins that show pronounced multimerization seem to be packaged efficiently into HIV virions. Because packaging into the virion is a prerequisite for the restriction activity of A3 proteins38–40, the ability to multimerize appears to be of importance for function as HIV-1 restriction enzymes.
Results
Molecular brightness quantifies protein associations in living cells
Brightness is a unique parameter that relies on the single molecule sensitivity of fluorescence fluctuation spectroscopy and provides the average fluorescence signal contributed by a single molecule passing through the optical observation volume. The brightness of a cellular protein tagged with EGFP reveals its oligomeric state. A monomeric protein will carry the same brightness as the fluorescent protein alone. However, if two of the monomers associate to form a dimeric complex, then the brightness of the complex is doubled as illustrated in Fig. 1a. Because brightness scales linearly with the number of labeled proteins in the complex, it is convenient to measure brightness relative to that of EGFP alone. Thus, a monomer results in a brightness of 1, while a dimer has a value of 2.
Fig. 1.
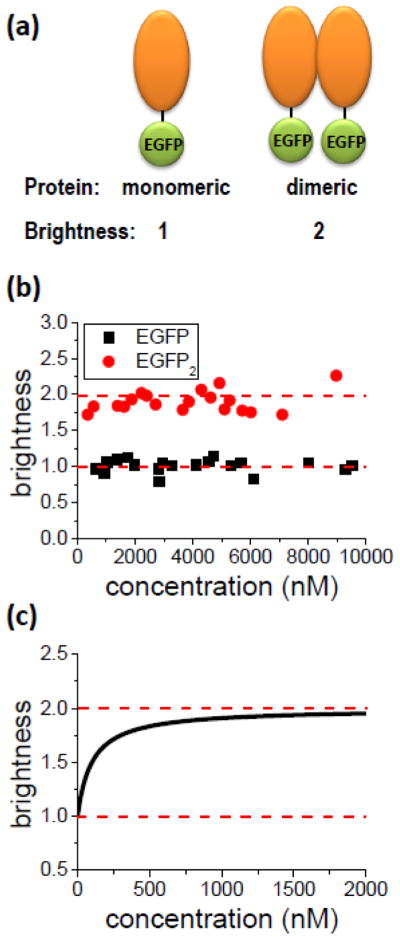
Brightness and Stoichiometry. (A) A fluorescent protein with a brightness λ is attached to the protein of interest. The brightness of the labeled monomeric protein is identical to that of the fluorescent protein alone. Dimerization of the monomers leads to a doubling of the brightness, because the dimer carries two fluorescent proteins. (B) Brightness of monomeric EGFP (squares) and the dimeric EGFP2 (circles) in the cytoplasm of U2OS cells. The control experiment demonstrates that the brightness of the label EGFP is concentration independent and that brightness doubling is observed for EGFP2. Each data point represents the brightness measured in a different cell expressing either EGFP or EGFP2. The average brightness of EGFP is 1 ± 0.06, while the average normalized brightness EGFP2 is 1.90 ± 0.10. (C) Brightness titration experiment. Schematic representation of the brightness for a monomer-dimer transition of a labeled protein as a function of its concentration. At low concentrations the equilibrium is shifted towards monomers, which results in a brightness close to 1. High concentrations favor the dimer, which is characterized by a brightness of 2. At intermediate concentrations the brightness is between 1 and 2, which indicates the presence of a mixture of monomers and dimers.
FFS experiments not only determine brightness, but also the concentration of the labeled protein. This feature allows us to explore changes in the oligomeric state of a protein as a function of its concentration. For example, the brightness of EGFP measured in the cytoplasm of U2OS cells was 1 at all measured concentrations (Fig. 1b), demonstrating the well-known monomeric nature of the protein. Similarly, a recombinant tandem EGFP, which we used as a control to mimic a dimeric complex, gave rise to a concentration-independent brightness of 2 (Fig. 1b). These controls demonstrate that brightness provides a quantitative measure of the number of EGFP-labels within a protein complex.
Cellular proteins that form homo-complexes give rise to concentration-dependent changes in brightness. This concept is illustrated in Fig. 1c for a protein with a monomer-dimer transition. The protein is monomeric at low concentration, which corresponds to a starting brightness value of 1. At high concentration the brightness reaches the value 2, which represents the dimeric protein. The concentration-dependent increase in brightness provides a direct visualization of the gradual shift in protein population from a monomer to a dimer. Thus, FFS provides a unique way to determine the binding curve and stoichiometry of proteins in cells. We refer to experiments that measure brightness as a function of concentration as brightness titration experiments. Such FFS studies have been used to characterize homo- and hetero-oligomers in cells41,42.
Concentration-dependent A3G multimerization in living cells
Transfected U2OS cells were identified by epi-fluorescence microscopy and subsequently measured with two-photon excitation. The recorded fluorescence counts were analyzed to recover the brightness and concentration. Each experiment consisted of measuring in excess of 20 transfected cells expressing A3G-EGFP at different levels to cover a wide range of protein concentrations. Figure 2a shows the brightness as a function of A3G-EGFP concentration. Brightness is graphed on a logarithmic scale to clearly display large and small brightness values. To examine the reproducibility of the result we repeated brightness titration experiments multiple times. These experiments were performed on different days with newly prepared cells. Each experiment is identified by a Roman numeral as indicated in the legend. The brightness values of A3G-EGFP scattered, but all five experiments lead to brightness curves that overlap within the intrinsic scatter. Furthermore, the variance of the scatter was approximately constant for all experiments. Thus, the brightness of A3G in U2OS cells was reproducible from day to day within experimental error. We took these five experiments and interpolated an averaged curve (black solid line in Fig. 2a) that described the concentration dependent brightness of A3G. The interpolated curve serves as a condensed representation of the experimental data. As can be seen in Fig. 2a, the brightness of A3G exhibited a clear increase as a function of concentration. It initially started at a low value and reached ~10 at a concentration of 1 μM. Even at the lowest measured concentrations (~50 nM) the brightness was slightly above one indicating the presence of a small population of multimers. Note that brightness experiments intentionally cover a wide concentration range. Examining proteins at high, non-physiological concentrations helps to populate multimers, which are not readily observed at low concentrations where their population is small.
Fig. 2.
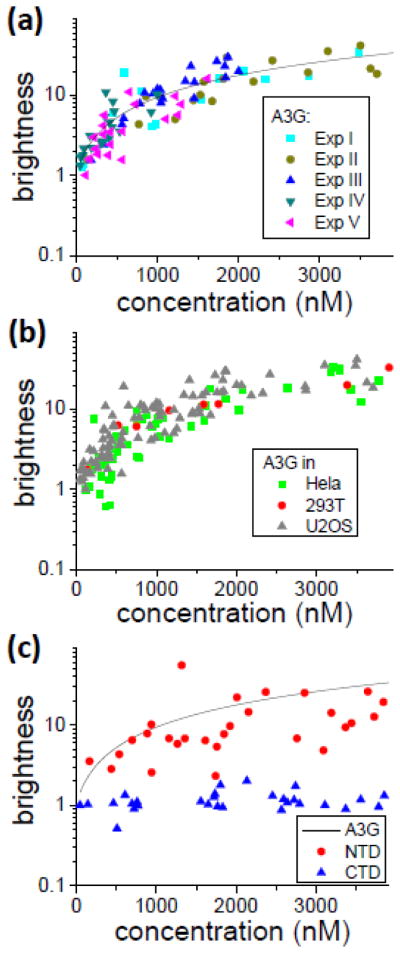
Multimerization of A3G-EGFP (A) Brightness titration experiments of A3G-EGFP in U2OS cells. Five independent experiments are displayed to illustrate the repeatability. The solid line is the average brightness curve for A3G determined by interpolation of the experimental data. (B) Brightness titration for A3G-EGFP in three different cell lines. (C) Brightness titration experiments with A3G-NTD-EGFP (●) and A3G-CTD-EGFP (▲). The solid line depicts the average brightness of full-length A3G-EGFP for comparison.
We further explored whether the multimerization of A3G-EGFP was cell line dependent by performing equivalent brightness titration measurements in both HeLa and 293T cell lines (Fig. 2b). The brightness values from U2OS cells are shown as solid triangles for comparison with the results from multiple HeLa cell experiments (squares), and a single experiment in 293T cells (circles). We observed that the multimerization of A3G was very similar across all the examined cell lines.
We next explored whether the multimerization of A3G was tied to one of its two domains by FFS experiments. The brightness of A3G-CTD-EGFP had a value of ~1 at every concentration examined, demonstrating that A3G-CTD-EGFP was monomeric (Fig. 2c), which agrees with earlier studies23,43,44. While A3G-CTD-EGFP appeared monomeric, the brightness of A3G-NTD-EGFP was close to that of full-length A3G (Fig. 2c). We concluded that the main determinants of A3G multimerization reside within the NTD. However, because the NTD brightness titration was slightly reduced compared to that of the full-length protein, our data indicate that the CTD may provide a supporting role in the multimerization of A3G, which is in agreement with in vitro studies that reveal CTD self-interaction at higher protein concentrations43,45.
Autocorrelation function characterizes the mobility of protein complexes
The same experimental fluctuations that determine the brightness were also used to calculate the autocorrelation function. The decay of the autocorrelation characterizes the diffusional mobility of the protein. The average time for a labeled protein complex to pass through the optical observation volume is its residence time, which is characterized by the time period over which the fluctuation amplitude decays to one half the original value. A larger protein mass leads to a decrease in mobility and therefore to an increase in the residence time. In addition, transient interaction of the complex with other cellular factors, such as RNA, reduces the mobility and increases the residence time. Table 1 displays the average residence time (0.91 ms) of monomeric EGFP in the cytoplasm of U2OS cells. Dimeric EGFP2 resulted in a residence time of 1.15, which was 1.25 times higher than the monomeric residence time and in good agreement with the estimated increase by a factor of 1.26 according to the Stokes-Einstein relation assuming spherical proteins. We determined the residence time of A3G-EGFP from the same data used for brightness analysis. The residence time exhibited a concentration dependent decrease in mobility. For simplicity, we reported the average residence time from all data with concentrations between 200 nM and 1000 nM. The recovered average residence time was 50 ± 20 ms (mean ± standard deviation, Table 1), which is ~50 times longer than EGFP, indicating the presence of large complexes. On the other hand, the average residence time of the A3G-CTD-EGFP was 1.8 ± 1.2 ms, a value close to that of EGFP, indicating that the CTD lacked the ability to form large complexes (Table 1). The residence time of A3G-NTD-EGFP was 90 ± 60 ms, which was similar to that of full-length A3G-EGFP (Table 1).
Table 1.
The average residence time of EGFP-labeled APOBEC proteins determined from the autocorrelation function.
| Construct | Residence time (ms)a |
|---|---|
| EGFP | 0.91 (s = 0.2) |
| EGFP2 | 1.15 (s = 0.2) |
|
| |
| A2-EGFP | 1.2 (s = 0.2) |
| A3A-EGFP | 1.4 (s= 0.3) |
|
| |
| A3C-EGFP | 8 (s = 2) |
|
| |
| A3G-EGFP | 50 (s = 20) |
| A3G-EGFP (c < 200nM) | 30 (s = 10) |
| A3G-EGFP CTD | 1.8 (s = 1.2) |
| A3G-EGFP NTD | 90 (s = 60) |
| A3G-EGFP E259Q | 60 (s = 30) |
| A3G-EGFP C97A | 9 (s = 8) |
|
| |
| A3B-EGFP | 100 (s = 60) |
| A3D-EGFP | 120 (s = 90) |
| A3F-EGFP | 120 (s = 80) |
| A3H-EGFP | 110 (s = 70) |
the average and standard deviation are calculated from cells expressing protein between 200 nM and 1000 nM unless otherwise noted.
FFS analyses of APOBEC2 and other APOBEC3 proteins
There are seven members in the A3 family: A3A, A3B, A3C, A3D, A3F, A3G and A3H. Before we characterized their multimerization in cells with brightness analysis, we briefly examined APOBEC2 (A2), because recent studies reported that the protein is monomeric under in vitro conditions46. A brightness titration curve of A2 labeled with EGFP expressed in U2OS cells identified a brightness of ~1 at all measured concentrations (Fig. 3a), which established that A2 exists as a cytoplasmic monomer. Autocorrelation analysis further revealed the absence of large protein complexes (Table 1).
Fig. 3.

Brightness titration experiments in U2OS cells of (A) A2-EGFP (●), (B) A3A-EGFP (●) and A3C-EGFP (▲), (C) A3B-EGFP and (D) A3D-EGFP (●), A3F-EGFP (◆) and A3H-EGFP (▲). The solid line is the averaged A3G brightness and the dash line indicates the brightness of a monomer.
We examined the multimerization of A3A and A3C. Brightness titration data of these proteins tagged with EGFP are summarized in Fig. 3b. A3A displayed a brightness value of ~1 throughout the experimental concentration range with little scatter. The brightness of A3C below 1 μM followed the behavior of A3A and only monomeric brightness values were observed. At concentrations exceeding 1 μM A3C displayed more brightness scatter than A3A. Although the average A3C brightness tended to be larger than 1 at high concentrations, the values were still small when compared to A3G. Thus, A3A and A3C exhibited behavior that was distinctly different from A3G, because strong multimerization was absent in these two proteins. Since the brightness is ~1 at concentrations below 1 μM, we classified A3A and A3C as predominantly monomeric. The average residence time of A3A from autocorrelation analysis was close to that of A2 (Table 1), signaling the absence of large protein complexes. While the residence time of A3C (Table 1) was much smaller than for A3G, it nevertheless was significantly larger than for A2 and A3A, indicating the presence of A3C in complexes (i.e. interactions with unlabeled cellular proteins such as TRB347,48).
Next we investigated the multimerization of A3B tagged with EGFP. The brightness titration of A3B in U2OS cells revealed a significant brightness increase with protein concentration (Fig. 3c). Brightness started close to 1 at low concentrations, increased to ~4 at 1 μM and reached values of ~10 at high concentrations. Despite the clear demonstration of multimerization, the brightness values of A3B were lower than the brightness observed for A3G. Finally, we turned our attention to the proteins A3D, A3F and A3H. We performed brightness titration experiments on each of these proteins tagged with EGFP. Fig. 3d displays their brightness values along with the interpolated A3G brightness curve. Each of the proteins featured a strong increase in brightness with concentration. Furthermore, the brightness values of all three proteins were, within experimental scatter, indistinguishable. Comparison with the interpolated A3G binding curve and the data in Fig. 2a demonstrate that the brightness of A3D, A3H and A3F show very good agreement with A3G both in average value and in their degree of scatter. The mobility of EGFP-labeled A3B/D/F/H ranged from 100 to 120 ms (Table 1), which given the large scatter of more than 60 ms is comparable to the slow mobility of A3G-EGFP and indicative of participation in larger mass complexes.
Multimerization, packaging, and Vif-deficient HIV restriction of A3G mutants
It is known that the degree of multimerization of A3G is sensitive to RNase treatment, suggesting that RNA plays an important role in stabilizing the multimerization of A3G8,10,12,14,18,22,49,50. Because mutation at the N-terminal zinc-coordinating motif from cysteine 97 to alanine reduces the multimerization of A3G to a monomer10, we investigated the multimerization state of the A3G-C97A mutant directly inside cells by measuring the brightness of the mutant tagged with EGFP. The brightness titration data of A3G-C97A exhibited monomeric brightness at concentrations below ~1μM (Fig. 4a). Above this concentration we observed a slight scatter in brightness with values ranging between 1 and 3, which was nevertheless small compared to wildtype A3G. For comparison, we also performed a brightness titration experiment on another mutant, E259Q, which is known to be catalytically inactive, but otherwise behaves very similarly to wildtype A3G. The brightness of A3G-E259Q-EGFP is displayed in Fig. 4a along with the interpolated brightness curve of wildtype A3G. These data show that the brightness of A3G-EGFP was unaffected by the E259Q mutation, but severely affected by the C97A mutation. Autocorrelation comparisons of the two mutants identified a residence time of A3G-E259Q-EGFP that was virtually unchanged from wildtype, while the residence time of A3G-C97A-EGFP was significantly reduced compared to wildtype (Table 1).
Fig. 4.
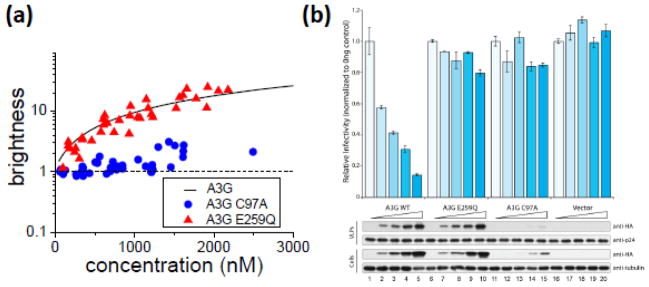
A3G-EGFP mutants C97A and E259Q (A) Brightness titration of A3G-E259Q-EGFP (▲) and A3G-C97A-EGFP (●) in U2OS cells. The solid line is the average A3G-EGFP brightness and the dashed line marks the monomeric brightness. (B) The restrictive activity of A3G and mutants as assessed by a single cycle infectivity assay. Viral infectivity was measured as the percentage of fluorescent-positive CEM-GFP reporter cells normalized to results for 0 ng of A3G construct. Error bars indicate the standard deviation from duplicate experiments. (C) Representative immunoblots from one of five experiments. A3G-3xHA expression in producer 293T cells and packaging in viral particles were detected by anti-HA antibody. Anti-tubulin and anti-p24 served as loading controls in cell lysates and viral particles respectively.
We next performed single-cycle Vif-deficient HIV-1 infectivity assays to compare the packaging and restriction potential of A3G-C97A and A3G-E259Q versus wildtype A3G (Fig. 4b). As shown in several prior studies, wildtype A3G packages and restricts Vif-deficient HIV-1 infectivity in a dose-dependent manner. Also in agreement with prior studies, A3G-E259Q packaged in a manner that is indistinguishable from wildtype A3G but it did not restrict virus infectivity38–40. In contrast, A3G-C97A was expressed poorly in cells, showed a diminished capacity to package, and had negligible Vif-deficient HIV-1 restriction activity (Fig. 4b, lanes 2 and 15 show near equivalent amounts of cellular A3G, but differential levels of packaged protein; see Supplemental Figure 1 for quantification summary). An additional A3G mutant (Y19D-W127A), previously shown to have compromised cytoplasmic localization activity30, was similarly defective in expression, multimerization, packaging, and restriction activities (Supplemental Figures 1 and 2). Taken together these data suggest that multimerization of A3G correlates with the ability to package efficiently into the virus.
Discussion
Here we report the first direct measurement of the self-association of APOBEC proteins in live cells using brightness analysis. The average stoichiometry of these multimers is concentration dependent as illustrated by the monotonic increase in brightness with concentration (Fig. 2a). This result implies that multimerization of A3G is governed by the law of mass action through specific interactions involving the protein itself. The majority of experiments were performed on U2OS cells, because this cell line has a large cytoplasmic compartment well-suited for FFS measurements. Control experiments on HeLa and 293T cells revealed a concentration-dependent A3G-EGFP multimerization that was almost identical to the behavior observed in U2OS cells. These findings argue that A3G-EGFP multimerization is a fairly robust intrinsic property that is cell type independent.
Extension of the brightness characterization to other EGFP-labeled APOBEC proteins revealed that each protein falls into one of two categories. The first category consists of A2, A3A, and A3C, which to a good approximation remained cytoplasmic monomers. The other family members (A3B/D/F/G/H) formed cytoplasmic multimers with increasing protein concentration. EGFP-labeled A3B/D/F/G/H all have residence times approximately ranging from 50 to 120 ms. This is ~50 times longer than the predicted value for the monomeric protein. The slow mobility implies association of these proteins with large complexes, which is consistent with the observation of high molecular weight (HMM) complexes for A3G, A3F and A3H13–18,51,52. Whether the other A3 proteins listed above form similar protein complexes has not been addressed in the literature, but our brightness and mobility data suggest that A3B, A3D, A3F, A3G, and A3H associate with large complexes with a stoichiometry in excess of one.
We observed a reduction in the residence time of A3G at low concentration (c < 200nM, Table 1), which likely reflects a decrease in the population of HMM complexes. A3G has been described to exist in addition to the HMM form as a low molecular weight (LMM) complex13–18. LMM complexes are mainly free of RNA and cover a range from 46 to 100 kDa, which corresponds to monomers and dimers of A3G. Because the brightness, although reduced at low concentration, remained above one, a small population of multimers is likely present. Thus, the brightness and mobility data suggest the existence of A3G-EGFP in both HMM and LMM form at low concentrations.
In contrast to the multimer forming proteins, EGFP-labeled A2, A3A and A3G-CTD all had a residence time around 1–2 ms. Since the mobility is close to the theoretically predicted value for a monomer, transient interactions of these proteins to RNA or other cellular factors have to be weak to preserve the high mobility. Thus, mobility indicates the absence of HMM complexes, while brightness identifies a monomeric protein, which is in agreement with in vitro studies that have shown A2 and A3A to be monomeric in solution43,53.
A3C, unlike A2 and A3A, has been reported to dimerize and associate with HMM complexes54,55. However, brightness analysis identified EGFP-labeled A3C as predominantly monomeric. The average residence time of A3C-EGFP was 8 ms, which was much higher than the predicted residence time of 1 ms for a freely diffusing monomeric protein. While it is difficult to quantify the molecular mass of a complex due to cellular crowding and transient interactions, an eightfold increase in the residence time corresponds according to the Stokes-Einstein relation to a ~500x increase in molecular mass over the monomeric protein. Thus, the mobility data are consistent with the presence of A3C in HMM complexes, even though the size of these complexes is smaller than for A3G (Table 1).
Viral packaging and Vif-deficient HIV restriction activity of A3A26,56–63, A3B26,57,58,61,63–67, A3C26,56–59,61,63,64,66,68,69, A3D63,70–73, A3F58,59,69,74,75, A3G (review76), and A3H52,72,77–79 have been studied extensively. A recent review of the literature76 and additional reports showing both packaging and restriction activities of the entire A3 family80–82 demonstrate that A3B/D/F/G/H package and restrict Vif-deficient HIV, while A3A/C do not. It should be noted that A3C is active against simian immunodeficiency virus64, while many reports show little to no effect of human A3C on HIV56,59,66,69,80–82. The reason for this difference is not known currently.
The same partitioning of A3 proteins into two groups was observed by brightness titration. A3B/D/F/G/H displayed a strong propensity to multimerize, while A3A/C did not. Thus, our data suggest a relation between multimerization of A3 proteins and their ability to efficiently package and restrict. However, since correlation does not imply causation, three A3G mutants were studied to further explore the role of multimerization. The catalytically inactive A3G-E259Q exhibited identical mobility, mutimerization, and packaging efficiency as the wildtype protein. However, the absence of restriction activity demonstrates that catalytic activity is required in addition to efficient packaging38–40. The C97A substitution disrupts the N-terminal zinc-binding domain of A3G and abolishes multimerization in biochemical assays, while preserving catalytic activity10,37. Our brightness experiments confirmed the absence of multimers for A3G-C97A-EGFP. The mutation significantly increased the mobility of the protein compared to wildtype, which suggests that its RNA binding ability is impacted. The residence time was still considerably longer than expected for a purely monomeric protein, which agrees with a report stating that C97A retains some capability to bind to RNA37. Similar results were obtained for A3G-Y19D-W127A, which prior studies have shown to be defective for cytoplasmic localization and RNA binding (see reference30 and references therein). Even though both of these mutants were expressed at lower than wildtype levels in cells, quantification of immunoblot data from multiple independent experiments confirmed a strong packaging defect and reinforced the positive correlation between oligomerization propensity, packaging, and restriction (Supplementary Figure 1).
It is well-known that packaging of A3G involves Gag interacting through its NC domain with RNA-containing A3G multimers20,83. We observed that packaging of A3G-C97A and A3G-Y19D-W127A into viral particles is greatly reduced compared to wildtype, and without efficient packaging no restriction is observed (Fig. 4b and Supplemental Figures 1 and 2). These results suggest that abolishing multimerization of A3G leads to formation of complexes that do not allow for efficient recruitment into the virion. Conversely, the ability of A3B/D/F/G/H to multimerize seems to be connected to forming complexes that are efficiently recruited into the viral particle. However, the mechanistic interplay between RNA-binding, multimerization, formation of complexes, and packaging through Gag interactions cannot be addressed by this study alone and requires further scrutiny.
In contrast to this study, it was previously reported that A3G-C97A packages efficiently into virions10,84. It is conceivable that this incongruence is associated with different expression levels. The C97A substitution does not completely abolish packaging into the virion (Fig. 4b). Thus, we expect that sufficiently high expression levels may compensate for the reduction in packaging efficiency.
The function of A3G multimers is controversial (see introduction). Its multimers are enzymatically inactive and therefore lack antiviral activity10,85. Furthermore, upon treatment with RNAase H, the A3G multimer complex is reduced and its enzymatic activity is recovered. Although there are reports that the multimerization of A3G is important for the directionality of deamination as well as lipid raft association86,87, the function of A3 multimerization is still elusive. Here, we show that multimerization of A3 proteins correlates positively with efficient packaging into virions. Based on this observation, we propose a model that correlates multimerization and packaging into HIV virions. We propose that there is an interface that is important for the multimerization of A3 proteins: A3B/D/F/G/H have the interface, while A3A/A3C and A2 don’t have it. Because A3C binds to RNA, but remains monomeric, protein-protein interactions have to play an important role in addition to protein-RNA binding in the case of A3B/D/F/G/H. Both, protein-protein and protein-RNA interactions have been identified as playing a role in the multimerization of A3G14,88,89. Binding to RNA might provide a conformational change and/or a correct scaffold for additional stability, but RNA binding per se as a monomer would not allow for efficient packaging into HIV virions.
Materials and Methods
APOBEC3 expression constructs
Human A3A, A3B, A3C, A3D, A3F, A3G, A3H hapII, A3G-E259Q were constructed into pEGFP-N3 vector (Clontech) as previously reported (A3A and A3C, A3B, A3D, A3F and A3G90, A3G-NTD and A3G-CTD30, A3B, A3H hapII82, A3G-E259Q91, and A3G-Y19D-W127A30). Human APOBEC2 coding region (NM_006789) was PCR-amplified with forward oligo 5′-NNNGAGCTCACCACCATGGCCCAGAAGGAAGAG -3′ and reverse oligo 5′-NNNCCGCGGACTTCAGGATGTCTGCCAAC-3′ digested with SacI and SacII and ligated into pEGFP-N3 vector digested with the same enzymes. Construction of A3G and A3G-E259Q with carboxy-terminal 3× influenza virus hemagglutinin (HA) tags in pcDNA3.1(+) (Invitrogen) were also described in82. A3G-C97A mutant was made by QuikChange site-directed mutagenesis (Stratagene) using forward oligo 5′-catatcctggagccccgccacaaagtgtacaaggg-3′ and reverse oligo 5′-cccttgtacactttgtggcggggctccaggatatg-3′. Proviral construct of vif-deficient HIV-1IIIB (GenBank accession no. EU54161792) with tandem stop codons at positions 26 and 27 were obtained from Michael Malim (King’s College, London, England).
Cell lines for FFS studies
U2OS, Hela and 293T cells obtained from ATCC (Manassas, VA) were maintained in Dulbecco’s modified Eagle medium (DMEM) containing 10% fetal bovine serum. Cells were plated into eight-well coverglass chambers (Nunc) and transfected. Transfections were carried out using transfectin (Bio-rad, Hercules, CA) according to manufacturer’s instructions. Cells were measured ~24 h posttransfection.
HIV single-cycle infection with replication-proficient virus
Single-cycle infection was performed as described75,93. Briefly, 293T cells were seeded in six-well plates at 250,000 cells/well. The following day, cells were transfected using TransIT transfection reagent (Mirus Bio) with 1 μg of Vif-deficient HIV IIIB, and 0, 25, 50, 100 or 200 ng of A3G-3xHA expression constructs or mutants balanced by the parent empty vector pcDNA3.1-3xHA. Two days post-transfection, virus containing supernatants were used to infect CEM-GFP reporter cells seeded in 96-well plates at 25,000 cells/well. After another 2 days, infected CEM-GFP cells were fixed in 4% paraformaldehyde and submitted for flow cytometry. Infectivity was assessed by determining the percentage of GFP-positive cells. Virus particles from the same supernatants were isolated by ultracentrifugation and submitted for western blot analysis. 293T producer cells were also harvested and lysed for WB analysis. The expression and packaging of A3G or mutants were detected by anti-HA.11 antibody (Covance). Anti-tubulin (Covance) and anti-p24 blotting were used as loading controls in cell lysates and virus particles respectively.
FFS measurements
FFS experiments were carried out on a modified two-photon microscope, as previously described41, using two-photon excitation at a wavelength of 1000 nm. A mode-locked Ti:sapphire laser (Tsunami, Spectra Physics, Mountain View, CA) pumped by an intracavity doubled Nd:YVO4 laser (Spectra Physics) serves as source for two-photon excitation. The experiments were carried out using a Zeiss Axiovert 200 microscope (Thornwood, NY) with a 63X Plan Apochromat oil immersion objective (N.A.=1.4). Power at the sample for all the cell measurements is 0.8–1.2 mW. The eight-well coverglass chamber containing the cells is mounted on an electronic stage (MS-2000 XYZ, ASI, Eugene, OR). After selecting a cell the two-photon excitation is focused into the cytoplasm for FFS. The data acquisition time is ~60 seconds for an individual cell measurement. The fluorescence is sent to avalanche photo diodes (APD) (Model SPCM-AQR-14, Perkin Elmer, Vaudreuil, Canada) for detection. The TTL-output of the APD unit is connected to a data acquisition card (correlator.com), which stores the complete sequence of photon counts using a sampling frequency of 20 kHz. The recorded photon counts were stored and analyzed with programs written for IDL 7.1 (Research Systems, Inc., Boulder, CO).
Data analysis
Experimental data were analyzed with Q-analysis where the brightness λsegment is determined every second94,95. The resulting normalized brightness, b, is calculated by taking the average brightness of λsegment divided by the monomer EGFP brightness λEGFP that was independently measured for calibration at the beginning of the experiments, b = 〈λsegment〉/λEGFP. The concentration of EGFP-labeled proteins is determined by dividing the average fluorescence intensity of the sample both by the EGFP brightness and by the volume of the optical observation volume as described in the literature41. The time over which the autocorrelation function decays to half of its original value is used to define the residence time. Its value is determined by interpolation from the smoothed experimental autocorrelation function.
Supplementary Material
Highlights.
The functional role of APOBEC3 multimers in the cytoplasm is unclear.
We probe the multimerization of APOBEC3 proteins in cells by fluorescence brightness.
APOBEC3A/C are monomeric, while APOBEC3B/D/F/G/H multimerize.
APOBEC3 proteins that multimerize also package efficiently into HIV-1 virions.
Correlation implies that multimerization ability is important for HIV-1 restriction.
Acknowledgments
This research was supported by grants NIH P01 GM091743 to R.S.H and R01 GM064589 and NSF PHY-0346782 to J.D.M.
Abbreviations used
- A2
APOBEC2
- A3
APOBEC3
- A3A
APOBEC3A
- A3B
APOBEC3B
- A3C
APOBEC3C
- A3D
APOBEC3D
- A3F
APOBEC3F
- A3G
APOBEC3G
- A3H
APOBEC3H (HapII)
- FFS
Fluorescence fluctuation spectroscopy
- FCS
Fluorescence correlation spectroscopy
- NTD
N-terminal domain
- CTD
C-terminal domain
Footnotes
Publisher's Disclaimer: This is a PDF file of an unedited manuscript that has been accepted for publication. As a service to our customers we are providing this early version of the manuscript. The manuscript will undergo copyediting, typesetting, and review of the resulting proof before it is published in its final citable form. Please note that during the production process errors may be discovered which could affect the content, and all legal disclaimers that apply to the journal pertain.
References
- 1.Conticello SG. The AID/APOBEC family of nucleic acid mutators. Genome Biol. 2008;9:229. doi: 10.1186/gb-2008-9-6-229. [DOI] [PMC free article] [PubMed] [Google Scholar]
- 2.Sheehy AM, Gaddis NC, Choi JD, Malim MH. Isolation of a human gene that inhibits HIV-1 infection and is suppressed by the viral Vif protein. Nature. 2002;418:646–650. doi: 10.1038/nature00939. [DOI] [PubMed] [Google Scholar]
- 3.Harris RS, Hultquist JF, Evans DT. The restriction factors of human immunodeficiency virus. J Biol Chem. 2012;287:40875–40883. doi: 10.1074/jbc.R112.416925. [DOI] [PMC free article] [PubMed] [Google Scholar]
- 4.Zheng YH, Jeang KT, Tokunaga K. Host restriction factors in retroviral infection: promises in virus-host interaction. Retrovirology. 2012;9:112. doi: 10.1186/1742-4690-9-112. [DOI] [PMC free article] [PubMed] [Google Scholar]
- 5.Malim MH, Bieniasz PD. HIV Restriction Factors and Mechanisms of Evasion. Cold Spring Harb Perspect Med. 2012;2:a006940. doi: 10.1101/cshperspect.a006940. [DOI] [PMC free article] [PubMed] [Google Scholar]
- 6.Goila-Gaur R, Khan MA, Miyagi E, Kao S, Strebel K. Targeting APOBEC3A to the viral nucleoprotein complex confers antiviral activity. Retrovirology. 2007;4:61. doi: 10.1186/1742-4690-4-61. [DOI] [PMC free article] [PubMed] [Google Scholar]
- 7.Aguiar RS, Lovsin N, Tanuri A, Peterlin BM. Vpr.A3A chimera inhibits HIV replication. J Biol Chem. 2008;283:2518–2525. doi: 10.1074/jbc.M706436200. [DOI] [PubMed] [Google Scholar]
- 8.Huthoff H, Autore F, Gallois-Montbrun S, Fraternali F, Malim MH. RNA-dependent oligomerization of APOBEC3G is required for restriction of HIV-1. PLoS Pathog. 2009;5:e1000330. doi: 10.1371/journal.ppat.1000330. [DOI] [PMC free article] [PubMed] [Google Scholar]
- 9.Shindo K, Takaori-Kondo A, Kobayashi M, Abudu A, Fukunaga K, Uchiyama T. The enzymatic activity of CEM15/Apobec-3G is essential for the regulation of the infectivity of HIV-1 virion but not a sole determinant of its antiviral activity. J Biol Chem. 2003;278:44412–44416. doi: 10.1074/jbc.C300376200. [DOI] [PubMed] [Google Scholar]
- 10.Opi S, Takeuchi H, Kao S, Khan MA, Miyagi E, Goila-Gaur R, Iwatani Y, Levin JG, Strebel K. Monomeric APOBEC3G is catalytically active and has antiviral activity. J Virol. 2006;80:4673–4682. doi: 10.1128/JVI.80.10.4673-4682.2006. [DOI] [PMC free article] [PubMed] [Google Scholar]
- 11.Jaguva Vasudevan AA, Perkovic M, Bulliard Y, Cichutek K, Trono D, Häussinger D, Münk C. Prototype Foamy Virus Bet Impairs the Dimerization and Cytosolic Solubility of Human APOBEC3G. J Virol. 2013 doi: 10.1128/JVI.03385-12. [DOI] [PMC free article] [PubMed] [Google Scholar]
- 12.Friew YN, Boyko V, Hu WS, Pathak VK. Intracellular interactions between APOBEC3G, RNA, and HIV-1 Gag: APOBEC3G multimerization is dependent on its association with RNA. Retrovirology. 2009;6:56. doi: 10.1186/1742-4690-6-56. [DOI] [PMC free article] [PubMed] [Google Scholar]
- 13.Chiu YL, Witkowska HE, Hall SC, Santiago M, Soros VB, Esnault C, Heidmann T, Greene WC. High-molecular-mass APOBEC3G complexes restrict Alu retrotransposition. Proc Natl Acad Sci USA. 2006;103:15588–15593. doi: 10.1073/pnas.0604524103. [DOI] [PMC free article] [PubMed] [Google Scholar]
- 14.Wedekind JE, Gillilan R, Janda A, Krucinska J, Salter JD, Bennett RP, Raina J, Smith HC. Nanostructures of APOBEC3G support a hierarchical assembly model of high molecular mass ribonucleoprotein particles from dimeric subunits. J Biol Chem. 2006;281:38122–38126. doi: 10.1074/jbc.C600253200. [DOI] [PMC free article] [PubMed] [Google Scholar]
- 15.Stopak KS, Chiu YL, Kropp J, Grant RM, Greene WC. Distinct patterns of cytokine regulation of APOBEC3G expression and activity in primary lymphocytes, macrophages, and dendritic cells. J Biol Chem. 2007;282:3539–3546. doi: 10.1074/jbc.M610138200. [DOI] [PubMed] [Google Scholar]
- 16.Niewiadomska AM, Tian C, Tan L, Wang T, Sarkis PTN, Yu XF. Differential inhibition of long interspersed element 1 by APOBEC3 does not correlate with high-molecular-mass-complex formation or P-body association. J Virol. 2007;81:9577–9583. doi: 10.1128/JVI.02800-06. [DOI] [PMC free article] [PubMed] [Google Scholar]
- 17.Chiu YL. Biochemical fractionation and purification of high-molecular-mass APOBEC3G complexes. Methods Mol Biol. 2011;718:185–206. doi: 10.1007/978-1-61779-018-8_12. [DOI] [PubMed] [Google Scholar]
- 18.Goila-Gaur R, Khan MA, Miyagi E, Kao S, Opi S, Takeuchi H, Strebel K. HIV-1 Vif promotes the formation of high molecular mass APOBEC3G complexes. Virology. 2008;372:136–146. doi: 10.1016/j.virol.2007.10.017. [DOI] [PMC free article] [PubMed] [Google Scholar]
- 19.Shlyakhtenko LS, Lushnikov AY, Li M, Lackey L, Harris RS, Lyubchenko YL. Atomic force microscopy studies provide direct evidence for dimerization of the HIV restriction factor APOBEC3G. J Biol Chem. 2011;286:3387–3395. doi: 10.1074/jbc.M110.195685. [DOI] [PMC free article] [PubMed] [Google Scholar]
- 20.Burnett A, Spearman P. APOBEC3G multimers are recruited to the plasma membrane for packaging into human immunodeficiency virus type 1 virus-like particles in an RNA-dependent process requiring the NC basic linker. J Virol. 2007;81:5000–5013. doi: 10.1128/JVI.02237-06. [DOI] [PMC free article] [PubMed] [Google Scholar]
- 21.McDougall WM, Okany C, Smith HC. Deaminase activity on single-stranded DNA (ssDNA) occurs in vitro when APOBEC3G cytidine deaminase forms homotetramers and higher-order complexes. J Biol Chem. 2011;286:30655–30661. doi: 10.1074/jbc.M111.269506. [DOI] [PMC free article] [PubMed] [Google Scholar]
- 22.McDougall WM, Smith HC. Direct evidence that RNA inhibits APOBEC3G ssDNA cytidine deaminase activity. Biochem Biophys Res Commun. 2011;412:612–617. doi: 10.1016/j.bbrc.2011.08.009. [DOI] [PMC free article] [PubMed] [Google Scholar]
- 23.Shandilya SMD, Nalam MNL, Nalivaika EA, Gross PJ, Valesano JC, Shindo K, Li M, Munson M, Royer WE, Harjes E, Kono T, Matsuo H, Harris RS, Somasundaran M, Schiffer CA. Crystal structure of the APOBEC3G catalytic domain reveals potential oligomerization interfaces. Structure. 2010;18:28–38. doi: 10.1016/j.str.2009.10.016. [DOI] [PMC free article] [PubMed] [Google Scholar]
- 24.Wichroski MJ, Robb GB, Rana TM. Human retroviral host restriction factors APOBEC3G and APOBEC3F localize to mRNA processing bodies. PLoS Pathog. 2006;2:e41. doi: 10.1371/journal.ppat.0020041. [DOI] [PMC free article] [PubMed] [Google Scholar]
- 25.Gallois-Montbrun S, Kramer B, Swanson CM, Byers H, Lynham S, Ward M, Malim MH. Antiviral protein APOBEC3G localizes to ribonucleoprotein complexes found in P bodies and stress granules. J Virol. 2007;81:2165–2178. doi: 10.1128/JVI.02287-06. [DOI] [PMC free article] [PubMed] [Google Scholar]
- 26.Marin M, Golem S, Rose KM, Kozak SL, Kabat D. Human immunodeficiency virus type 1 Vif functionally interacts with diverse APOBEC3 cytidine deaminases and moves with them between cytoplasmic sites of mRNA metabolism. J Virol. 2008;82:987–998. doi: 10.1128/JVI.01078-07. [DOI] [PMC free article] [PubMed] [Google Scholar]
- 27.Wang T, Tian C, Zhang W, Sarkis PTN, Yu XF. Interaction with 7SL RNA but not with HIV-1 genomic RNA or P bodies is required for APOBEC3F virion packaging. J Mol Biol. 2008;375:1098–1112. doi: 10.1016/j.jmb.2007.11.017. [DOI] [PubMed] [Google Scholar]
- 28.Burdick R, Smith JL, Chaipan C, Friew Y, Chen J, Venkatachari NJ, Delviks-Frankenberry KA, Hu WS, Pathak VK. P body-associated protein Mov10 inhibits HIV-1 replication at multiple stages. J Virol. 2010;84:10241–10253. doi: 10.1128/JVI.00585-10. [DOI] [PMC free article] [PubMed] [Google Scholar]
- 29.Phalora PK, Sherer NM, Wolinsky SM, Swanson CM, Malim MH. HIV-1 replication and APOBEC3 antiviral activity are not regulated by P bodies. J Virol. 2012;86:11712–11724. doi: 10.1128/JVI.00595-12. [DOI] [PMC free article] [PubMed] [Google Scholar]
- 30.Stenglein MD, Matsuo H, Harris RS. Two regions within the amino-terminal half of APOBEC3G cooperate to determine cytoplasmic localization. J Virol. 2008;82:9591–9599. doi: 10.1128/JVI.02471-07. [DOI] [PMC free article] [PubMed] [Google Scholar]
- 31.Chen Y, Johnson J, Macdonald P, Wu B, Mueller JD. Observing protein interactions and their stoichiometry in living cells by brightness analysis of fluorescence fluctuation experiments. Meth Enzymol. 2010;472:345–363. doi: 10.1016/S0076-6879(10)72026-7. [DOI] [PubMed] [Google Scholar]
- 32.Elson EL, Magde D. Fluorescence correlation spectroscopy. I Conceptual basis and theory. Biopolymers. 1974;13:1–27. doi: 10.1002/bip.1974.360130103. [DOI] [PubMed] [Google Scholar]
- 33.Thompson NL. Topics in Fluorescence Spectroscopy Techniques. Vol. 1 Plenum; New York: 1991. [Google Scholar]
- 34.Elson EL. 40 years of FCS: how it all began. Meth Enzymol. 2013;518:1–10. doi: 10.1016/B978-0-12-388422-0.00001-7. [DOI] [PubMed] [Google Scholar]
- 35.Ries J, Schwille P. Fluorescence correlation spectroscopy. Bioessays. 2012;34:361–368. doi: 10.1002/bies.201100111. [DOI] [PubMed] [Google Scholar]
- 36.Macdonald P, Johnson J, Smith E, Chen Y, Mueller JD. Brightness analysis. Meth Enzymol. 2013;518:71–98. doi: 10.1016/B978-0-12-388422-0.00004-2. [DOI] [PubMed] [Google Scholar]
- 37.Opi S, Kao S, Goila-Gaur R, Khan MA, Miyagi E, Takeuchi H, Strebel K. Human immunodeficiency virus type 1 Vif inhibits packaging and antiviral activity of a degradation-resistant APOBEC3G variant. J Virol. 2007;81:8236–8246. doi: 10.1128/JVI.02694-06. [DOI] [PMC free article] [PubMed] [Google Scholar]
- 38.Schumacher AJ, Haché G, Macduff DA, Brown WL, Harris RS. The DNA deaminase activity of human APOBEC3G is required for Ty1, MusD, and human immunodeficiency virus type 1 restriction. J Virol. 2008;82:2652–2660. doi: 10.1128/JVI.02391-07. [DOI] [PMC free article] [PubMed] [Google Scholar]
- 39.Browne EP, Allers C, Landau NR. Restriction of HIV-1 by APOBEC3G is cytidine deaminase-dependent. Virology. 2009;387:313–321. doi: 10.1016/j.virol.2009.02.026. [DOI] [PMC free article] [PubMed] [Google Scholar]
- 40.Miyagi E, Opi S, Takeuchi H, Khan M, Goila-Gaur R, Kao S, Strebel K. Enzymatically active APOBEC3G is required for efficient inhibition of human immunodeficiency virus type 1. J Virol. 2007;81:13346–13353. doi: 10.1128/JVI.01361-07. [DOI] [PMC free article] [PubMed] [Google Scholar]
- 41.Chen Y, Wei LN, Müller JD. Probing protein oligomerization in living cells with fluorescence fluctuation spectroscopy. Proc Natl Acad Sci USA. 2003;100:15492–15497. doi: 10.1073/pnas.2533045100. [DOI] [PMC free article] [PubMed] [Google Scholar]
- 42.Chen Y, Müller JD. Determining the stoichiometry of protein heterocomplexes in living cells with fluorescence fluctuation spectroscopy. Proc Natl Acad Sci USA. 2007;104:3147–3152. doi: 10.1073/pnas.0606557104. [DOI] [PMC free article] [PubMed] [Google Scholar]
- 43.Chen KM, Harjes E, Gross PJ, Fahmy A, Lu Y, Shindo K, Harris RS, Matsuo H. Structure of the DNA deaminase domain of the HIV-1 restriction factor APOBEC3G. Nature. 2008;452:116–119. doi: 10.1038/nature06638. [DOI] [PubMed] [Google Scholar]
- 44.Harjes E, Gross PJ, Chen KM, Lu Y, Shindo K, Nowarski R, Gross JD, Kotler M, Harris RS, Matsuo H. An extended structure of the APOBEC3G catalytic domain suggests a unique holoenzyme model. J Mol Biol. 2009;389:819–832. doi: 10.1016/j.jmb.2009.04.031. [DOI] [PMC free article] [PubMed] [Google Scholar]
- 45.Holden LG, Prochnow C, Chang YP, Bransteitter R, Chelico L, Sen U, Stevens RC, Goodman MF, Chen XS. Crystal structure of the antiviral APOBEC3G catalytic domain and functional implications. Nature. 2008;456:121–124. doi: 10.1038/nature07357. [DOI] [PMC free article] [PubMed] [Google Scholar]
- 46.Krzysiak TC, Jung J, Thompson J, Baker D, Gronenborn AM. APOBEC2 is a monomer in solution: implications for APOBEC3G models. Biochemistry. 2012;51:2008–2017. doi: 10.1021/bi300021s. [DOI] [PMC free article] [PubMed] [Google Scholar]
- 47.Land AM, Law EK, Carpenter MA, Lackey L, Brown WL, Harris RS. Endogenous APOBEC3A DNA Cytosine Deaminase Is Cytoplasmic and Nongenotoxic. J Biol Chem. 2013;288:17253–17260. doi: 10.1074/jbc.M113.458661. [DOI] [PMC free article] [PubMed] [Google Scholar]
- 48.Aynaud MM, Suspène R, Vidalain PO, Mussil B, Guétard D, Tangy F, Wain-Hobson S, Vartanian JP. Human Tribbles 3 protects nuclear DNA from cytidine deamination by APOBEC3A. J Biol Chem. 2012;287:39182–39192. doi: 10.1074/jbc.M112.372722. [DOI] [PMC free article] [PubMed] [Google Scholar]
- 49.Chelico L, Pham P, Calabrese P, Goodman MF. APOBEC3G DNA deaminase acts processively 3′ --> 5′ on single-stranded DNA. Nat Struct Mol Biol. 2006;13:392–399. doi: 10.1038/nsmb1086. [DOI] [PubMed] [Google Scholar]
- 50.Bélanger K, Savoie M, Rosales Gerpe MC, Couture J-F, Langlois M-A. Binding of RNA by APOBEC3G controls deamination-independent restriction of retroviruses. Nucleic Acids Res. 2013 doi: 10.1093/nar/gkt527. [DOI] [PMC free article] [PubMed] [Google Scholar]
- 51.Wang X, Dolan PT, Dang Y, Zheng YH. Biochemical differentiation of APOBEC3F and APOBEC3G proteins associated with HIV-1 life cycle. J Biol Chem. 2007;282:1585–1594. doi: 10.1074/jbc.M610150200. [DOI] [PMC free article] [PubMed] [Google Scholar]
- 52.Tan L, Sarkis PTN, Wang T, Tian C, Yu XF. Sole copy of Z2-type human cytidine deaminase APOBEC3H has inhibitory activity against retrotransposons and HIV-1. FASEB J. 2009;23:279–287. doi: 10.1096/fj.07-088781. [DOI] [PMC free article] [PubMed] [Google Scholar]
- 53.Byeon IJL, Ahn J, Mitra M, Byeon CH, Hercík K, Hritz J, Charlton LM, Levin JG, Gronenborn AM. NMR structure of human restriction factor APOBEC3A reveals substrate binding and enzyme specificity. Nat Commun. 2013;4:1890. doi: 10.1038/ncomms2883. [DOI] [PMC free article] [PubMed] [Google Scholar]
- 54.Perkovic M, Schmidt S, Marino D, Russell RA, Stauch B, Hofmann H, Kopietz F, Kloke BP, Zielonka J, Ströver H, Hermle J, Lindemann D, Pathak VK, Schneider G, Löchelt M, Cichutek K, Münk C. Species-specific inhibition of APOBEC3C by the prototype foamy virus protein bet. J Biol Chem. 2009;284:5819–5826. doi: 10.1074/jbc.M808853200. [DOI] [PMC free article] [PubMed] [Google Scholar]
- 55.Stauch B, Hofmann H, Perkovic M, Weisel M, Kopietz F, Cichutek K, Münk C, Schneider G. Model structure of APOBEC3C reveals a binding pocket modulating ribonucleic acid interaction required for encapsidation. Proc Natl Acad Sci USA. 2009;106:12079–12084. doi: 10.1073/pnas.0900979106. [DOI] [PMC free article] [PubMed] [Google Scholar]
- 56.Rose KM, Marin M, Kozak SL, Kabat D. Regulated production and anti-HIV type 1 activities of cytidine deaminases APOBEC3B, 3F, and 3G. AIDS Res Hum Retroviruses. 2005;21:611–619. doi: 10.1089/aid.2005.21.611. [DOI] [PubMed] [Google Scholar]
- 57.Bogerd HP, Wiegand HL, Hulme AE, Garcia-Perez JL, O’Shea KS, Moran JV, Cullen BR. Cellular inhibitors of long interspersed element 1 and Alu retrotransposition. Proc Natl Acad Sci USA. 2006;103:8780–8785. doi: 10.1073/pnas.0603313103. [DOI] [PMC free article] [PubMed] [Google Scholar]
- 58.Bishop KN, Holmes RK, Sheehy AM, Davidson NO, Cho SJ, Malim MH. Cytidine deamination of retroviral DNA by diverse APOBEC proteins. Curr Biol. 2004;14:1392–1396. doi: 10.1016/j.cub.2004.06.057. [DOI] [PubMed] [Google Scholar]
- 59.Wiegand HL, Doehle BP, Bogerd HP, Cullen BR. A second human antiretroviral factor, APOBEC3F, is suppressed by the HIV-1 and HIV-2 Vif proteins. EMBO J. 2004;23:2451–2458. doi: 10.1038/sj.emboj.7600246. [DOI] [PMC free article] [PubMed] [Google Scholar]
- 60.Bogerd HP, Tallmadge RL, Oaks JL, Carpenter S, Cullen BR. Equine infectious anemia virus resists the antiretroviral activity of equine APOBEC3 proteins through a packaging-independent mechanism. J Virol. 2008;82:11889–11901. doi: 10.1128/JVI.01537-08. [DOI] [PMC free article] [PubMed] [Google Scholar]
- 61.Bogerd HP, Wiegand HL, Doehle BP, Lueders KK, Cullen BR. APOBEC3A and APOBEC3B are potent inhibitors of LTR-retrotransposon function in human cells. Nucleic Acids Res. 2006;34:89–95. doi: 10.1093/nar/gkj416. [DOI] [PMC free article] [PubMed] [Google Scholar]
- 62.Chen H, Lilley CE, Yu Q, Lee DV, Chou J, Narvaiza I, Landau NR, Weitzman MD. APOBEC3A is a potent inhibitor of adeno-associated virus and retrotransposons. Curr Biol. 2006;16:480–485. doi: 10.1016/j.cub.2006.01.031. [DOI] [PubMed] [Google Scholar]
- 63.Kinomoto M, Kanno T, Shimura M, Ishizaka Y, Kojima A, Kurata T, Sata T, Tokunaga K. All APOBEC3 family proteins differentially inhibit LINE-1 retrotransposition. Nucleic Acids Res. 2007;35:2955–2964. doi: 10.1093/nar/gkm181. [DOI] [PMC free article] [PubMed] [Google Scholar]
- 64.Yu Q, Chen D, König R, Mariani R, Unutmaz D, Landau NR. APOBEC3B and APOBEC3C are potent inhibitors of simian immunodeficiency virus replication. J Biol Chem. 2004;279:53379–53386. doi: 10.1074/jbc.M408802200. [DOI] [PubMed] [Google Scholar]
- 65.Bogerd HP, Wiegand HL, Doehle BP, Cullen BR. The intrinsic antiretroviral factor APOBEC3B contains two enzymatically active cytidine deaminase domains. Virology. 2007;364:486–493. doi: 10.1016/j.virol.2007.03.019. [DOI] [PMC free article] [PubMed] [Google Scholar]
- 66.Doehle BP, Schäfer A, Cullen BR. Human APOBEC3B is a potent inhibitor of HIV-1 infectivity and is resistant to HIV-1 Vif. Virology. 2005;339:281–288. doi: 10.1016/j.virol.2005.06.005. [DOI] [PubMed] [Google Scholar]
- 67.Hakata Y, Landau NR. Reversed functional organization of mouse and human APOBEC3 cytidine deaminase domains. J Biol Chem. 2006;281:36624–36631. doi: 10.1074/jbc.M604980200. [DOI] [PubMed] [Google Scholar]
- 68.Langlois MA, Beale RCL, Conticello SG, Neuberger MS. Mutational comparison of the single-domained APOBEC3C and double-domained APOBEC3F/G anti-retroviral cytidine deaminases provides insight into their DNA target site specificities. Nucleic Acids Res. 2005;33:1913–1923. doi: 10.1093/nar/gki343. [DOI] [PMC free article] [PubMed] [Google Scholar]
- 69.Zheng YH, Irwin D, Kurosu T, Tokunaga K, Sata T, Peterlin BM. Human APOBEC3F is another host factor that blocks human immunodeficiency virus type 1 replication. J Virol. 2004;78:6073–6076. doi: 10.1128/JVI.78.11.6073-6076.2004. [DOI] [PMC free article] [PubMed] [Google Scholar]
- 70.Zhang J, Fan J, Tian Q, Song Z, Zhang J, Chen Y. Characterization of two distinct modes of endophilin in clathrin-mediated endocytosis. Cell Signal. 2012;24:2043–2050. doi: 10.1016/j.cellsig.2012.06.006. [DOI] [PubMed] [Google Scholar]
- 71.Chen G, He Z, Wang T, Xu R, Yu X-F. A patch of positively charged amino acids surrounding the human immunodeficiency virus type 1 Vif SLVx4Yx9Y motif influences its interaction with APOBEC3G. J Virol. 2009;83:8674–8682. doi: 10.1128/JVI.00653-09. [DOI] [PMC free article] [PubMed] [Google Scholar]
- 72.Dang Y, Siew LM, Wang X, Han Y, Lampen R, Zheng YH. Human cytidine deaminase APOBEC3H restricts HIV-1 replication. J Biol Chem. 2008;283:11606–11614. doi: 10.1074/jbc.M707586200. [DOI] [PMC free article] [PubMed] [Google Scholar]
- 73.Dang Y, Wang X, Esselman WJ, Zheng YH. Identification of APOBEC3DE as another antiretroviral factor from the human APOBEC family. J Virol. 2006;80:10522–10533. doi: 10.1128/JVI.01123-06. [DOI] [PMC free article] [PubMed] [Google Scholar]
- 74.Liddament MT, Brown WL, Schumacher AJ, Harris RS. APOBEC3F properties and hypermutation preferences indicate activity against HIV-1 in vivo. Curr Biol. 2004;14:1385–1391. doi: 10.1016/j.cub.2004.06.050. [DOI] [PubMed] [Google Scholar]
- 75.Albin JS, Haché G, Hultquist JF, Brown WL, Harris RS. Long-term restriction by APOBEC3F selects human immunodeficiency virus type 1 variants with restored Vif function. J Virol. 2010;84:10209–10219. doi: 10.1128/JVI.00632-10. [DOI] [PMC free article] [PubMed] [Google Scholar]
- 76.Albin JS, Harris RS. Interactions of host APOBEC3 restriction factors with HIV-1 in vivo: implications for therapeutics. Expert Rev Mol Med. 2010;12:e4. doi: 10.1017/S1462399409001343. [DOI] [PMC free article] [PubMed] [Google Scholar]
- 77.OhAinle M, Kerns JA, Li MMH, Malik HS, Emerman M. Antiretroelement activity of APOBEC3H was lost twice in recent human evolution. Cell Host Microbe. 2008;4:249–259. doi: 10.1016/j.chom.2008.07.005. [DOI] [PMC free article] [PubMed] [Google Scholar]
- 78.Harari A, Ooms M, Mulder LCF, Simon V. Polymorphisms and splice variants influence the antiretroviral activity of human APOBEC3H. J Virol. 2009;83:295–303. doi: 10.1128/JVI.01665-08. [DOI] [PMC free article] [PubMed] [Google Scholar]
- 79.Li MMH, Wu LI, Emerman M. The range of human APOBEC3H sensitivity to lentiviral Vif proteins. J Virol. 2010;84:88–95. doi: 10.1128/JVI.01344-09. [DOI] [PMC free article] [PubMed] [Google Scholar]
- 80.Refsland EW, Hultquist JF, Harris RS. Endogenous origins of HIV-1 G-to-A hypermutation and restriction in the nonpermissive T cell line CEM2n. PLoS Pathog. 2012;8:e1002800. doi: 10.1371/journal.ppat.1002800. [DOI] [PMC free article] [PubMed] [Google Scholar]
- 81.Hultquist JF, Binka M, LaRue RS, Simon V, Harris RS. Vif proteins of human and simian immunodeficiency viruses require cellular CBFβ to degrade APOBEC3 restriction factors. J Virol. 2012;86:2874–2877. doi: 10.1128/JVI.06950-11. [DOI] [PMC free article] [PubMed] [Google Scholar]
- 82.Hultquist JF, Lengyel JA, Refsland EW, LaRue RS, Lackey L, Brown WL, Harris RS. Human and rhesus APOBEC3D, APOBEC3F, APOBEC3G, and APOBEC3H demonstrate a conserved capacity to restrict Vif-deficient HIV-1. J Virol. 2011;85:11220–11234. doi: 10.1128/JVI.05238-11. [DOI] [PMC free article] [PubMed] [Google Scholar]
- 83.Alce TM, Popik W. APOBEC3G is incorporated into virus-like particles by a direct interaction with HIV-1 Gag nucleocapsid protein. J Biol Chem. 2004;279:34083–34086. doi: 10.1074/jbc.C400235200. [DOI] [PubMed] [Google Scholar]
- 84.Martin KL, Johnson M, D’Aquila RT. APOBEC3G complexes decrease human immunodeficiency virus type 1 production. J Virol. 2011;85:9314–9326. doi: 10.1128/JVI.00273-11. [DOI] [PMC free article] [PubMed] [Google Scholar]
- 85.Soros VB, Yonemoto W, Greene WC. Newly synthesized APOBEC3G is incorporated into HIV virions, inhibited by HIV RNA, and subsequently activated by RNase H. PLoS Pathog. 2007;3:e15. doi: 10.1371/journal.ppat.0030015. [DOI] [PMC free article] [PubMed] [Google Scholar]
- 86.Chelico L, Sacho EJ, Erie DA, Goodman MF. A model for oligomeric regulation of APOBEC3G cytosine deaminase-dependent restriction of HIV. J Biol Chem. 2008;283:13780–13791. doi: 10.1074/jbc.M801004200. [DOI] [PMC free article] [PubMed] [Google Scholar]
- 87.Khan MA, Goila-Gaur R, Kao S, Miyagi E, Walker RC, Strebel K. Encapsidation of APOBEC3G into HIV-1 virions involves lipid raft association and does not correlate with APOBEC3G oligomerization. Retrovirology. 2009;6:99. doi: 10.1186/1742-4690-6-99. [DOI] [PMC free article] [PubMed] [Google Scholar]
- 88.Salter JD, Krucinska J, Raina J, Smith HC, Wedekind JE. A hydrodynamic analysis of APOBEC3G reveals a monomer-dimer-tetramer self-association that has implications for anti-HIV function. Biochemistry. 2009;48:10685–10687. doi: 10.1021/bi901642c. [DOI] [PMC free article] [PubMed] [Google Scholar]
- 89.Iwatani Y, Takeuchi H, Strebel K, Levin JG. Biochemical activities of highly purified, catalytically active human APOBEC3G: correlation with antiviral effect. J Virol. 2006;80:5992–6002. doi: 10.1128/JVI.02680-05. [DOI] [PMC free article] [PubMed] [Google Scholar]
- 90.Stenglein MD, Harris RS. APOBEC3B and APOBEC3F inhibit L1 retrotransposition by a DNA deamination-independent mechanism. J Biol Chem. 2006;281:16837–16841. doi: 10.1074/jbc.M602367200. [DOI] [PubMed] [Google Scholar]
- 91.Demorest ZL, Li M, Harris RS. Phosphorylation directly regulates the intrinsic DNA cytidine deaminase activity of activation-induced deaminase and APOBEC3G protein. J Biol Chem. 2011;286:26568–26575. doi: 10.1074/jbc.M111.235721. [DOI] [PMC free article] [PubMed] [Google Scholar]
- 92.Haché G, Shindo K, Albin JS, Harris RS. Evolution of HIV-1 isolates that use a novel Vif-independent mechanism to resist restriction by human APOBEC3G. Curr Biol. 2008;18:819–824. doi: 10.1016/j.cub.2008.04.073. [DOI] [PMC free article] [PubMed] [Google Scholar]
- 93.Bohn MF, Shandilya SMD, Albin JS, Kouno T, Anderson BD, McDougle RM, Carpenter MA, Rathore A, Evans L, Davis AN, Zhang J, Lu Y, Somasundaran M, Matsuo H, Harris RS, Schiffer CA. Crystal Structure of the DNA Cytosine Deaminase APOBEC3F: The Catalytically Active and HIV-1 Vif-Binding Domain. Structure. 2013;21:1042–1050. doi: 10.1016/j.str.2013.04.010. [DOI] [PMC free article] [PubMed] [Google Scholar]
- 94.Chen Y, Müller JD, Ruan Q, Gratton E. Molecular brightness characterization of EGFP in vivo by fluorescence fluctuation spectroscopy. Biophys J. 2002;82:133–144. doi: 10.1016/S0006-3495(02)75380-0. [DOI] [PMC free article] [PubMed] [Google Scholar]
- 95.Sanchez-Andres A, Chen Y, Müller JD. Molecular brightness determined from a generalized form of Mandel’s Q-parameter. Biophys J. 2005;89:3531–3547. doi: 10.1529/biophysj.105.067082. [DOI] [PMC free article] [PubMed] [Google Scholar]
Associated Data
This section collects any data citations, data availability statements, or supplementary materials included in this article.